Assume Normal Costs: An Update
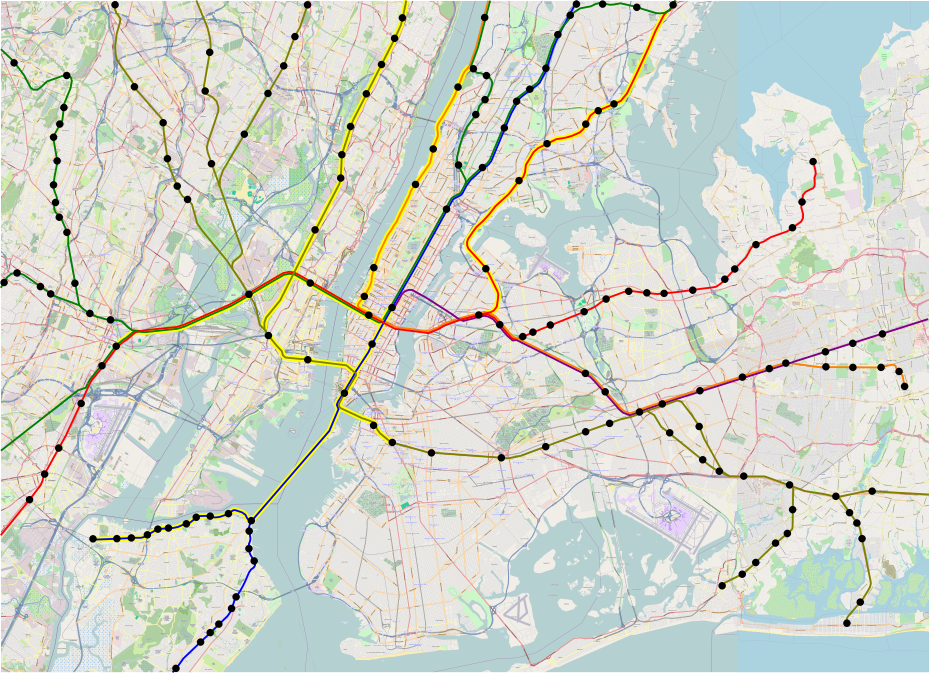
The maps below detail what New York could build if its construction costs were normal, rather than the highest in the world for reasons that the city and state could choose to change. I’ve been working on this for a while – we considered including these maps in our final report before removing them from scope to save time.
Higher-resolution images can be found here and here; they’re 53 MB each.
Didn’t you do this before?
Yes. I wrote a post to a similar effect four years ago. The maps here are updated to include slightly different lines – I think the new one reflects city transportation needs better – and to add light rail and not just subway and commuter rail tunnels. But more importantly, the new maps have much higher costs, reflecting a few years’ worth of inflation (this is 2022 dollars) and some large real cost increases in Scandinavia.
What’s included in the maps?
The maps include the following items:
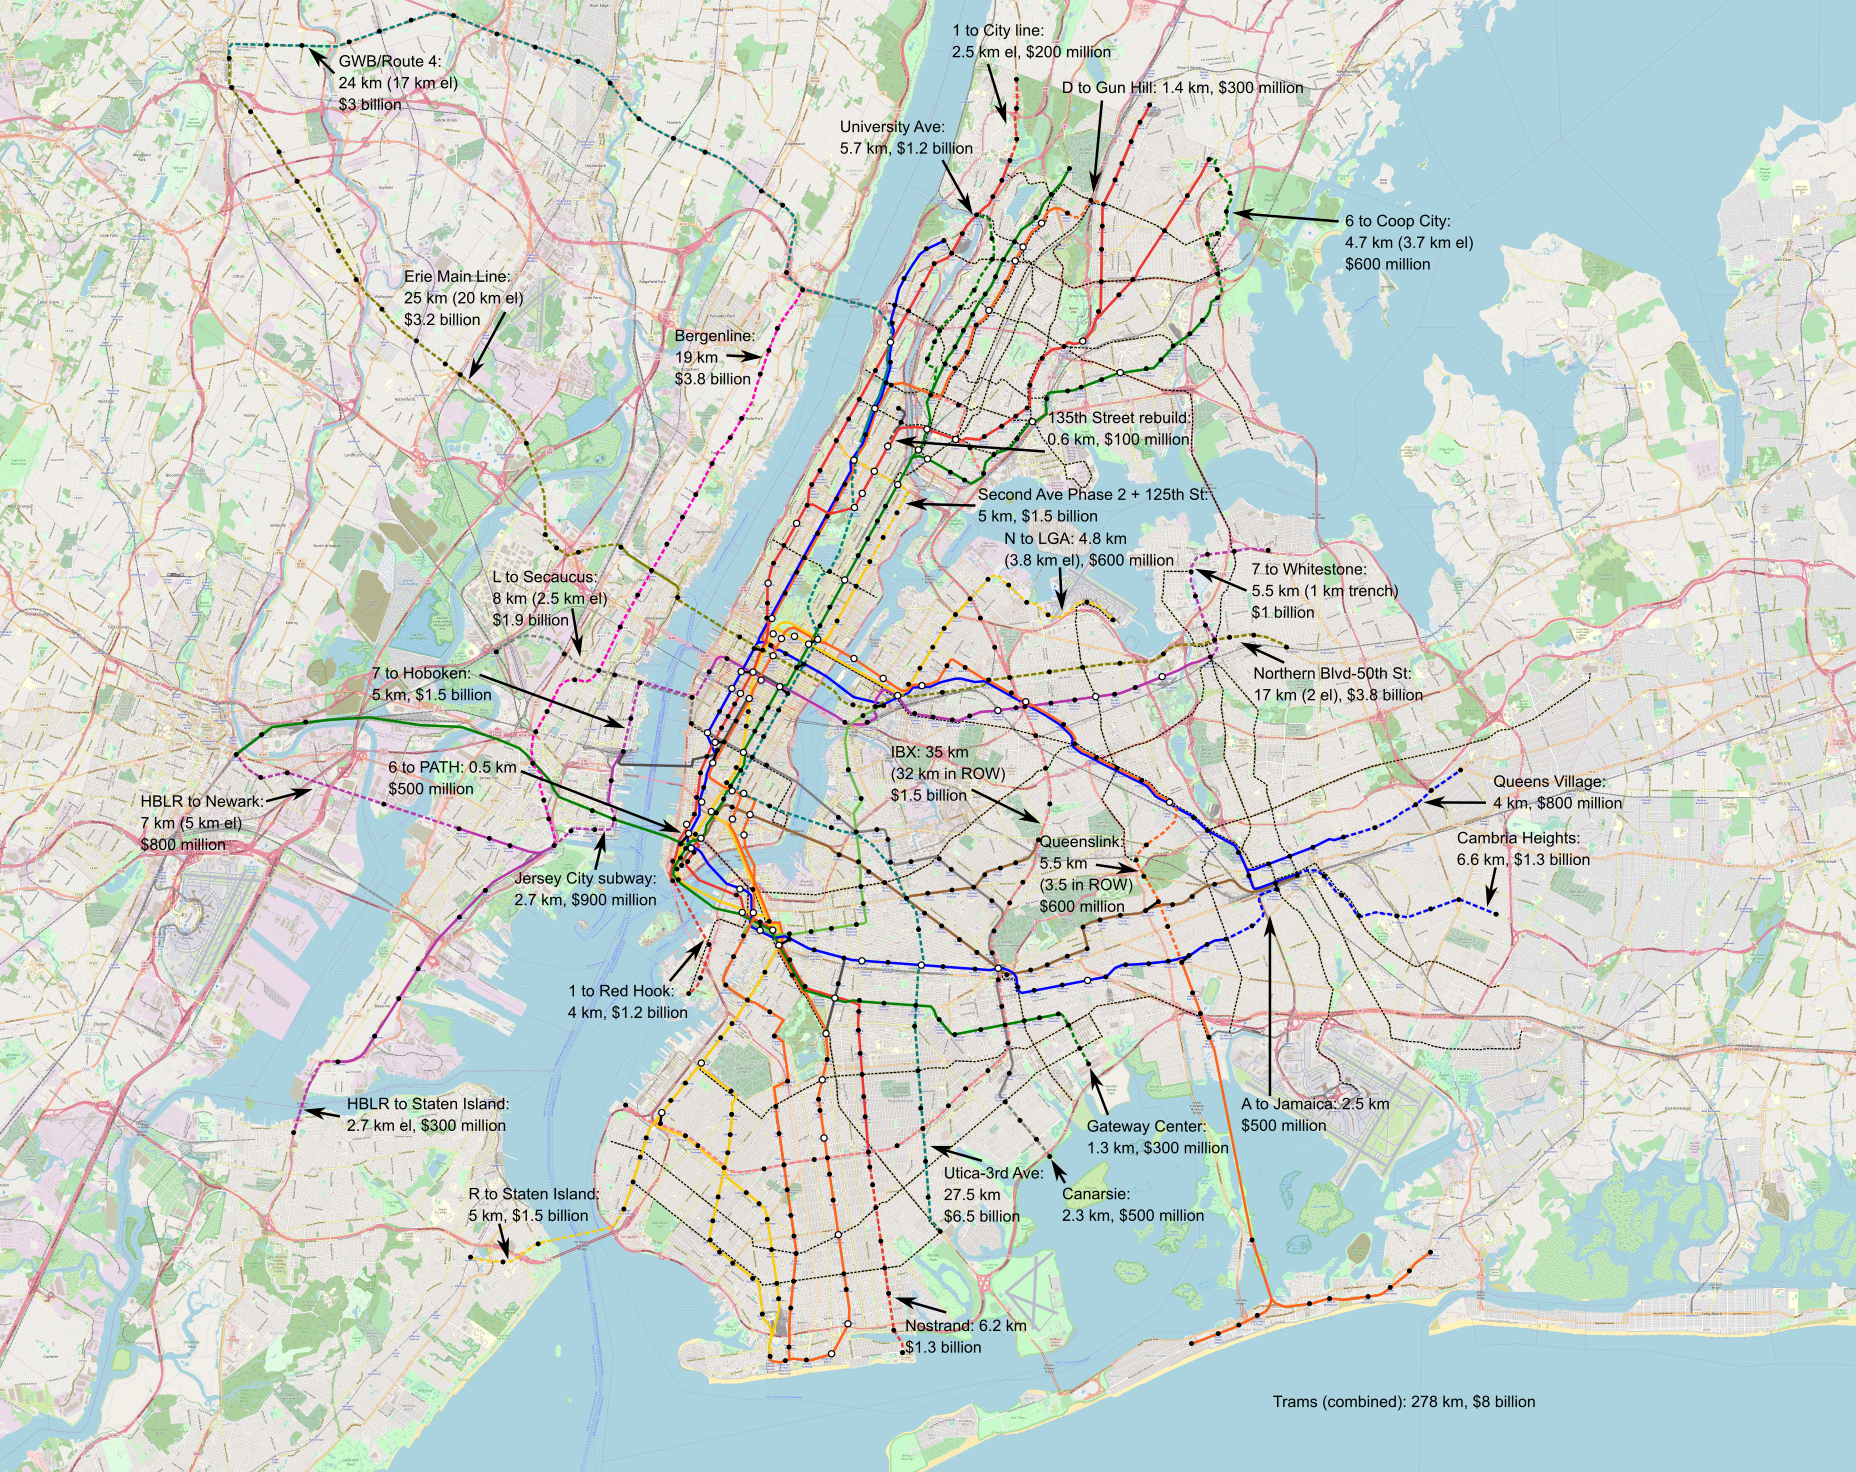
- 278 km of new streetcars, which are envisioned to be in dedicated lanes; on the Brooklyn and Queensborough Bridges, they’d share the bridges’ grade separation from traffic into Manhattan, which in the case of the Brooklyn Bridge should be an elevated version of the branched subway-surface lines of Boston, Philadelphia, San Francisco, and most German cities. Those should cost $8 billion in total, based on Eno’s European numbers plus some recent urban German projects.
- 240 km of new subway lines, divided as 147.6 km in the city (97.1 km underground) and 92.4 km across the Hudson and in New Jersey (45.2 km underground). Of those 240 km, 147.5 km comprise four new trunk lines, including the already-planned IBX, and the rest are extensions of existing lines. Those should cost $25.2 billion for the city lines and $15.4 billion for the New Jersey lines.
- Rearrangement of existing lines to reduce branching (“deinterlining“) and improve capacity and schedule robustness; the PATH changes are especially radical, turning the system into extensions of the 6 and 7 trains plus a Hoboken-Herald Square shuttle.
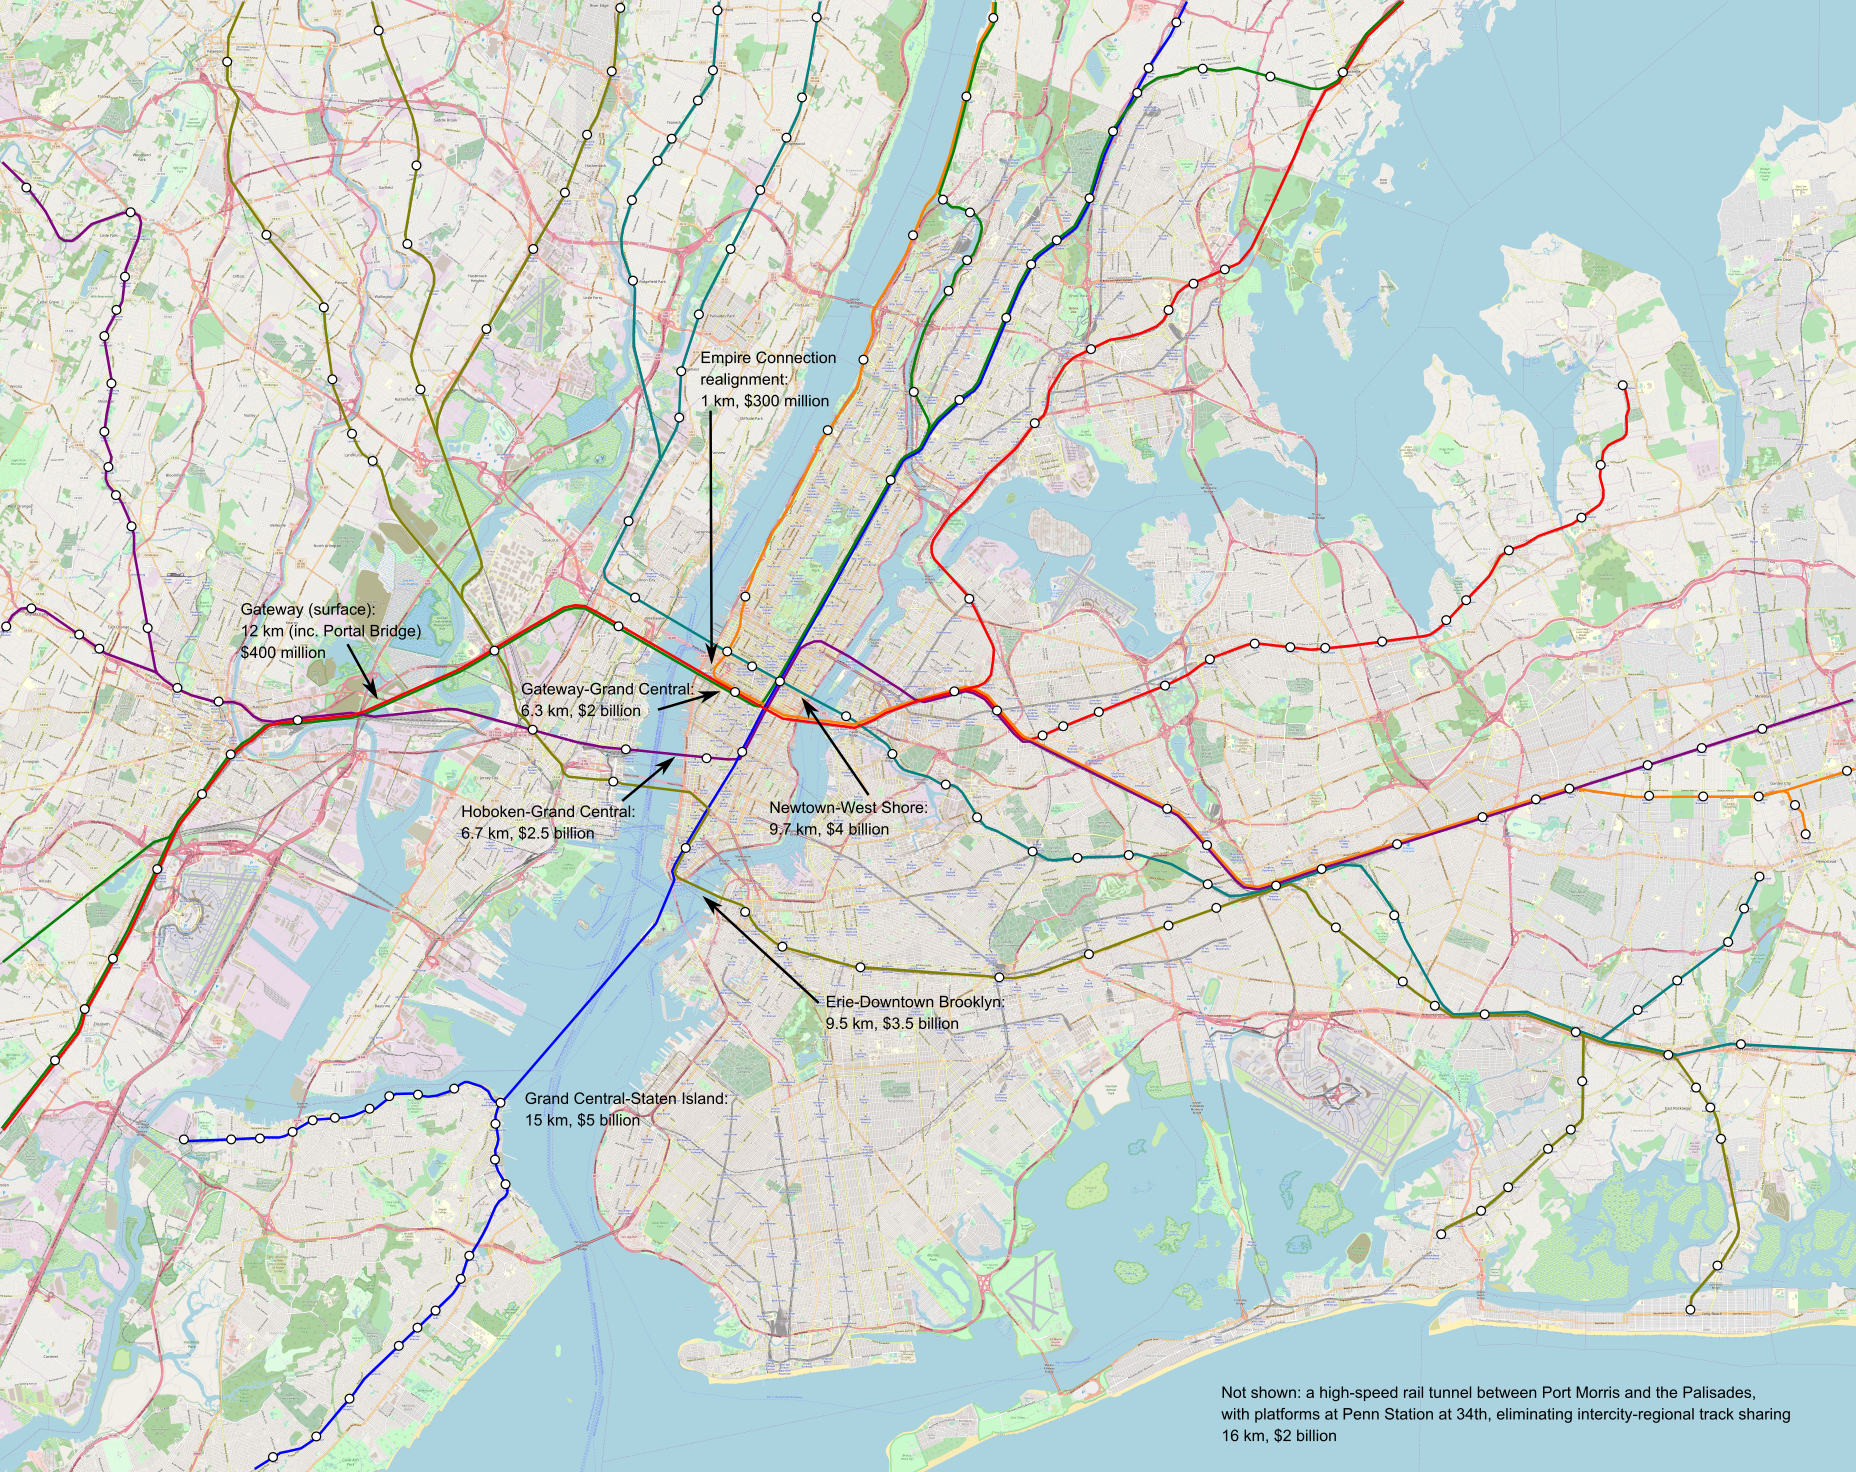
- 48.2 km of commuter rail tunnels, creating seven independent trunk lines across the region, all running across between suburbs through the Manhattan core. In addition to some surface improvements between New York and Newark, those should cost $17.7 billion, but some additional costs, totaling low single-digit billions, need to be incurred for further improvements to junctions, station platforms, and electrification.
The different mode of transportation are intended to work together. They’re split across two maps to avoid cluttering the core too much, but the transfers should be free and the fares should be the same within each zone (thus, all trains within the city must charge MetroCard/OMNY fare, including commuter rail and the JFK AirTrain). The best way to connect between two stations may involve changing modes – this is why there are three light rail lines terminating at or near JFK not connecting to one another except via the AirTrain.
What else is included?
There must be concurrent improvements in the quality of service and stations that are not visible on a map:
- Wheelchair accessibility at every station is a must, and must be built immediately; a judge with courage, an interest in improving the region, and an eye for enforcing civil rights and accessibility laws should impose a deadline in the early to mid 2030s for full compliance. A reasonable budget, based on Berlin, Madrid, and Milan, is about $10-15 million per remaining station, a total of around $4 billion.
- Platform edge doors at every station are a good investment as well. They facilitate air conditioning underground; they create more space on the platform because they make it easier to stand closer to the platform edge when the station is crowded; they eliminate deaths and injuries from accidental falls, suicides, and criminal pushes. The only data point I have is from Paris, where pro-rated to New York’s length it should be $10 million per station and $5 billion citywide.
- Signaling must be upgraded to the most modern standards; the L and 7 trains are mostly there already, with communications-based train control (CBTC). Based on automation costs in Nuremberg and Paris, this should be about $6 billion systemwide. The greater precision of computers has sped up Paris Métro lines by almost 20% and increased capacity. Together with the deinterlining program, a single subway track pair, currently capped at 24 trains an hour in most cases, could run about 40 trains per hour.
- Improvements in operations and maintenance efficiency don’t cost money, just political capital, but permit service to be more reliable while cutting New York’s operating expense, which are 1.5-2.5 time a high as the norm for large first-world subway systems.
The frequency on the subway and streetcar lines depicted on the map must conform to the Six-Minute Service campaign demand of Riders Alliance and allies. This means that streetcars and subway branches run very six minute all day, every day, and subway trunk lines like the 6, 7, and L get twice as much frequency.
What alternatives are there?
Some decisions on the map are set in stone: an extension of Second Avenue Subway into Harlem and thence west along 125th Street must be a top priority, done better than the present-day project with it extravagant costs. However, others have alternatives, not depicted.
One notable place where this could easily be done another way is the assignment of local and express trains feeding Eighth and Sixth Avenues. As depicted, in Queens, F trains run local to Sixth Avenue and E trains run express to Eighth; then, to keep the local and express patterns consistent, Washington Heights trains run local and Grand Concourse trains run express. But this could be flipped entirely, with the advantage of eliminating the awkward Jamaica-to-Manhattan-to-Jamaica service and replacing it with straighter lines. Or, service patterns could change, so that the E runs express in Queen and local in Manhattan as it does today.
Another is the commuter rail tunnel system in Lower Manhattan. There are many options for how to connect New Jersey, Lower Manhattan, and Brooklyn; I believe what I drew, via the Erie Railroad’s historic alignment to Pavonia/Newport, is the best option, but there are alternatives and all must be studied seriously. The location of the Lower Manhattan transfer station likewise requires a delicate engineering study, and the answer may be that additional stops are prudent, for example two stops at City Hall and South Ferry rather than the single depicted station at Fulton Street.
What are those costs?
I encourage people to read our costs report to look at what goes into the numbers. But, in brief, we’ve identified a recipe to cut New York subway construction costs by a factor of 9-10. On current numbers, this means New York can cut its subway construction costs to $200-250 million per kilometer – a bit less in the easiest places like Eastern Queens, somewhat more in Manhattan or across water. Commuter rail tunnel costs are higher, first because they tend to be built only in the most difficult areas – in easier ones, commuter rail uses legacy lines – and second because they involve bigger stations in more constrained areas. Those, too, follow what we’ve found in comparison cases in Southern Europe, the Nordic countries, Turkey, France, and Germany.
In total, the costs so projected on the map, $66.3 billion in total, are only slightly higher than the total cost of Grand Paris Express, which is $60 billion in 2022 dollars. But Paris is also building other Métro, RER, and tramway extensions at the same time; this means that even the program I’m proposing, implemented over 15 years, would still leave New York spending less money than Paris.
Is this possible?
Yes. The governance changes we outline are all doable at the state level; federal officials can nudge things and city politician can assist and support. There’s little confidence that current leadership even wants to build, let alone knows what to do, but it’s all doable, and our report linked in the lede provides the blueprint.
