Category: Transportation
Prioritizing Rail Expansion in New England
New England rail activist Kenny Uong talked about some New England rail lines that should be built. The proposals are not bad in theory, and remind me of longstanding advocate demands, but in practice, the prioritization is all wrong. In truth, further investment in regional rail in New England – by which I mean RegionalBahn-style service to small towns like Westerly and Manchester, not core commuter rail service in Boston to be turned into an S-Bahn – is a waste of money in the current situation. Activists and railfans like closing gaps in the network of the service that exists but isn’t used, such as the outer tails of commuter rail in Rhode Island and Connecticut, but in truth it cannot be expected to have meaningful ridership until there’s better intercity rail, and in some cases it can even be counterproductive through lading high-speed tracks with slower traffic.
This is not an attack on Kenny, who did good advocacy for better buses and rail in his home region of Los Angeles as a teen and who keeps doing the same now that he lives in Providence. Rather, it’s a showcase, I think, of how railfan wishcasting can turn into actual proposals by advocates that look good but can never perform well.
The proposals
Kenny proposes five lines:
- An extension of Shore Line East to the Rhode Island border at Westerly
- A rail line going inland from New London to Norwich via Mohegan Sun
- An extension of MBTA Commuter Rail in Rhode Island to Westerly to meet Shore Line East
- An extension of MBTA Commuter Rail into New Hampshire to serve Nashua and Manchester
- An extension of Amtrak Downeaster service deeper into Main, from Brunswick to Rockland
Long-time readers may remember that the second and fourth both appear in a post I wrote in 2020 about New England high- and low-speed rail coordination. So obviously I don’t think they are bad. I do, however, think they depend on other investments, outside the low-speed regional rail paradigm.
A rail line to Mohegan and Norwich works if and only if there is high-speed rail from New York to New London, without which it is uncompetitive with driving or with buses to the casino. I can be convinced that a rail line might work if an extensive upgrade of the New Haven Line to cut 30-45 minutes from train trips (like 30-30-30, reducing New York-New Haven trip times to an hour; this is also in the no-bypasses version of our Northeast Corridor proposal). At current trip time, unfortunately, rail is not competitive with the transfer time – New York-New London is 2.5 hours today, and New York-Mohegan/Norwich would be around 3 hours, whereas Google right now, at 10 pm New York time, gives me a 2:20 driving time to the casino. Rail is more competitive at rush hour, but a casino with midnight buses does not generate particularly peaky traffic. The Northeast Corridor proposal’s schedule is 1:12 New York-New London every half an hour, which makes a connecting regional train competitive; otherwise, it’s not worth it.
Similarly, an extension of commuter rail into New Hampshire is best saved for after the MBTA system extensively modernizes its core service, with electrification of the Lowell Line and high platforms. The Lowell Line could potentially be fast – it was built in 1834, before rail builders figured out that sharp curves could be built without derailing the trains. But it isn’t now, and it’s still designed as a strictly unidirectional system, bringing in suburban commuters to Boston in the morning and back home in the late afternoon. For example, the Route 128 stop on the line, Mishawum, is barely served and not really connected to the nearby office parks. Then the lack of electrification and the low platforms hurt reliability and raise operating costs, and so far the MBTA is buying battery-trains only on the Fairmount Line and at extremely high costs, the agency’s managers still feeling allergic to hanging catenary wires. No outer extensions should be entertained under the current paradigm.
The Westerly connection
The most interesting – and flawed – bits in the proposal come from the idea of connecting Shore Line East with MBTA Commuter Rail service at Westerly. There are feasibility studies from both ends, with results that are trumpeted in the media as portending great demand but actually prove the opposite (the Connecticut study estimates 160,000 riders/year, which is a bit more than 500/day).
The issue is that today, one can chain commuter rail trips from south of Wilmington (technically Newark, Delaware) to New London, but there are gaps past both ends, between New London and Wickford Junction and between Delaware and Perryville. Railfans see the gaps and want them closed with commuter rail extensions so that they can take the entire Northeast Corridor without using Amtrak. These railfans then advocate to study such extensions – for example, the Rhode Island Association of Rail Passengers is involved.
And those extensions are largely useless. There is a mode of transport for connecting different city regions in the Northeast: intercity rail. One can take Amtrak between New Haven and Providence today, at competitive trip times. The fares are high, but that’s because operating costs are high; regional rail is if anything more expensive to operate, and raises questions of whether subsidizing this specific trip is a good use of Connecticut and Rhode Island’s money. What’s more, people take these high-fare trains – the trip times on that segment are competitive, and buses struggle to serve a thin market, lacking the ability of trains to easily serve multiple cities and piggyback on the much thicker New York-Boston market.
Germany has parallel intercity trains that run fast and regional trains that run slow but are free to ride with the Deutschlandticket. When the free tickets on regional trains were introduced with the 9€ monthly of summer 2022, people rode them for the novelty, and then stopped, because nobody actually needs to string regional trains between cities, averaging maybe 60 km/h, just for the free trip. Trains that are not time-competitive are not getting ridership, and this includes any attempt to get passengers to connect at Westerly between regional trains to New Haven and regional trains to Providence.
So any extension to Westerly from either end has to live purely on regional traffic. Last time Rhode Island paid for an MBTA extension to the south, it got parking lots at T. F. Green Airport and Wickford Junction, and massive ridership shortfalls. Wickford Junction, in the middle of nowhere in northern South (Washington) County, has a parking garage with 1,100 spots, which drove up the construction costs of the station to $44 million in early 2010s prices. Ridership in the fall 2024 counts was 157 inbound boardings, or 314 total trips, compared with a ridership projection of about 3,500; the cost per daily trip in today’s prices is about $200,000. This is not a corona artifact – the MBTA recovered all corona ridership shortfall, alone among major American commuter rail agencies. It’s just what happens when commuter rail is extended to a place with few commuters to Boston; Providence is not a strong enough city center to hold a peaky commuter rail system as a destination (the Superman Building is still empty and seeking financing for a residential conversion). Westerly is not going to do any better than Wickford Junction.
But what such an extension would do, in lieu of getting any ridership, is interfere with intercity trains. The fastest parts of the Northeast Corridor are in Massachusetts and Rhode Island. A system of timed overtakes is used right now to let Amtrak share the corridor with slow diesel trains; Attleboro has four tracks for that. South of Providence, this is obviated by the fact that there’s almost no commuter traffic, but the more there is, the more one has to worry about timetabling, which would complicate schedules and reduce reliability for the intercity trains that get ridership in service of regional trains that would not.
Some of this would improve if service on the Northeast Corridor in general improved. However, the issue of interference with intercity trains would only get worse if intercity service were sped up and ran more frequently. In theory, it should be possible to run a stopping train between New Haven and Providence on the legacy line, with intercity trains running on a bypass in Connecticut, but the timetabling in Rhode Island would still be difficult and the ridership would not be particularly strong. Other than Mohegan Sun, towns like Mystic and Westerly aren’t destinations, and for origins, the train would struggle to beat driving to New London to take the train from there to New York.
Railfan prioritization
Taking a broader view of this, railfans tend to prioritize the wrong lines, and not just in the United States; Germany has the same problem with rail advocacy. To the person who’d ride the train even if driving were faster, the most important priorities are where train service does not exist, such as across the gap between New London and Wickford Junction. But to the civil servant deciding how to prioritize infrastructure money, it’s more important to invest in trains that can get more riders than just the railfans; taking a line from 0% to 5% modal split is less important than taking it from 20% to 40%, it’s just less important to the sort of people who are already in the 20% of rail users and would be in the 5% if service and modal splits deteriorated.
In truth, the priority in the Northeast should be high-speed rail, in coordination with some specific urban and inner-suburban commuter rail investments; I keep pushing grade separation of Hunter and Shell Interlockings just south and north of New York respectively for a reason. On the commuter rail system, the priority must likewise be making the system usable by more than suburban 9-to-5 commuters, and investing in making it unrecognizable to the American traditionalist and recognizable to the European RER or S-Bahn user. Regional rail is in the best cases a lower priority, and in many not worth it even as a lower priority.
Quick Note on Ridership Estimation and the STOPS Model
The Federal Transit Administration (FTA) has a model for ridership estimation for public transit lines, called STOPS. It’s designed to be simplified enough that transit agencies can compute rough projections with it without having a large permanent in-house team dedicated to it (the MTA has a team of about 12). At the Transit Costs Project, we’ve taken to using it to do estimates for potential extensions under various assumptions on speed, frequency, and service pattern. For example, the Effective Transit Alliance’s statement in support of QueensLink for the budget vote later today quotes a figure of 105,000 expected daily riders, with 75,000 of them new and 30,000 existing at the Rockaway stations. I’d like to both go over this figure in this post and explain why at the same time, STOPS must be used with caution, especially in New York.
The QueensLink ridership estimate
At the program, Franklin Tang is responsible for the use of STOPS. Using the tools of the model, he computed that under our assumptions of QueensLink service, total northbound boardings at all stations south of Rego Park-63rd Avenue, the branch point from the Queens Boulevard Line, are 52,634 per weekday. Every trip must be paired between north- and southbound travel, so this means a total of 105,268 trips using QueensLink. These numbers include stations that already have service on the A train, including Howard Beach and the Rockaways; one of the points of QueensLink is to give these areas faster service to Midtown than they get on the A, which takes the long way around via Downtown Brooklyn and Lower Manhattan. In a No Build scenario, we expect these preexisting stations to have about 30,000 total trips, taking into account some expected redevelopment around the Aqueduct.
The business case released by QueensLink, released using the same analysis, gives a total of 75,000 riders/day. This is not the net figure – the similarity is coincidental. Rather, it includes things it shouldn’t (namely, boardings at Rego Park, nearly all preexisting) and excludes things it should (namely, the southbound alightings), as it imitates MTA methodology, which for reasons I don’t quite get counted the Rego Park boardings in its estimate for QueensLink ridership.
The figure people should use in subsequent analysis is the higher one, which is the most comparable to how transit ridership of new projects is usually computed. Riders diverted from other lines still benefit from the project, especially in a case like QueensLink, where the diverted riders would enjoy an improvement in trip time to Midtown of about 10-15 minutes each way. Second Avenue Subway’s ridership, which we compare QueensLink’s favorably with in the ETA analysis, is based on estimates for total ridership, not just new trips, and includes diversions from the 4/5/6 and from crosstown buses in addition to new trips.
The problem of STOPS
STOPS is designed for quick-and-dirty calculations and is known to choke on New York. FTA intends for it to be used elsewhere in the United States, where I am told it gives more accurate numbers; the MTA’s in-house team can do more precise calculations by itself, without STOPS.
Case in point: we tried estimating the ridership of a Utica Avenue subway extension with STOPS, and got bad numbers. “Bad” here does not mean the numbers were low and I’d like them to be higher, but that the model gave nonsensical results. Total northbound boardings on the new stations amounted to 58,000; total southbound alightings only amounted to 25,000. In effect, the model thinks that if a Utica Avenue line opens, then 33,000 people will permanently emigrate from Southeast Brooklyn every day. We’ve rerun the numbers and at this point I don’t believe we made an error; rather, STOPS has some errors, perhaps with stations close to one another, that lead to random results that don’t quite average out correctly. Thus, I recommend caution when using it as it is still only good enough for a first-order estimate.
IFP’s Transit Abundance Playbook
Two weeks ago, the Institute for Progress published a playbook called Transit Abundance, comprising 15 policy briefs about reducing construction costs. One of them was my own, about itemization of costs. Eric has a good one about phasing funding to prevent the situation of the Boston Green Line Extension in which the planning for the project was funded from the same grant that funded construction, leading to rushed pre-planning to get that money in the first place. And unfortunately, many of the rest are questionable. There’s a mix of good, meh, and downright counterproductive, and unfortunately, I’m seeing people I know and respect from elsewhere say things that are wrong or barely relevant.
My first filter for pieces like this is “is this even close to correct?”. There are some pieces that fail the test right there, praising projects that were extremely expensive as examples to emulate rather than avoid (for example, the reliably incompetent Stephanie Pollack is saying that of the Green Line Extension).
But beyond that, for things that at least get what the problem is, I look at what they cite. If they only cite the Transit Costs Project, then they don’t know enough to play. If they cite things I wasn’t aware of, then it’s more interesting. A positive highlight is Anthony Potts’ piece calling for technical scoring of proposals, which relies on literature about the exact weighting required for technical scoring to matter. We knew from interviews that California’s 30% technical score, 70% cost weighting produced identical results to lowest-bid. This piece actually went and found published results on this issue and found that if the cost is weighted at 57% or more then it’s the same as lowest-bid, and that this produces higher final costs both in general and in California case studies. This piece, I encourage everyone to read for a more complete discussion than we wrote of technical scoring and its merits.
And if this piece is a highlight, a lowlight is a piece on AI, by Lizzie Speed and Bennett Capozzi, panned across social media for calling for using more AI for transit planning, from a background of trying to sell AI technology rather than from that of transit planners; the authors cite the Transit Costs Project’s review of planning and other soft costs to argue the unique Anglosphere problem is data limitation (we say no such thing in our report) for which the solution is more AI, and seem not to know where those high costs come from. This compounds a criticism I’ve seen across social media for IFP’s use of generated images, to the point that the lead image for the playbook was noted for having errors in how the trains look (it’s hung on bus-like wheels rather than on bogies).
And regrettably, I’d like to also highlight Jackson Moore-Otto’s piece, which says that federal loans can stabilize transit funding to prevent a feast-or-famine problem. I respect Jackson and have seen him do and lead good work on matters of commuter rail and Boston-area advocacy, and am honestly surprised he’d write such a thing, which is just wrong.
The specific problem with Jackon’s argument is that it relies on a chain of citations, each introducing some errors to the point that the final claims are just wrong. A central claim is that the first electrification project costs more than subsequent ones, which is manifestly untrue (for example, compare Amtrak’s Northeast Corridor electrification in the 1990s with its struggles to install autotensioners now). This is based on a claim sourced to Momentum (which doesn’t quite say that), which sources it to the RIA Electrification Cost Challenge (which gets some Continental costs wrong); to get there, Jackson is saying the New Haven-Boston electrification was not a first line but a subsequent line, when in fact Amtrak had literally never electrified a railroad before and its forerunners on the Northeast Corridor had last done so in the Great Depression. The British costs are meanwhile compromised by repeated project cancellations that lead to sunk planning costs and make internal comparisons difficult, since the surviving lines are by definition the easiest ones. In truth, rather rapid electrification projects, without decade-by-decade continuity, exist outside the UK and are often quite reasonable in their costs, as in Denmark, Israel, and especially India.
The upshot is that because there is no feast-or-famine problem with electrification, any program to reduce its cost in the US (or UK) needs to understand what works and not talk about making it easier to apply for federal loans. On the Northeast Corridor, for example, a senior engineer since removed for incompetence and potential embezzlement of Amtrak funds unilaterally decided to tighten the required catenary pole spacing, driving up costs for reelectrification since the existing poles are not compatible with the new standard (but are compatible with high-speed electrification systems sold by international vendors). This is not a feast-or-famine problem, and to the extent there may be a specific federal policy solution, it’s to require planners to attend international industry fairs and conferences like InnoTrans and make it clear that ones who don’t will have stalled careers.
Secondary Stops in Cities on Intercity Rail
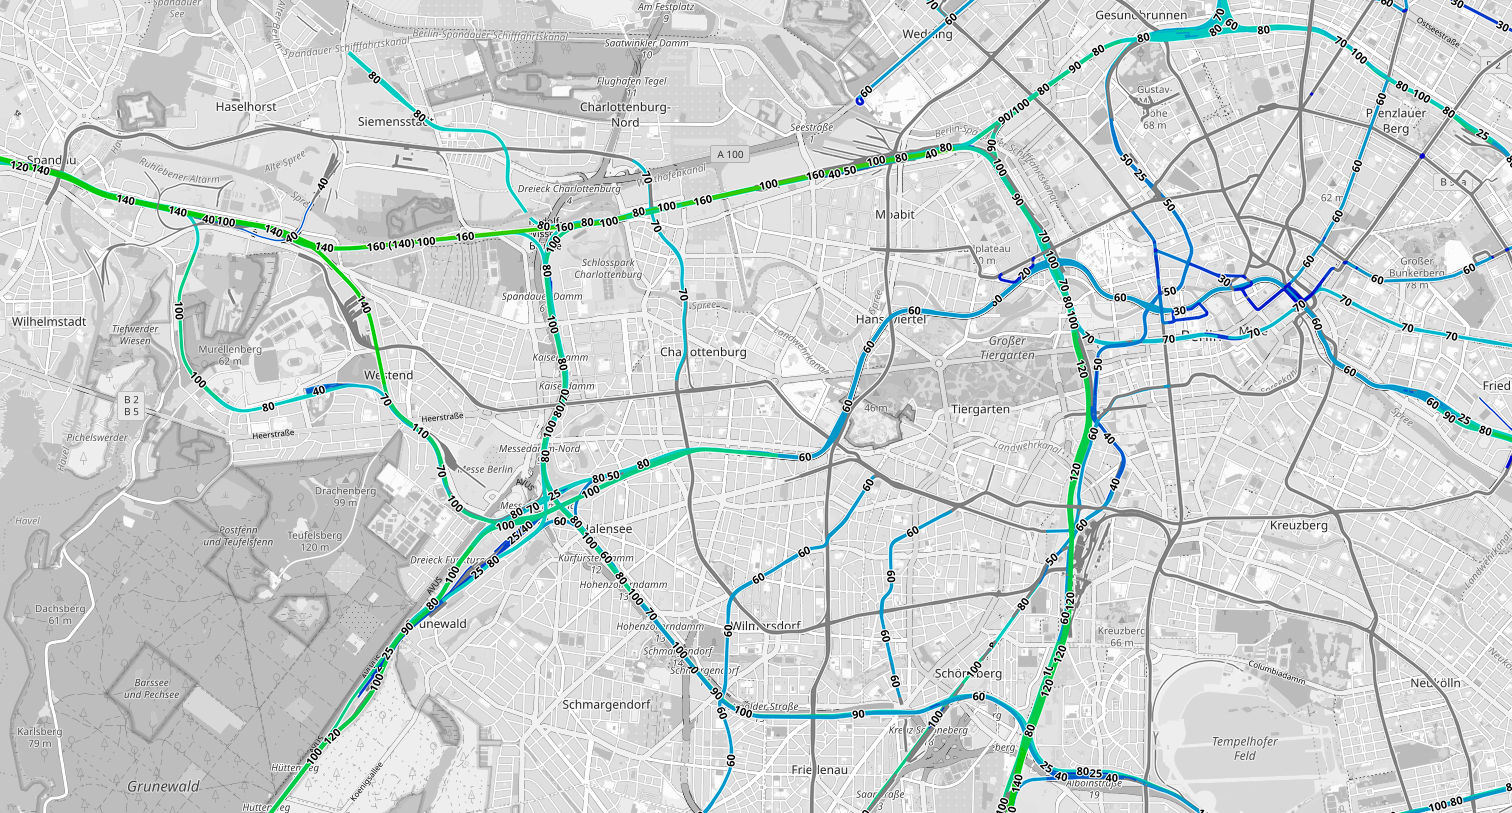
Intercity trains usually only call at the main cities, and only at their main stations. However, in some cases, they make more than one stop in the same city. Examples include the Northeast Corridor with its two Boston stops, the Shinkansen stopping at Shinagawa and Ueno each a few kilometers out of Tokyo Station, Israel Railways with every train stopping multiple times in Tel Aviv, and ICEs stopping not just at Berlin Hauptbahnhof but also a station in each of the cardinal directions out of the city. This practice is a useful tool in the kit of an intercity rail planner, but is not always appropriate – indeed, anti-examples exist throughout France where this never happens and in most German cities that are not Berlin. The goal of this post is to discuss when it is or isn’t appropriate.
Opposite-side stops
If a city is at the end of a line, then the train may continue shortly past it and serve a secondary center. The main examples are in Berlin: it is at the northeastern end of the country, so trains running north-south either run through northwest to Hamburg or terminate just north of Hauptbahnhof at Gesundbrunnen, and trains running east-west entering Hauptbahnhof on the Stadtbahn run through to Ostbahnhof. This is not done in the other examples I have in mind: Israeli trains run through Tel Aviv, Shinkansen terminate at Tokyo Station rather than continuing to the opposite side, and the Northeast Corridor terminates at Washington Union Station rather than continuing one stop south to Alexandria.
In all cases, the question of whether to do it hinges on infrastructure more than operations. Unlike near-side stops, nobody is being delayed by the extra stop – Ostbahnhof isn’t between Hauptbahnhof and anything except Poland, which is barely even peripheral to the German rail network. The main cost is the extra few minutes of train operating time, on which ridership is necessarily going to be lower than the average because most people will have gotten off at the primary station. Whether it’s worth it depends on where it’s easier to turn, based on specific infrastructure considerations.
In Berlin, the reason for Ostbahnhof, a station with no connections to any public transport except the Stadtbahn, which also serves Hauptbahnhof, is infrastructural. The station has one more track than Hauptbahnhof (five vs. four on the mainline Stadtbahn tracks); more importantly, the railyard is to the east of the station, so any ICE using the Stadtbahn has to travel via Ostbahnhof anyway, so it might as well stop there. The railyard is also why some east-west trains even use the Stadtbahn with its 60 km/h speed limits to begin with, when those trains entering from the west can divert to the faster North-South Main Line.
In contrast, the Northeast Corridor’s electrification ends at Washington Union Station. In theory, it can be wired to Virginia and some trains can continue to Arlington while still running under wire. In practice, other works are involved – Washington Union Station is a mix of through- and terminating tracks and so far the through-tracks are low-platform, and the only bridge on the Potomac is primarily used by freight and a separate bridge to allow for passenger-dedicated infrastructure is under construction but won’t open until 2030.
Distance from the primary station
The farther away a node is from the primary station, the more appropriate it is as a prospect for a near-side station, because it is less likely to share a travel market with the primary station, and the cost to travelers of backtracking is higher. In a number of cases, it’s debatable whether the station should even properly count as a secondary station in the city, as opposed to a separate city’s stop. In New York, for example, the nearest station to Penn Station is Newark, 16 km away, in a city center that evolved separately and only became part of the New York metro area in the 20th century, long after its location as a station was established.
I emphasize that this logic is only for near-side stations, because for far-side stations, the logic goes in the exact opposite direction: the train is necessarily emptier going past the last primary city on the route, so the longer it has to run relatively empty, the weaker the idea of serving the far-side stop is. Not for nothing, Ostbahnhof and Gesundbrunnen are both very close to Hauptbahnhof, both well within the city center urban fabric.
To return to the case of New York, this is what separates Newark from Long Island City. There is currently no serviceable station in Queens on the Northeast Corridor, but there are occasional plans to build on, either at Queens Boulevard or a bit farther east at what I (and people following me) call Sunnyside Junction to allow for a transfer to East Side Access trains to Grand Central (the map below calls it Harold after the interlocking). MTA plans have called for the former, and occasionally one sees advocates call for the latter (ETA calls it Queens Junction), with official plans for decking Sunnyside Yards that may be connected.
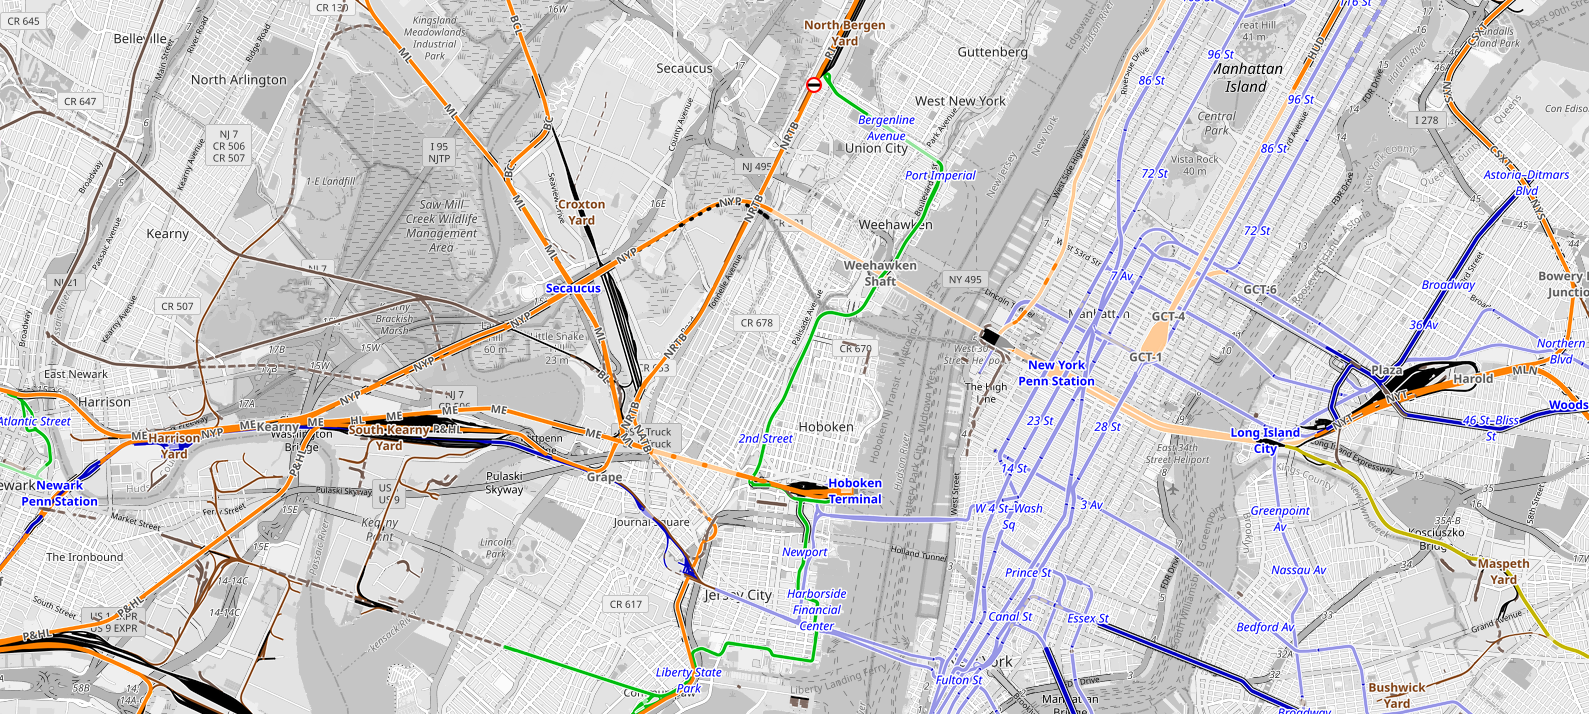
Newark Penn Station is a smaller job center than Long Island City. Within 1 km of Newark Penn are 48,000 jobs, vs. 70,000 within 1 km of the intersection of the NEC/LIRR Main Line with Queens Boulevard (and 35,000 of the plausible Sunnyside Junction location). But any project that builds commuter rail stations in Long Island City automatically makes the area easy to get to from Penn Station, whereas Newark Penn is a longer distance from New York, forcing a longer detour for passengers going to points south.
Track speeds
The main cost of a station stop is the extra time it forces on through-passengers. This means that it’s more justifiable to include more stops in a slow zone than in a fast zone.
In practice, this principle works in the opposite direction from that of distance to the primary station, since slow zones are more commonly encountered in major cities than outside of them. The best location based on synthesizing this and the distance principle is that stations are best placed near slow zones that are nonetheless far from the primary city and yet very difficult to fix. Newark Penn Station is at such a slow zone, the approach from the Dock Bridge to the station having some surprisingly tight curves, and the Harrison curve farther north even tighter. New Rochelle is another such example, next to a tight S-curve with flat junctions; this curve can be eased with a necessary grade separation, but the current maximum track speed there is so low, oscillating between 30 and 45 mph (48-72 km/h) based on track maintenance, that it’s understandable that Amtrak Regionals stop there. Back Bay, in an unfixable slow zone, is likewise a natural candidate for a station despite its proximity to South Station.
On urban through-tracks, the maximum speed is usually low, because the costs of engineering the right-of-way through an already crowded city center underground are high and economies are required. The curves on the Ayalon Railway look good for maybe 100 km/h, Stuttgart 21 is designed for 80-90 km/h and so was the North-South Main Line in Berlin, and the Shinkansen doesn’t go faster than 100-110 km/h through Central Tokyo or faster than 130 km/h to Omiya. Such environments encourage secondary stops, whereas the ability of LGVs to get out of city centers fast helps explain why it was never considered.
Of course, TGVs have another reason not to make secondary stops: they’re not set up for them. The TGVs are the worst high-speed trains in the world from the perspective of either acceleration, since they are hauled by locomotives whereas every other piece of equipment save some Talgos is a multiple unit, or interior car design, since they are single-door pair double-deckers with narrow passageways, not at all designed for fast egress since the concept has always been nonstop trips from a Parisian terminal to a secondary city. Regardless of the speed, a TGV making a second Paris stop would have a minimum 5-minute dwell time. At the other end, the Shinkansen and the Israeli trains have level boarding (as do Chinese high-speed trains but they tend to avoid slow city centers).
Relative strength of destinations
Stop spacing on every public transport vehicle is a matter of relative intensities of usage. Absolute density or intensity matters little; the real question is the intensity of the stop considered for addition or deletion compared with the intensity of the stop pairs through the stop that would be delayed if it were added. On intercity rail, the intensity of demand is a combination of all of the following:
- Commercial density near the station
- Density of other destinations near the station, such as tourist attractions, which can be approximated by looking at hotel capacity
- Connecting urban rail lines and the residential density thereon
Back Bay has, within 1 km of the station, 95,000 jobs, compared with 212,000 within 1 km of South Station. This ratio, 0.45, is atypically high for any American secondary central business district, to the point that people perceive Back Bay as a Boston central business district and not as secondary at times. It also is on the Orange Line, which doesn’t serve South Station, and close to the Green Line, which doesn’t get to South Station either, both with solid ridership (the Green Line is comparable to South Station’s Red Line, the Orange somewhat lower than either).
In New York, in contrast, Manhattan overwhelms everything. The 1 km radius from Penn Station if anything undersells it – it has 565,000 jobs, but Midtown continues beyond it and the 2 km radius has 1,415,000, whereas a 2 km radius from Newak Penn has 83,000 and a 2 km radius from Sunnyside Junction or LIRR/Queens Boulevard has 117,000-122,000. Secondary stations must be justified as origins rather than destinations: Newark Penn keeps up by collecting some commuter rail lines, but suffers since the Morris and Essex Lines only go to New York, not Newark Penn, and holds up mostly because of the slow nearby speeds.
No data as granular as OnTheMap exists in Germany, but one can still model connecting lines and their traffic intensity. The Ring is a high-traffic local corridor, especially its eastern half, including both Gesundbrunnen and Südkreuz; at both stations, its passenger traffic density is barely less than that of the Stadtbahn at Hauptbahnhof. Both also have the North-South Tunnel, which intersects the Stadtbahn at Friedrichstraße rather than Hauptbahnhof, and Gesundbrunnen also has the U8 connection. From quite a lot of the city, even relatively central parts, one of the two north-south secondaries is better than the primary. The east-west situation in Berlin is dicier, since Spandau is much more peripheral, more comparable to Newark than a secondary station within the primary city, and Ostbahnhof really exists as a byproduct of where the railyard is.
One should expect that European cities, with their lower-kurtosis centers, should be better places for secondary stations than American ones, which have very high kurtosis, even outside New York. Other than Back Bay, there really aren’t any strong secondary city centers on American intercity rail lines. California High-Speed Rail’s secondaries, like Burbank, are there for residential catchment, often with easier access by car than the central business district. And yet, one element goes in the opposite direction: larger metro areas tend to have more secondary destinations. Munich is small enough that it can monocentric within walking distance or a short S-Bahn ride from Hauptbahnhof. The sort of American cities that need to think about intercity rail are not; this is how Boston has such a strong secondary, and even New York has decent secondaries immediately outside city limits. Tokyo, with a very strong center but lower kurtosis than New York – high job density is not just in areas near Tokyo Station but also includes Shinagawa, Shinjuku, Shibuya, and Ikebukuro – is a natural place for secondaries, and if there were a Shinkansen line heading west rather than north or south, it goes without saying that it would stop at Shinjuku.
Quick Note: Cars and Suburbs Commoditize Location
Trains and big cities are more efficient on a typical cost basis than cars. The operating costs of trains are such that even the unsubsidized costs of big-city metros and bus networks are a fraction of those of cars. For example, New York City Transit, despite its high operating costs, manages to serve a linked trip for around $6, which works out to an annual cost per user of around $3,500, and if it had the cost structure of London or Berlin this would be $2,000 or a bit less than that; American cars average $7,000/car per year in private spending.
And yet, cars have one singular advantage: they commoditize location. Public transit ideally works in large cities at specific locations, based on historic contingencies like national capitals, religious significance, or river crossings and harbors that may no longer be relevant with modern technology. It’s decommoditized, in that there is only one New York, one Philadelphia, one Chicago, etc., and the cost of moving is high. Public transit itself doesn’t lend itself to competition, because it requires extensive scale to ensure connectivity and high frequency. This is why public provision is almost universal, and the exceptions either involve a high degree of public coordination such as the Verkehrsverbünde in the German-speaking world even if elements are contracted out or are Japanese cities with such large systems that competition between a JR and a private operator still leaves each competitor with much scale; even generally privatization-happy states like Singapore keep the systems broadly public in planning.
What this means is that cities and public transit require a public sector that can keep up without the discipline of market competition. This means public-sector innovation, with competition taking place in the political sphere as in European cities or in the technocratic one as in Singapore. If this doesn’t happen, then the system suffers. If, for example, the New York MTA folds to a strike by the LIRR train drivers in which the union demands are so unreasonable that even the left-wing city mayor Zohran Mamdani doesn’t side with the union, and gives the drivers large increases in pay while still allowing them to collect double pay for driving both a diesel and an electric train, then there’s no easy way to move to a competitor.
Cars and suburbs instead commoditize location. If the city can’t provide adequate public services, people can just leave. It’s particularly easy if the municipality that falters in providing services is not a large city but a small suburb of one, as in the boroughitis of New Jersey. Cars facilitate that, in that they scale down better. There’s no way to squeeze anything the size of Midtown Manhattan or even the center of Paris into one auto-oriented place (Los Angeles has a weak central business district), but that’s fine, a region can take the hit on income and still function with worse scale; Dallas is not a poor region. There are real problems in this setup with higher transportation costs and with job centers with worse scale, but sometimes it’s worth it to take the hit if it means not having to deal with unaccountable government that one can’t leave. If there’s no mechanism to improve governance – say, if there is such democratic deficit at the local level that it’s not possible for voters to coerce the city into improving education or public transit or housing or any other devolved issue – then that usually equally affects city and suburbs, but one can move from one suburb to another at relatively low economic and social cost, and this has a disciplining effect to some extent.
Meme Weeding: Regular Funding
American and British discourses on public transportation are too obsessed with getting regular funding. In the United States, it’s a commonplace among advocates that what the mode really needs is a regular source of funding protected from the usual political process. American thinktanks trying to talk about construction costs, such as Eno, even spoke with fascination about the bipartisan consensus in favor of expanding the Madrid Metro, in contrast with the American situation. In the United Kingdom, it’s specialized to some aspects and their construction costs, but the “feast or famine” line on electrification is particularly common. In truth, there’s quite a lot of funding regularity and political consensus in parts of the United States and United Kingdom that nonetheless cannot build anything, and conversely, some of the most prolific, lowest-cost builders in the world do so in an environment of funding uncertainty, especially when we consider the effect of the Great Recession.
Spain in the 21st century
The very low-cost metro construction program in Madrid under Manuel Melis Maynar in 1995-2003 is well-known to both academic researchers and advocates, and Melis’s own writeup on how this was achieved is a starting point for the entire discourse. This program, going back earlier in the 1990s and continuing right up until the 2008 financial crisis and the onset of the Great Recession, was marked by political competition between the left and the right over who could deliver more metro construction, and consistent commitment to building more infrastructure across Spain. At national scale the later part of this period is characterized by rapid, low-cost construction of high-speed rail building upon the success of the Madrid-Seville line (opened 1992). This was not a purely rail-based system – airports were expanded rapidly in the 2000s to accommodate the growing economy and growing international travel market.
And then all of this crashed after 2008. Some lines were still built if funded before – close to half of Spanish high-speed rail by funding is lines that opened post-2008, nearly all well underway when the recession set in. Other lines were canceled, some of which have not been restored, such as Madrid-Lisbon. Barcelona kept building L9 and L10, the most expensive in Spain, but Madrid’s construction program broadly wrapped up. I encourage readers to go to Alexander Rapp’s visualization and compare the rapid growth in 1995-2010 with the almost total lack of new lines in 2010-2025. If there’s one place that meets the definition of feast-or-famine, it must be Spain.
And downstream of the famine, construction costs are still very low. The high-speed rail built through the famine is more expensive, but only because it’s the Basque Y, majority in tunnel due to topography. The metro lines Madrid has built recently are still cheap: the Line 11 extension to Conde de Casal to open next year costs 84 million €/km, only mildly more than the Melis-era program in real terms, the difference largely attributable to the fully-underground character of the extension whereas the Melis-era program was only 73% underground. Feast-or-famine hasn’t dented Madrid’s ability to build cheaply, and so the plan as the economy is finally recovering from the crisis is to resume building rapidly, the entire 33.5 km Line 11 plan budgeted at the same low cost.
Italy and the reset button
Italy’s period of regular construction in the 1960s, 70s, and 80s was initially characterized by low costs for the first Milan lines from the 1950s and early 60s, but these grew quickly, and by 1970 they were if anything higher than in Britain and not much lower than Germany’s, due to the extensive corruption of the First Italian Republic. The 1990s process of mani pulite was such a transformative change that people periodize Italy since then as the Second Italian Republic, with rather different politics from the First, with far less corruption and far more left-right polarization.
In the interim, there was a famine in metro construction as rules were changed to require more transparency. The system that emerged from the famine had lower real costs than that of the 1980s with its corruption. A second famine occurred, to some extent, in the Great Recession, albeit nothing as drastic as in Spain; the Spanish economy was characterized by high growth with a housing bubble in the years leading up to the Great Recession, where Italy in the 1990s and 2000s up to 2008 already had the weakest economic growth in Europe, so in effect there weren’t such massive infrastructure projects to be canceled. The famine is over, and the Italian economy has exceeded its 2007 peak and returned to healthy growth, with further construction of metro lines. Costs broadly remain low – Turin’s Line 2 has a high projected cost by Italian standards, but the extensions in Milan don’t appear any more expensive than the ones built 15 years ago.
Nordic costs
Stockholm built its three-line metro from the 1950s to the 1990s, with most construction complete by 1978. That feast, driving up Stockholm’s modal split by the 2000s and 10s to Parisian levels despite not being a particularly large city, was followed by famine, with only two short extensions opened thereafter, in 1985 and 1994. Since then, only one urban rail tunnel has opened, Citybanan, opening in 2017. Nya Tunnelbanan has proceeded, with the 19 km extension to open in stages beginning next year.
Swedish costs are sharply up. The original T-bana was among the cheapest metro systems built in history, not much more expensive than lines built in the 1900s-10s in New York, Paris, and London. Relative to Sweden’s GDP per capita, it is, I believe, unsurpassed in its low costs. Madrid’s costs were higher than this. Citybanan is harder to compare, as a commuter rail tunnel with mined stations beneath older T-bana stations, on two levels in the case of Stockholm City/T-Centralen. But Nya Tunnelbanan is definitively more expensive, its costs still below the global average but no longer so Earth-shatteringly cheap.
And yet, this is not too different from the evolution of construction costs in Norway and Finland, where construction has been more gradual. We know why Stockholm’s costs have risen, a combination of mid-project regulatory changes that led to cost overruns and a general increase in real Nordic costs due to the adoption of more privatized project delivery and loss of state capacity. Copenhagen, which built its metro based on these more privatized ideas from the start since it only started building in the 1990s when those ideas were in vogue, has had these higher costs from the start (again, meaning “somewhat lower than 2020s global average” as opposed to “setting world records for GDP per capita divided by per-km metro costs”).
On the narrow matter of electrification, it’s notable also that the Danish program, a concentrated feast rather than a gradual multi-generational program as in Italy, is not particularly expensive. As it is recent and intensive, I if anything encourage English-speaking countries to study it and benchmark their programs to it, precisely because it gives us a snapshot of electrification of many different main lines. (This is also true of Israel.) In contrast, the more gradual rolling electrification programs of Italy and France are harder to benchmark to, because at this point the lines being wired are selective, for a combination of low traffic (the higher-traffic lines having been wired generations ago) but also ease of electrification (the more difficult lines being deferred due to failing a cost-benefit analysis).
Consensus in the United Kingdom
In Madrid, PP and PSOE both politically supported metro expansion and made that an election theme. The same can be said of a number of Continental European comparanda, such as Paris. However, London (on rail in general) and the UK (on High Speed 2 and electrification) are no different. HS2 and Crossrail were both matters of bipartisan consensus in the 2010 election, just as Grand Paris Express was a point of consensus in 2012. If anything, HS2 and Crossrail were thus less politicized than GPE, on which the Socialists and Republicans differed on which exact lines to build within the concept of inner-suburban Paris orbitals; a closer British comparison to GPE is the electrification program, which too was a point of agreement between Labour and the New Tories but then after the 2010 election the Coalition modified the program to prioritize secondary-city commuter lines over the Midland and Great Western Main Lines.
Moreover, physical construction in London, unlike British rail electrification, has shown remarkable consistency. The current period after the opening of Crossrail might be the first famine in a generation. However, the famine is not the cause of high costs but rather is caused by them: Crossrail 2 was being planned in the 2010s, but canceled due to outrageously high costs, and yet it is likely a scaled down version of it will go back to the planning board and be approved soon. An extension of the Bakerloo line to Lewisham is in the pipeline as well, at much higher per-km costs than those of the Northern line extension to Battersea and the Jubilee line extension, and the question of whether to build it at all is again downstream of the high costs, not upstream of them.
Despite relative consistency in funding and politics, British projects do not have any consistent planning regime. Every project is delivered as a single purpose vehicle (SPV/SPDV; D stands for delivery). The Jubilee line extension was in theory designed in-house, but because it was clear the model was giving way to privatized project delivery, the in-house team was treated as an SPDV and its expertise withered away after the line opened. The same has happened with subsequent megaprojects, the lessons of Crossrail now existing only as a Learning Legacy report; in contrast, GPE, initially planned as an SPDV under British influence, is transitioning to a permanent bureaucracy for building metro and commuter rail tunnels across France.
Consensus in New York and California
The United States since 2010-11 has been characterized by almost total unwillingness by the Republican Party to assent to major public transportation and intercity rail projects. Chris Christie set the stage by canceling the ARC tunnel between New Jersey and New York without replacement; as the project has high benefits matching its outrageous costs, it was rebooted by Amtrak, at even higher costs. Subsequently, governors elected in the 2010 wave returned federal money for intercity rail, in Ohio, Wisconsin, and Florida.
And yet beneath this national picture, one finds remarkable consistency in funding in New York and California. In New York, the Metropolitan Transportation Authority has planned its capital spending in five-year cycles going back to reforms in the 1980s under Richard Ravitch to discourage maintenance deferral, with regular funding in these cycles and little partisan controversy thereover. Expansion projects used to be a matter of bipartisan deals, with Republicans like Governor George Pataki (r. 1995-2006) dealing with Democrats like Assembly Speaker Sheldon Silver (r. 1994-2015) to agree on funding for their constituencies, respectively the suburbs and the city. The more recent Republican Party has been less convivial, but also far less electable, and the state is by now run by a single party, with consistent funding and a regular cursus honorum for the political appointees overseeing the MTA. There’s no feast-famine cycle, nor is there any siege mentality over what if the Republicans will defund the MTA, because the state money for the MTA is still there and nothing electable in the state is canceling that.
California is largely the same. California Republicans do not have the same history of bipartisan moderation as New York Republicans, but the state moved on from them a generation ago already. In this century, the only Republican who was even mildly competitive in a statewide election, Arnold Schwarzenegger, was already in the 2003 election noted as atypically moderate, and after winning pursued a broad consensus in transportation and supported California High-Speed Rail. Below the statewide level, the form of mandatory referendums in the state has led to rather consistent funding with specific sales taxes deeded to transportation, to the point that the Los Angeles County MTA has capital funding projections through 2060 with a list of priorities to be funded in each period telegraphed decades in advance.
And neither New York nor California is capable of building. Consistency in funding has not led to the formation of a consistent civil service. Single party dominance, with the Republicans choosing to nominate sacrificial lambs like Larry Elder rather than to moderate enough to win the median voter in a wave election, means that there is no need for political appointments, as professionals know in advance what the state’s ideological direction is going to be, and yet agency upper echelons are stacked with politicals and expect subject matter experts to be silent when the politicals and their staff are in the room. Costs in California are not only high but meteorically rising, in San Francisco, in San Jose, and in Los Angeles. In New York, despite real savings from our advocacy for shrinking station size, the projected costs of IBX are unreal and those of the 125th Street extension are full of lard, the savings wasted on deeper stations and ever higher soft cost charges.
American activists keep talking about the need for consistent funding. But where funding in the United States is the most consistent, outcomes are consistently bad, just as they are in the parts of the United States that are one election away from cancellation. This is not just a bad inheritance – the MTA let its in-house expertise go in favor of a consultant-centric system, and MTA CEO Janno Lieber takes credit for having implemented the globally-failed design-build system locally, with essentially all discourse that isn’t coming from us at the Transit Costs Project backing further privatization and SPDVization of project delivery out of a false belief that London and the knowledge of global English-only consultants are worth imitating.
This way, the MTA, with a capital budget of $13 billion a year and no real fear of large cuts, delivers subway extensions at a rate of about one new underground station per 5 years, 9 stations equipped with elevator access per year, and sporadic commuter rail interventions that never actually improve speed or convenience. Consistent funding is not going to make it better, because its funding is already consistent and yet it is run by politicals who look down on subject matter experts and who have New York solipsism and react acerbically to being told they need to learn, and so it can’t build, only manage its own decline.
Quick Note on Subway Operating Costs
A London Underground benchmarking report using CoMET data from 2013 compared operating cost breakdowns and revenues between the Underground and its international peers. CoMET data is in principle anonymized, but it’s not hard to find which city is which, and in particular, whereas London, Paris, and Berlin all spent around $6/car-km on operations in 2013 costs, New York is the city labeled “Am” that spent $10/car-km.
More recently, I followed up on these costs by looking at 2020s data, finding little for Berlin and even less for Paris, but finding exact costs per car-km for New York and per train-km for London. London has seven cars per train, from which we can impute, in 2024 PPP prices, $6.2/car-km in London; New York’s exact costs are $11.58/car-km. BVG’s costs are bundled across modes, but the total costs for 2024 reported in the Lagebericht und Jahresabschluss 2025 are 1.6B€; if U-Bahn costs per car-km and bus costs per bus-km were as in New York and tram costs per tram-km were as in Boston, the two rail modes compared on a per train length basis (thus, a Berlin U-Bahn train of 100 meters is deemed to be six New York City Subway cars), the total would be exactly twice on a PPP basis. If the same comparison were made with an adjustment for bus speed (17.9 km/h here, 11.3 km/h in New York), make it 1.6B€ vs. 2.6B€. Either way, it’s very likely Berlin’s U-Bahn operating costs are in the $6-7/car-km range in 2024 prices.
All of this is remarkable, because prices between 2013 and 2024 rose, by a factor of 1.34 in the US. And yet, despite this inflation, London more or less kept its operating costs unchanged, New York had an increase of slightly less than half the inflation rate, and Berlin likely had a small increase like New York or even smaller.
Moreover, none of the three systems engaged in massive automation over this period, not even the incremental automation of Paris. Furthermore, New York’s subway costs in the short and medium runs tend to rise when ridership decreases and fall when it increases, as fixed costs are spread across more service; the number of employees per unit of service provided rose when ridership fell after WW2 and fell when it recovered. However, the period 2013-24 was not one of major service increases in any of the cities: all three opened new lines, but only short ones, and none of the three embarked on a scheme to massively increase service – London had some increases but New York if anything provides less service now than it did in the early 2010s. Thus, no short-term shock can explain the over-the-decade fall in real operating costs in all three cities.
This contrasts with buses, which are dominated by variable labor costs. In the United States, the cost of running a bus is the wage of the operator plus various overheads, of which the largest is the wage of the maintenance crew. In Europe, bus driver wages are lower, but buses are also cheaper to procure and more fuel-efficient, and overall the system is dominated by wages rising faster than inflation and by variable and not fixed costs.
The RPA Publishes Bad Report Against Through-Running
The Regional Plan Association released a new report, called New York Penn Station: Constraints and Considerations for Meeting Future Demand. It argues against through-running on the grounds that it would reduce capacity, and asserts that any solution to station capacity after the Gateway tunnel, the Hudson Tunnel Project, opens in the late 2030s must include “station expansion or some other form of system expansion.” There’s something disappointing about this report, not because it’s wrong (although it is) but because it seems to just rehash past arguments without seriously addressing past criticisms of the $17 billion Penn expansion.
The lead author Rachel Weinberger and I talked about Penn Station capacity issues in 2024, after I wrote these two blog posts attacking Amtrak for its assumptions that imply additional tracks are required at Penn Station. Since then, the Effective Transit Alliance has done additional work, modeling the interfaces between the trains, the Penn Station platforms, and the concourses to arrive at feasible dwell times and capacities. Unfortunately, the RPA isn’t really engaging with any of that work, and retreats to just asserting that through-running would reduce capacity at Penn Station.
Capacity and dwell times
The most advanced technical work on the subject of capacity at Penn Station, the question being whether the bare Hudson Tunnel Project can perhaps with minor facelifts provide enough capacity to run 48 trains per hour between New Jersey and New York and the answer being yes, was done in the above-linked ETA report. We found the source of past claims by Amtrak that very long dwell times are necessary and deconstructed their assumptions, and modeled based on the current (post-Moynihan Station project) capacity of vertical circulation elements how long it would take passengers to clear each platform under rush hour assumptions.
The interface between the train and the platform itself is not the limiting factor; my two above linked blog posts from 2024 go over this and find a very short minimum dwell time, of 2 minutes or even less. The limiting factor is vertical circulation between the infamously narrow platforms and the concourses. Nonetheless, passengers can clear these in about 3 minutes. Notably, the narrowest of the platforms, platform 9, is compliant with NFPA 130 and its requirement that passengers be able to clear the platform in case of a fire in 4 minutes; the other platforms (except the wide platform 10) are not compliant, because they have two adjacent tracks and NFPA 130 assumes both tracks can be occupied, in which case the load doubles. Across all platforms, the one with the highest clearing time, platform 4, can clear a 1,620 passenger NJT bilevel in 4.83 minutes. Writing timetables to cycle trains between the platforms so that no platform comes close to having queuing between trains, is a routine exercise.
The report instead asserts that,
The time that the train dwells at the platform is 7 minutes in reasonable operating conditions: 5 minutes to unload passengers, 1 minute to check for stray passengers and then 1 minute for schedule recovery. There’s an additional 2.5 minutes to clear the interlockings and for train safety separations.
Accounting for all these aspects, under reasonable operating conditions, each track can accommodate 6 trains inbound per hour using drop-and-go service.
There is no citation for the model used, nor justification for either the 5 minute figure or for why an additional minute for schedule recovery is required. There is no explanation for why the 2.5 minutes to clear the interlockings matter to the capacity of each platform – once a train is past the platform, it’s gone and the capacity to measure is that of running track, not the platform. On outbound trains, it ominously says that,
The process of bringing an empty train into Penn Station, loading passengers and then departing takes 9 minutes in reasonable operating conditions during the PM peak period. This includes 7 minutes for passengers to hear the track announcement, descend to the platform and load into the train and 2 minutes for schedule recovery.
“Hear the track announcement” is an Americanism. In Germany, the track numbers are printed on one’s ticket, even on intercity trains, even at capacity-constrained stations with track shortages like Köln Hbf. The track for each fixed branch should be scheduled months in advance and known by regular passengers. Precisely because demand is asymmetric – toward Manhattan in the morning, away from Manhattan in the afternoon – the on and off peaks do not coincide at all, and encouraging passengers to get to the platform even before the train arrives would not overload the platform or the access and egress points.
The report completely missed the consequence of the asymmetry of demand when it finally asserted, based on modeling for which the report provides no details, that,
It would take an estimated 6 minutes for passengers to deboard, clear the platform and reach the concourse and another 4 minutes for passengers to descend to the platform and board the train during the AM peak. 2 additional minutes must be added to provide a buffer that ensures schedule adherence. The trains also require 2.5 minutes for clearing interlockings and safety separation, resulting in an hourly capacity of 4 trains per track and potentially 8 per platform.
A good rule of thumb here is that if Munich manages to slot 7 numbered branches, rising to 9 when one includes sub-branches, through one central trunk tunnel with 30 peak trains per hour, and comparable ridership to all three New York commuter rail systems combined, then nobody needs to add 2 minutes to the dwell time for schedule recovery, or 2.5 minutes for interlockings. The RPA is welcome to release its model for why it should take 10 minutes for passengers to board and alight; ours is open for inspection on GitHub and finds that the busier of the two can be done in 3 with a bit of buffer time and the less busy of the two is essentially free since so few passengers ride reverse-peak, and the train can leave even if some passengers that got off it are still on the platform on their way to the escalators.
The Parisian issue
The RPA report doesn’t talk about Paris. It doesn’t rebut the point that the RER is a good comparison case for New York commuter rail capacity, but it’s clearly lurking in the background. It does mention the RER as an ill comparison for the benefits of through-running (see section below), on the grounds that “trains follow each other along the same paths,” whereas in New York there is more and, measured by number of stations if not distance, earlier branching. But it doesn’t really address the point that if the RER can run 24-27 trains per hour per track in each direction, and the Munich S-Bahn can run 30, then so can through-running paths at Penn Station.
Reverse-engineering from what the report does say and from what the biggest points of contention have been when I talked to the RPA on this, they clearly think it matters that the European comparison cases have multiple city center stations to spread the load. Penn Station, in contrast, is the single central business district station, in a high-kurtosis city with far higher job density within walking distance of the station than can be found in any European city.
And yet, as I explained in my second original post from 2024, the effect coming from New York’s single city center station versus Paris’s multiplicity thereof largely cancels out the effect of much higher overall ridership on the RER than on New York commuter rail. Averaged over the peak four hours, the highest resolution I have for Paris, the sum of peak boardings and alightings per train is actually a bit higher on the RER E at Haussmann-Saint-Lazare, as of the 2010s when it was still a terminal, than it was at Penn Station in 2019 just before corona. The same sum at each of Gare du Nord and Gare de Lyon on the RER D is respectively 20% and 15% less than at Penn Station; on the RER B at Gare du Nord, it’s also 20% less. The Gare du Nord numbers are unlinked, so passengers interchanging across the platform between the RER B and D are counted in both trains’ ridership, but from the perspective of the train-to-platform interface, this is still a flow that the train and its doors and platforms must accommodate. If that’s doable in a 55 second dwell time, then trains at Penn Station can unload in 2 minutes at the peak and the rest is just a matter of counting platform-to-concourse vertical circulation elements and adding up their capacities as in the model described in the above section.
The benefits of through-running
Through-running works ideally when there are multiple city center stations, allowing the trains to function as urban rail as well as distribute passengers across multiple destinations. This is well-known to any group pushing through-running in New York, which is why so many such groups advocated for a tunnel connecting Penn Station with Grand Central, the so-called Alternative G in the ARC era in the 2000s, and why Tri-State’s proposal showcases a trunk line from Newark Penn Station to Sunnyside, and why ReThink heavily markets Secaucus and Sunnyside as secondary business centers. Here’s what ETA produced in 2023:
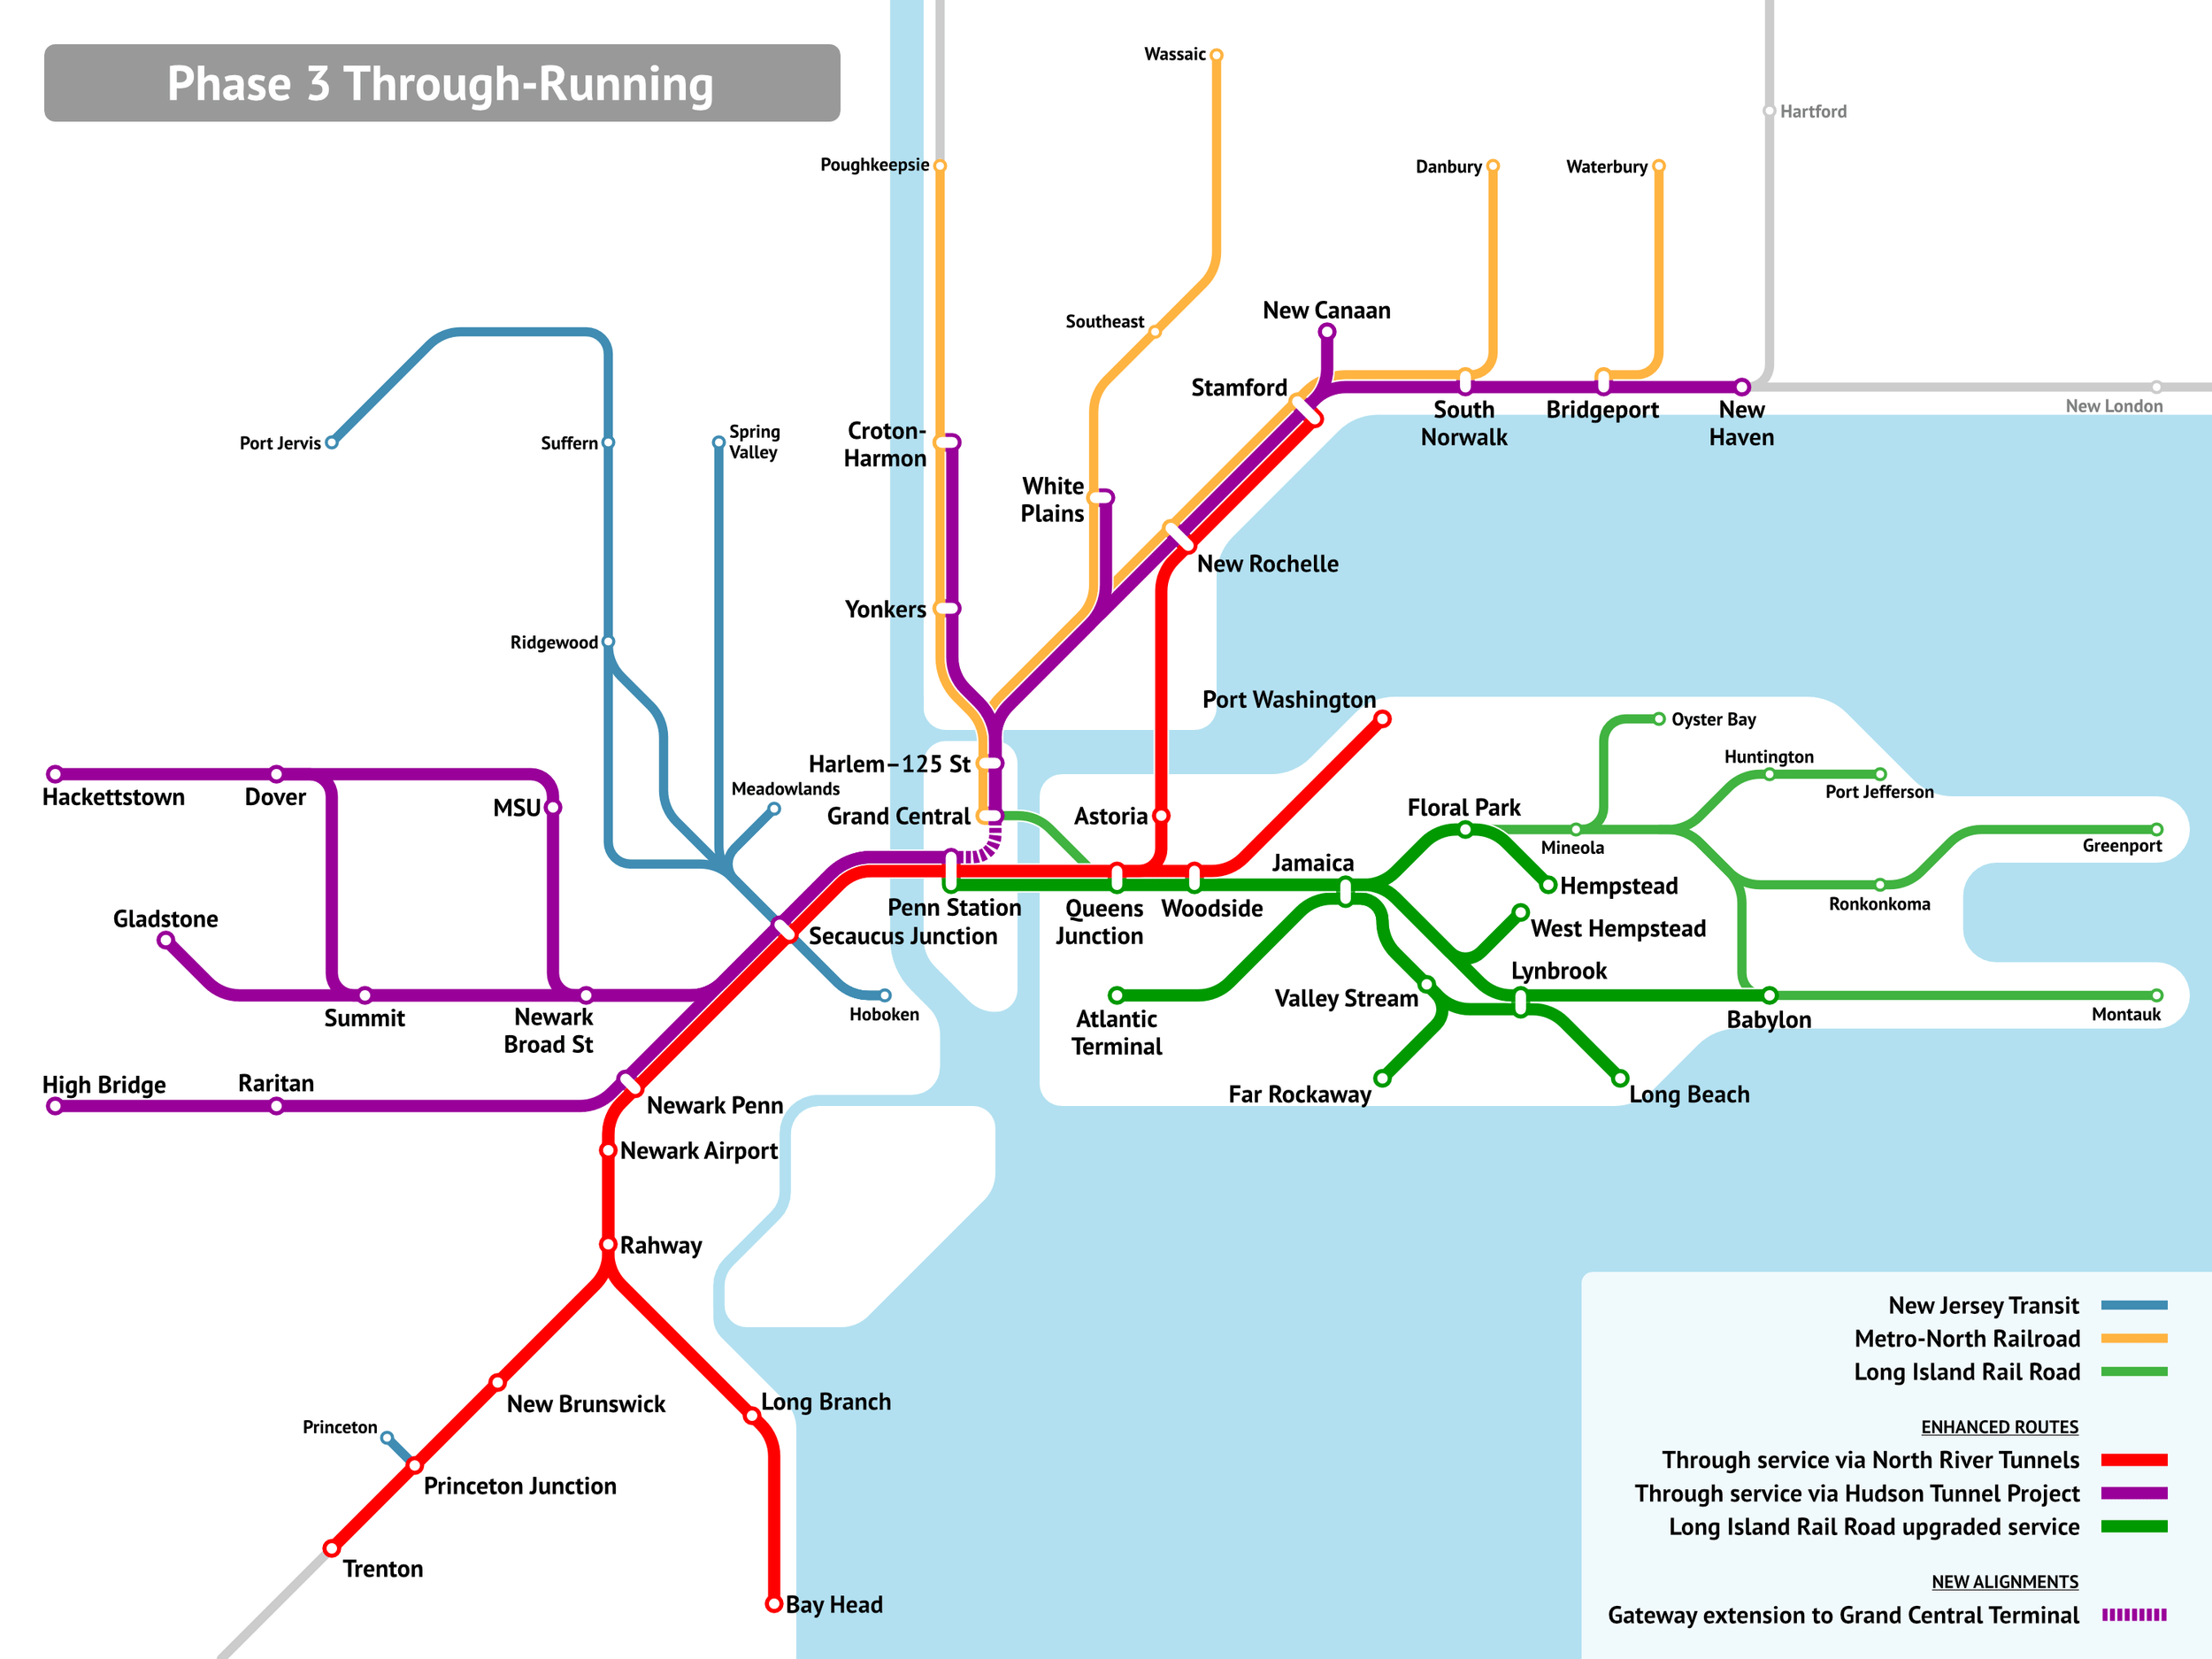
The upshot of this is that even with the dominance of Manhattan, any reasonable through-running system cobbled from existing and under construction infrastructure would unlock commutes from east of the Hudson to Downtown Newark, and from west of the Hudson to Long Island City (the station labeled Queens Junction is essentially Sunnyside Junction, walkable to a large fraction of Long Island City jobs), Flushing, and Jamaica.
It’s important context to understand why the RPA graphics denigrating through-running as limited in use don’t work:
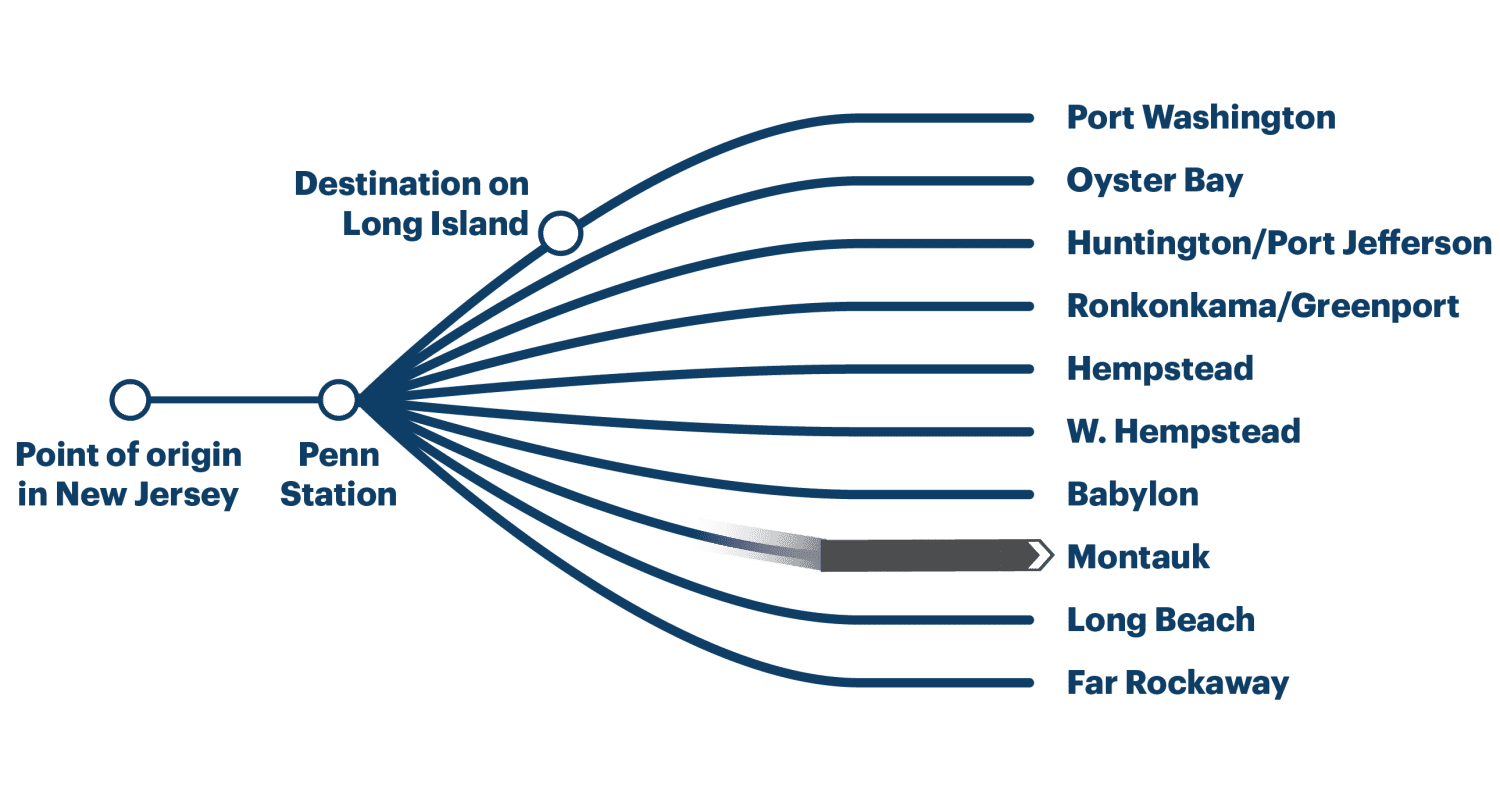
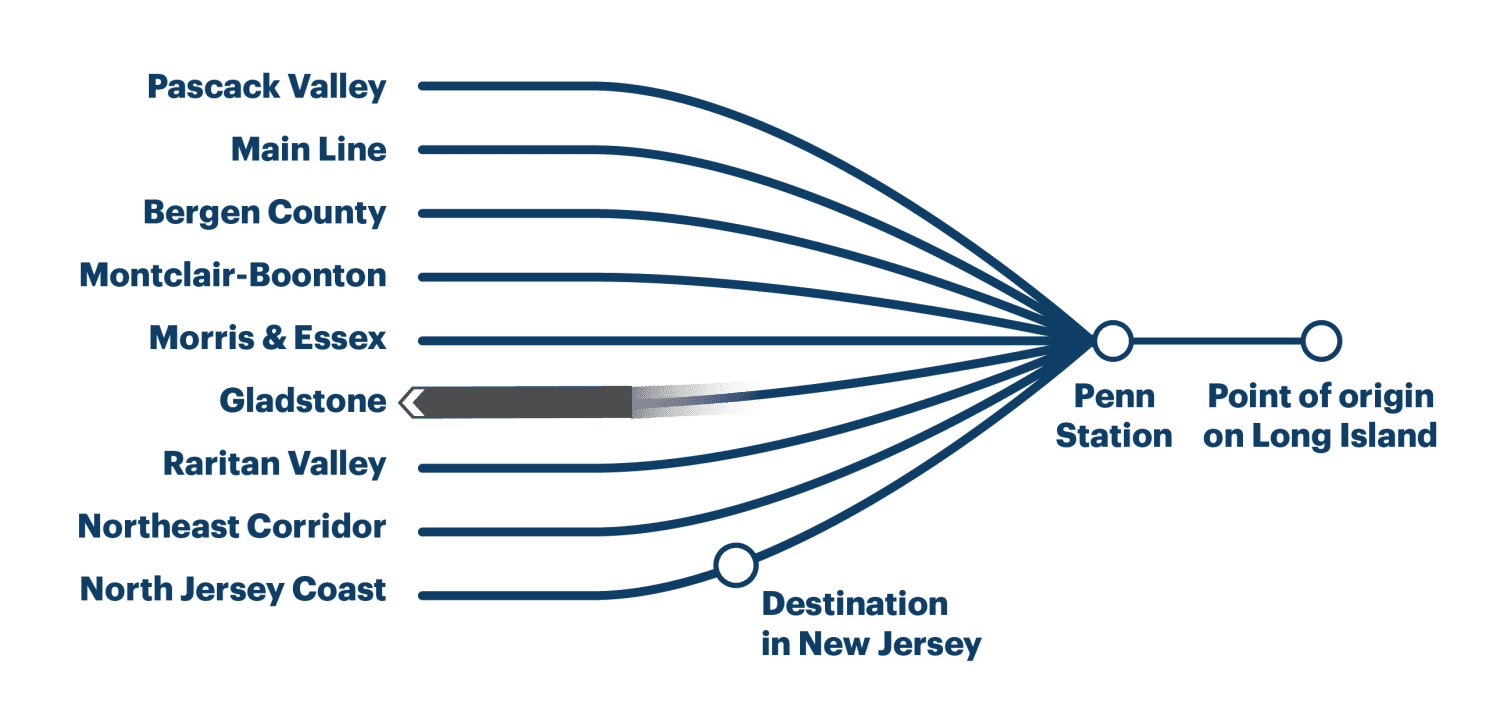
In truth, even setting aside a Penn-Grand Central tunnel (which is doable at MTA construction costs at a lower cost than Penn expansion), the destination in New Jersey is likely to be not just on the North Jersey Coast Line as depicted, but on any of the Northeast Corridor, North Jersey Coast, and Raritan Valley Lines. At present, the first two carry 14 trains per hour at the peak, and are decently likely to be one’s pair east of the Hudson. Similarly, one’s destination east of Penn Station is unlikely to be Long Island as commonly defined to exclude Brooklyn and Queens but rather to be on the trunk in Long Island City or on multiple branches within the city or perhaps on the New Haven Line.
The upshot is a hefty share of the total through-Manhattan market would in fact be served by a through-running system, usually with one-seat rides, or if not then with transfers at Sunnyside or Secaucus rather than New York. Through-running is not about those mythical trips from Oyster Bay to the Jersey Shore that Adirondacker in the comments section mocks, just as it isn’t about trips from Aulnay to IHES on the RER B or from the Marne-la-Vallée branch of the RER A to Saint-Germain-en-Laye. It’s about the overlapping near-center markets, individually small compared with commutes to the central business district and yet collectively significant.
How Much Community Outreach Does the Urban Institute Think Italy and Turkey Do?
The Urban Institute just published a brief about community outreach for public transportation construction projects. The authors are Yonah Freemark, Gabe Samuels, and Christina Plerhoples Stacy; I don’t know the latter two but I know Yonah well and respect him and his expertise and global curiosity. So I honestly don’t understand why the brief concludes that the US’s problem is “inefficient community engagement” and the solution is to do more community engagement early in the process. Worse, the brief for some reason cites Italy and Turkey, via our transit costs reports, as places that do earlier, more effective community engagement, rather than as places with rather top-down decisionmaking and limited citizen voice. It’s sad, because the brief does go over the problems of the American process but can’t bring itself to the right conclusion, namely that community engagement should be curtailed; its only response to the problems of engagement are to suggest earlier engagement rather than less of it.
The brief is, well, brief. I recommend people read it in full. It quickly goes over the usual critiques of the American community engagement process: it is skewed toward higher-income residents, who are likelier to own a car; public meetings attract people with the leisure to attend during business hours; it leads to defensive design such as the reluctance to engage in surface disruption when building subway stations. All of these are real problems. But the brief tries to rescue the idea that public engagement should inform decisions, by criticizing the “decide, announce, defend” mentality of infrastructure project managers and by demanding early engagement.
Then the solutions proposed are a mixed bag. Some are good, and are lumped in with community outreach even when they’re not about any such thing. The invocation of our Italy and Turkey cases is about the public itemization of costs for infrastructure contracts, but this is not about any outreach but rather about contracting transparency for anti-corruption purposes, and the database is not easily legible to the general public. The same is true of in-house expertise, of simplifying project homologation, and of limiting contingencies; unfortunately, the brief frames the latter in the language of “create contingency budget limits” rather than stating the real problem, which is that federal regulations in the last decade began requiring much higher contingency than is normal, 40% rather than the 20% used in Turkey, and these are mirrored in the UK as an ersatz attempt to deal with cost overruns without addressing the underlying cost problems.
In contrast, the invocation of early and representative community engagement is awkward on the same list. The list tries to coast on the reputation of Italy and Turkey among parts of American transit advocacy for low-cost construction in order to justify more involved outreach laws. But neither Italy nor Turkey is a state with strong civil society empowerment in community engagement. Italian infrastructure construction heavily involves different administrative bureaucracies, for protection of labor, the environment, and historical monuments, but not the community. The community does not have the expertise to judge whether some construction technique is a risk to a Renaissance cathedral. Among our low-cost cases, Sweden has higher citizen voice empowerment and even permits some litigation, but far less than the United States or, as of late, the United Kingdom; it too relies extensively on bureaucratic legalism, and the outreach there tends to be done to large collective groups, for example umbrella unions on matters of labor, or a feminist bureaucracy on matters of gender equality.
What makes me bitter about this entire concept is that the good proposals the brief is trying to wed to outreach are about empowering bureaucrats, not civil society. Civil society does not build infrastructure. The administrative state does. Civil society extracts money and betterments from the administrative state whenever it is empowered to do so, because budgets that are third-order for the state are massive wins for petty actors. But 10 third-order items are a second-order item and 10 second-order items are a first-order one, and the costs of veto points and community actors mount. The solution isn’t to involve any such groups early; it is to not involve them at all.
Learning from Many Places is Better than Learning from One
An article from last week about a cost saving push in Seattle made me think again about how learning from lower-cost examples works. As the costs of the majority-above-ground Ballard extension are careening toward the $2 billion/km mark, the agency and civil society are looking for cost savings. Scott Kubly, the former head of the Seattle Department of Transportation, is proposing to reduce the costs of stations by shortening the platforms, citing Copenhagen’s combination of driverless operations and very short trains as a cost saver. Kubly says,
They built it at about a quarter cost. How they did that was shorter, more frequent trains, which leads to smaller stations, which leads to less excavation, which leads to faster delivery and a better passenger experience.
This, to be clear, is at best a second-order saving. The issue is that Copenhagen’s short trains and driverless operations are more or less unique to it, but its medium-low costs aren’t. An honest program of learning from Scandinavia ought to learn from all of the Nordic capitals at once, as much as possible, and focusing on what’s common to them and not on the differences. Stockholm in particular has lower construction costs than Copenhagen these days and has longer trains than Seattle: Stockholm T-bana trains are 140 m long (and Citybanan, with 200 m trains, cost $400 million/km in 2025 prices, less than a quarter as much as Ballard), Link trains are designed up to 116, Copenhagen Metro trains only 39. Nya Tunnelbanan manages lower construction costs than Copenhagen these days, so learning from low-ish Nordic costs should not center the combination of driverless trains and short platforms.
More broadly, this proposal by Kubly (and by the generally good Robert Cruickshank, formerly of California HSR Blog) is convincing me that the real strength of the Transit Costs Project is that we’ve done deep dives into more than one success case. We technically have three low-cost cases: Stockholm, Istanbul, and a selection of Italian cities. But in Stockholm, too, the case looked at trends common to the Nordic countries, namely, the unfortunate tendency in all four to privatize project planning to international design-build consortia. Our conclusion also uses some medium-cost Parisian examples to check itself as well as a few German and Spanish specifics, and we’ve increasingly looked at some Chinese examples, though well short of a full case like our main three. We’re blinder than we’d like to be in East Asia, especially low-cost Korea, but our coverage in Europe is fairly good and we have at least some idea of what’s going on in Latin America. Our ideology is always that it’s most important to look at the commonalities of the places that work when distilling the best practices, rather than on the differences.
This matters, because the average Continental European (or Chinese) just doesn’t think about the United States when doing transportation engineering. A Swede, asked about the features of their transportation program, will focus not on what makes the difference between Scandinavia and the United States, but on the differences between Sweden and the other Nordic countries. The literature I saw when I wrote the Sweden case was replete with intra-Nordic comparisons, on every conceivable measure. Most of the literature came from the country I was researching, but some came from the other three Nordic countries. All of them are like this. Ask a Swedish planner about what makes Nya Tunnelbana work and they’ll cite pertinent features like the drill-and-blast construction method and why it’s superior to tunnel-boring machines, where Copenhagen in fact uses TBMs just fine; ask a Danish one and they’ll talk about the driverless operations and extremely high frequencies.
And this generalizes. Italy has used very short stations and driverless operations to keep down the costs in very small cities like Brescia, and somewhat longer but still short stations in Milan, but Rome Metro Line B1 uses 110 m long trains and was built for $300 million/km in 2025 prices. While Italians talk about this as a cost saver, Manuel Melis Maynar wrote positively of Madrid’s rejection of driverless operations as an example of cost saving through technological conservatism. I don’t doubt that in both cases they were right under the circumstances (Melis having written of extensions built 25 years ago), but just as the medium-low costs of the Nordic countries have to be properly attributed to shared features, the even lower costs in Southern Europe have to be properly attributed.
Far more important than looking at a Copenhagen-specific feature is answering all of the following questions, in increasing order of abstraction:
- How large are the underground stations compared with the train length? How standardized are their designs?
- How standardized are the RFPs for station finishes, signals, and electrical and mechanical systems?
- Is there a single point of homologation for the system, or can a single suburban fire department demand construction in excess of code because the fire department head objects (as happened in Bellevue across Lake Washington)?
- Does contracting follow good practices (i.e. the traditional system as used in Scandinavia until about 15 years ago), or is everything done with layers of consultants managing other consultants with opaque design-build contracts? Are contracts itemized or fixed-price? Is there technical scoring to ensure contractors race to the top and not the bottom?
- How large is the in-house planning and supervision team? Does it have the capacity to manage a project the size of ST3, or even a single subway line like the combination of Ballard and West Seattle?
- Are priorities decided by professionals or by political appointees? Does funding follow the Acquis or possibly another similar system governed by rule of law? Is a cost-benefit analysis mandatory, and do project designers expect that a poor cost-benefit analysis will lead to project cancellation?
Each of these questions, by itself, represents a cost saving larger than anything that could come from shrinking the stations based on driverless operations, a tradeoff that reduces station dig costs but increases systems costs and works in many places but is never going to turn American costs into Southern European or Nordic costs. In contrast, relying on one simple trick like Copenhagen’s requires deep understanding of why each of Copenhagen and Stockholm does what it does, which understanding is unlikely to exist in anyone who doesn’t know that these cities have comparable costs, both a fraction of the United States’.
