Category: Urban Design
Corridor Zoning is not Transit-Oriented Development
Corridor zoning is a style of development, in which major arterial streets are zoned for high residential and commercial density, while side streets remain zoned for low density, sometimes even for single-family housing. Yesterday, a discussion on social media brought up transit-oriented development, so I’d like to explain why corridor zoning is not TOD, in intent or function.
For reference, here’s Yonge Street in Toronto:

And here’s Cambie, in Vancouver:

Both streets have subways running underneath them. Both streets – Yonge far more clearly than Cambie – are characterized by continuous high-density development along the corridor, only extending a block out from it. This is billed as protecting single-family neighborhoods from apartments while also providing opportunities for housing growth; Toronto has fairly YIMBY and Vancouver has very YIMBY housing growth rates, with housing shunted to such corridors and to redevelopable nonresidential sites like Marine Landing. In the United States, corridor zoning can also be found in Seattle, which has nearly the fastest apartment growth rate per capita in the country.
And this is not TOD. The reason is simple: TOD doesn’t care about corridors but about the underlying transit, which is a subway, not a bus stopping every block. From the perspective of a transit user, the walk from the Canada Line 300 meters north-south along Cambie is the same as the walk 300 meters diagonally along Cambie, King Edward, and side streets. Good TOD is therefore measured in terms of walk radius from the station.
Take the following example. TOD zoning might allow a floor area ratio of 3. This is roughly the floor area ratio of the central residential neighborhoods of Berlin, or the inner suburbs of Paris, or much of Upper Manhattan and inner Brooklyn. It can be realized with a six-story building, a common maximum height for North American woodframe construction, using half of a 30 meter deep lot. If these are built 500 meters from a train station, using the taxicab metric, then the resulting 0.5 km^2 area can host around 500,000*0.6*3/45 = 20,000 people at 45 m^2/person with the lots occupying 60% of the area and the streets 40%. This is a cluster that can support a few neighborhood-scale commercial functions, probably at or right next to the station.
The main benefit of corridors is not residential, but commercial. A residential gap in an otherwise commercial corridor will absolutely reduce spontaneity. But continuous commercial development is not achieved through corridor zoning – to the contrary, if the TOD density of FAR 3 can extend sufficiently far from the station, then that density can naturally be developed exclusively away from the corridor, while the corridor itself has the demand for one- and two-story commercial buildings, which can take some residential floors above them in theory but not in practice due to different development needs and different profitability rates. But that’s not corridor zoning – rather, it’s pre-automobile urban development styles, which had isotropic density across an entire neighborhood.

I don’t expect a TOD regime to produce Kreuzberg and Neukölln above. But I do expect it to produce considerable quantities of housing designed around train stations, and if those are modern stations then it’s likely they’re fairly far apart with low-density gaps between high-density pods (but, as much as possible, no residential gaps in commercial corridors). This is not really what’s going on with Canadian corridor zoning, because people can walk in multiple directions, and the explicit purpose of corridor zoning is to concentrate both air pollution and the perceived social pollution of apartment dwellers in quarantine zones that single-family homeowners can avoid. Good TOD practices will therefore drop corridor zoning, and allow much higher density within a radius of several blocks from streets like Yonge, even if it means some single-family homeowners will have to share blocks with mid- and high-rise apartment buildings.
YIMBY First, Building Reform Second
Last night I asked the American building reform advocates on Bluesky about different layouts and why developers don’t build them. I got different answers from different advocates about why the layout I’d just mocked of family-size apartments with two staircases isn’t being built in the US, some about regulations, but Mike Eliason said what I was most afraid of hearing: it’s doable but it’s more profitable to build small apartments. My conclusion from this is that while American and Canadian building regulations remain a problem and need to be realigned with European and Asian norms, they are a secondary issue, the primary one remaining how much housing is permitted to be built in the first place. Developers will keep building the most profitable apartment forms until they run out of the most profitable tenants.
The mockup
The following mockup has a scale of 1 meter = 20 pixels, so the building is overall 18 meters by 30. This is a point access block rather than a double-loaded corridor (see definitions here), but it also has two staircases, emanating from the central access block. Each floor has four apartments, each with three bedrooms and two bathrooms, the ellipses in the image denoting bathtubs. The windows are top and bottom, but not left and right; these are single-aspect apartments, not corner apartments.
On Bluesky, I said the floorplate efficiency is 94%; this comes from assuming the step width and landing length are 1.1 meters each, a metrization of the International Building Code’s 44″, but to get to 94% assumes the staircase walls are included in the 1.1 meter width, so either it’s actually 90 cm width or, counting wall thickness, the efficiency is only 92.5%. The IBC allows 90 cm steps in buildings with an occupancy limit of up to 50, which this building would satisfy in practice at six stories (a three-bedroom apartment marketed to a middle-class clientele averages closer to two than four occupants due to empty nests, divorces, guest rooms, and home offices) but not as a legal limit. Regardless, 92.5% is average by the standards of European point access blocks, whose efficiency is reduced because the apartments are smaller, and very good by those of American double-loaded corridors.
Now, to be clear, this is still illegal in many American jurisdictions, as Alfred Twu pointed out in @-replies. The building mockup above has two means of egress, but the typical American code also requires minimum separation between the two staircases’ access points. This is an entirely useless addition – the main fire safety benefits of two staircases are that a single fire can’t interpose between residents and the stairs if the two staircases are at opposite ends of the building, but that’s not legally required (quarter-point staircases are routine), and that the fire department can vent smoke through one staircase while keeping the other safe, which does not require separation. Nonetheless, this is not the primary reason this isn’t getting built even where it is legal, for example in jurisdictions that permit scissor stairs or have a smaller minimum distance between the two staircases, like Canada.
I was hoping the answer I’d get would be about elevator costs. The elevator in the mockup is European, 1.6*1.75 meters in exterior dimensions; American codes require bigger elevators, which is by itself a second-order issue, but then installation costs rise to the point that developers prefer long buildings on corridors for the lower ratio of elevators to apartments. But nobody mentioned that as a reason.
The rent issue
Mike Eliason responded to my question about why buildings like the above mockup aren’t being built by talking about market conditions. The above building, with 540 m^2 of built-up area per floor, can host four three-bedroom apartments, each around 127 m^2, or it can host 16 studios, each around 29 m^2. In Seattle, the studio can rent for $1,500/month; the three-bedroom will struggle to earn the proportionate $6,000/month.
It’s worth unpacking what causes these market conditions. The three-bedroom is marketed to a family with children. The children do not earn money, and, until they reach kindergarten age, cost thousands of dollars a month each in daycare fees; if they don’t go to daycare then it means the family only has one income, which means it definitely can’t afford to compete for building space with four singles who’d take four studios, or it has parents in the immediate vicinity, which is rare in a large, internally mobile country. The family has options to outbid the four singles, but they’re limited and require the family to be rather wealthy – two incomes are obligatory, at high enough levels to be able to take the hit from taxes and daycare; the family would also need to be wedded to living in the city, since the suburbs’ housing is designed entirely for families, whereas the singles take a serious hit to living standards from suburbanizing (they’d have to get housemates). In effect, the broad middle and lower middle classes could afford the studios as singles, but only the uppermost reaches of the middle class can pay $6,000/month for the three-bedroom.
In economic statistics, imputation of living standards for different household sizes takes this degressivity of income – $6,000/month for a family of four is a struggle, $1,500/month for a single is affordable on the average US wage – and uses a hedonic adjustment for household sizes. example by taking the square root of household size as the number of true consumption units. To INSEE, a family of four has 2.1 equivalent consumption units; elsewhere, it’s a square root, so it has 2 consumption units. A rental system that maintains a 4:1 ratio has no way for the family to compete.
The upshot is that the developers need to run out of the tenants who can most easily afford rent before they build for the rest. Normally it’s treated as a matter of distribution of units among different social classes, but here it’s a matter of the physical size of the unit. This is why YIMBY first is so important: eventually developers will run out of singles and then have to build for families.
Building for Wealth, and Point Access Blocks
The biggest housing activism push in North America right now has moved on from YIMBYism to housing reforms to allow single-stair mid-rise buildings, called point access blocks. My off-hand reference to this last post ended up being the main issue debated in comments; this compounds a post by Matt Yglesias from November that I’ve been meaning to respond to, since he starts working off of some examples of double-stair buildings on corridors in an even older post of mine about the Kowloon Walled City in My Backward (KWCIMBY) meme. I strongly respect the main point access block activists pushing the issue, like Stephen Smith, so I’d like to revisit the KWCIMBY post and explain what I’m doing there, while also pushing back against some of the more iffy claims portraying point access blocks as not just more efficient but also inherently better for families. In short, both forms of housing are generally easier to build in a more affluent society with higher expectations, and some of the comparisons come from that.
What are the point access block and double-loaded corridor?
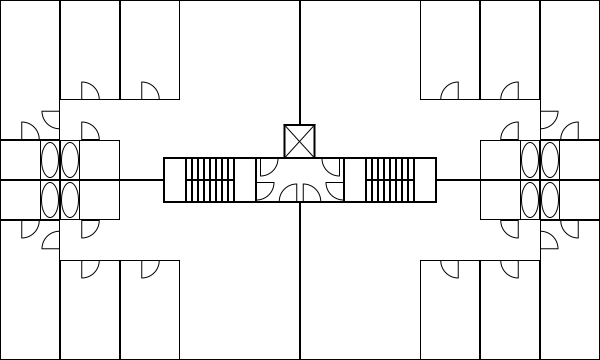
An apartment building can arrange its apartments on each floor in one of these ways. The KWCIMBY post assumes double-loaded corridors, as in the diagram below:

In each of these buildings, there are two staircases, as required by American and Canadian law; the first building has scissor stairs, forbidden in most of the US but allowed in New York, whereas the second separates the two staircases into opposite sides of the corridor. Apartments are on both sides of the corridor, with one aspect of windows except the corner units, hence the term double-loaded.
This building form is practically unheard of in European apartment buildings. Only one staircase is required per building, so architects instead slice the buildings into thinner pieces, with one staircase and an elevator and apartments radiating from the common area, called a point access block:

Each of the four access points has an elevator and a staircase; the first example has four apartments per floor, with one aspect per unit, whereas the second has two, with two aspects, both north and south. The result is more elevators and staircases per net floor area, but less corridor area; the floorplate efficiency is notably higher, 92.5% in the first case and 94% in the second case, compared with 89.5% in the first case of the double-loaded corridor and 86.67% in the second. This is one of the reasons Stephen is so focused on elevator costs.
All four buildings are 20 meters by 80, except the last, which is 14 by 80. 20 meter wide residential buildings are more or less unheard of in Central Europe – I see a few that are 18, in what look like higher-income neighborhoods to me. In contrast, 14 is standard in Central Europe, with some buildings looking like the above diagram, and others, almost always older ones, having wings that are still around 14 meters wide but end up with an area-to-external-width ratio of 8-9 meters, rather like a 16-18 meter wide building without wings. In practice, on a 100*100 block, we’d never have two buildings looking like an equal sign but rather an enclosed rectangle, with or without wings.
What about the single-loaded corridor?
A third housing typology puts all apartments on a corridor, but only in one direction. The corridor is then in the open air, and apartments have windows on both sides, to the corridor and in the opposite direction. I lived in such a place for a year in Berlin. This is not unheard of, but still rare. The width of such buildings is limited by the need for apartments to stretch all the way, limiting them to at most 14 meters and usually less.
The resulting floorplate efficiency is low, which turns this into a question of how much cheaper it is to build an external corridor than an internal one. When I asked on Bluesky, I was given ranges for the answer, from an external corridor being 25-50% cheaper to its being if anything more expensive. Temporary worker housing tends to use this form because it is built to lower standards, in which the external corridor is just some barred steel without protection from the elements above, which should reduce the cost of the corridor. This form still exists in permanent housing, with concrete corridors that offer protection from rain, but it’s less common than the other two.
Point access blocks and families
The biggest selling points of the point access block are that it has better floor plate efficiency and that it permits units with multiple aspects to allow for cross-ventilation and for strategic placement of rooms (living room facing the street, bedrooms facing the quieter internal courtyard of the euroblock). This is bundled with other issues, at the same time:
- In Europe, buildings are almost never built out of wood, and if they are, it’s usually mass timber. This means that the cost of construction is proportional to floor area, largely linear in the number of floors for a given footprint. North American construction uses light wood on a concrete podium, sharply limiting height to six to seven stories, hence the preference for thicker buildings to increase floor area. In turn, light wood is less safe in fires – but those codes don’t exempt concrete buildings from the two staircase requirement.
- The double-loaded corridor has units so deep that bedrooms come with their own bathrooms and walk-in closets. Absent these, the maximum usable depth of a bedroom is about 6 meters. Bathrooms cost more to build per square meter than bedrooms and living rooms, which drives up construction costs.
- The double-loaded corridor makes it easier to build units with fewer bedrooms – it’s just a matter of how much corridor width the apartment takes, so costs are linear in the floor area of units. The point access block instead prefers larger units, in square meters, since larger apartments have higher floorplate efficiency, and it’s routine to build a cheaper three-bedroom, one-bathroom unit.
The last two points have been used by some urbanists, especially more conservative ones, to argue that the point access block is inherently family-friendlier. The argument made by Mike Eliason (who’s not at all conservative) is that Seattle, where he’s based, builds multifamily housing rapidly but all of it is studios and one- and two-bedroom units, on the expectation that families with children should eventually move to the suburbs.
More conservative people even relate that with low urban American birthrates, which always comes off as strange to me given how low European birthrates are. The one developed country with above-replacement birthrates, Israel, doesn’t use any of these forms, but instead has independent buildings, some mid-rise and some tall – and there’s consensus among European and American urbanists that tall buildings are bad for families. At any rate, the Israeli sociologists I read on the subject, like Sergio Della Pergola, attribute Israeli birthrate exceptionalism to other issues than built form, just as Singapore’s Paulin Tay Straughan attributes the very low birthrates in rich Asia to other issues.
The difficulty of relating the issue of housing forms with that of apartment sizes is that housing a family requires a lot of apartment space to go to people who are not working, because they are children. If housing is expensive due to high construction costs, restrictions on building, or both, then housing will be built for the rich, which means not just high-income earners, but also households with a high income per person, which are almost always ones without children. A developer building a double-loaded corridor making a choice between a one-bedroom, say 6*9 meters, and a three-bedroom, say 12*9 meters, will choose the former if two independent households can outbid a family. This is getting to the point that in urban America, it’s normal for unmarried adults to live with housemates, because there are a lot more three- than one-bedroom apartments in cities that don’t build much housing, like New York or Boston.
The family could outbid the single person, but not in all circumstances. A two-income family can do well, and the working adults are likely to be older than the single person and thus higher earners. A landlord of a fixed apartment choosing who to rent to would also prefer the family to the group of three to four housemates – the family is more stable, divorce being far less common than housemates leaving with little prior notice. But not all families have two earners (and the social conservatives who are most anxious about family housing tend toward one income, not two), or two middle-class earners, and so far American developers haven’t yet run out of demand for single people and childless couples to build for.
Point access blocks and wealth
In a way, the point access block has benefits that aren’t yet unlocked in Europe. Higher wealth is spent on, among other things, bigger dwellings. The double-loaded corridor in a way bakes in assumptions of private bathrooms, essentially spending income on higher-cost elements. But it’s possible to do the same with a point access block. The point access block ends up more efficient when apartments are bigger, because it’s limited by number of units per floor, and the bigger the units, the smaller the proportion of the unrentable common areas.
Speaking of common areas, higher wealth doesn’t necessarily demand of them. If the expectation is that people should have a washing machine and a drier at home rather than in a common area, then the demand for such an area shrinks. Trash rooms take up more space, but then higher wealth, as opposed to higher inequality, means not just that the demand for trash rooms is higher but also that the supply of workers to staff them is scarcer, and at the end of the day people can just haul trash bags to a collection point in the courtyard or a side room on the ground floor. Trash chutes are an innovation that doesn’t take up common space (for one, they can be installed in-unit, especially if there are only two units per floor anyway). High-end condo amenities like private gyms are usually provided at the scale of an entire building rather than a floor, and a complex of interconnected buildings is likely to have just one either way.
In the examples I posted above, in a way I baked in a wealth assumption, in that the option with two units per access point assumes those units average 132 m^2, which is very high for Europe; the norm for high-end buildings here is three units, with slightly lower combined floor area than 264 m^2, and the same or a hair higher circulation area to allow for a third door, with the smaller apartment usually only having one aspect of exposure. A 132 m^2 unit, in effect 10*14 with slight recessing at one end, would generously have four bedrooms, likely configured as three actual bedrooms and a private office or guest room. The intended users would be families of means, but then again new housing tends to be built for this class, and over time, growth and abundance make the standards that today mark middle-class wealth more widespread across classes. The working class once didn’t have indoor plumbing.
Quick Note: the Experience of Train Stations
I was at a ReThink event about Penn Station the other day; it didn’t talk about through-running but about Penn Station redesign, as Richard Cameron presented options for rebuilding the station in-place, of course without expansion a block to the south. The presentation was interesting, and I have no strong opinions about the architecture, certainly no objection. But something said in there, I forget if by Richard or one of the other presenters, irked me: the presenter was complaining about the Penn Station rebuild of the 1960s saying that the station makes people feel irritated, whereas European train stations are grand and make people feel like they stepped through a gateway into the country. And that part lost me, because my experience of train stations in Europe is rather utilitarian, and so is the experience of rail riders here who I speak with. In fact, in a key way – namely, connections to the subway – I do not see a difference between those stations and Penn Station as it exists today, as an entirely subterranean complex without natural light.
Case in point: three weeks ago, I was visiting Rome for 2.5 days. I wrote about the train trip, which was rather slow as long sections have not been upgraded to high-speed rail standards, but not about the stations. Now that I saw the ReThink presentation, it’s worthwhile talking about the stations – Berlin, Munich, Rome. (I also connected at Verona and Bolzano but these are small stations in small cities.)
Roma Termini, in particular, is supposed to be a gateway station, exactly the kind in a European capital that Americans are supposed to love. Except, I didn’t get to experience any of the façade, because my ultimate destination was not within walking distance, so I connected to the metro, entirely indoors and underground. Lines A and B meet at Termini, and I spent far longer between when I got off the Frecciarossa and when I got on the subway navigating the passageways to this station than getting to appreciate any grandeur. Most of the other people in my car didn’t even do that, but rather hopped off one station before, at the more utilitarian Tiburtina, saving themselves the slow terminal approach and connecting more directly to Line B.
Berlin and Munich, which I’m more familiar with, are rather utilitarian. These are large complexes, in which it’s well-known that passengers can take some time getting from one set of platforms to another. They are also extensively daylit, and Berlin in particular has good sight lines for a five-level cruciform station, but their purpose isn’t to make people feel at ease; in fact most users scramble for a connection to the U- and S-Bahn, where form entirely follows function.
This experience also generalizes to the Parisian stations I’ve used. Gare de l’Est looked nice, in the one minute I spent there between getting off the Métro and getting on my train to Saarbrücken; I appreciated how fast this was, especially since I had booked a nonrefundable day trip and showed up at the station four minutes before my train departed, but I wouldn’t say any of this experience put me at ease. At none of these stations did the architectural details matter very much, and at none of them did the main entrance matter at all, because like virtually everyone else in Paris, I got there by Métro. Berlin Hauptbahnhof, at least, is modern enough that it understands this and doesn’t try to build the entrances as a cathedral to the power and wealth of the institution that built it.
Rather, what I think makes Americans feel differently about Europe is that when they’re here, they’re on vacation. The train stations make them feel relaxed, because they’re on vacation and relaxing anyway. The architecture puts them at ease, because they’re on vacation and have time to stop and admire the details. The walkable cities are pleasant, because they’re on vacation and their goal is to find things they don’t get at home to buy or eat or photograph; this way, I see American urbanists extoll the walkability of small towns with farmers’ markets even when those towns have rather American modal splits and the local residents do all of their shopping at hypermarkets. Europeans can be pretty solipsistic, but I at least don’t see people here talk about some aspect of Florida or Las Vegas is inherently psychologically relaxing.
This matters, because there are real advantages to European rail and urban planning. These aren’t just operational; for example, Stephen Smith and Mike Eliason have more or less singlehandedly imported single-stair point access blocks into American policy discussion. In rail planning, I wish the agencies using Penn Station came to Berlin and saw how a 21st-century major city station looks. But none of this can come from trying to psychologically project one’s own vacation experience. Europe is a place of production and not just consumption, and it’s critical to see what this production looks like from the inside.
Militarized and Other New Capital Cities
The news of the ongoing construction of Nusantara, Indonesia’s new capital in Borneo to replace Jakarta, got me thinking about other moves by various countries to create new capitals from scratch, to avoid having to deal with the urbanity of the existing capital. On this issue, Nusantara joins Brasilia, Islamabad, (at the subnational level) Chandigarh, and, most ominously, Naypyidaw and Egypt’s New Administrative Capital (NAC). The last two, unlike Nusantara, are built for explicitly military purposes, with the military considering the people to be its main adversary rather than any external enemy. Such capitals always waste money that could be spent on improving literally anything else – health, education, transportation, water, electricity, business climate, anti-poverty grants. In the less militarized cases, like Brasilia, these are just waste; in the more militarized cases, these showcase that the state is run by parasites.
Non-militarized cases
The move to Nusantara is being justified on the grounds that Jakarta is sinking. In truth, it’s better to view this as a continuation of the Transmigrasi program that the state has engaged in for decades. The zeitgeist was one of concerns about overpopulation leading to either forced sterilization of the poor or a program of settlement by the core population in peripheral regions; in Indonesia, this took the form of encouraging Javans to settle elsewhere in the country, where in practice they formed an overclass and sidelined the preexisting population. Nusantara, in a mostly undeveloped part of Borneo, needs to be viewed within this program, rather than as a tragic response to climate change.
Brasilia, similarly, was built on developmentalist grounds: the Brazilian elite wanted to develop the interior of the country, viewing the rainforest and savanna as low-value land to be mined and farmed. As this process predates the military dictatorship (1964-85; Brasilia was founded 1960), this is not really a matter of militarization. Rather, it’s better viewed as developmental failure – the resources invested in the new city could have gone to more productive uses, and the value of that land for farming and mining turned out not to be much.
The environmental impacts of the program of developing the interior were wholly negative. In Brazil, half of the country’s greenhouse gas emissions are land use changes and another quarter are from the agriculture sector, leading Brazil to emit 10.7 t/capita in greenhouse gases. In Germany, the figure is 8.1 t/capita, with a large industrial sector and an infamously still substantial coal sector, and on these lower emissions, Germany produces close to four times Brazil’s GDP per capita. The environmental impact of Nusantara is likely to be the same in direction as Brazil’s program, and to the extent it’s likely to be smaller in magnitude, it’s because it’s a smaller endeavor than Brazil’s entire program of developing the interior, in which Brasilia was just one component.
Militarized cases
The worst are not Brasilia, or likely Nusantara, but rather Naypyidaw and the NAC. I’ve been asked to provide some resources on social media, going over what’s involved in both projects.
Naypyidaw
The military junta that ran Myanmar between 1962 and 2011 (with significant tightening in 1988) and has run it since 2021, and exercised significant power between 2011 and 2011, built the new capital, officially since 2005, unofficially since a few years earlier, at a remote location 320 kilometers from Yangon and 240 from Mandalay. After the 1988 protests and the crackdown establishing the military government that 1990s-2000s human rights advocates knew and hated, the regime made changes to Yangon to suppress future protests, evicting 500,000 people from city center in the process. Where normally such efforts mostly target poor people in order to create the illusion of a poverty-free city center and facilitate urban renewal, in Yangon the evictions targeted the middle class, which was sympathetic to the protest movement and had communities that had sheltered protesters. But even the new Yangon was not good enough for the generals, and so they shifted to Naypyidaw.
Part of the reason was that Yangon was too multiethnic, in a part of the country that was majority-Mon until the 20th century, while Naypyidaw could be more comfortably Bamar. But the main reason was security needs. The adversary in this case is not any foreign government – a city built in 2005 by a government that might worry about American-led regime change would look at what was going on in Iraq and opt to maintain its capital in a large, dense central city to facilitate insurgency and make it easy to hide among the civilian population. Naypyidaw instead does the exact opposite – it’s easy for a superior military force to take. Rather, its threat model is a popular uprising, and thus the modernist planning with separation of uses exists to prevent the broad public from being able to stage an insurgency. There is extensive regime propaganda in the city, such as national museums telling uncritical histories, but no major religious sites, since those might shelter protesters, as happened in 1988.
The urbanism of Naypyidaw is, essentially, a giant military camp. It is designed with strict separation of uses and large roads between different complexes for movement between them; people are not expected to walk between places. The Guardian calls it a post-apocalyptic suburbia, but I don’t think that’s quite right. In an auto-oriented American city, there’s nowhere to walk, but everyone owns a car and the development forms make it convenient to drive to one’s work and regular non-work destinations. Dubai, criticized vociferously among urbanists for its tackiness and auto-oriented character, is a place where one can drive or be driven to shopping malls and towers within a close distance. Naypyidaw doesn’t have any of this and doesn’t seem to even try; it’s a collection of sites, designed for no need but that of control by the military of a population that does not want to be controlled by it. It’s a monument not to modernist urbanism, though it tries to affect that, but rather to destruction of value by an unwanted government.
New Administrative Capital
The situation in Egypt, to be clear, is a lot less brutal than in Burma. At the same time, Egypt is several times richer, which creates more value that can be extracted and given over to cronies. This can be seen in the construction of the NAC, to replace Cairo.
The immediate history of the NAC is that in 2011, Egypt famously had the Arab Spring revolution overthrowing Hosni Mubarak; in the subsequent election, the only preexisting organized political force, the Muslim Brotherhood, won the election, leading Mohamed Morsi to take office as president starting in 2012. The election was free and the state of civil liberties improved, but the Muslim Brotherhood was making moves to consolidate power, leading to fears among human rights and democracy protesters of new authoritarianism, which led to a protest movement in 2013 called Tamarod, demanding new elections; later in the same year, the military reacted to the protests by launching a coup, removing Morsi from power and restoring the military elements of the prior regime, including a pardon of Mubarak, who was on trial for corruption. Eventually, the chief of the Egyptian Armed Forces, General Abdel Fattah al-Sisi, won a rigged presidential election in 2014, and has been president ever since. Much of the focus of the protest movements was street protests in Cairo, where Tahrir Square became a global metonym for democracy protests (for example, in Israel, where people basically never draw any positive inspiration from Arab political trends). This created a need among Sisi and his inner circle for a new capital in the desert, built to forestall any future Tahrir.
The capital could not even be named New Cairo, because there’s already a New Cairo, an eastern suburb of Cairo built expressly in order to decentralize the capital; Cairo is a huge, dense city. For a while, it was mocked as New New Cairo, for its location even farther east of New Cairo; by now, it has the formal name New Administrative Capital, with construction having begun in 2016.
The NAC is designed around digital surveillance of the population, and showcasing that Egypt can develop the desert, and maybe decongesting Cairo. It has pretenses of being the next Dubai, but where Dubai invites global starchitects to buy prestige, the NAC is instead giving contracts to domestic elites (as was also the case for Naypyidaw); the military directly owns 51% of the agency developing the NAC and the state ministry of housing only 49%, and the contracts are designed to enrich people who are politically connected to the government.
The violence levels involved are, again, much lower than in Burma. But precisely because Egypt’s economy is solidly middle-income, it’s frustrating to see vast sums wasted on a military prestige project. Cairo’s congestion and overcrowding have a well-known solution, in the form of building a rapid transit network to facilitate non-car commutes, and connect not just the existing built-up area to the urban core but also to-be-built areas adjacent to it. It’s a metro area of 22 million people, about the same size as New York, but only has a three-line, 100 km metro network. These 100 km should be closer to 1,000.
To be clear, there is some development of the Cairo Metro. Line 3 is being extended as we speak, with a new section having opened this month. Overall, the third phase of the line, 17 km long, cost 40.7 billion Egyptian pounds per a statement in 2012, which in contemporary dollars is $2.6 billion in exchange rate terms and $9 billion in 2021 PPP terms. On Google Earth, it looks like 9 km of the line are underground and 8 km are elevated or at-grade; this more than $500 million/km cost is not even fully-underground. This is a line where the main contractor is Orascom – this isn’t a case of outsourcing the state to Japan, China, or both, and therefore building at high costs, as is common in Bangladesh, Pakistan, and Southeast Asia. Rather, this is entirely domestic waste. Most likely, the same contractors that are profiteering off of public money through the construction of the NAC are also profiteering off of public money for what little infrastructure the military government deigns to build in the capital that people actually live in.
The Future of Congestion Pricing in New York
New York just passed congestion pricing, to begin operation on June 30th. The magazine Vital City published an issue dedicated to this policy two days ago; among the articles about it is one by me, about public transportation investments. People should read the entire article; here I’d like to both give more context and discuss some of the other articles in the issue. Much of this comes from what I said to editor Josh Greenman when discussing the pitch for the piece, and how I interpret the other pieces in the same context. The most basic point, for me, is that what matters is if the overall quality of public transit in and around New York is seen to improve in the next 5-10 years. In particular, if congestion pricing is paired with one specific thing (such as a new subway line) and it improves but the rest of the system is seen to decline, then it will not help, and instead people will be cynical about government actions like this and come to oppose further programs and even call for repealing the congestion tax.
The other articles in the issue
There are 10 articles in this issue. One is my own. Another is by Josh, explaining the background to congestion pricing and setting up the other nine articles. The other eight were written by John Surico, Sam Schwartz, Becca Baird-Remba, Austin Celestin, Howard Yaruss, Nicole Gelinas, Vishaan Chakrabarti, and Henry Grabar, and I recommend that people read all of them, for different perspectives.
The general themes the nine of us have covered, not all equally, include,
- How to use congestion pricing to improve transportation alternatives (me on transit investment, Yaruss on transit fare cuts, Nicole and Chakrabarti on active transportation, Henry on removing parking to improve pedestrian safety).
- The unpopularity of congestion pricing and what it portends (Surico about polling, Becca about business group opposition, Schwartz on political risk, Yaruss again on why the fare cut is wise); of note, none of the authors are coming out against congestion pricing, just warning that it will need to deliver tangible benefits to remain popular, and Surico is making the point that in London and Stockholm, congestion pricing was unpopular until it took effect, after which it was popular enough that new center-right leadership did not repeal it.
- Environmental justice issues (Becca and Celestin): my article points out that traffic levels fell within the London congestion zone but not outside it, and Becca and Celestin both point out that the projections in New York are for traffic levels outside the zone not to improve and possibly to worsen, in particular in asthma-stricken Upper Manhattan and the Bronx, Celestin going more deeply into this point and correctly lamenting that not enough transit improvements are intended to go into these areas. The only things I can add to this are that for environmental justice, two good investment targets include a 125th Street subway tunnel extending Second Avenue Subway and battery-electric buses at depots to reduce pollution.
- Problems with toll evasion (Schwartz and Yaruss): there’s a growing trend of intentional defacement of license plates by the cars’ own drivers, to make them unreadable by traffic camera and avoid paying tolls, which could complicate revenue collection under congestion pricing.
The need for broad success
When discussing my article with Josh, before I wrote it, we talked about the idea of connecting congestion pricing to specific improvements. My lane would be specific transit improvements, like new lines, elevator access at existing stations, and so on, and similarly, Nicole, Henry, Chakrabarti, and Yaruss proposed their own points. But at the same time, it’s not possible to just make one thing work and say “this was funded by congestion pricing.” The entire system has to both be better and look better, the latter since visible revenue collection by the state like congestion pricing or new taxes are always on the chopping block for populist politicians if the state is too unpopular.
The example I gave Josh when we talked was the TGV. The TGV is a clear success as transportation; it is also, unlike congestion pricing, politically safe, in the sense that nobody seriously proposes eliminating it or slowing it down, and the only controversy is about the construction of new, financially marginal lines augmenting the core lilnes. However, the success of the TGV has not prevented populists and people who generally mistrust the state from claiming that things are actually bad; in France, they are often animated by New Left nostalgia for when they could ride slow, cheap trains everywhere, and since they were young then, the long trip times and wait times didn’t matter to them. Such nostalgics complain that regional trains, connecting city pairs where the train has not been competitive with cars since mass motorization and only survived so long as people were too poor to afford cars, are getting worse. Even though ridership in France is up, this specific use case (which by the 1980s was already moribund) is down, leading to mistrust. Unfortunately, while the TGV is politically safe in France, this corner case is used by German rail advocates to argue against the construction of a connected high-speed rail network here, as those corner case trains are better in Germany (while still not carrying much traffic).
The most important conclusion of the story of the TGV is that France needs to keep its high-speed system but adopt German operations, just as Germany needs to adopt French high-speed rail. But in the case of New York, the important lesson to extract is that if the MTA does one thing that I or Nicole or Henry or Chakrabarti or Yaruss called for while neglecting the broad system, people will not be happy. If the MTA builds subway lines with the projected $1 billion a year in revenue, politicians will say “this subway line has been built with congestion pricing revenue,” and then riders will see declines in reliability, frequency, speed, and cleanliness elsewhere and learn to be cynical of the state and oppose further support for the state’s transit operations.
The MTA could split the difference among what we propose. As I mentioned above, I find Celestin’s points about environmental justice compelling, and want to see improvements including new subways in at-risk areas, bus depot electrification to reduce pollution, and commuter rail improvements making it usable by city residents and not just suburbanites (Celestin mentions frequency; to that I’ll add fare integration). Nicole, Henry, and Chakrabarti are proposing street space reallocation, which doesn’t cost much money, but does cost political capital and requires the public to be broadly trusting of the state’s promises on transportation. The problem with doing an all-of-the-above program is that at the end of the day, projected congestion pricing revenue is $1 billion a year and the MTA capital program is $11 billion a year; the new revenue is secondary, and my usual bête noire, construction costs, is primary.
Trucking and Grocery Prices
In dedication to people who argue in favor of urban motorways on the grounds that they’re necessary for truck access and cheap consumer goods, here are, at the same scale, the motorway networks of New York, London, Paris, and Berlin. While perusing these maps, note that grocery prices in New York are significantly higher than in its European counterparts. Boston is included as well, for an example of an American city with fewer inherent access issues coming from wide rivers with few bridges; grocery prices in Boston are lower than in New York but higher than in Paris and Berlin (I don’t remember how London compares).
The maps
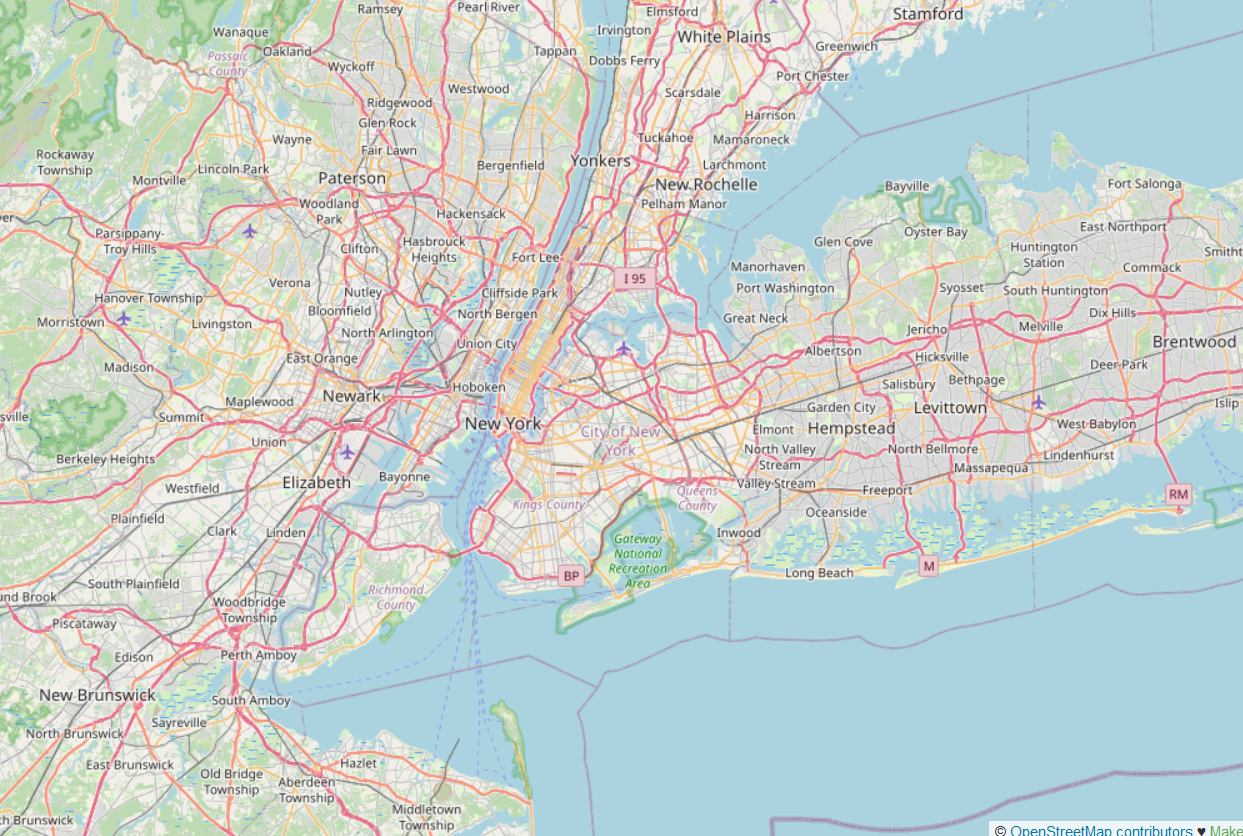

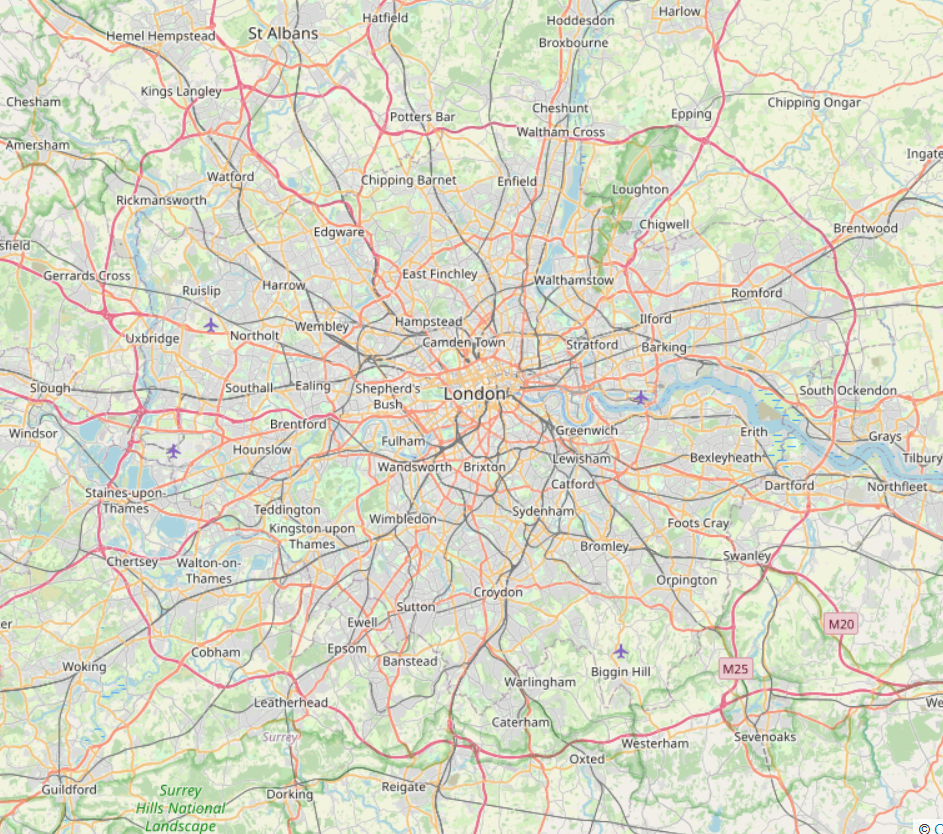

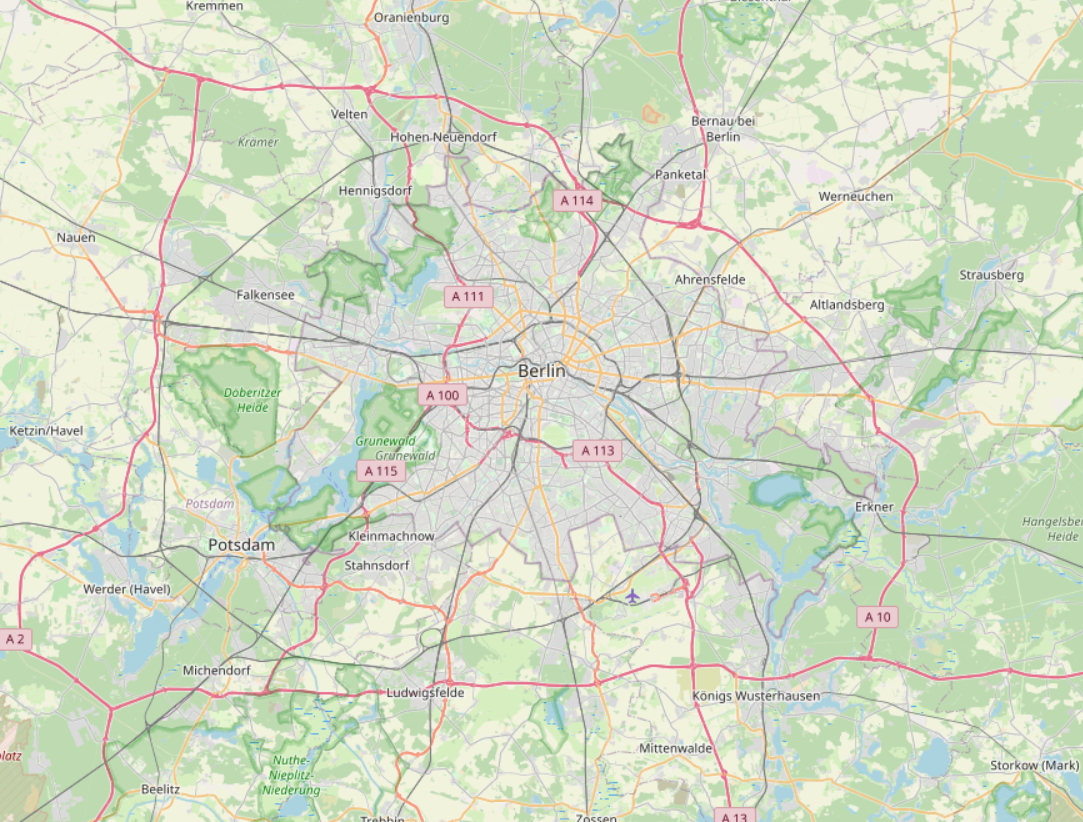
The scale isn’t exactly the same – it’s all sampled from the same zoom level on OpenStreetMaps; New York is at 40° 45′ N and Berlin is at 52° 30′ N, so technically the Berlin map is at a 1.25 times closer zoom level than the New York map, and the others are in between. But it’s close. Motorways are in red; the Périphérique, delineating the boundary between Paris and its suburbs, is a full freeway, but is inconsistently depicted in red, since it gives right-of-way to entering over through-traffic, typical for regular roads but not of freeways, even though otherwise it is built to freeway standards.
Discussion
The Périphérique is at city limits; within it, 2.1 million people live, and 1.9 million work, representing 32% of Ile-de-France’s total as of 2020. There are no motorways within this zone; there were a few but they have been boulevardized under the mayoralty of Anne Hidalgo, and simultaneously, at-grade arterial roads have had lanes reduced to make room for bike lanes, sidewalk expansion, and pedestrian plazas. Berlin Greens love to negatively contrast the city with Paris, since Berlin is slowly expanding the A100 Autobahn counterclockwise along the Ring (in the above map, the Ring is in black; the under-construction 16th segment of A100 is from the place labeled A113 north to just short of the river), and is not narrowing boulevards to make room for bike lanes. But the A100 ring isn’t even complete, nor is there any plan to complete it; the controversial 17th segment is just a few kilometers across the river. On net, the Autobahn network here is smaller than in Ile-de-France, and looks similar in size per capita. London is even more under-freewayed – the M25 ring encloses nearly the entire city, population 8.8 million, and within it are only a handful of radial motorways, none penetrating into Central London.
The contrast with American cities is stark. New York is, by American standards, under-freewayed, legacy of early freeway revolts going back to the 1950s and the opposition to the Lower Manhattan Expressway, which would have connected the Holland Tunnel with the Manhattan and Williamsburg Bridges; see map here. There’s practically no penetration into Manhattan, just stub connections to the bridges and tunnels. But Manhattan is not 2.1 million people but 1.6 million – and we should probably subtract Washington Heights (200,000 people in CB 12) since it is crossed by a freeway or even all of Upper Manhattan (650,000 in CBs 9-12). Immediately outside Manhattan, there are ample freeways, crossing close-in neighborhoods in Brooklyn, Queens, the South Bronx, and Jersey City. The city is not automobile-friendly, but it has considerably more car and truck capacity than its European counterparts. Boston, with a less anti-freeway history than New York, has penetration all the way to Downtown Boston, with the Central Artery, now the Big Dig, having all-controlled-access through-connections to points north, west, and south.
Grocery prices
Americans who defend the status quo of urban freeways keep asking about truck access; this played a role in the debate over what to do about the Brooklyn-Queens Expressway’s Downtown Brooklyn section. Against shutting it down, some New Yorkers said, there is the issue of the heavy truck traffic, and where it would go. This then led to American triumphalism about how truck access is important for cheap groceries and other goods, to avoid urban traffic.
And that argument does not survive a trip to a New York (or other urban American) supermarket and another trip to a German or French one. German supermarkets are famously cheap, and have been entering the UK and US, where their greater efficiency in delivering goods has put pressure on local competitors. Walmart, as famously inexpensive as Aldi and Lidl (and generally unavailable in large cities), has had to lower prices to compete. Carrefour and Casino do not operate in the US or UK, and my impression of American urbanists is that they stereotype Carrefour as expensive because they associate it with their expensive French vacations, but outside cities they are French-speaking Walmarts, and even in Paris their prices, while higher, are not much higher than those of German chains in Germany and are much lower than anything available in New York.
While the UK has not given the world any discount retailer like Walmart, Carrefour, or Lidl, its own prices are distinctly lower than in the US, at least as far as the cities are concerned. UK wages are infamously lower than US wages these days, but the UK has such high interregional inequality that wages in London, where the comparison was made, are not too different from wages in New York, especially for people who are not working in tech or other high-wage fields (see national inequality numbers here). In Germany, where inequality is similar to that of the UK or a tad lower, and average wages are higher, I’ve seen Aldi advertise 20€/hour positions; the cookies and cottage cheese that I buy are 1€ per pack where a New York supermarket would charge maybe $3 for a comparable product.
Retail and freight
Retail is a labor-intensive industry. Its costs are dominated by the wages and benefits of the employees. Both the overall profit margins and the operating income per employee are low; increases in wages are visible in prices. If the delivery trucks get stuck in traffic, are charged a congestion tax, have restricted delivery hours, or otherwise have to deal with any of the consequences of urban anti-car policy, the impact on retail efficiency is low.
The connection between automobility and cheap retail is not that auto-oriented cities have an easier time providing cheap goods; Boston is rather auto-oriented by European standards and has expensive retail and the same is true of the other secondary transit cities of the United States. Rather, it’s that postwar innovations in retail efficiency have included, among other things, adapting to new mass motorization, through the invention of the hypermarket by Walmart and Carrefour. But the main innovation is not the car, but rather the idea of buying in bulk to reduce prices; Aldi achieves the same bulk buying with smaller stores, through using off-brand private labels. In the American context, Walmart and other discount retailers have with few exceptions not bothered providing urban-scale stores, because in a country with, as of 2019, a 90% car modal split and a 9% transit-and-active-transportation modal split for people not working from home, it’s more convenient to just ignore the small urban patches that have other transportation needs. In France and Germany, equally cheap discounters do go after the urban market – New York groceries are dominated by high-cost local and regional chains, Paris and Berlin ones are dominated by the same national chains that sell in periurban areas – and offer low-cost goods.
The upshot is that a city can engage in the same anti-car urban policies as Paris and not at all see this in retail prices. This is especially remarkable since Paris’s policies do not include congestion pricing – Hidalgo is of the opinion that rationing road space through prices is too neoliberal; normally, congestion pricing regimes remove cars used by commuters and marginal non-commute personal trips, whereas commercial traffic happily pays a few pounds to get there faster. Even with the sort of anti-car policies that disproportionately hurt commercial traffic more than congestion pricing, Paris has significantly cheaper retail than New York (or Boston, San Francisco, etc.).
And Berlin, for all of its urbanist cultural cringe toward Paris, needs to be classified alongside Paris and not alongside American cities. The city does not have a large motorway network, and its inner-urban neighborhoods are not fast drive-throughs. And yet in the center of the city, next to pedestrian plazas, retailers like Edeka and Kaufland charge 1€ for items that New York chains outside Manhattan sell for $2.5-4. Urban-scale retail deliveries are that unimportant to the retail industry.
How Residential is a Residential Neighborhood?
Last post, I brought up the point that the neighborhoods along the Interborough Express corridor in New York are residential. An alert commenter, Teban54transit, pointed out that this should weaken the line, since subway lines should connect residential neighborhoods with destinations and not just with other residential neighborhoods. To explain why this is not a major problem in this case, I’d like to go over what exactly is a residential neighborhood and what exactly is a destination. In short, a predominantly residential neighborhood may still have other functional uses, turning it into a destination. It’s imperfect in the case of IBX, but the relative ease of using the right-of-way makes the line still viable.
Residential-but-mixed neighborhoods
Residential neighborhoods always have nonresidential uses, serving the local population: supermarkets, schools, doctors’ offices, restaurants, pharmacies, clothing stores. These induce very few trips from out of the neighborhood, normally. But things are not always normal, and some residential areas end up getting a cluster of destinations.
In New York, the most common way such a cluster can form is as an ethnic center, including Harlem and several Chinatowns. People in and around New York travel to Harlem for specifically black cultural events, for example the shows at the Apollo Theater; they travel to Chinatown and Flushing for Chinese restaurants and supermarkets. Usually the people who so travel are members of the same ethnic community who live elsewhere; this way, in Washington Metro origin-and-destination travel data, one can see a few hundred extra trips a day between black neighborhoods east of the Anacostia River and Columbia Heights, whereas no noticeable bump is seen in work trips between those two areas on OnTheMap.
On the IBX route, this is Jackson Heights. It’s on net a bedroom community, whereas Flushing has within 1 km of Main and Roosevelt 43,000 jobs and 29,000 employed residents, but such ethnic cultural centers over time grow into destinations. People travel to the neighborhood for Indian restaurants, groceries, and cultural events, and it’s likely that over time the area will also get more professional services that cater to the community, creating more non-work and work destinations. The growth of Flushing as a job center is recent and has to be understood as part of this process: in 2007, on the eve of the Global Financial Crisis, there were only 17,000 jobs within 1 km of Main and Roosevelt. Jackson Heights, too, has seen growth in jobs from 2007 to 2019, though much less, by 27%, or 50% excluding Elmhurst Hospital, which over this period saw a small decrease in jobs.
Not only ethnic neighborhoods have this pattern. A neighborhood can grow to become mixed out of proximity to a business district, for example the Village, or out of a particular destination, for example anything near a university. On IBX, there’s nothing like the Village or Long Island City, but Brooklyn College is a destination in and of itself.
Building neighborhood-scale destinations
New public transit lines can help build neighborhoods into destinations. At the centers of cities, central business districts and rapid transit systems tend to co-evolve with each other: a high degree of centralization creates demand for more lines as the only way to truly serve all of those jobs, while a larger rapid transit system in turn can encourage the growth of city center as the place best served by the network. The same is true for secondary centers and junctions of other lines.
This, to be clear, is not a guarantee. Broadway Junction is very easily accessible by public transportation from a large fraction of New York. It’s also more or less the poorest area of the city, where working-class Bangladeshi immigrants living several to a room to save money on rent are considered a sign of gentrification and growth in rent. Adding IBX there is unlikely to change this situation.
But in Jackson Heights and around Brooklyn College, a change is more likely. Jackson Heights already has large numbers of residents using the radial subway lines to get to Manhattan for work, and a growing number of nonresidents who use its specialized businesses and cultural events. The latter group is the greatest beneficiary from circumferential transit, if it connects to the radial lines well; strong radial transit is a prerequisite, but in Jackson Heights, there already is such transit. Brooklyn College is already a destination, in a neighborhood that’s much better off than East New York and already draws widely because of the university trips; I expect that rapid transit service in three directions, up from the one direction available today (toward Manhattan), would encourage the growth of university-facing amenities, which generate their own trips.
Where to build circumferential rail
The best alignment for circumferential rail remains one that connects strong secondary destinations. However, that is strictly in theory, because usually such destinations don’t form a neat circle around city center, especially not in a city so divided by water like New York. If we were to draw the strongest secondary destinations in the city outside the Manhattan core excluding Downtown Brooklyn and Long Island City on the G, we’d get Morningside Heights for Columbia (centered on 116th), maybe 125th Street, the Bronx Hub, LaGuardia, Flushing, Jamaica, and Kings County Hospital/SUNY Downstate. These barely even form a coherent line if dug entirely underground by tunnel boring machine, diagonally under private blocks. And this is without taking into account destinations in New Jersey on the waterfront, which don’t form any neat circle with those city destinations (for example, Fort Lee is well to the north of Morningside Heights and Harlem).
In practice, then, circumferential lines have to go where it is possible, making compromises along the way. This is why it’s so important to connect to every radial, with as short a walk as practical: they never connect the strongest destinations and therefore have to live off of transfers. The G, which does connect the two largest job centers in the region outside Manhattan, fails because of the poor transfers. IBX works as a compromise alignment, connecting to interesting secondary destinations, with transfers to the most important ones, like Flushing and Jamaica. It is fortunate that the route is not purely residential: the neighborhoods are all on net bedroom communities, but some have the potential to grow to be more than that through both processes that are already happening and ones that good rapid transit can unlock.
Land Use Around the Interborough Express
Eric and Elif are working on a project to analyze land use around the corridor of the planned Interborough Express line in New York. The current land use is mostly residential, and a fascinating mix of densities. This leads to work on pedestrian, car, and transit connectedness, and on modal split. As might be expected, car ownership is fairly high along the corridor, especially near the stations that are not at all served by the subway today, as opposed to ones that are only served by radial lines. Elif gave a seminar talk about the subject together with João Paulouro Neves, and I’d like to share some highlights.
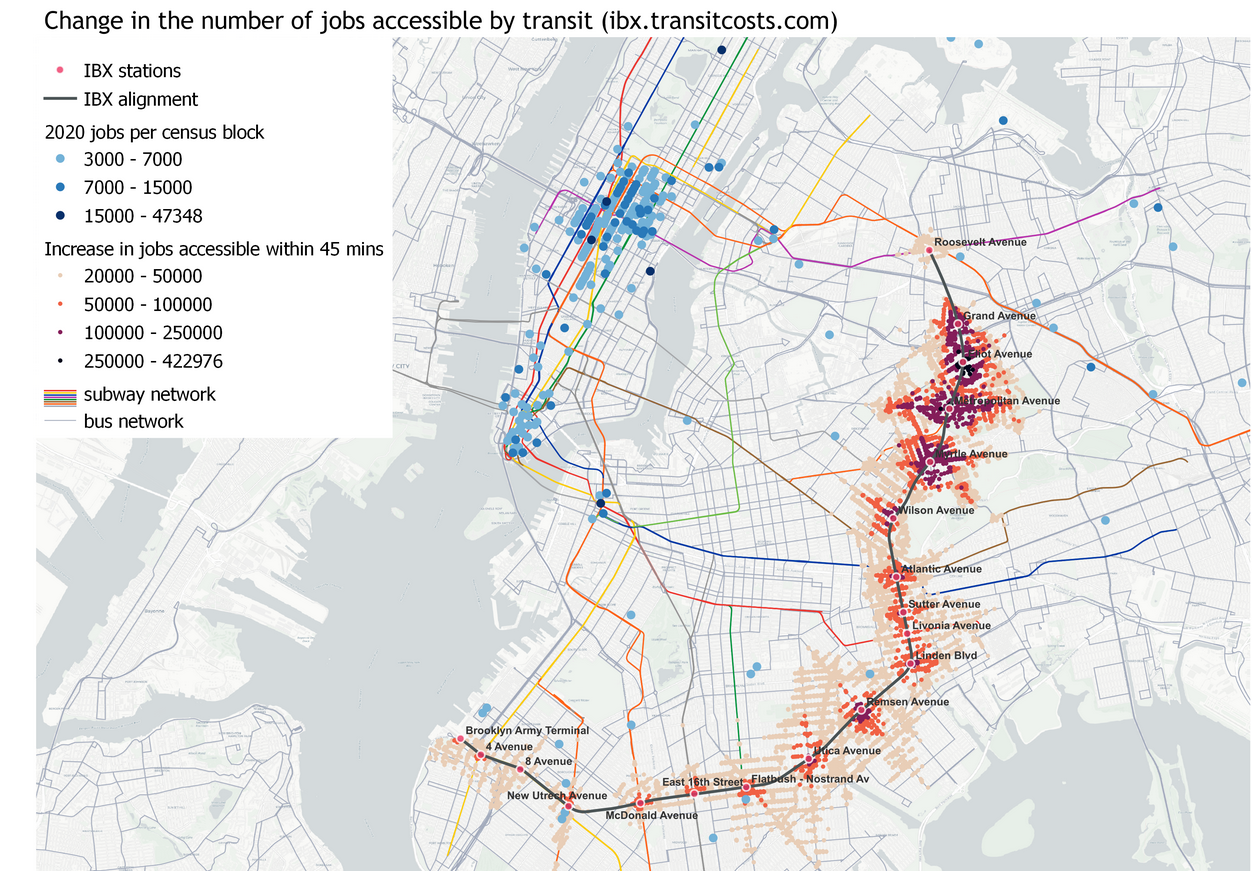
The increase in transit accessibility in the above map is not too surprising, I don’t think. Stations at both ends of the line gain relatively little; the stations that gain the most are ones without subway service today, but Metropolitan Avenue, currently only on the M, gains dramatically from the short trip to Roosevelt with its better accessibility to Midtown.
More interesting than this, at least to me, is the role of the line as a way to gradually push out the boundary between the transit- and auto-oriented sections of the city. For this, we should look at a density map together with a modal split map.

At the seminar talk, Elif described IBX as roughly delineating the boundary between the auto- and transit-oriented parts of the city, at least in Brooklyn. (In Queens, the model is much spikier, with ribbons of density and transit ridership along subway lines.) This isn’t quite visible in population density, but is glaring on the second map, of modal split.
Now, to be clear, it’s not that the IBX route itself is a boundary. The route is not a formidable barrier to pedestrian circulation: there are two freight trains per day in each direction, I believe, which means that people can cross the trench without worrying about noise the way they do when crossing a freeway. Rather, it’s a transitional zone, with more line density to the north and less to the south.
The upshot is that IBX is likely to push this transitional zone farther out. There is exceptionally poor crosstown access today – the street network is slow, and while some of the crosstown Brooklyn buses are very busy, they are also painfully slow, with the B35 on Church Avenue, perennially a top 10 route in citywide ridership, winning the borough-wide Pokey Award for its slowness. So we’re seeing strong latent demand for crosstown access in Brooklyn with how much ridership these buses have, and yet IBX is likely to greatly surpass them, because of the grade-separated right-of-way. With such a line in place, it’s likely that people living close to the line will learn to conceive of the subway system plus the IBX route as capable of connecting them in multiple directions: the subway would go toward and away from Manhattan, and IBX orthogonally, providing enough transit accessibility to incentivize people to rely on modes of travel other than the car.
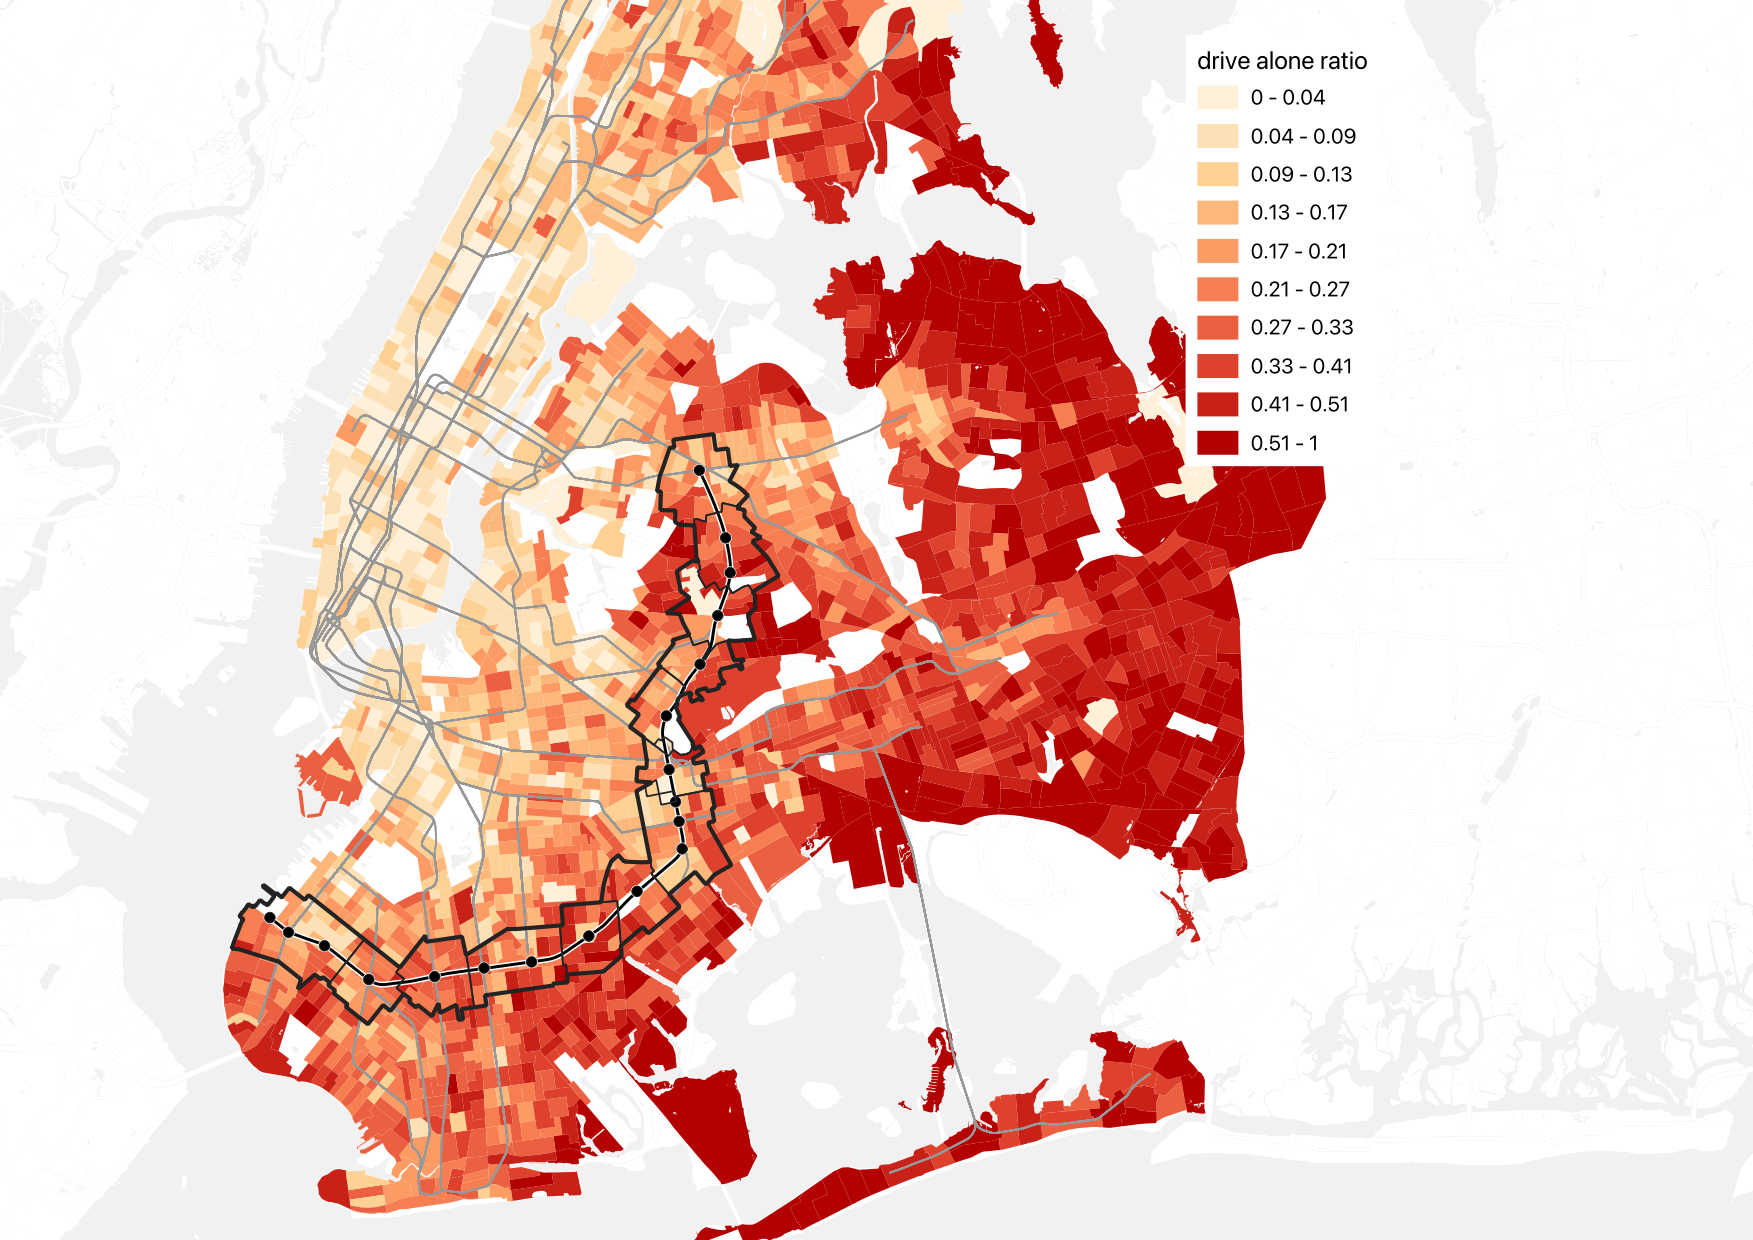
This is especially important since the city’s street network looks differently by mode. Here is pedestrian integration by street:

And here is auto integration:

The auto integration map is not strongly centered the way the pedestrian map is. Quite a lot of the IBX route is in the highest-integration zone, that is with the best access for cars, but the there isn’t really a single continuous patch of high integration the way Midtown Manhattan is the center of the pedestrian map. East Williamsburg has high car integration and is not at all an auto-oriented area; I suspect it has such high integration because of the proximity to the Williamsburg and Kosciuszko Bridges but also to Grand Street and Metropolitan Avenue toward Queens, and while the freeways are zones of pedestrian hostility, Grand and Metropolitan are not.
What this means is that the red color of so many streets along the IBX should not by itself mean the area will remain auto-oriented. More likely, the presence of the line will encourage people to move to the area if they intend to commute by train, and I suspect this will happen even at stations that already have service to Manhattan and even among people who work in Manhattan. The mechanism here is that a subway commuter chooses where to live based on commuter convenience but also access to other amenities, and being able to take the train (for example) from Eastern Brooklyn to Jackson Heights matters. It’s a secondary effect, but it’s not zero. And then for people commuting to Brooklyn College or intending to live at one of the new stops (or at Metropolitan, which has Midtown access today but not great access), it’s a much larger effect.
The snag is that transit-oriented development is required. To some extent, the secondary effect of people intending to commute by train coming to the neighborhood to commute from it can generate ridership by itself; in the United States, all ridership estimates assume no change in zoning, due to federal requirements (the Federal Transit Administration has been burned before by cities promising upzoning to get funding for lines and then not delivering). But then transit-oriented development can make it much more, and much of the goal of the project is to recommend best practices in that direction: how to increase density, improve pedestrian accessibility to ensure the areas of effect become more rather than less walkable, encourage mixed uses, and so on.
Quick Note: Different Anti-Growth Green Advocacies
Jerusalem Demsas has been on a roll in the last two years, and her reporting on housing advocacy in Minneapolis (gift link) is a great example of how to combine original reporting with analysis coming from understanding of the issue at hand. In short, she talks to pro- and anti-development people in the area, both of which groups identify with environmentalism and environmental advocacy, and hears out their concerns. She has a long quote by Jake Anbinder, who wrote his thesis on postwar American left-NIMBYism and its origins, which are a lot more good-faith than mid-2010s YIMBYs assumed; he points out how they were reacting to postwar growth by embracing what today would be called degrowth ideology.
I bring this up because Germany is full of anti-growth left-NIMBYism, with similar ideology to what she describes from her reporting in Minneapolis, but it has different transportation politics, in ways that matter. The positioning of German left-NIMBYs is not pro-car; it has pro-car outcomes, but superficially they generally support transportation alternatives, and in some cases they do in substance as well.
In the US, the left-NIMBYs are drivers. Jerusalem cites them opposing bike lanes, complaining that bike lanes are only for young childless white gentrifiers, and saying that soon electric cars will solve all of the problems of decarbonizing transportation anyway. I saw some of this myself while advocating for rail improvements in certain quarters in New England: people who are every stereotype of traditional environmental left-NIMBYism were asking us about parking at train stations and were indifferent to any operating improvements, because they don’t even visit the city enough to think about train frequency and speed.
In Germany, many are drivers, especially outside the cities, but they don’t have pro-car politics. The Berlin Greens, a thoroughly NIMBY party, are best known in the city for supporting removal of parking and moving lanes to make room for bike lanes. This is not unique to Berlin or even to Germany – the same New Left urban mayors who do little to build more housing implement extensive road diets and dedicated lanes for buses, streetcars, and bikes.
These same European left-NIMBYs are not at all pro-public transportation in general. They generally oppose high-speed rail: the French greens, EELV, oppose the construction of new high-speed lines and call for reducing the speed on existing ones to 200 km/h, on the grounds that higher speeds require higher electricity consumption. In Germany, they usually also oppose the construction of new subway and S-Bahn tunnels. Their reasons include the embedded carbon emissions of tunneling, a belief that the public transport belongs on the street (where it also takes room away from cars) and not away from the street, and the undesirability (to them) of improving job access in city center in preference to the rest of the city. However, they usually consistently support more traditional forms of rail, especially the streetcar and improvements to regional rail outside major cities. For example, the NIMBYs in Munich who unsuccessfully fought the second S-Bahn trunk line, whence the expression Organisation vor Elektronic vor Beton (the Swiss original omits Organisation and also is very much “before” and not “instead of”), called for improvements in frequency on lines going around city center, in preference to more capacity toward city center.
I’m not sure why this difference works like this. I suspect it’s that American boomer middle-class environmental NIMBYism is rooted in people who suburbanized in the postwar era or grew up in postwar suburbs, and find the idea of driving natural. The same ideology in Europe centers urban neighborhood-scale activism more, perhaps because European cities retained the middle class much better than their American ones, perhaps because mass motorization came to Europe slightly later. It also centers small towns and cities, connected to one another by regional rail; the underlying quality of public transportation here is that environmentalists who can afford better do rely on it even when it’s not very good, which hourly regional trains are not, whereas in the United States it’s so far gone that public transportation ridership comprises New Yorkers, commuters bound for downtown jobs in various secondary cities, and paupers.
