Category: Good Transit
Quick Note on Ridership Estimation and the STOPS Model
The Federal Transit Administration (FTA) has a model for ridership estimation for public transit lines, called STOPS. It’s designed to be simplified enough that transit agencies can compute rough projections with it without having a large permanent in-house team dedicated to it (the MTA has a team of about 12). At the Transit Costs Project, we’ve taken to using it to do estimates for potential extensions under various assumptions on speed, frequency, and service pattern. For example, the Effective Transit Alliance’s statement in support of QueensLink for the budget vote later today quotes a figure of 105,000 expected daily riders, with 75,000 of them new and 30,000 existing at the Rockaway stations. I’d like to both go over this figure in this post and explain why at the same time, STOPS must be used with caution, especially in New York.
The QueensLink ridership estimate
At the program, Franklin Tang is responsible for the use of STOPS. Using the tools of the model, he computed that under our assumptions of QueensLink service, total northbound boardings at all stations south of Rego Park-63rd Avenue, the branch point from the Queens Boulevard Line, are 52,634 per weekday. Every trip must be paired between north- and southbound travel, so this means a total of 105,268 trips using QueensLink. These numbers include stations that already have service on the A train, including Howard Beach and the Rockaways; one of the points of QueensLink is to give these areas faster service to Midtown than they get on the A, which takes the long way around via Downtown Brooklyn and Lower Manhattan. In a No Build scenario, we expect these preexisting stations to have about 30,000 total trips, taking into account some expected redevelopment around the Aqueduct.
The business case released by QueensLink, released using the same analysis, gives a total of 75,000 riders/day. This is not the net figure – the similarity is coincidental. Rather, it includes things it shouldn’t (namely, boardings at Rego Park, nearly all preexisting) and excludes things it should (namely, the southbound alightings), as it imitates MTA methodology, which for reasons I don’t quite get counted the Rego Park boardings in its estimate for QueensLink ridership.
The figure people should use in subsequent analysis is the higher one, which is the most comparable to how transit ridership of new projects is usually computed. Riders diverted from other lines still benefit from the project, especially in a case like QueensLink, where the diverted riders would enjoy an improvement in trip time to Midtown of about 10-15 minutes each way. Second Avenue Subway’s ridership, which we compare QueensLink’s favorably with in the ETA analysis, is based on estimates for total ridership, not just new trips, and includes diversions from the 4/5/6 and from crosstown buses in addition to new trips.
The problem of STOPS
STOPS is designed for quick-and-dirty calculations and is known to choke on New York. FTA intends for it to be used elsewhere in the United States, where I am told it gives more accurate numbers; the MTA’s in-house team can do more precise calculations by itself, without STOPS.
Case in point: we tried estimating the ridership of a Utica Avenue subway extension with STOPS, and got bad numbers. “Bad” here does not mean the numbers were low and I’d like them to be higher, but that the model gave nonsensical results. Total northbound boardings on the new stations amounted to 58,000; total southbound alightings only amounted to 25,000. In effect, the model thinks that if a Utica Avenue line opens, then 33,000 people will permanently emigrate from Southeast Brooklyn every day. We’ve rerun the numbers and at this point I don’t believe we made an error; rather, STOPS has some errors, perhaps with stations close to one another, that lead to random results that don’t quite average out correctly. Thus, I recommend caution when using it as it is still only good enough for a first-order estimate.
Secondary Stops in Cities on Intercity Rail
Intercity trains usually only call at the main cities, and only at their main stations. However, in some cases, they make more than one stop in the same city. Examples include the Northeast Corridor with its two Boston stops, the Shinkansen stopping at Shinagawa and Ueno each a few kilometers out of Tokyo Station, Israel Railways with every train stopping multiple times in Tel Aviv, and ICEs stopping not just at Berlin Hauptbahnhof but also a station in each of the cardinal directions out of the city. This practice is a useful tool in the kit of an intercity rail planner, but is not always appropriate – indeed, anti-examples exist throughout France where this never happens and in most German cities that are not Berlin. The goal of this post is to discuss when it is or isn’t appropriate.
Opposite-side stops
If a city is at the end of a line, then the train may continue shortly past it and serve a secondary center. The main examples are in Berlin: it is at the northeastern end of the country, so trains running north-south either run through northwest to Hamburg or terminate just north of Hauptbahnhof at Gesundbrunnen, and trains running east-west entering Hauptbahnhof on the Stadtbahn run through to Ostbahnhof. This is not done in the other examples I have in mind: Israeli trains run through Tel Aviv, Shinkansen terminate at Tokyo Station rather than continuing to the opposite side, and the Northeast Corridor terminates at Washington Union Station rather than continuing one stop south to Alexandria.
In all cases, the question of whether to do it hinges on infrastructure more than operations. Unlike near-side stops, nobody is being delayed by the extra stop – Ostbahnhof isn’t between Hauptbahnhof and anything except Poland, which is barely even peripheral to the German rail network. The main cost is the extra few minutes of train operating time, on which ridership is necessarily going to be lower than the average because most people will have gotten off at the primary station. Whether it’s worth it depends on where it’s easier to turn, based on specific infrastructure considerations.
In Berlin, the reason for Ostbahnhof, a station with no connections to any public transport except the Stadtbahn, which also serves Hauptbahnhof, is infrastructural. The station has one more track than Hauptbahnhof (five vs. four on the mainline Stadtbahn tracks); more importantly, the railyard is to the east of the station, so any ICE using the Stadtbahn has to travel via Ostbahnhof anyway, so it might as well stop there. The railyard is also why some east-west trains even use the Stadtbahn with its 60 km/h speed limits to begin with, when those trains entering from the west can divert to the faster North-South Main Line.
In contrast, the Northeast Corridor’s electrification ends at Washington Union Station. In theory, it can be wired to Virginia and some trains can continue to Arlington while still running under wire. In practice, other works are involved – Washington Union Station is a mix of through- and terminating tracks and so far the through-tracks are low-platform, and the only bridge on the Potomac is primarily used by freight and a separate bridge to allow for passenger-dedicated infrastructure is under construction but won’t open until 2030.
Distance from the primary station
The farther away a node is from the primary station, the more appropriate it is as a prospect for a near-side station, because it is less likely to share a travel market with the primary station, and the cost to travelers of backtracking is higher. In a number of cases, it’s debatable whether the station should even properly count as a secondary station in the city, as opposed to a separate city’s stop. In New York, for example, the nearest station to Penn Station is Newark, 16 km away, in a city center that evolved separately and only became part of the New York metro area in the 20th century, long after its location as a station was established.
I emphasize that this logic is only for near-side stations, because for far-side stations, the logic goes in the exact opposite direction: the train is necessarily emptier going past the last primary city on the route, so the longer it has to run relatively empty, the weaker the idea of serving the far-side stop is. Not for nothing, Ostbahnhof and Gesundbrunnen are both very close to Hauptbahnhof, both well within the city center urban fabric.
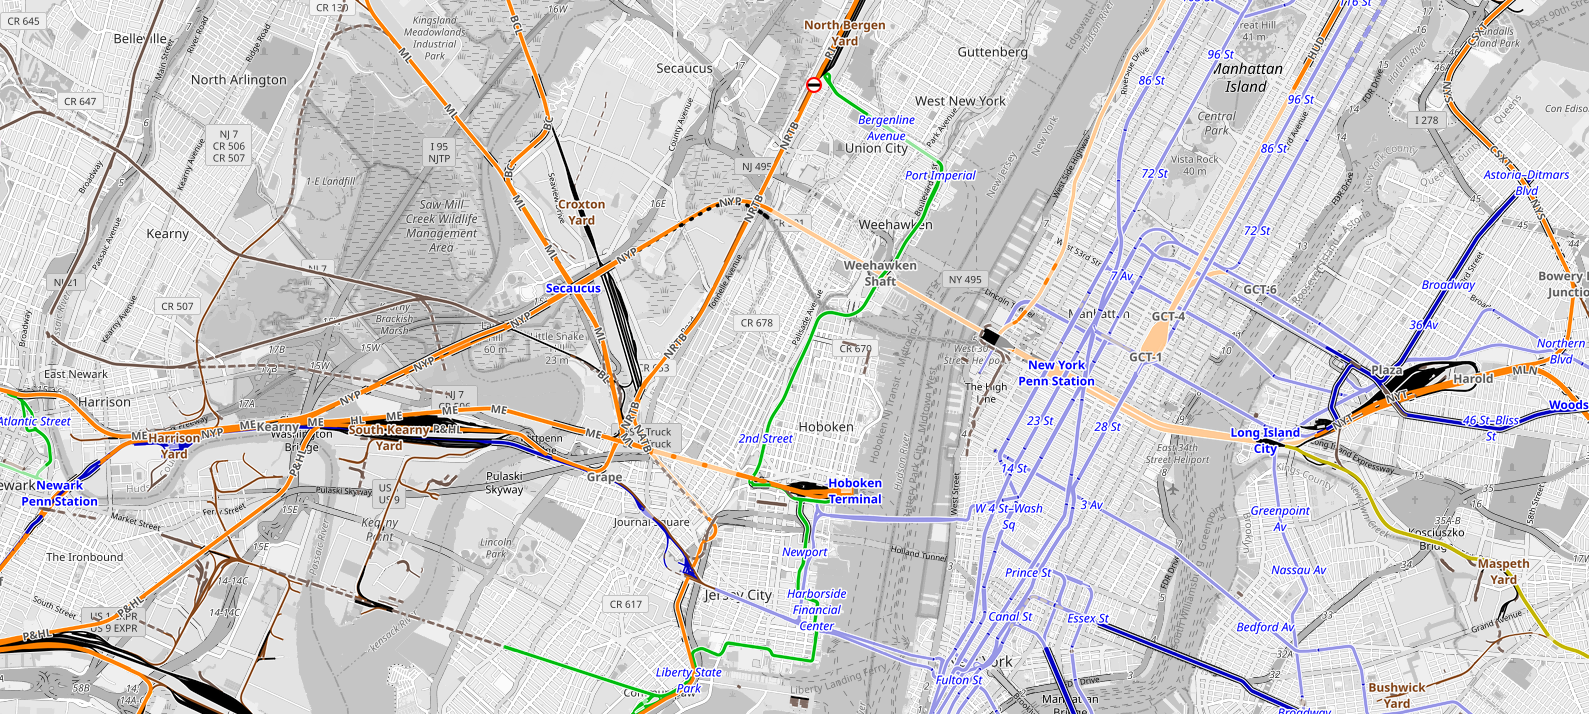
To return to the case of New York, this is what separates Newark from Long Island City. There is currently no serviceable station in Queens on the Northeast Corridor, but there are occasional plans to build on, either at Queens Boulevard or a bit farther east at what I (and people following me) call Sunnyside Junction to allow for a transfer to East Side Access trains to Grand Central (the map below calls it Harold after the interlocking). MTA plans have called for the former, and occasionally one sees advocates call for the latter (ETA calls it Queens Junction), with official plans for decking Sunnyside Yards that may be connected.
Newark Penn Station is a smaller job center than Long Island City. Within 1 km of Newark Penn are 48,000 jobs, vs. 70,000 within 1 km of the intersection of the NEC/LIRR Main Line with Queens Boulevard (and 35,000 of the plausible Sunnyside Junction location). But any project that builds commuter rail stations in Long Island City automatically makes the area easy to get to from Penn Station, whereas Newark Penn is a longer distance from New York, forcing a longer detour for passengers going to points south.
Track speeds
The main cost of a station stop is the extra time it forces on through-passengers. This means that it’s more justifiable to include more stops in a slow zone than in a fast zone.
In practice, this principle works in the opposite direction from that of distance to the primary station, since slow zones are more commonly encountered in major cities than outside of them. The best location based on synthesizing this and the distance principle is that stations are best placed near slow zones that are nonetheless far from the primary city and yet very difficult to fix. Newark Penn Station is at such a slow zone, the approach from the Dock Bridge to the station having some surprisingly tight curves, and the Harrison curve farther north even tighter. New Rochelle is another such example, next to a tight S-curve with flat junctions; this curve can be eased with a necessary grade separation, but the current maximum track speed there is so low, oscillating between 30 and 45 mph (48-72 km/h) based on track maintenance, that it’s understandable that Amtrak Regionals stop there. Back Bay, in an unfixable slow zone, is likewise a natural candidate for a station despite its proximity to South Station.
On urban through-tracks, the maximum speed is usually low, because the costs of engineering the right-of-way through an already crowded city center underground are high and economies are required. The curves on the Ayalon Railway look good for maybe 100 km/h, Stuttgart 21 is designed for 80-90 km/h and so was the North-South Main Line in Berlin, and the Shinkansen doesn’t go faster than 100-110 km/h through Central Tokyo or faster than 130 km/h to Omiya. Such environments encourage secondary stops, whereas the ability of LGVs to get out of city centers fast helps explain why it was never considered.
Of course, TGVs have another reason not to make secondary stops: they’re not set up for them. The TGVs are the worst high-speed trains in the world from the perspective of either acceleration, since they are hauled by locomotives whereas every other piece of equipment save some Talgos is a multiple unit, or interior car design, since they are single-door pair double-deckers with narrow passageways, not at all designed for fast egress since the concept has always been nonstop trips from a Parisian terminal to a secondary city. Regardless of the speed, a TGV making a second Paris stop would have a minimum 5-minute dwell time. At the other end, the Shinkansen and the Israeli trains have level boarding (as do Chinese high-speed trains but they tend to avoid slow city centers).
Relative strength of destinations
Stop spacing on every public transport vehicle is a matter of relative intensities of usage. Absolute density or intensity matters little; the real question is the intensity of the stop considered for addition or deletion compared with the intensity of the stop pairs through the stop that would be delayed if it were added. On intercity rail, the intensity of demand is a combination of all of the following:
- Commercial density near the station
- Density of other destinations near the station, such as tourist attractions, which can be approximated by looking at hotel capacity
- Connecting urban rail lines and the residential density thereon
Back Bay has, within 1 km of the station, 95,000 jobs, compared with 212,000 within 1 km of South Station. This ratio, 0.45, is atypically high for any American secondary central business district, to the point that people perceive Back Bay as a Boston central business district and not as secondary at times. It also is on the Orange Line, which doesn’t serve South Station, and close to the Green Line, which doesn’t get to South Station either, both with solid ridership (the Green Line is comparable to South Station’s Red Line, the Orange somewhat lower than either).
In New York, in contrast, Manhattan overwhelms everything. The 1 km radius from Penn Station if anything undersells it – it has 565,000 jobs, but Midtown continues beyond it and the 2 km radius has 1,415,000, whereas a 2 km radius from Newak Penn has 83,000 and a 2 km radius from Sunnyside Junction or LIRR/Queens Boulevard has 117,000-122,000. Secondary stations must be justified as origins rather than destinations: Newark Penn keeps up by collecting some commuter rail lines, but suffers since the Morris and Essex Lines only go to New York, not Newark Penn, and holds up mostly because of the slow nearby speeds.
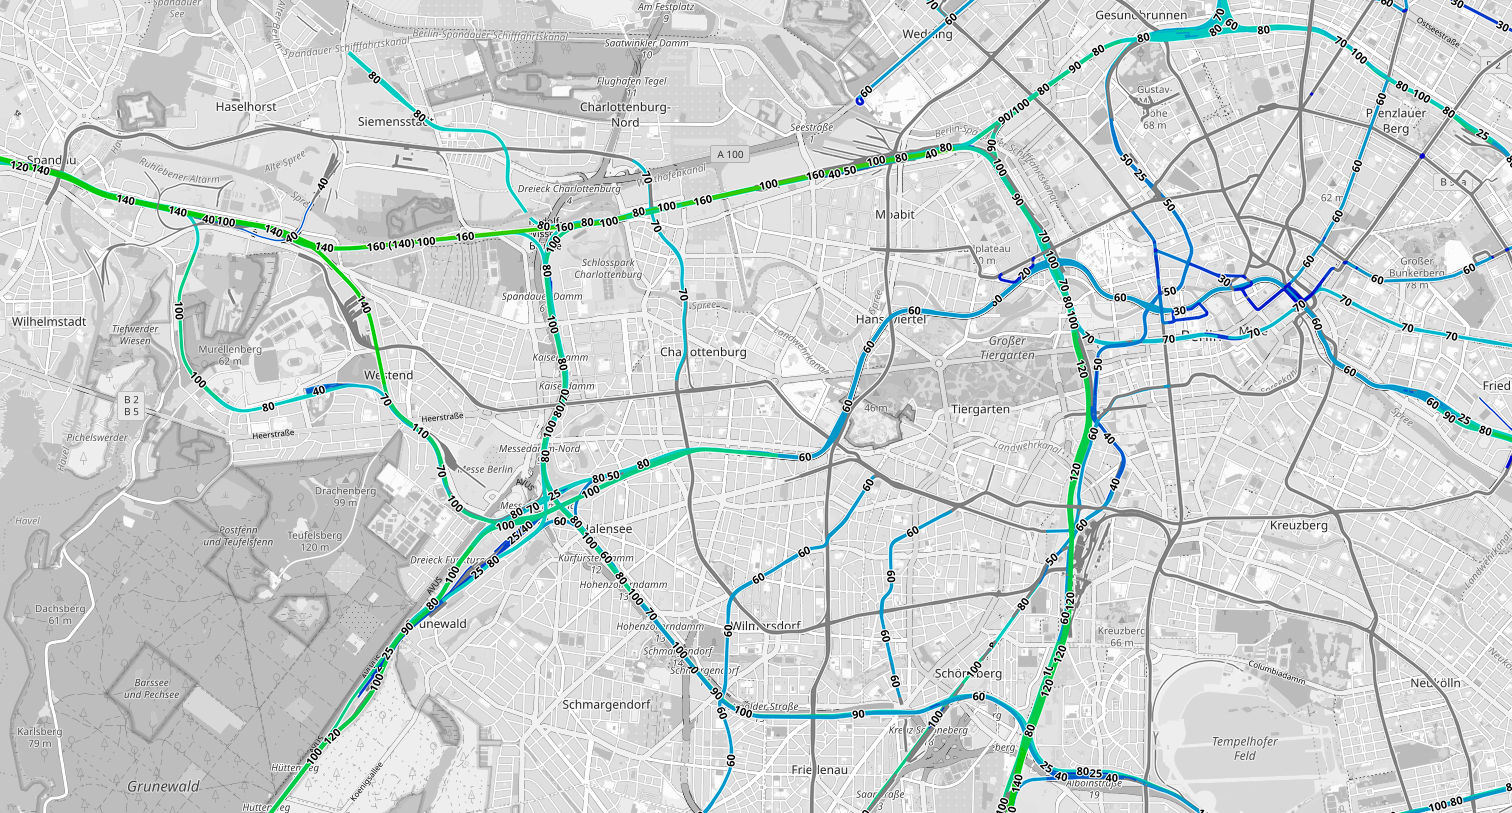
No data as granular as OnTheMap exists in Germany, but one can still model connecting lines and their traffic intensity. The Ring is a high-traffic local corridor, especially its eastern half, including both Gesundbrunnen and Südkreuz; at both stations, its passenger traffic density is barely less than that of the Stadtbahn at Hauptbahnhof. Both also have the North-South Tunnel, which intersects the Stadtbahn at Friedrichstraße rather than Hauptbahnhof, and Gesundbrunnen also has the U8 connection. From quite a lot of the city, even relatively central parts, one of the two north-south secondaries is better than the primary. The east-west situation in Berlin is dicier, since Spandau is much more peripheral, more comparable to Newark than a secondary station within the primary city, and Ostbahnhof really exists as a byproduct of where the railyard is.
One should expect that European cities, with their lower-kurtosis centers, should be better places for secondary stations than American ones, which have very high kurtosis, even outside New York. Other than Back Bay, there really aren’t any strong secondary city centers on American intercity rail lines. California High-Speed Rail’s secondaries, like Burbank, are there for residential catchment, often with easier access by car than the central business district. And yet, one element goes in the opposite direction: larger metro areas tend to have more secondary destinations. Munich is small enough that it can monocentric within walking distance or a short S-Bahn ride from Hauptbahnhof. The sort of American cities that need to think about intercity rail are not; this is how Boston has such a strong secondary, and even New York has decent secondaries immediately outside city limits. Tokyo, with a very strong center but lower kurtosis than New York – high job density is not just in areas near Tokyo Station but also includes Shinagawa, Shinjuku, Shibuya, and Ikebukuro – is a natural place for secondaries, and if there were a Shinkansen line heading west rather than north or south, it goes without saying that it would stop at Shinjuku.
Why High Speed 2 and Other European Lines Make Fewer Stops than the Shinkansen
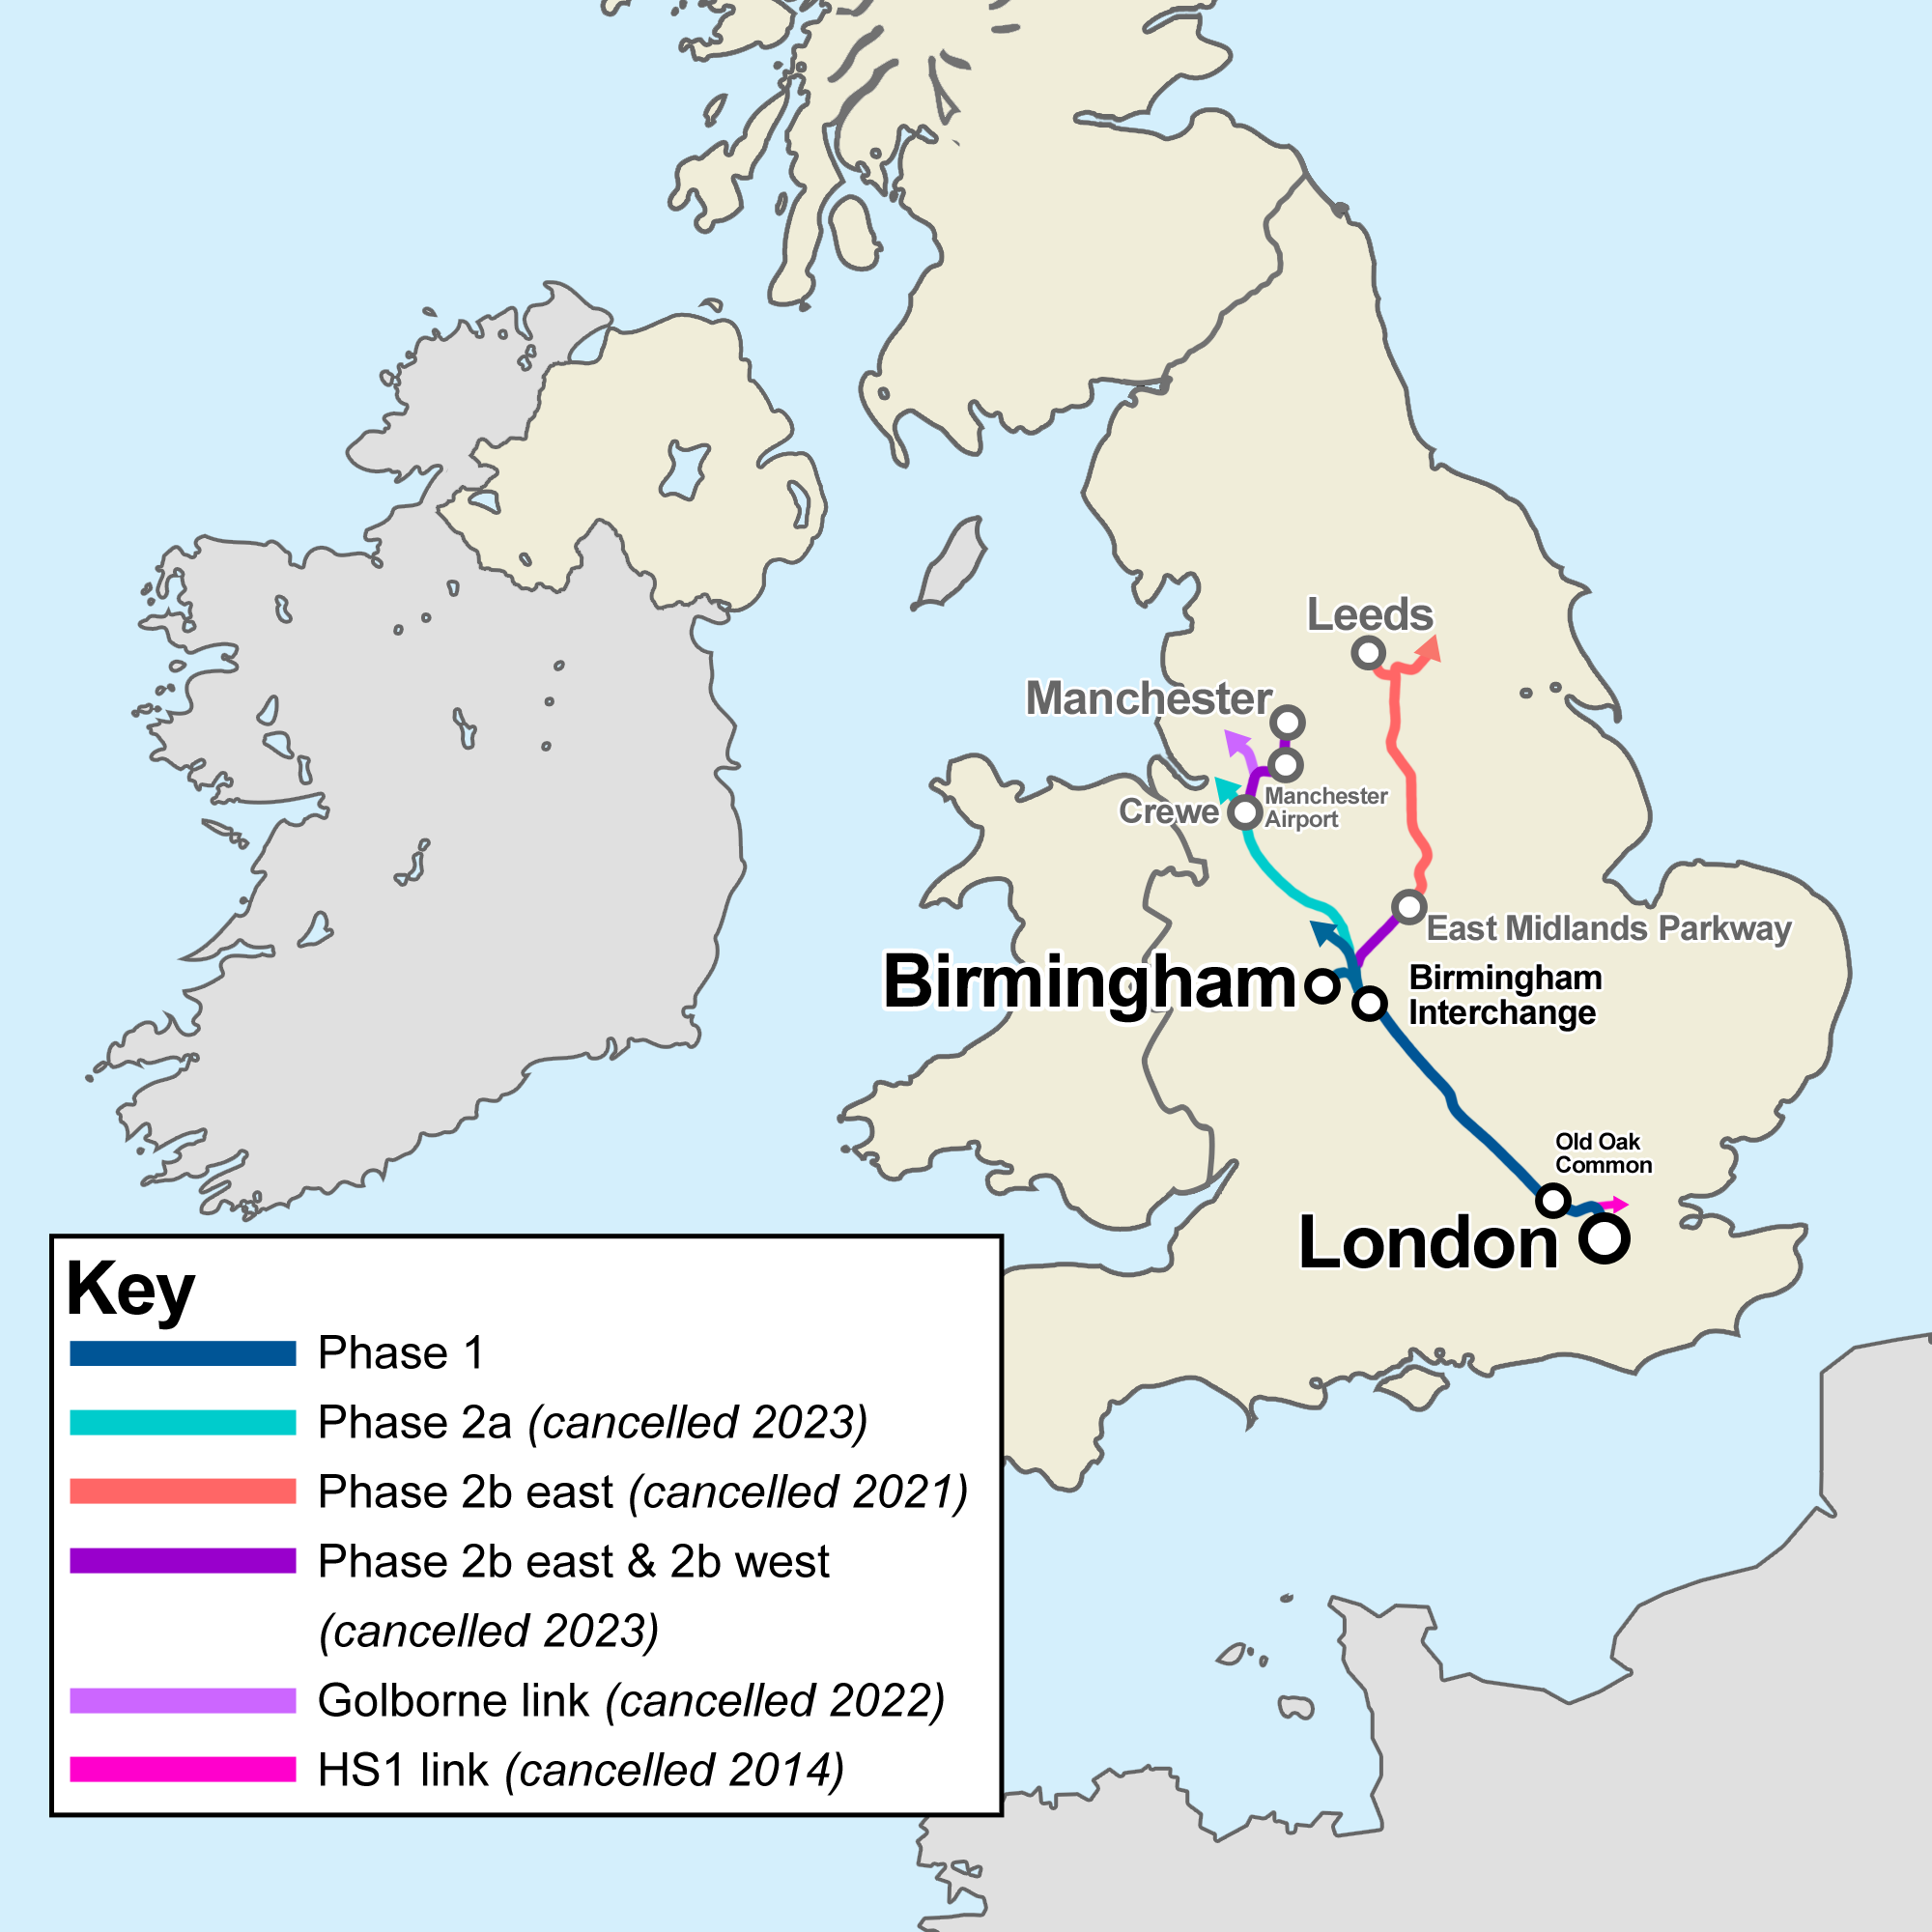
At a meeting last week, Borners was asking me why High Speed 2 is designed not to make any stops between London and Birmingham. This distance, about 150 km between Old Oak Common and Birmingham Interchange, would have around 4.5 interstations on the Shinkansen, but in the UK, it runs nonstop. More generally, in Europe similarly long stretches without stations are observed, but not in Japan. This post goes over why; it is not due to poor design on the part of either side, but rather a response to the respective geographies of the countries in question.
Speed classes on the rail network
Modern intercity rail networks have multiple speed classes, comprising not just separation between high-speed trains and trains on the classical lines but also local and express trains on the same line, often the same track. Here, it is useful to go over the difference between Japan and Europe in general and Britain in particular.
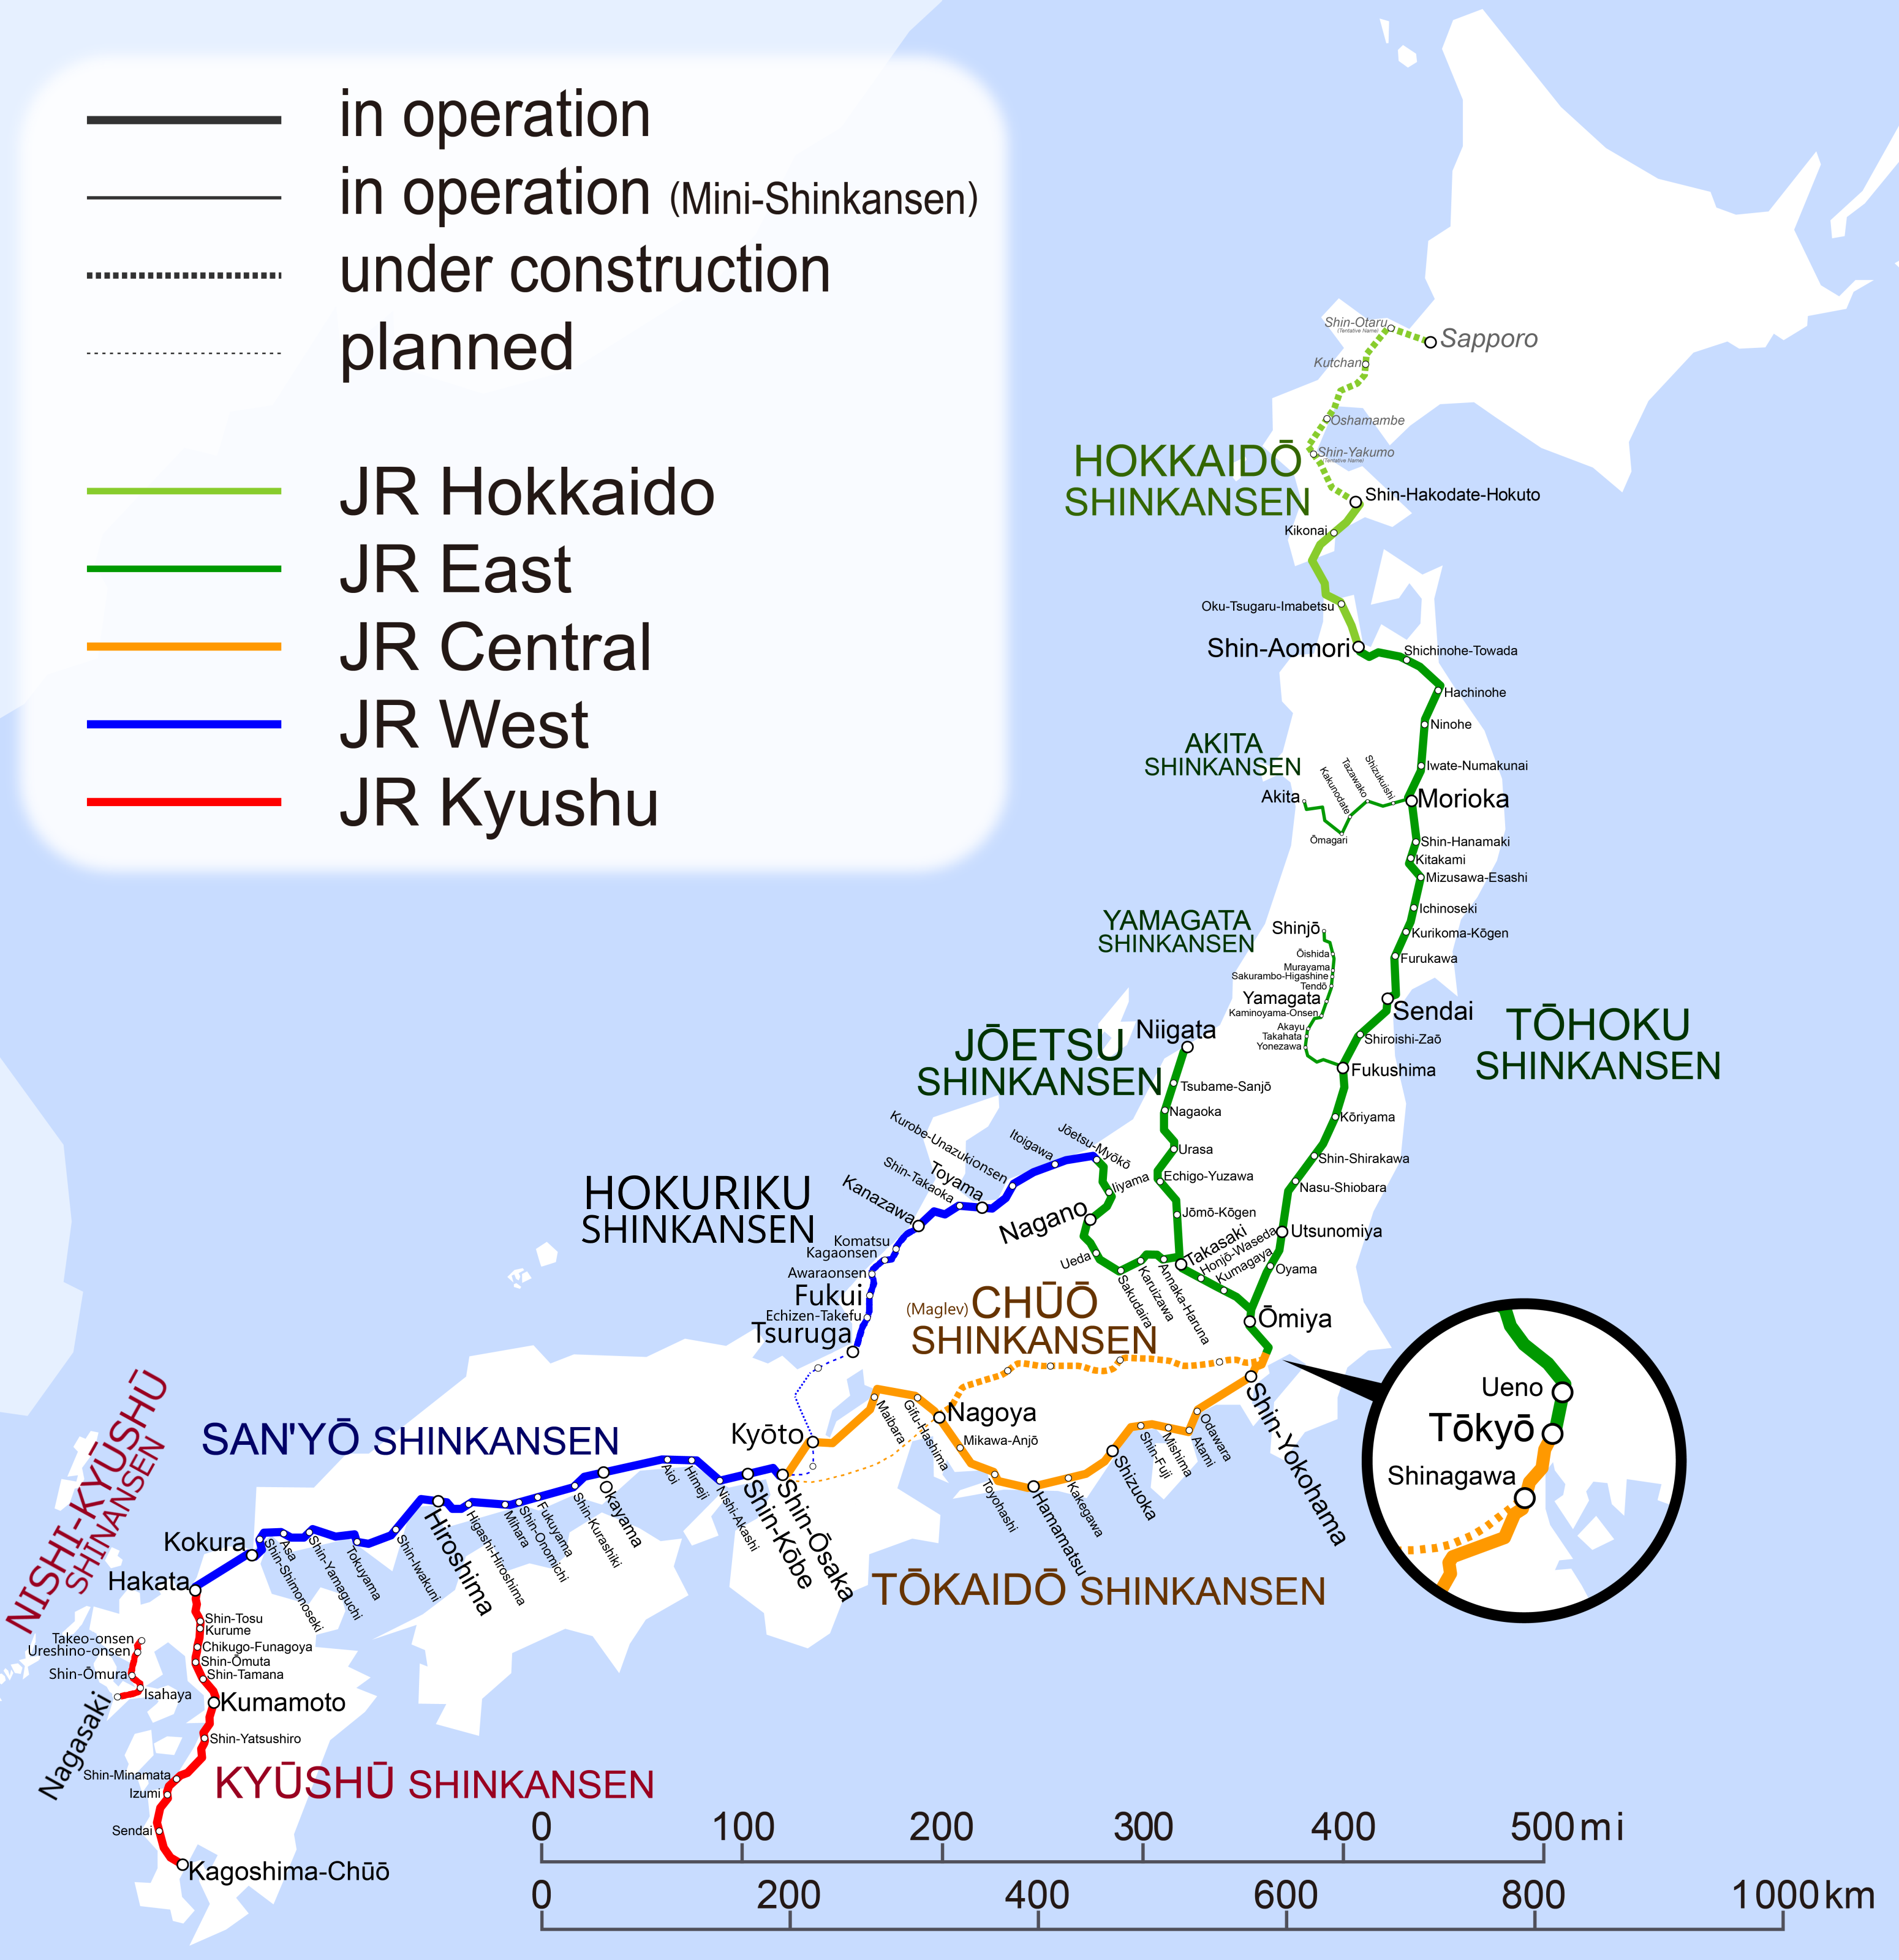
On the Tokaido Shinkansen, the fastest trains, stopping only in Tokyo and its immediate suburbs, then Nagoya, then Kyoto, and then Shin-Osaka are called Nozomi and average 210 km/h end-to-end; trains making additional stops are called Hikari and average 178 km/h; trains making all Shinkansen stops are called Kodama and average 132 km/h. Below that class are limited express trains on the narrow-gauge network, all much slower. The original Kodama, inaugurated in 1958 just before the Shinkansen began construction, did the Tokyo-Osaka trip at an average speed of 80 km/h. The fastest trains on classical lines in Japan average around 100-110 km/h, on lines without Shinkansen, while lines parallel to Shinkansen, such as the Tokaido Main Line, are slower as they prioritize regional traffic at an average speed of 60 km/h or so.
Britain, in contrast with Japan, has rather fast trains on its classical network, as do other countries that chose to invest in upgrading their existing network rather than in building high-speed rail on it. The intercity trains today connect London with the major cities of the Midlands and North at average speeds of about 130 km/h, depending on city and line. The West Coast and East Coast Main Lines are both straight, built in the 1830s and 40s when it wasn’t clear trains could even round significant curves without derailing, in one of Europe’s flattest geographies, the exact opposite of Japan with its mountainous terrain and narrow-gauge lines. Both lines were four-tracked in the 19th century, more or less allowing fast intercity trains to run alongside slower regional lines without interference. In effect, trains offering Kodama speeds are available in Britain today.
Germany is in a similar situation to Britain. The topography here is hillier and the lines built slightly later, after engineers figured out that sharp curves were fine at the speeds of mid-19th century steam trains, but it’s possible to squeeze decent speed out of some of them, especially in flatter northern Germany. Berlin-Hamburg, exceptionally, averages around 160 km/h entirely on classical track, with timetabled overtakes between intercity and regional trains and extensive schedule padding to allow for recovery from cascading delays. Other lines average 120-130 km/h, for example to Leipzig and Cologne, so that Kodama speeds are already available, again, and the focus when high-speed rail is built is on the Hikari/Nozomi speed range.
Finally, France, like Japan and unlike Britain and Germany, chose to invest in high-speed rail more than to upgrade its classical lines. But it, too, already had high speeds on its classical lines: from Paris to Marseille and Nice, trains averaged 120 km/h before the TGV opened. Short-range intermediate cities like Dijon already had fairly good service available, so serving them was less important than maximizing the speed of longer-range connections like Paris-Lyon and Paris-Marseille.
The urban geography of Japan, were it in Europe, would thus be serviceable on classical lines. In contrast, the lower speed of classical trains in Japan means that exurban centers like Odawara, Mishima, Utsunomiya, and Takasaki greatly benefit from having local Shinkansen trains available. England is denser than Japan; there are places at similar range from London on or near the main lines, such as Milton Keynes and Northampton, but they already have fairly fast trains to the capital, and will have even faster trains when High Speed 2 opens even though they don’t get stations, because the removal of the intercity trains from the West Coast Main Line will allow for schedule rewrites reducing timetable padding and allowing for faster trip times between London and such intermediate points, which today are lower priorities than higher average speeds to Birmingham and points north.
City size and prioritization
On the one hand, as outlined above, there is less need for Kodama-speed service to intermediate cities in Europe than there is in Japan. On the other hand, regardless of need, such service must take lower priority in Europe, due to differences in urban geography.
In Japan, the Tokaido Shinkansen prioritizes Tokyo-Nagoya-Kyoto-Osaka traffic, as those cities outshine all others. Kodama trains could do the trip significantly faster than they do today, but are held at local stations to let Nozomi pass, and most trains are Nozomi rather than Hikari or Kodama. However, north of Tokyo, the situation flips. There is extensive commuter traffic, seen in much shorter average trips than on the Tokaido Shinkansen. The northern exurbs of Tokyo furnish extensive traffic, while the cities beyond commute range are too small to drive traffic all by themselves.
In the Tohoku region, by far the largest major metropolitan area is Sendai, population 2.3 million. The only other major metropolitan area served by the Tohoku or Joetsu Shinkansen, Niigata, has 1.4 million. The other cities don’t qualify as MMAs; the largest, Toyama on the Hokuriku Shinkansen, has an urban employment area of 1 million, while the others, such as Fukushima, Morioka, and Nagano, have around 500,000 each. Utsunomiya and the Takasaki-Maebashi region have 1.3 and 1.1 million respectively, enough that their needs should drive service planning as much as those of the cities to their north.
Britain is the exact opposite. Its metro area listings are somewhat outdated – I can only find 2001 data, compared with 2015 for Japan in the above paragraph – but we can compute based on metropolitan counties, designed to approximate metropolitan areas for the major secondary cities of England. Birmingham’s West Midlands and Greater Manchester are 3 million each, Leeds’ West Yorkshire is 2.4 million, Liverpool’s Merseyside is 1.5 million; at longer range, counting cities to be served on long extensions on classical lines at lower speed, Newcastle’s Tyne and Wear is 1.2 million, Edinburgh is 900,000, and Glasgow is depending on definitions between 1 and 1.8 million. In contrast with those, there is nothing that populous justifying its own station between London and Birmingham. Milton Keynes is too small, and an exurban station at the intersection with the under construction East West Rail between Oxford and Cambridge would not provide much added benefit over the existing direct express trains from Oxford and Cambridge to London.
The British situation generalizes. In Germany, not only does every line have quite a number of midsize cities at its end and beyond it, but also no city is so large that it sprouts subsidiary metro areas the size of Utsunomiya and Maebashi. When intermediate stops are built on high-speed lines, such as Montabaur on the Cologne-Frankfurt line, they are weak, and serve mostly for political purposes to defray NIMBYism; two such political stations are likewise included in the Hanover-Hamburg line. Even then, with stations that raise construction costs and compromise the alignment and timetable for no good technical reason, the stop spacing on these lines is wider than on the Shinkansen, which speaks to the difference in geography between Europe and Japan.
Quick Note: Commuter Rail and Urban Bus Hubs
I’d like to introduce the concept of bus hubs with commuter rail connections, but in an urban rather than suburban context. This comes from the project we’re working on to about Queens buses on the assumption that LIRR is modernized, but it should generalize. The suburban bus context is a town center that buses converge on from many directions; the urban one is embedded in a much larger street network that must have multiple stops, and therefore the hub must be planned around both bus and rail service at once, rather than in a rail-first hierarchy.
The importance of two-way planning here is that within an urban grid, there usually aren’t obvious town centers, unless they are built. The topic of this discussion is not city center but outer areas where the commuter trains provide walk-on service, or would if they ran at modern (i.e. non-American) frequencies and charged the same fares as the buses and subway. For example, take Eastern Queens in and east of Jamaica:
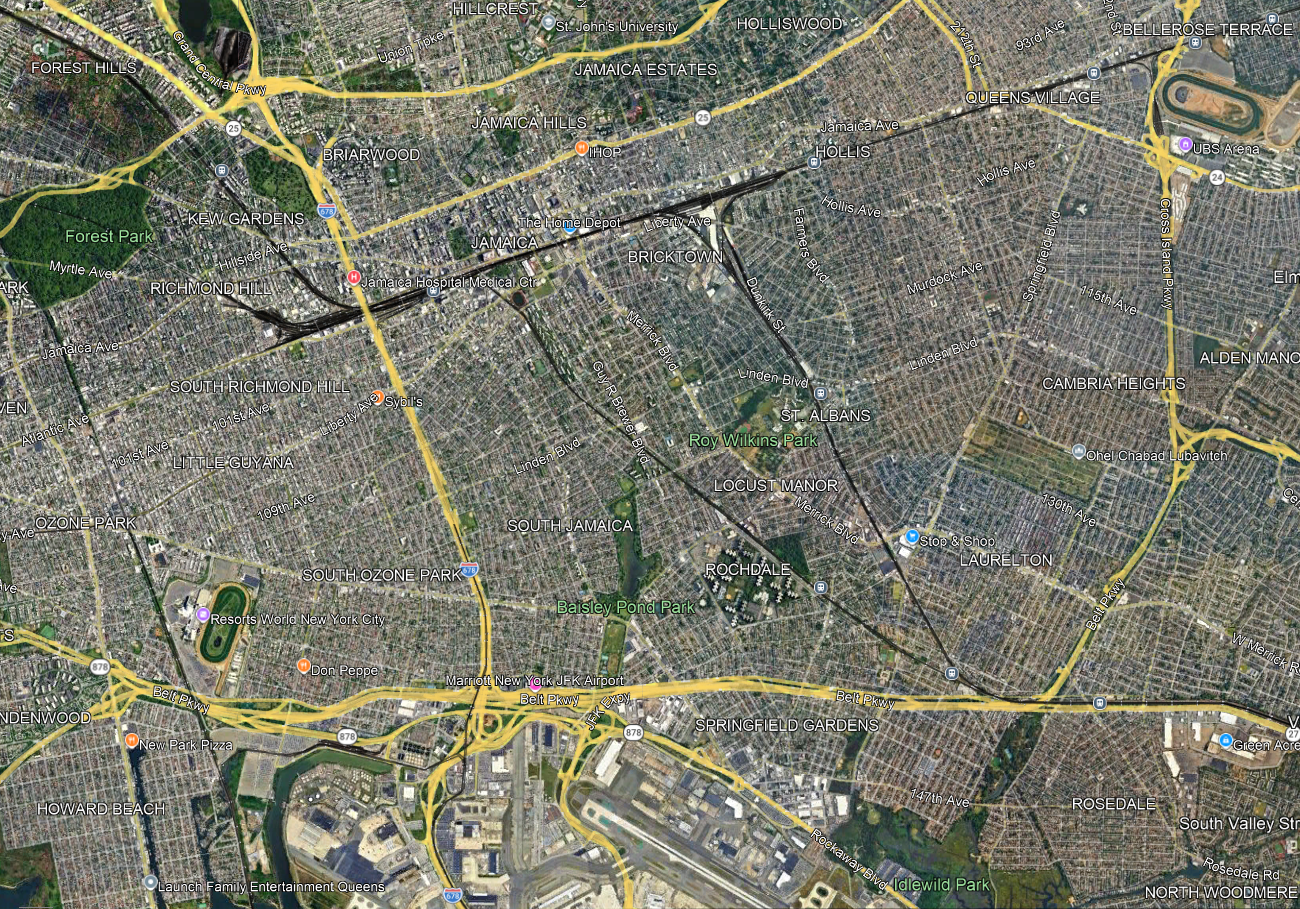
Jamaica is an obvious node, and nearly all LIRR trains already stop there and the rest should, but farther east, it’s a question of how to set up the LIRR to interact better with the city, including its buses. A lot of questions and tradeoffs have to be addressed all at once:
- Stop spacing, trading off station access time with trip times. The LIRR on the Main Line has four tracks through Floral Park so any infill station would be local-only, but that still matters for riders from points east like Floral Park and Hempstead. On the Atlantic Branch and the Montauk Line there are only two tracks, and extensive suburban ridership that would be slowed down by additional stops.
- Intersections with main arterial streets that make for natural bus connection points. The Queens Village LIRR station is at the intersection with Springfield Boulevard, but a little to its west Francis Lewis intersects the Main Line without an LIRR stop, while Hollis is not so well integrated with the street network (it’s near Farmers Boulevard, which more or less parallels the Monrauk Line). On the Montauk Line and Atlantic Branch, strong east-west bus connection points are useful; St. Albans is at the intersection with Linden, but the Atlantic Branch has no such stop at the intersection with Linden.
- Stops that permit buses to avoid congested nodes, in this case Jamaica; farther north, off-map, the same is true of Flushing. One of the goals of bus redesigns replacing traditional radial networks with grid is to get buses out of the areas where they are the slowest; this was explicit in the replacement of the radial network with the Nova Xarxa grid, increasing average speed even without any other interventions like bus lanes and stop consolidation.
- Some bus routes duplicate rail routes and could be removed or curtailed, if enough infill stops are built: for example, Merrick and Guy R. Brewer Boulevards are very closely parallel to the Montauk Line and Atlantic Branch respectively.
Without doing more detailed work yet, I suspect that the speed-access tradeoff encourages more infill stops on the Main Line and Atlantic Branches and fewer or even none on the Montauk Line, since the Atlantic Branch only continues to fairly close-in suburbs whereas Montauk carries the Babylon Branch on it, and that the buses can then be moved to a grid to connect with these stations. But the point is that this is not a decision that can be made rail-first, unlike timed connections in secondary cities and suburban town centers. The top-down hierarchy that for example Marco Chitti brings up when setting up a Takt system breaks down when one does coordinated bus-rail planning within the city.
Against Land Value Capture
An otherwise-good video by the Joint Transit Association about A Better Billion criticizes us for not proposing value capture to fund the scheme. I’ve seen other otherwise-good American transit advocates back this, and I’ve seen many a thinktank propose it and similar nonconventional schemes to fund public transit, in lieu of taxes. Taxes are political. Taxes annoy voters. So why not get around them by taxing development behind the scenes? It’s attractive on the surface, but in truth, broad taxes are the only way to fund government and expect it to perform as expected; value capture is so opaque that it is very easily wasted, to the point that 100% of the funds it provides can sometimes be wasted on excess construction costs, as has been the case in Hong Kong. Good transit advocates should reject this scheme and demand that funding be as straightforward as possible, with the understanding that the part about taxes that annoys voters is what ensures the money is spent well.
What is value capture?
Value capture is the name for any of a set of programs aiming to fund infrastructure by taxing the development that it would unlock – in other words, to capture some of the value gained by the private sector. This contrasts with broad-based taxes, which capture value from the entire economy and not just from specific developments or developments in specific areas. The idea is that the infrastructure generates value not just for the broad economy but also specifically in the area it serves, so it’s right to tax that area.
In practice, value capture schemes are most common when there’s perception that raising broad taxes is too difficult politically, or undesirable otherwise. Hong Kong extensively uses value capture to fund MTR expansion, not because its taxes are too high but because it wishes to keep its taxes very low. American cities have begun looking into such schemes in much higher-tax environments, with limited willingness to fund things out of the general budget; the 7 extension in New York was built with bonds tied to tax increment financing (TIF), which promised that the higher property taxes generated by Hudson Yards development would pay the bonds back.
Which projects are funded by value capture?
Naturally, value capture and TIF systems favor projects that have the most real estate value to capture. In New York, this meant the 7 extension but not Second Avenue Subway, which the real estate advisors to Bloomberg denigrated on the grounds that the Upper East Side was already developed.
This already creates biases, in favor of not just wealthier areas (the Upper East Side is after all rather rich) but also ones with high redevelopment potential, for example because they are underbuilt. This, in turn, favors worse projects, because they serve lower preexisting density.
The dominant benefit of public transportation in benefit-cost analyses, which are not undertaken in the United States, is the benefit to passengers, representing social surplus. For an example that was just sent to me, a study from last month analyzing a further Nuremberg U-Bahn extension classifies the total benefits of the chosen alternative on p. 30 as 5.73 million €/year in passenger benefits, plus about 3 million €/year in various externalities of which the biggest are reduced accident costs and reduced traffic congestion. Similarly, Börjesson et al’s ex post analysis of the T-bana, finding a benefit-cost ratio of 6, has consumer surplus dominating the benefits of the system. Land use changes are helpful, but the main purpose of a subway is to be ridden rather than to stimulate real estate development. A Better Billion looks at the possibilities of development unlocked by new lines, but not for nothing, we also look at existing bus ridership and subway capacity problems in analyzing which projects to recommend; development-oriented transit can work but only as a secondary option, and value capture overemphasizes it in preference to other needs.
Value capture and costs
Hong Kong is famous in the core English-speaking world for linking development with MTR construction. It’s also a very good example of what not to do. I complained mightily about value capture in 2017, but if anything I pulled punches, because while I did talk about Hong Kong’s use of MTR value capture as a corrupt slush fund, I didn’t know enough to connect this with Hong Kong’s other problems:
- Very high infrastructure construction costs. They are so high that value capture only covers about half the project costs, and the other half, funded directly by the government, is still more per kilometer than the world average cost. Hong Kong, moreover, has been ground zero for the adoption of the consultant-centric globalized system of procurement – British consultants who were there in the 1980s and 90s workshopped the system and then brought it home, leading to a cost explosion that rendered first London, then Australian and Canadian cities, incapable of building urban rail. In this sense, value capture is an attempt to paper over the inability to build by using a tool perfected in the city that has extreme construction costs and can only build anything because, with car ownership suppressed by taxes, it has atypically high demand.
- Overcrowding, likely the worst in the developed world. The data out of Hong Kong isn’t quite comparable to the most overcrowded cities in the democratic world (Paris averages 31 m^2/capita). Hong Kong reports median rather than mean housing size: its median is 16 m^2, and while it has a lot of inequality, it doesn’t produce nearly a factor of 2 of a mean-median spread. Hong Kong has atypically high inequality, but even that only produces a mean-to-median income ratio of 0.67, and housing surface area is distributed more equally than income. So it’s almost certain Hong Kong is the first world’s overcrowding capital, all because the state doesn’t develop enough land or housing (net annual housing growth is 3.8 dwellings/1,000 people, low for East Asia) in order to create more profits for the MTR to fund ever growing construction costs.
The way forward
Value capture and other nonconventional funding strategies should be categorically rejected. They lead to poor project selection, high construction costs through opacity, and, in the most extreme cases, other governance problems including Hong Kong’s legendarily bad overcrowding. The only legitimate way to fund public transportation and other infrastructure project is through broad-based taxes, either directly as in some dedicated payroll and sales taxes found in both the United States and Europe or, better yet, through the general budget, debated at the highest responsible level of government (municipal, provincial, or national), itself funded largely by broad taxes.
High Speed Rail-Airport Links
As somewhat of a followup to my last post on how successful high-speed rail isn’t really made for tourists, I’d like to talk about the issue of air-rail links. Those are beloved by both foreign tourists and domestic residents using them to travel abroad, and American high-speed rail planning has on occasion tried focusing on them. This has always been awkward for both environmental and ridership goals. Such links are not inherently bad, but they are often overrated in planning, especially at the level of public advocacy and shadow planning agencies, which reproduce the biases of frequent fliers.
Skipping the airports in rich Asia
The Shinkansen does not serve Narita. There were plans for it to do so but they have not been implemented. Such service would require a dedicated line, since the Shinkansen is on a different gauge from the classical JR network and the standard-gauge link between the city and the airport is owned by private railway Keisei, and Narita itself is not important enough to drive such a line, not at the urban tunneling construction costs of Japan.
But the same lack of service to airports is seen in the two most Shinkansen-like systems outside Japan, Korea and especially Taiwan. The airport is not in Taipei but in Taoyuan, and is connected to the city by an express commuter train, the Taoyuan Airport MRT, but the Taiwan High-Speed Rail system does not serve it, instead having a different Taoyuan station on the Airport MRT. Even in Korea, which uses standard gauge and runs KTX trains through on classical lines in the French style, there is no KTX service to Incheon or to Gimpo.
The issue in all three countries is that the role of the capital’s international airport is to connect passengers between the capital region and the rest of the world. Tourists visiting the capital don’t need a train to secondary cities; in South Korea, last year, 66% of tourism by spending was in Seoul, and in Taiwan, 53% of tourism by occupied hotel nights was in Taipei, New Taipei, and Taoyuan (PDF-pp. 20-21 of the 2024 annual report). Domestic residents using the airport to travel abroad are a more serious use case, but far more residents of Busan or Kaohsiung are going to their respective country’s capital than abroad, and so the airport link is not a high priority for planning.
Serving the airports in Europe if they’re on the way
Three of the four busiest airports in the EU – CDG, Schiphol, and Frankfurt (the fourth is Barajas) – have high-speed rail links. However, in all cases, it’s because they’re on the way somewhere. CDG and Frankfurt are both on valuable bypass routes around the primary city with its terminal-only train stations, so they might as well be served. Schiphol is between Rotterdam and Amsterdam, but serving it involved high-cost tunneling, on a high-speed line, HSL Zuid, that has in retrospect been more a case of imitating the TGV than responding to Dutch intercity rail needs.
In all cases, the airport link is decidedly secondary to the network, and is not a major planning goal. There are intercity trains routed into Berlin-Brandenburg, but these are intended for long-distance regional use: the extensive rail tunneling to the new airport is for various regional express trains, with a 15-minute Takt to Berlin Hauptbahnhof and four hourly Takt trains to regional destinations starting next month and only one intercity train on a two-hour Takt between Berlin and Dresden. Munich has no ICE connection, and a proposal for one never got beyond the conceptual stage because the airport-city center connection was deemed a higher priority. It’s notable that even high-cost, high-prestige air-rail links here prioritize connections to city center, and not to the national network.
The awkward environmental politics of air-rail links
High-speed rail is justified on both economic and environmental grounds. But sometimes these different justifications end up conflicting. It’s noteworthy that in the United States, a common argument for high-speed rail in California and the Northeast has been that the airports are too clogged with short-haul regional flights and if high-speed trains replaced them then the gates and runway slots would be usable by long-haul flights. This argument is made at the same time as arguments about reducing greenhouse gas emissions – but long-haul flights contribute far more emissions than short-haul ones per unit of airport capacity consumed, airport capacity not particularly caring if you’re flying 700 km or 7,000.
It’s possible to ignore the environmental effects and just focus on the economic benefits; in Europe, the broad environmental movement is neutral or even hostile to high-speed rail, viewing it as inferior to running more night trains and regional trains. But then in Europe the economic-only planning for high-speed rail does not prioritize the air links, because they are fundamentally secondary. In a country like France, the demand for high-fare rail links to CDG is to the center of Paris, not Marseille.
Reverse-Branching on Commuter Rail
Koji asked me 3.5 days ago about why my proposal for New York commuter rail through-tunnels has so much reverse-branching. I promised I’d post in some more detail, because in truth, reverse-branching is practically inevitable on every commuter rail system with multiple trunk lines, even systems that are rather metro-like like the RER or the S-Bahns here and in Hamburg.

This doesn’t mean that reverse-branches, in this case the split from the Görlitzer Bahn trunk toward the Stadtbahn via S9 and the Ring in two different directions via S45/46/47 and S8/85, are good. It would be better if Berlin invested in turning this trunk into a single trunk into city center, provided it were ready to build a third through-city line (in fact, it is, but this project, S21, essentially twins the North-South Tunnel). However, given the infrastructure or small changes to it, the current situation is unavoidable.
Moreover, the current situation is not the end of the world. The reasons such reverse-branches are not good for the health of the system are as follows:
- They often end up creating more frequency outside city center than toward it.
- If there is too much interlining, then delays on one branch cascade to the others, making the system more fragile.
- If there is too much interlining, then it’s harder to write timetables that satisfy every constraint of a merge point, even before we take delays into account.
All of these issues are more pressing on a metro system than on a commuter rail system. The extent of branching on commuter rail is such that running each line as a separate system is unrealistic; tight timetabling is required no matter what, and in that case, the lines could reverse-branch if there’s no alternative without much loss of capacity. The S-Bahn here is notoriously unreliable, but that’s the case even without cascading delays on reverse-branches – the system just assumes more weekend shutdowns, less reliable systems (28,000 annual elevator outages compared with 1,800 on the similar-size U-Bahn), and worse maintenance practices.
So, on the one hand, the loss from reverse-branching is reduced. On the other hand, it’s harder to avoid reverse-branching on commuter rail. The reason is that, unlike a metro (including a suburban metro), the point of the system is to use old commuter lines and connect them to form a usable urban and suburban service. Because the system relies on old lines more, it’s less likely that they’re at the right places for good connections. In the case of Berlin, it’s that there’s an east-west imbalance that forces some east-center-east lines via S8, which was reinforced by the context of the Cold War and the Wall.
In the case of New York, consider this map:
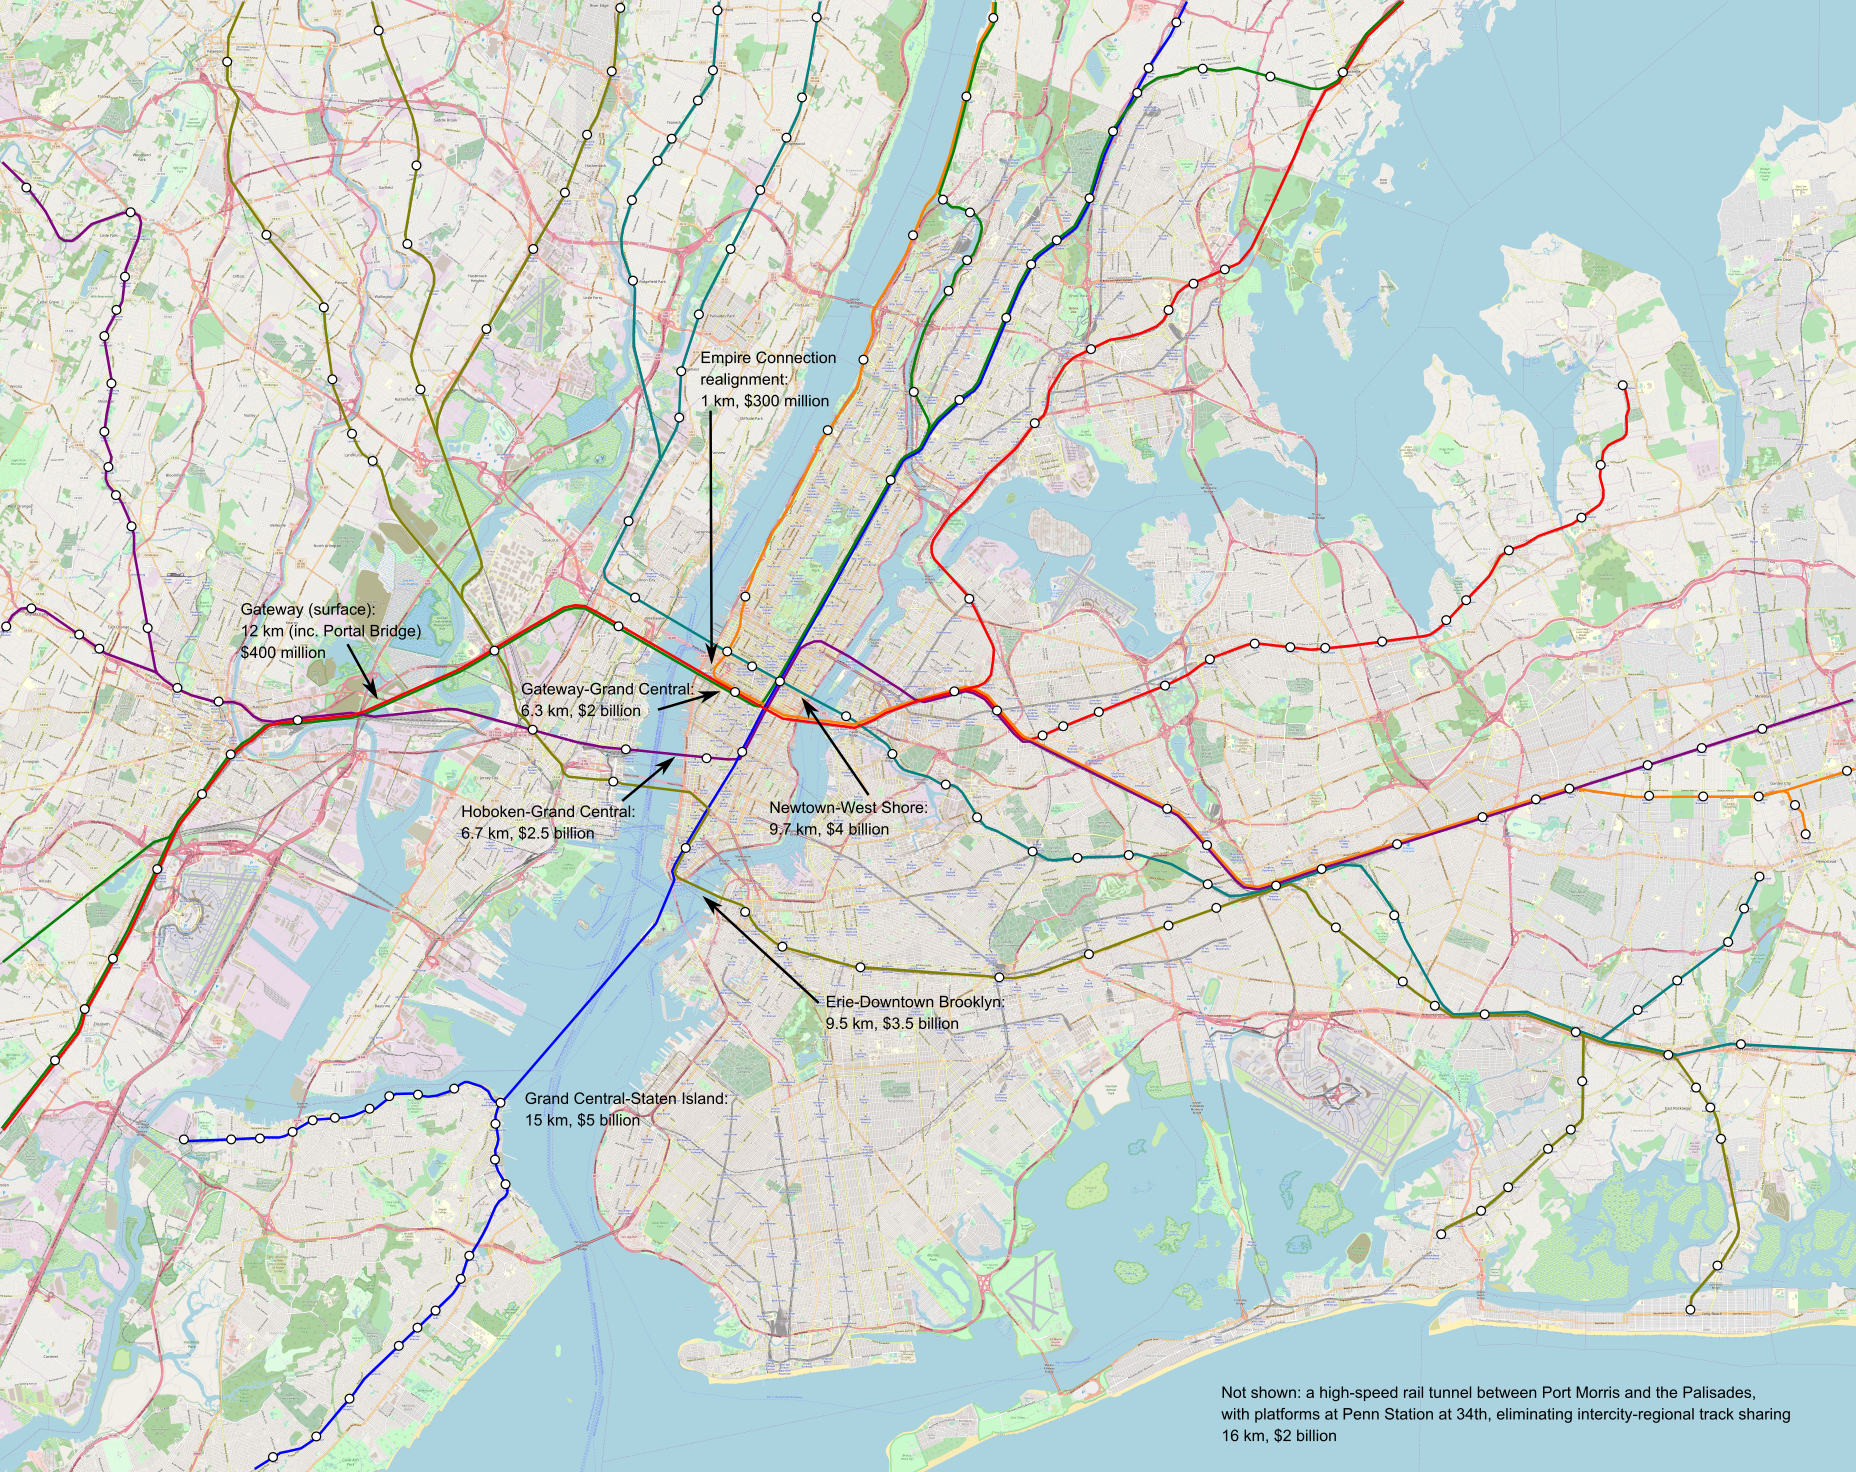
The issue is that too much traffic wants to use the Northeast Corridor lines in both New Jersey and Connecticut. Therefore, it’s not possible to segregate everything, with lines using the preexisting North River Tunnels and the new Gateway tunnels having to share tracks. It’s not optimal, but it’s what’s possible.
Timetable Padding Practices
Two weeks ago, the Wall Street Journal wrote this piece about our Northeast Corridor report. Much of it was based on a series of interviews William Boston did with me, explaining what the main needs on the corridor are. One element stands out since the MTA responded to what I was saying about schedule padding – I talk about how Amtrak and Metro-North both pad the timetables on the Northeast Corridor by about 25%, turning a technical travel time of an hour into 1:15 (best practices are 7%), and in response, the MTA said that they pad their schedules 10% and not 7%. This is an incorrect understanding of timetable padding, which speaks poorly to the competence of the schedule planners and managers at Metro-North.
The article says,
Aaron Donovan, a spokesman for the Metropolitan Transportation Authority, says the extra time built into Metro-North schedules generally averages 10%, depending on destination and length of trips, and takes into account routine track maintenance and capital work that can increase runtime. Metro-North continually reviews models, signal timing, equipment, and other elements of operation to improve travel times and reliability for customers, he says.
This is, to be clear, incorrect. Metro-North routinely recovers longer delays than 10%; delay recovery on the New Haven Line can reach well over 20 minutes out of a nominally two-hour trip, around 25% of the unpadded trip length. The reason this is incorrect isn’t that Donovan is dishonest or incompetent (he is neither of these two things), but almost certainly that the planners he spoke with genuinely believe they only pad 10%, because they, like all American railroaders, do not know how modern rail scheduling is done.
Modern rail scheduling practices in the higher-reliability parts of Europe and Japan start with the technical timetable, based on the actual speed zones and trains’ performance characteristics. This includes temporary speed restrictions. The ideal maintenance regime does not use them, instead relying on regular nighttime maintenance windows during which all tracks are out of service. However, temporary restrictions may exist if a line is taken out of service and trains are rerouted along a slower route, which is regrettably common in Germany. Modern signaling systems are capable of incorporating temporary speed restrictions – this is in fact a core requirement for American positive train control (PTC), since American maintenance practices rely on extensive temporary restrictions for work zones and one-off slowdowns. If the signal system knows the exact speed zones on each section of track, then so can the schedule planners.
The schedule contingency figure is computed relative to the best technical schedule. It is not computed relative to any assumption of additional delays due to dispatch holds or train congestion. The 7% figure used in Switzerland, Sweden, and the Netherlands takes care of the high levels of congestion on key urban segments.
The core urban networks in these countries stack favorably with Metro-North in track utilization. The Hirschengraben Tunnel in Zurich runs 18 S-Bahn trains per hour in each direction most of the day and 20 at rush hour with some extra S20 runs, and the Weinberg Tunnel runs 8 S-Bahn trains per hour and if I understand the network graphic right 7.5 additional intercities per hour. I urge people to go look at the graphic and try tracking down the lines just to see how extensively branched and reverse-branched they are; this is not a simple network, and delays would propagate. The reason the Swiss rail network is so punctual is that, unlike American rail planning, it integrates infrastructure and timetable development. This means many things, but what is relevant here is that it analyzes where delays originate and how they propagate, and focuses investments on these sections, grade-separating problematic flat junctions if possible and adding pocket tracks if not.
Were I to only take timetable padding into account relative to an already more tolerant schedule incorporating congestion and signaling limitations, I would cite much lower figures for timetable padding. Switzerland speaks of a uniform 7% pad, but in Sweden the figures include two components, a percentage (taking care of, among other things, suboptimal driver behavior) and a fixed number of minutes per 100 km, which at current intercity speeds resolve to 7% as in Switzerland. But relative to the technical trip time, the pad factors based on both observed timetable recovery and actual calculations on current speed zones are in the 20-30% range, and not 10%.
Of course, at no point do I suggest that Metro-North and Amtrak could achieve 7% right now, through just writing more aggressive timetables. To achieve Swiss, Dutch, and Swedish results, they would need Swiss, Dutch, or Swedish planning quality, which is sorely lacking at both railroads. They would need to write better timetables – not just more aggressive ones but also simpler ones: Metro-North’s 13 different stopping patterns on New Haven Line trains out of 16 main line peak trains per hour should be consolidated to 2. This is key to the plan – the only way Northern Europe makes anything work is with fairly rigid clockface timetables, so that one hour or half-hour is repeated all day, and conflicts can be localized to be at the same place every time.
Then they would need to invest based on reliability. Right now, the investment plans do not incorporate the timetable, and one generally forward-thinking planner found it odd that the NEC report included both high-level infrastructure proposals and proposed timetables to the minute. In the United States, that’s not the normal practice – high-level plans only discuss high-level issues, and scheduling is considered a low-level issue to be done only after the concrete is completed. In Northern European countries with competently-run railways and also in Germany, the integration of the timetable and infrastructure is so complete that draft network graphics indicating complete timetables of every train to the minute are included in the proposal phase, before funding is committed. In Switzerland, such a timetable is available before the associated infrastructure investments go to referendum.
Under current American planning, the priorities for Metro-North are in situ bridge replacements in Connecticut because their maintenance costs are high even by Metro-North’s already very expensive standards. But under good planning, the priority must be grade-separating Shell Interlocking (CP 216) just south of New Rochelle, currently a flat junction between trains bound for Grand Central and ones bound for Penn Station. The flat junctions to the branches in Connecticut need to be evaluated for grade-separation as well, and I believe the innermost, to the New Canaan Branch, needs to be grade-separated due to its high traffic while the ones to the two farther out branches can be kept flat.
None of this is free, but all of this is cheap by the standards of what the MTA is already spending on Penn Station Access for Metro-North. The rewards are substantial: 1:17 trip times from New Haven to Grand Central making off-peak express stops, down from 2 hours today. The big ask isn’t money – the entire point of the report is to figure out how to build high-speed rail on a tight budget. Rather, the big ask is changing the entire planning paradigm of intercity and commuter rail in the United States from reactive to proactive, from incremental to comfortable with groun-up redesigns, from stuck in the 1950s to ready for the transportation needs of the 21st century.
The Danbury Branch and Rail Modernization
I’ve been asked to talk about how rail modernization programs, like the high-speed rail plan we published at Marron this month, affect the Danbury Branch of the New Haven Line. The proposal barely talks about branch modernization beyond saying that the branches should be electrified; we didn’t have time to write precise branch timetables, which means that the timetable I’m going to post here is going to have more rounding artifacts. The good news is that modernization can be done cheaply, piggybacking on required work on the main of the New Haven Line.
Current conditions
The Danbury Branch is a 38 km single-track unelectrified line, connecting South Norwalk with Danbury making six additional intermediate stops. All stations have high platforms, but they are short, ranging between three and six cars.
Ridership is essentially unidirectional: toward Norwalk and New York in the morning, back north in the afternoon. There is little job concentration near the stations. Within 1 km of Danbury there are only 5,000 jobs per OnTheMap, rising to 10,000 if we include Danbury Hospital, which is barely outside the station’s 1 km radius (but is not easily walkable from it). Merritt 7 is in an office park, but there are only 6,000 jobs there, and nearly everyone drives. The other stations are parking lots, and Bethel is somewhat outside the town center for better parking.
The right-of-way is very curvy, much more so than the main line. Where most of the New Haven Line is built to a standard of 2° curves (radius 873 m), permitting 157 km/h with modern cant and cant deficiency, the Danbury Branch scarcely has a section straight enough with gentler curves than 3°, and much of it has such frequent 4° curves that trains cannot go faster than 100 km/h except for speedups of a few seconds at a time to recover delays.
A first pass on infrastructure and operations
It is effectively free to electrify a 38 km single-track line. The high-speed rail report estimates it at $75 million based on both European electrification costs (see report for sources) and the Southern Transcon proposal, which is $2 million/km on a busy double-track line. The junction between the branch and the main line is flat, but outbound trains can be timetabled to avoid conflict, and inbound trains have no at-grade conflict to begin with. If platform lengthening is desired, then it is a noticeable extra expense; figure $30 million for each eight-car platform, or perhaps half that on single track (but then some stops are double-track), maybe with some pro-rating for existing platforms if they can be easily reused.
The tracks should also be maintained to higher speed, which is a routine application of a track laying machine, with some weekend closures for construction followed by what should be an uninterrupted multidecade period of operations. The curves are already superelevated to a maximum of 5-6″; this is less than the 7″ maximum in US law (180 mm here), but the difference is not massive. The line has a 50 mph speed limit today for the most part, whereas it can be boosted to about 100-110 km/h depending on section, a smaller difference than taking the main line’s 70 mph and turning it into 150-160 km/h.
With a blanket speed limit of 110 km/h – in truth some sections need to dip down to 100 or even less whereas the Bethel-Danbury and Merritt 7-Wilton interstations can be done mostly at 130 – the trip time between South Norwalk and Danbury is, inclusive of 7% pad, 28.75 minutes. The Northeast Corridor report timetables have express New Haven Line commuter trains arriving South Norwalk southbound at :15.25 every 20 minutes and departing northbound at :14.75, so they’d be departing Danbury at :46.5 and arriving :43.5. Meets would occur at the :20, :30, and :40 points.
The :30 point, important as it is a meet even if service is reduced to every 30 minutes, is just south of Branchville, likely too far to use the existing meet at the station. Thus, at first pass, some additional double-tracking is needed, a total of 6 km if it covers the entire Cannondale-Branchville interstation, which would cost around $50 million at MBTA Franklin Line costs. MBTA Franklin Line costs are likely an underestimate, since the terrain on the Cannondale-Branchville interstation is hillier and some additional earthworks would be required on part of the section. A high-end estimate should be the cost of a high-speed rail line without elevated or tunneled segments, around $30 million/km or even less (cut-and-fill isn’t needed as much when the line curves with the topography), say $150 million.
The :20 point southbound is at or just south of Bethel. While this is in a built-up area, the right-of-way looks wide enough for two tracks and the topography is easier; if the station is the meet, then the cost is effectively zero, bundled into a platform lengthening project. Potentially, this could even be further bundled with moving the station slightly south to be closer to the town center. The :40 point southbound is at Merritt 7, which has room for a second track but not necessarily for a platform at it, and could instead get a second track on the opposite side of the platform if there’s enough of a rebuild to turn it into an island with additional vertical circulation; the cost of the second track itself would be a rounding error but the cost of station reconstruction would not be and would likely be in the mid-tens of millions.
How this fits into the broader system
The timetable in the report already assumes that New Haven Line service comprises 6 peak trains per hour (tph) that use the branches. The default assumption, reproduced in the service network graphic, is that New Canaan and Danbury get 3 tph each, and New Canaan gets a grade-separated junction but Danbury does not. Those trains all go to Grand Central with no through-running: only the local trains on the New Haven Line get to run through, since local trains are the highest priority for through-running. If a tunnel connecting the Gateway tunnel with Grand Central is opened, as in some long-term plans (here’s ETA’s, which isn’t very different from past blog posts’), then they can run through to it.
The establishment of this service is not going to, by itself, change the characteristic of ridership on the line. Electrification, better timetabling, and better rolling stock (in this order) can reduce the trip time from an hour today to 29 minutes, and the trip time to Grand Central from about 2:25 to 1:09, but the main effect would be to greatly improve the connectivity of existing users, who’d be driving to the parking lot stations more often, perhaps working from the office more and from home less, or taking the train to social events in the city. Some would opt to use the train to get to work at Stamford, as a secondary market. Over time, I expect that people would buy in the area to commute to work in New York (or at Stamford), but housing permit rates in Fairfield County are low and only limited TOD is likely. It would take concerted commercial TOD at the stations to produce reverse-peak ridership, likely starting with expanding the Merritt 7 office park and making it a bit less auto-oriented.
If the ridership isn’t there, then a train every 20 minutes is not warranted and only a train every 30 minutes should be provided. This reduces the double-track infrastructure requirement but only marginally, as the meets that are no longer needed are the easy ones and the one that still is is the hard one to build, south of Branchville. In effect, something like 80% of the cost provides two thirds of the capacity; this is common to rail projects, in that small cuts in an already optimized budget lead to much larger cuts in benefits, the opposite of what one hopes to achieve when optimizing cuts.
The Northeast Corridor Report is Out
Here is the link. If people have questions, please post them in comments and I’ll address; see also Bluesky thread (and Mastodon but there are no questions there yet).
Especial thanks go to everyone who helped with it – most of all Devin Wilkins for the tools, analysis, and coding work that produced the timetables, which, as the scheduling section says, are the final product as perceived by the passenger. Other than Devin, the other members of the TCP/TLU program at Marron gave invaluable feedback, and Elif has done extensive work with both typesetting and managing the still under-construction graphical narrative we’re about to do (expected delivery: mid-June). Members of ETA have looked over as well, and Madison and Khyber nitpicked the overhead electrification section in infrastructure investment until it was good. And finally, Cid was always helpful, whether with personal support, or with looking over the overview as a layperson.
