Do Rich and Poor People Work in Different Neighborhoods?
There are workplaces where most employees are high-income, for example office towers (or office parks) hosting tech firms, law firms, or banks. There are workplaces where most employees are working-class, for example factories, warehouses, and farms. Does this lead to a difference in commuting patterns by class? I fired up OnTheMap two days ago and investigated. This is American data, so it stratifies workers by income, education, industry, or race rather than by job class. I generated maps for New York and saw the following:
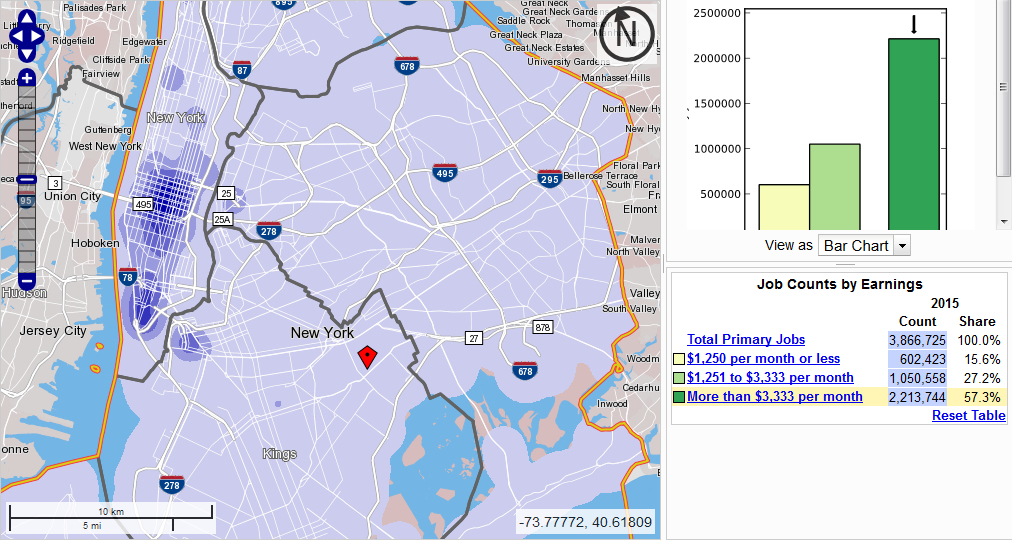
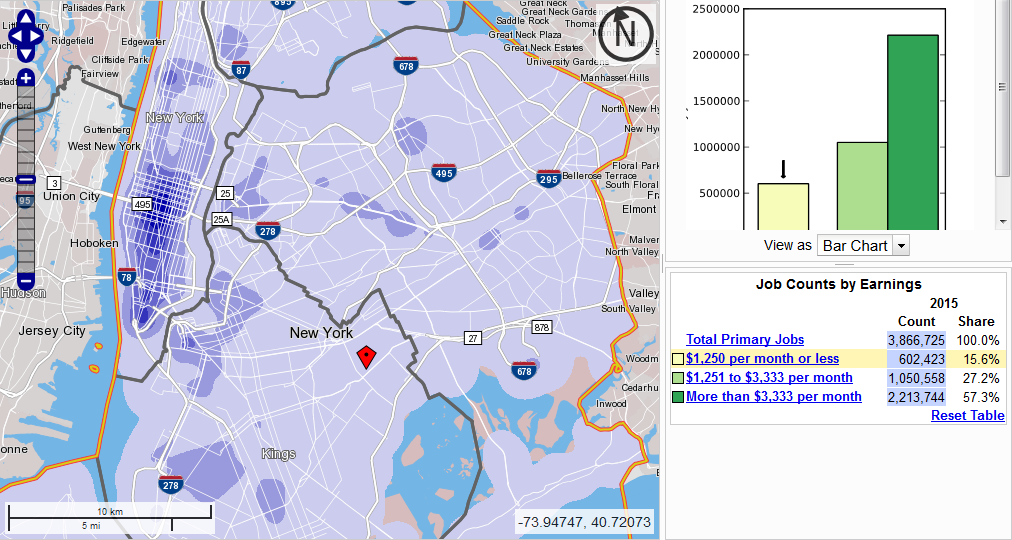
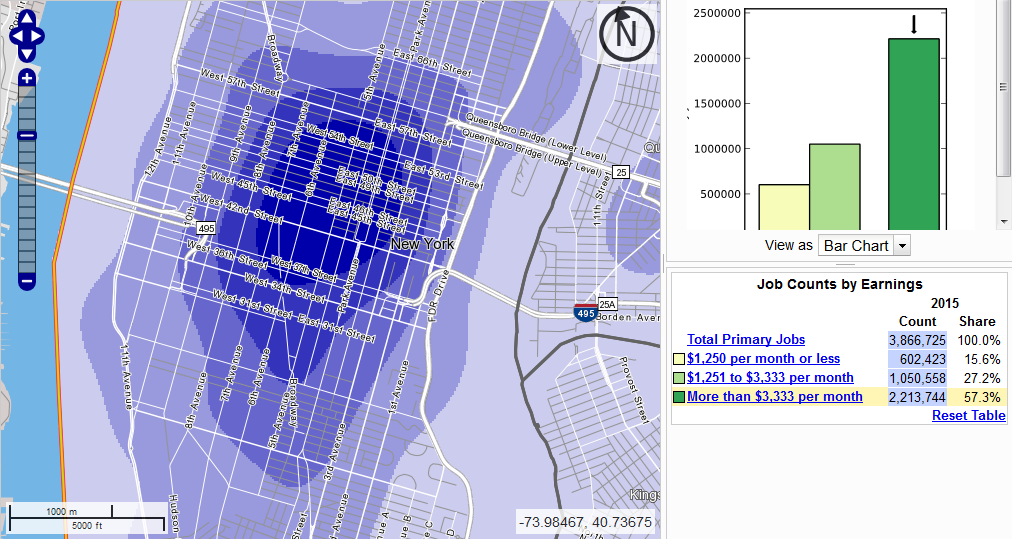
There are three income classes available, and I looked at the bottom and top ones, but the middle one, still skewed toward the working class, looks the same as the bottom class. The biggest observation is that Midtown is dominant regardless of income, but is more dominant for middle-class workers (more than $40,000 a year) than for low-income ones (up to $15,000, or for that matter $15,000-40,000).
The colors are relative, and the deepest shade of blue represents much more density for middle-class workers, even taking into account the fact that they outnumber under-$15,000 workers almost four to one. Among the lowest-income workers we see more work on Queens Boulevard and in Williamsburg, Flushing, and the Hub, but these remain tertiary workplaces at most. The only place outside Midtown, Lower Manhattan, or Downtown Brooklyn (which includes all city workers in Brooklyn due to how the tool works, so it looks denser than it is) that has even the third out of five colors for low-income workers is Columbia, where the low-income job density is one-third that of Midtown, and where there is also a concentration of middle-class workers.
The same pattern – job centers are basically the same, but there’s more concentration within the CBD for the rich – also appears if we look at individual neighborhoods. Here is the Upper East Side versus East Harlem:
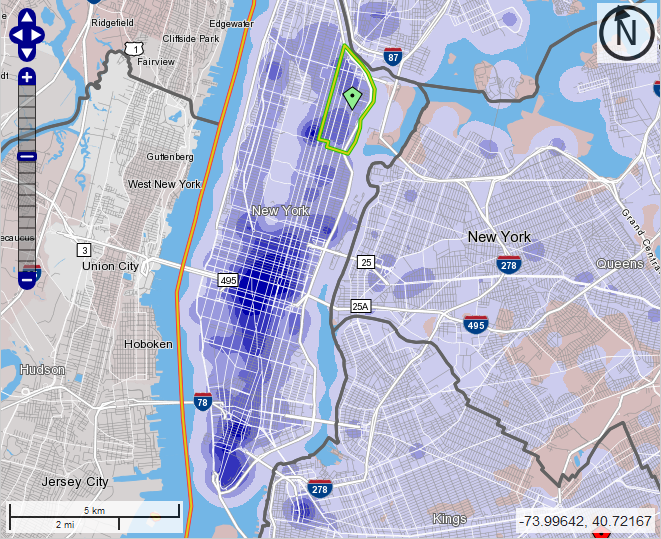
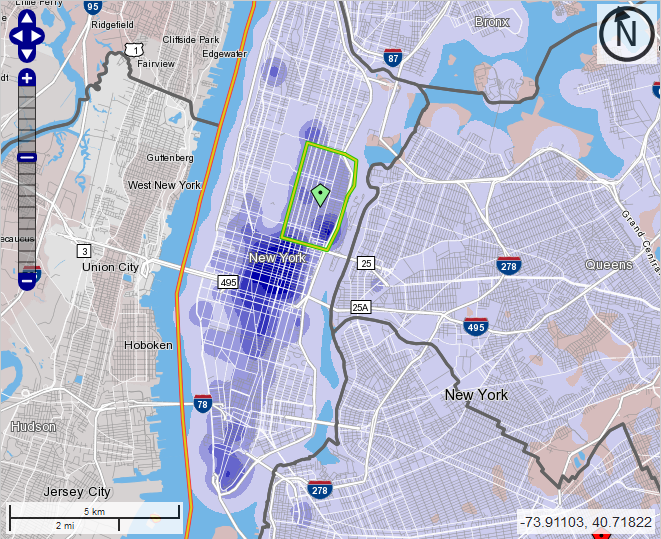
I chose these two neighborhoods to compare because they exhibit very large differences in average income and are on the same subway line. Potentially there could be a difference between where East Siders and West Siders work due to the difficulty of crosstown commuting, so I thought it would be best to compare different socioeconomic classes of people on the same line. With the East Side-only restriction, we see two Uptown job centers eclipse Columbia: Weill-Cornell Medical Center in Lenox Hill at the southeast corner of the Upper East Side, and Mount Sinai Hospital at the northwest corner.
One place where there is a bigger difference is the definition of Midtown. Looking at the general job distribution I’d always defined Midtown to range between 34th and 59th Street. However, there are noticeable differences by income:
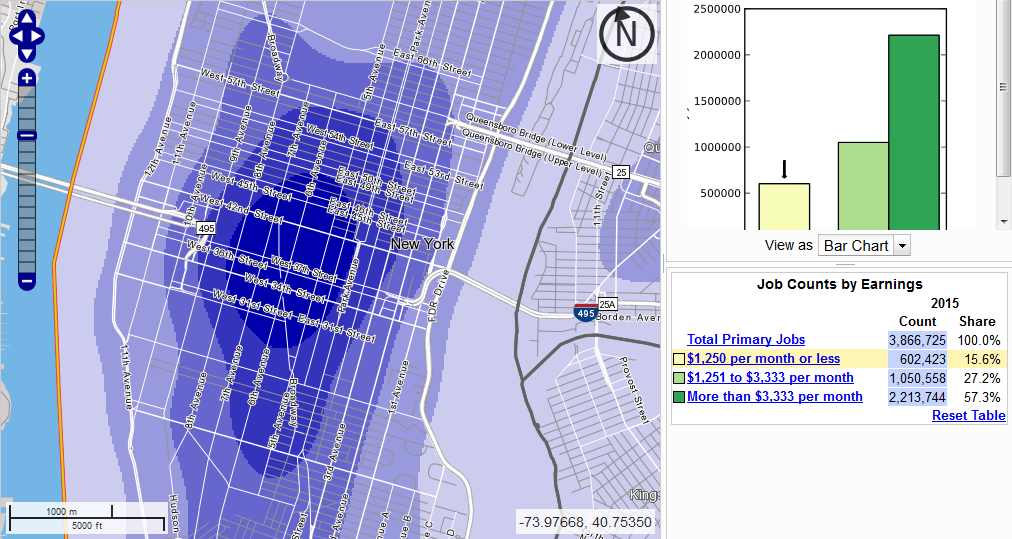
For the middle class, Midtown ranges from 34th to 57th Street and peaks around 47th. For the lowest-income workers, it ranges from 28th to 49th and peaks in the high 30s. My best explanation for this is that Midtown South and Union Square are more retail hubs than office hubs, featuring department stores and shopping centers, where the rich spend money rather than earning it.
In a deindustrialized country like the US or France, the working class no longer works in manufacturing or logistics. There are a lot of truck drivers today – 3.5 million in the US – but in 1920 the American railroad industry peaked at 2.1 million employees (source, PDF-p. 15), nine times today’s total, in a country with one third the population it has today and much less mobility. Manufacturing has plummeted as a share of employment, and is decreasing even in industrial exporters like Germany and Sweden. Instead, most poor people work at places that also employ many high-skill, high-income workers, such as hospitals and universities, or at places where they serve high-income consumption, such as retail and airports.
Since the working class works right next to the middle class, the nature of bosses’ demands of workers has also changed. Low-skill works now involves far more emotional labor; in Singapore, which makes the modern-day boss-worker relationships more explicit than the Anglosphere proper, there are signs all over the airport reminding workers to smile more. Nobody cares if auto workers smile, but they’re no longer a large fraction of the working class.
With the working class employed right next to the middle class, there is also less difference in commuting. For the most part, the same transportation services that serve middle-class jobs also serve working-class jobs and vice versa. This remains true even across racially segregated communities. The patterns of white New York employment are similar to those of middle-class New York employment, and those of black, Hispanic, and Asian employment are similar to those of the working class, with small differences (Asians are somewhat more concentrated in Flushing, and blacks in Downtown Brooklyn, reflecting the fact that blacks are overrepresented in public employment in the US and all city workers in Brooklyn are counted at Court Square).
This is true provided that opportunities for transportation are available without class segregation. This is not the situation in New York today. Commuter rail actually serves working-class jobs better than middle-class jobs, since Penn Station is closer to the department stores of 34th Street than to the office towers in the 50s. However, it’s priced for the middle class, forcing the working class to take slower buses and subway trains.
When I posted the above maps on Twitter, Stephen Smith chimed in saying that, look, the poor are less likely to work in the CBD than the middle class, so everywhere-to-everywhere public transportation is especially useful for them. While Stephen’s conclusion is correct, it is not supported by this specific data. In the $40,000 and up category, 57% of city jobs are in Manhattan south of 60th Street, compared with 37% in the $15,000-40,000 and under-$15,000 categories. It’s a noticeable difference, but not an enormous one. The reason Stephen is correct about how rides crosstown transit is different: people who can afford cars are very likely to drive if the transit option is not good (which it isn’t today), whereas people who can’t are stuck riding slow crosstown buses; in contrast, for CBD-bound commutes, the subway and commuter rail work reasonably well (especially at rush hour) and driving is awful.
Instead of trying to look specifically at low-income and middle- and high-income job centers, it’s better to just plan transit based on general commute patterns, and let anyone take any train or bus. This doesn’t mean business as usual, since it requires transitioning to full fare integration. Nor does this mean ignoring residential segregation by income, which in some cases can lead to transit segregation even in the face of fare integration (for example, the crosstown buses between the Upper East Side and Upper West Side have mostly white, mostly middle-class riders). Finally, this doesn’t mean relying on middle-class transit use patterns as a universal use case, since the middle class drives in the off-hours or to off-CBD locations; it means that relying on middle-class transportation needs could be reasonable. It just means that the rich and poor have substantially the same destinations.
An even bigger implication relates to questions of redevelopment. There have been periodic complaints from the left about gentrification of jobs, in which working-class job sites are turned over to high-end office and retail complexes. For example, Canary Wharf used to be the West India Docks. In New York, Jane Jacobs’ last piece of writing before she died was a criticism of Greenpoint rezoning, in which she specifically talked up the importance of keeping industrial jobs for the working class. But since the big deindustrialization wave, developments brought about by urban renewal, gentrification, and industrial redevelopment have not had any bias against providing employment for the poor. It’s not the factory jobs that the unionized working class still culturally defines itself by, but it’s industries that are hungry for low-skill work, and in many cases are serious target of unionization drives (such as universities).

Interesting line of research. It seems to validate the layout of the subway system, at least; no matter which is cause and which effect, the correlation is clearly there to see, as far as the downtown/midtown cores being the center(s) of the action. The data might even be interpreted to say that there is an incipient trend to fill in the gap between the two centers.
I think it would be nice to have an additional, higher tier of income, like one of $100k and above or to adjust the boundaries of the 3 you have now. At one point you call the over $40k people “middle class”, but you in other places refer to that as the “high income” group. A person making $40k in NYC might well be happy enough with their lot, but I imagine that they would identify more with the working class than the jet set, more hoi polloi than hoity-toity.
You warn us about the potential distortion in Brooklyn regarding the City employees working in Brooklyn all being officially located in downtown Brooklyn; does that suggest a similar possibility in lower Manhattan (perhaps also in the Bronx or Queens too)?
I wish you would get off the bandwagon of trying to fold the NYC commuter RR’s into the subway system. As I posted in your recent When are Express Trains Warranted, Part 1 … , there are a lot of problems with that idea, not the least of which are lack of capacity for both passengers (need more trains) and trains (tunnels and terminals at or near limits), and the extremely huge hits to revenue by cutting fares; not to mention the hits to political clout when you alienate the suburban riders who then desert the commuter rails and agitate for better roads. I suppose you could instead raise subway fares to commuter train levels instead; that might not alienate suburban riders as much and it could help reverse the decline in bus ridership – after all, what’s a little political chaos among friends, anyway?
The income numbers given are per worker, not per household, so $40,000 is lower middle class even in New York.
As for commuter rail: the Hub Bound Report gives capacity numbers per entryway into the Manhattan core. Check table 20 on PDF-p. 53: the LIRR and Amtrak, with four tracks that aren’t at track capacity (there are only about 37 peak LIRR tph and maybe 2 Amtrak tph coming from the east), carry 34,000 passengers into Manhattan.
In contrast, from the west, New Jersey Transit and Amtrak carry 30,000, almost as many, on two tracks. The busiest subway lines carry 29,000 (lettered lines, N/Q/R) or 28,000 (numbered lines, 2/3 and 4/5) per track pair, with much shorter trains – the IRT trains are equivalent to 6 mainline cars, and the LIRR runs 10-12 cars per train, which are also 20% wider than IRT cars. Even the New Jersey Transit capacity problems are overstated, but the LIRR carries about one third as many people per unit of train floor area as the busiest subway trains at the peak; the Hub Bound report mistakenly reports the LIRR car size as if it’s the same as the BMT and IND’s, and if you use correct numbers, there is about 1 passenger per square meter of train area, compared with 3 on the IRT expresses.
So there’s capacity on the LIRR trains for urban riders, as well as capacity on the tracks for additional trains. The hit to revenue coming from fare integration isn’t what you think it is, because people in Queens would be riding off-peak and not just at the peak, where they are the most expensive to serve.
Greatly over estimated. Take the subway a stop or two or three, change to the LIRR and then change to the subway again in Manhattan. For a longer total trip. Yeah, un-huh, sure.
It seems the biggest problem here is that rich people don’t want to be crowded together with poor people in the same train.
In Tokyo some commuter trains with reserved seats are appearing to cater to those types, together with advertisement promoting commuting at an earlier or later hour than the peak.
https://www.japanstation.com/seibu-railways-s-train-to-be-launched-on-saturday-march-25th/
As long as they pay extra for the train capacity they use and for the capacity increase that eventually becomes required, maybe that’s fine…
Of course this is an answer to johndmuller not to the article.
Alon, I wonder what the results would look like in a metro with more job sprawl than New York City. For example, one of the big failings among many of the transit system in Metro Detroit is that it provides bad service from the city of Detroit to the suburbs. A lot of (poor) urban residents work in the suburbs, many of which have decided to opt out of public transit entirely. The US has plenty of metro areas with dispersed employment.
This suggests a natural weakness of the methodology used in the original post. The dense concentrations of low-income workers might be in the same places as the dense concentrations of middle and high-income workers. But if low-income workers are largely working in strip malls and the like, then it may be that most of them are spread out across vast low-density spaces, while high income workers are concentrated in these centers.
Of course, for purposes of transit planning, it may well be that the dense concentrations are all that matter, and there’s just nothing to be done about the vast low density sprawls.
In Wayne County you do see more serious differences, sure. In the lowest-income category the highest employment density is still in the Detroit CBD and around the Woodward Avenue corridor, but then there are a bunch of job clusters in Dearborn around the malls, which are much smaller for the middle class. But the malls are still big destinations for the middle class, as consumers. There’s a transportation need to these malls regardless of income level – the difference is that cars satisfy it just fine, so everyone who can afford a car drives.
There should be blobs at the auto plants. There still are auto plants in Michigan. For instance Wikipedia says River Rouge in Dearborn still has 6,000 employees.