The Dynamics of Bus Bunching
I’ve been wanting to write a paper about how to use dynamical systems to analyze failure modes for transportation networks. So far I haven’t been able to analyze this more carefully, but there’s one relatively simple example, namely bunching along a single bus line. This intersects to some extent with what I did in math academia, although the mathematical tools I’m using are fairly primitive within dynamics, going back to the early 20th century and not to the advanced machinery that dynamicists have developed in the last forty years (like the Mandelbrot set). As a caution, despite the math jargon and the math paper structure, it’s a blog post, and not something I’d even be comfortable uploading to the arXiv.
The upshot of the mathematical model in this post is that several already-understood reforms can seriously reduce bus bunching: speeding up boarding through prepayment and all-door boarding, using bigger buses with many doors on the busiest routes, implementing signal priority and enforcing bus lanes better, and improving dispatching to tell bus drivers to maintain even headways leaving each terminus. Section 1 provides mathematical background, and people who know some dynamics can skip it; it’s meant to be accessible to a general audience (if you’ve heard of derivatives, you should be fine). Section 2 constructs the model for bus schedule variations, section 3 explains how the model predicts bunching, and section 4 goes into how the above interventions can improve the situation. The mathematics I’m using is not terribly advanced, but it may benefit from careful reading, especially around the formulas.
1. Background on dynamics and chaos
Before I left academia, when people asked me to explain my research, I’d use the following example. In dynamics, we study what happens when we take a function and iterate it many times. We are specifically interested in chaotic behavior, which arises when two very close numbers can end up widely separated after sufficient iteration. There is no chaos if we only look at linear functions, so the simplest example is quadratic:

The simplest behavior of any number when we apply a function many times is if nothing changes. A point where this happens is called a fixed point. Two numbers are fixed points for the function x^2: 0 and 1. But in practice, it’s useful to view infinity as a number, so that instead of being far away from each other, the numbers 1,000,000, 1,000,000,000, and -1,000,000 should be viewed as all very close to infinity. Under the squaring function, infinity is a fixed point as well.
The key to understanding the dynamics of a function is to look at the behavior of the function near a fixed point. Near the point 0, if we take the square of a number, it gets much smaller. For example, 0.1^2 = 0.01. This means that if a number x is close to zero, then as we iterate the function x^2 we will get closer and closer to 0, very quickly. This behavior is called attracting. Near 0, small changes in initial conditions don’t matter much: the numbers 0.1 and 0.11 are close, and if we keep squaring them, we will approach 0 either way. Infinity is attracting as well once you get used to thinking of very large (or very large with a negative sign) numbers as close to infinity: 1,000 is pretty close to infinity and 1,000^2 = 1,000,000, even larger, i.e. closer.
However, near the point 1, we get the opposite behavior: 1.1^2 = 1.21, which is about twice as far away from 1 as 1.1, and similarly 0.9^2 = 0.81, again about twice as far away from 1 as 0.9. We then say that 1 is a repelling point. Near a repelling point, we have chaotic behavior, because two points that start out close, like 0.9 and 1.1 or even 0.99 and 1.01, end up widely separated after iteration (0.99 eventually approaches 0, 1.01 eventually approaches infinity).
If you’ve learned calculus, your reaction to the line about how 1.21 is about twice as far away from 1 is “the derivative is 2!”. In general, the way to figure out whether a fixed point is attracting or repelling is to take the derivative f‘(x) at the point (technically it’s called the multiplier). If the absolute value of the derivative is less than 1, the point is attracting; if it’s more than 1, the point is repelling; if it’s exactly equal to 1, we say the point is indifferent and then the behavior near the fixed point depends on further details that I don’t want to get into. As a note of caution, taking the derivative anywhere except at a fixed point won’t tell you anything about the function – for example, the derivative of x^2 (which is 2x) is 4 when x = 2 but 2 is not repelling, it’s a non-fixed point that ends up going off to infinity.
(You may wonder what it exactly means to take the derivative at infinity. The answer is that if f is a polynomial, then the multiplier at infinity is always 0. If f is not a polynomial, there is a definition on Wikipedia.)
Attracting points are in every sense nicer to deal with than repelling points. Unfortunately, chaos is everywhere: most points of every nonlinear function are repelling. More precisely: in addition to fixed points, there are periodic points (i.e. fixed points of iterates). The periodic points of x^2 are a little hard to unpack if you’re not used to complex numbers: they’re solutions to equations like x^4 = x, x^8 = x, etc., and these are all complex numbers on the unit circle. We can compute multipliers there too (take the derivative of the iterate for which they’re fixed) and classify them as attracting or repelling. One of the foundational theorems of dynamics is that all but finitely many periodic points are repelling – and the number of non-repelling points is at most 2d-2 where d is the degree of the function (and if the function is a polynomial of degree d, then there are at most d-1, not counting infinity). My main contribution to math is to extend this result to a certain number-theoretic application.
2. Modeling buses using dynamics
The key insight of why buses bunch is that maintaining the exact schedule is a repelling fixed point, so small variations from the schedule (due to traffic, slow passengers, or random noise in passenger numbers) will compound over time, just as the variation of 0.9 or 1.1 from 1 compounds over time as you apply the squaring function.
More precisely, let’s say buses on a certain street run every 10 minutes. Eventually we will call the scheduled headway h, but to make this concrete, let’s say h = 10 minutes. Every few hundred meters, the buses stop to pick up and drop off passengers. Before San Francisco instituted prepayment, each additional passenger took on average 3.9 seconds to board and another 3.9 to disembark (link, PDF-p. 14); the TRB claims the average is 3 seconds to board (link, PDF-p. 20). We will call the extra boarding time per passenger b, and right now set b = 3 seconds = 0.05 minutes.
To understand why bunching occurs, let’s say that our bus falls behind schedule by a minute. It’s now 11 minutes behind the bus ahead (which we’ll assume is on schedule), not 10 minutes. On average, there will be 10% more passengers to pick up at each stop (passengers arrive at stops at a uniform rate). Let’s say the bus gets 60 boardings per hour (which is the Brooklyn-wide average). Typically we expect the bus to get 10 boardings in the next 10 minutes, but because there are 10% more passengers per stop, there will instead be 11 boardings. The one extra boarding will slow the bus down by 3 more seconds. The bus will then be 1:03 minutes behind. It’s a small difference, but over time it compounds.
There will also be more alightings as the bus gets more crowded, with a lag time equal to average passenger trip length. But in practice, to avoid introducing exponential factors, complicating the analysis, it’s best to just think of boardings plus alightings as a single metric, which if there are 60 boardings per hour equals 120 per hour or 2 per minute, and take note that a 1-minute delay only starts accumulating half a lag time in the future (e.g. 10 minutes if the average unlinked passenger trip is 20 minutes, as in New York). We call the number of boardings plus alightings per hour r, and in our example case r = 2.
If we choose our unit of time to be the minute, then the formula for the average delay a minute after our bus was x minutes behind the bus ahead is,
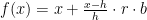
In the example we worked out above, it took 10 minutes to accumulate an additional 6-second delay (3 from boarding, 3 from alighting). Using the numbers h = 10, x = 11, b = 0.05, r = 2, verify that the formula spits out 0.01, or in other words an extra 0.6-second delay per minute. If x = h, that is if the headway between our bus and the bus ahead is exactly as timetabled, then there is no additional delay, making the correct headway a fixed point, but a repelling one. The multiplier is equal to,

Note that choosing units is important. The reason is that the mathematics I’m using assumes there are discrete steps: you apply the squaring function (or any other nonlinear function) once at a time. In reality, time is continuous. So to model it using discrete dynamics, it matters which unit of time we pick; this is the equivalent of choosing between x^2, x^4, x^16, or any other iterate. Fixed points will stay attracting or repelling (or indifferent) no matter what, but the exact value of the multiplier will change.
With this in mind, when our quantum of time is a minute, the multiplier with our usual values of h, b, and r is equal to 1.01. Every minute, a delay multiplies by a factor of 1.01. Within an hour, this factor grows to 1.82. This doesn’t seem too bad – it means a 1-minute delay turns into a 1:49-minute delay within an hour.
3. How bunching occurs
In section 2 we showed that if h is the scheduled headway, b is the average boarding time per passenger, r is the average number of boardings and alightings per unit of scheduled service time, and x is the current distance (in units of time) between our bus and the bus ahead of us, then within a minute we expect the distance to grow to
The multiplier is 1 + rb/h, which doesn’t seem too bad. However, there are complications. For one, the initial delay may be not 1 minute but longer. In Eric Goldwyn’s interviews with drivers, they cited traffic as the top reason why they believed bunching occurs, and barely mentioned passenger boardings. In math we cannot conflate popular perception with reality, but that the drivers complain about traffic suggests that there is widespread variation in the extent of the initial delays coming from missing a light, drivers blocking the bus lane, etc. If the initial delay is 2 minutes, then all delay numbers are naturally doubled over 1 minute.
But more importantly, our delayed bus will never bunch with the bus ahead. It will bunch with the bus behind. And the effect of the model of cascading delays on the bus behind us is exactly double what I described above. The reason is that if our bus is a minute behind – for example, 11 minutes behind the bus ahead when it should be 10 minutes behind – then the bus behind us, if it starts out on schedule, is now a minute ahead, only 9 minutes behind us when it should be 10 minutes. This means that within 10 minutes, we fall 6 seconds behind (and are thus 11:06 behind the bus ahead of us), but by the same token the bus behind us advances 6 seconds ahead (and is thus 8:48 behind us). In practice, the quantity relevant to bunching is the distance between two successive buses, and behind us, the multiplier is not 1.01 but 1.02. Within an hour a 1-minute delay reduces the gap between our bus and the bus behind us by 3:17, and a 2-minute delay reduces it by 6:34, almost two thirds of the way to catching up with us. If the initial delay is 1 minute, the bus behind us will actually catch up with us within 

And third, the multiplier grows as r grows and h falls – that is, it’s higher when the frequency is higher and when there are more riders per service hour. Keeping r at 2 (again, this is 60 boardings and 60 alightings per hour) but lowering h to 5 raises the multiplier to 1.02 ahead of us and 1.04 behind us. A multiplier of 1.04 with a headway of 5 minutes means the bus behind us will catch us within 
The real limiting factor to the capacity of city buses is not minimum stopping distance, unlike with trains. It’s that as the headway h decreases, bunching becomes so routine that adding more buses does not actually add capacity. If a bus runs every 2.5 minutes, keeping b = 0.05 and r = 2 gives us a multiplier of 1 + 0.05*2/2.5 = 1.04 ahead of us and then 1.08 behind us; the bus behind us will catch our bus within 12 minutes.
4. How to reduce bunching
The formula for the multiplier of the dynamical system formed by bus performance is 1 + rb/h where r is the rate at which passengers board and alight, b is boarding time per passenger, and h is scheduled headway. However, since as our bus gets further and further behind, the bus behind us gets further ahead relative to schedule and certainly relative to us, the multiplier relevant to bunching is 1 + 2rb/h. The bus behind us will catch ours in

minutes, where d is the initial delay (so we start the calculation from x = h + d). On very frequent buses, this will happen very quickly: 2.5-minute headways with New Yorkish assumptions on passenger traffic density and conservative assumptions on boarding speed yield a catchup time of just 12 minutes. So how do we prevent this?
4.1. Reduce boarding time per passenger
Off-board fare collection allows passengers to board the bus more quickly, without paying the driver. This has the effect of greatly reducing b, from 3 seconds to about 1.2 per the TRB. Prepayment also allows all-door boarding, effectively halving the average boarding time per passenger at stops without large volumes of disembarking passengers.
But in addition to prepayment, there are other ways of reducing b. Low-floor buses allow passengers to get on and off more easily; the reason San Francisco’s numbers are higher than the TRB’s is that San Francisco assumes a mostly high-floor bus fleet, whereas on the low-floor fleets boarding is much faster (in fact, faster on low-floor buses without prepayment than on high-floor buses with).
Adding more doors is desirable as well. The typical 12-meter bus has two doors, but some cities have purchased three-door buses, such as Nice and Florence. The typical 18-meter accordion bus has three doors, but in Florence I have seen four-door accordion buses; in contrast, the older accordion buses in New York only had two doors, slowing down boarding and alighting at busy stations. Per TRB data, three-door buses reduce b from 3 seconds to 0.9, or 0.015 minutes. One third the multiplier means roughly three times the time it takes to bunch.
4.2. Use bigger buses
The multiplier depends only on the rate at which passengers wish to board our route. Adding more bus service will reduce r (by spreading boardings across more service-hours) and h (by adding more frequency) at the same rate, but make it take less time for bunching to occur. Just running less service means passengers take longer to get on each bus, but also means that the passenger load per stop is less sensitive to fixed delays occurring upstream.
Of course, running less service is cruel to passengers and can discourage ridership due to a negative frequency-ridership spiral or (on the busiest routes) inadequate capacity. But running bigger buses to compensate can provide the necessary capacity while also helping reduce b through faster access and egress. As noted in section 4.1, accordion buses should have four doors, to minimize loading time.
4.3. Reduce random variability
None of this discussion would matter if we were guaranteed that buses would run exactly on schedule. Of course, they don’t and we cannot get such guarantee. However, we can look for treatments that would make initial delays less common. All-door boarding is one such treatment, in addition to its effect on average boarding time per passenger, because one of the factors that can cause delays is an unexpected wave of passengers all getting on and having to queue one at a time, for example if they come off class or transfer from a full train. Schools with synchronized class times can overload transit networks for the first few minutes after classes end. And in Shanghai, I had to wait 20 minute to buy a metro ticket coming off a full intercity train since two of the three ticket machines were broken and the train was full of visitors who didn’t already have the Shanghai Public Transportation Card.
But as Eric’s interviews with drivers suggest, the biggest single source of variability is traffic and not unusual passenger loads. Bus lanes reduce the impact of traffic, but may not reduce variability, since cars may block them unexpectedly. This suggests that better enforcement of bus lanes could improve schedule regularity and reduce bunching further downstream.
Another source of variability is traffic lights. Traffic lights are discrete: they’re red or green, and a bus that misses the light will be delayed by a full phase, which in New York means about 45 seconds (and in Bangkok means 3 or even 5 minutes). Giving buses signal priority even in its weakest form entails lengthening the green phase in the direction the bus travels in for a few seconds to let a bus through and avoid making it wait a full red phase. This would keep a lid on the maximum variability that a single intersection can produce. Note also that it’s very easy for a bus to be delayed at two successive intersections, for example if traffic is such that it’s a hair slower than usual, forcing it to miss two lights in rapid succession. In this case, 1.5-minute initial delays are routine, setting up bunching later.
4.4. Dispatch buses to maintain even headways at terminals
The most brutal way to eliminate bunching is to have dispatchers tell bus drivers to sit still for a few minutes if the bus either behind or ahead of them is too far behind. The subway in New York would do that to the trains to maintain something that to a manager at control center looked like even headways (“wait assessment”), which multiple independent sources have told me is responsible for falling subway speeds and increased delays. This brutal approach is unlikely to provide better service to riders.
However, telling bus drivers to sit still to maintain even headways has no such downside when it is done at the terminus of the bus route. At most, agencies would have to pay bus drivers some overtime, which is probably swamped by the positive effect reducing bunching has on ridership (or for that matter the fact that reducing bunching permits the transit agency to provide the same effective frequency with fewer service-hours).
4.5. More empirical research is needed
This section is a lot less quantitative than sections 1, 2, and 3, owing to the fact that we are stepping away from strict modeling. While quantifying the effect of low floors, more doors, bigger buses, and prepayment is easy within the confines of the model, quantifying the initial shock to ridership discussed in subsection 4.3 is more difficult. There is a range of plausible shocks, and the serious questions to ask are along the lines of “what is the 90% confidence interval of the travel time on each segment?”.
The literature review I’ve done for signal priority in particular is not comprehensive, but suggestive that there is no research yet in that direction. Figuring out exactly how common initial delays are and which treatments can reduce them by how much must be the next step.

An additional method to reduce bunching is to provide the driver a continuous information about his punctuality. This requires a system which more or less continuously transmit the position of the bus to to the control center (although an autonomous operation is possible as well; the schedules have to be in the bus information unit on board). Positioning can be done either using beacons or GPS, whereas beacons may be preferable. The information unit then uses an odometer to get the distance from the last beacon (this may lead to some funny results with light rail/streetcar in early fall when leaves fall and it just starts to rain…).
The bus information unit then can display the time distance between the standard schedule and the actual position of the vehicle. It does not help much in the case of delays, but it can prevent the next vehicle getting ahead of its schedule, and with that extend the time to bunch. It will also prevent the next vehicle to get overfilled, even if it is essentially on schedule.
If the control center has this information, it can order a bunching vehicle to drop the few passengers before the final stop and to reverse. With that, the schedule can kind of be made up quickly for the return trip.
Bunching will still occur, but its ripple effects can be reduced.
That involves holding buses to keep the schedule. It’s okay if the bus is running ahead of schedule, but if the bus is on schedule and it’s either behind or ahead of a delayed bus, it wrecks the timetable. New York holds trains this way on the subway and the result was a disaster.
Absolutely, the idea is to not let a vehicle (bus, light rail, streetcar) run ahead of schedule. With that, it is possible to keep a delay within a small number of vehicles/services, and keep the rest on schedule as much as possible. Of course, this system has an optimum interval length, which I think is around 6 minutes.
Stop consolidation should reduce the rate of bunching. If stops are not consolidated, there is a higher likelihood that lightly used stops will be skipped, which increases the rate at which a bus will catch up to the one ahead (at a rate of maybe 30 s per stop even for one passenger disembarking).
Maybe buses should be allowed to run ahead of schedule. With regular buses and not with trains or trolleybuses, faster drivers can overtake slower drivers, which prevents the shock from cascading. Maybe control should only happen at the terminal or by telling buses with buses close behind to skip stops not requested by people on board.
I feel like Vancouver has timed intersections city-wide (I always hit the same red lights). This should result in discrete intervals in time that are available to each bus. Missing one interval, pushes the bus to the next interval.
Running ahead of schedule is an absolute no-no. It may not be that critical if you have very short intervals (let’s talk 4 minutes or shorter), but that means that the line is busy, and running ahead of schedule and/or passing the previous bus will cause issues with the following ones.
Passing could be an option IF the passing bus takes over the service/schedule of the passed bus, and vice versa. This has, however, to be an action well controlled by the control center. And it may need later on a switch of driver, so that the driver will be back to his assigned service/schedule.
The notion of “slower” or “less experienced” driver must not affect the scheduled times. A driver must be able to hold the schedule if there are no external issues. That’s the reason for training and familiarizing with the route.
Once bus 2 passes bus 1, then bus 2 picks up all the excess passengers that bus 1 would have, while bus 1 picks up no passengers. So bus 2 slows down and bus 1 speeds up. The end result is that they stay bunched together forever. Not good.
I think I see Bus 2 continuing to move ahead of Bus 1 on the 99 B-Line, a busy 3-minute-headway limited-stop articulated diesel route with all-door boarding. Bus 2 has faster loading because there are no disembarking passengers. Bus 1 is already full and continues to fall behind because of the friction at the doors. I agree buses will stick together with lower headways.
An article you might be interested in, which describes en-route bus control strategies to improve schedule reliability: Xuan et al 2011 (https://www.sciencedirect.com/science/article/pii/S0191261511001093). Full disclosure: I worked with the authors on commercializing the control algorithm described in the paper.
There is a fairly broad literature on both bus control strategies and the effect of transit signal priority on bus speed and reliability.
Is that paper publicly available somewhere?
Yes, there’s a link to a PDF version on Xuan’s website: https://www.ocf.berkeley.edu/~xuanyg/publications.html.
Thanks a lot; got it down.
I may have read this paper before? (I remember reading some literature on bunching, IIRC by Argote.)
Do you have some good references re TSP and reliability? I’ve only seen literature for the effect of TSP on speed, not on bunching.
Here’s one I am aware of, which has some references to other literature: https://arxiv.org/abs/1806.09254. (You can see my biases here.)
Don’t discount operator performance variability. Newer drivers usually run slower compared to more experienced drivers used to the quirks of the route and its environs.
Bigger buses often result in longer headways since fewer buses are needed to maintain the same capacity. One would think that longer headways would be less susceptible to bus bunching, but there are more people are boarding/alighting at each stop, so it is not so obvious. Obviously congestion is an important factor in route reliability, but capacity issues are often the trigger for bus bunching: as the bus fills up, boarding and alighting take progressively longer. Once a bus hits capacity, it can really get bogged down at each stop. This is where bus-bunching sets in, and this is where it is most crucial that buses with free capacity are able to pass the one which is struggling. Ideally the full bus would no longer stop to pick up additional passengers until a significant portion of the riders have alighted.
I wanted to talk about this – the TRB says that you should add 0.5 seconds per passenger to board if the bus has standees. But then I worked this out and it turns out that if you assume that boarding time per passenger is linear in x/h (e.g. 2.5 seconds when the bus is empty, 3.5 when it’s twice as busy as it should be) then the formula becomes quadratic but the multiplier is still the same as if the boarding time were flat and equal to the time at x = 2h.
Letting buses leapfrog doesn’t really solve the problem, because if the bus behind mine leapfrogs then it’ll get bogged down at the next stop and then my bus will leapfrog and we’ll effectively platoon.
If the bus line is that busy you should have other solutions.
Click to access T0025.pdf
I may misunderstand it, but this is not really a busy bus line.
Every 3-4 minutes is not busy?
It’s very busy at the peak. Off-peak it’s every 10 minutes, and if you only look at the first direction (which is outbound) you won’t see the full 18 buses per hour frequency in the morning because it’s reverse-peak.
Bus drivers bring their stomachs, bladders and bowels to work with them. And want to work an 8 hour shift. Something is going on where they are scheduling buses around breaks and lunch. Silly them. I suspect that something even cleverer is going on where the few buses that go aalllllllllllllll the way out to the eastern end, where there is a bus garage, are where those drivers are based, Or sumptin’. Or the bus that gets stuck in the suckiest traffic of morning rush, the driver takes lunch at the garage on the eastern end, Or sumptin’
The limited bus leaves just before the local and skims off people that would be clogging the local. At the peak of the peak the express bus skims off people who would be clogging a local and magically turns into a local for the suburban end. Which gives people who use the buses serving the big bus terminal at the end of the line for the limited, more service to the suburban end. Silly silly bus company. It looks like it works out to be the local runs every six minutes during peak and just ahead of it there a slightly different bus that skims off the passengers who would create bunching, Silly.
Resist the urge to be offended that it’s not every four minutes at Broad and Market for timed transfers to the Broad Street Bus or to provide nice evenly timed service to Broad and Market. Just glancing at a few high frequency Market Street buses it’s less than every two minutes across downtown on Market Street, during peak. I didn’t bother to go do the same for Broad, it is. And I’m not going to expound on the very clever things going on at the western terminal of the limited bus. There’s all manner of clever things going on out there.
Concerning the ‘leap-frog’ effect, there often are multiple buses involved in the bunching (three and sometimes even four) and during the peak morning period there are few people embarking until the bus reaches the ‘central zone’. What should be a five minute headway becomes 15-20 minutes with multiple buses arriving simultaneously. The first bus is packed, the second is crowded, and the following ones may be almost completely empty. Letting the empty buses zoom ahead would at least help the bus arrival frequency get closer to the proper distribution, if not the proper order of buses (from an operational point of view).
IME, the biggest determinant is traffic. I take a bus from the Milwaukee CBD to 3.5 miles south with a timed transfer to a second bus at peak rush hour. It runs with clockwork efficiency with both buses arriving simultaneously. And it is just one of several timed transfers on the route.
The possibilities are endless when there’s no consequential traffic (i.e. having to wait at light cycles more than once).
What’s the frequency of these routes?
4 per hour at peak.
Is short-turning buses a worthwhile solution? Paris does this frequently.
Gonna go off topic and add that this is why on commuter rail, you want at two incoming tracks for last couple stations, so trains can arrive at destination in parallel.
Caltrain does this when their last baby bullet catches up to a limited near SF by running it on the opposite track. This reduces delays on the following train and can be done because frequency decreases after 7pm.
Except that’s where you’re in the city centre and land costs are at a premium.
Best approach is to have enough staff to clean the train so you can do a fast turnaround like the Japanese do.
BIg delays are due to requirement of brake test whenever push-pull train switches directions that requires that passengers to be off the trains or doors closed. Surely there must be a way to do that without such requirements like in other countries.
That is absolutely correct. In Switzerland, where most intercity and interregio trains are fixed push-pull sets, a simplified brake test can be done if the consist is not changed. There is no need to empty the train (tell that to the passengers when the train changes direction on its way…) or close doors.
Even before the intercity trains were push-pull, they were turned around in 6 minutes (uncouple incoming locomotive, outgoing locomotive moves from a very nearby holding track to the train, coupling, full brake test (which means checking all the brake indicators of the disk brake systems), being ready. The shortest turning around times I am aware of are push-pull sets where the outgoing cab is already manned by a driver, and that gets done within 3 minutes.
I think transit signal priority systems ought to be set up so that when a bus is too empty (either by fare box count or automated passenger counter data or by measuring axle weight) or too close to the one ahead of it (or perhaps too far ahead of the one behind it) (based on GPS position data of all buses on the route and travel time predictions derived from that), the transit signal priority system will not send an extended/early green request to the traffic signal controller.
This is a more subtle version of holding, of course.
In the case of the New York City Subway, isn’t most or all of the problem with holding that they have to run a timetable based system and not a headway based system because they’re near capacity and have lots of interacting routes, and any hold on one of the interacting routes on the NYC Subway is likely to cascade into delays for another route? I suspect there are a lot of bus routes where a hold for one bus on one route is unlikely to affect other routes significantly.
Transit agencies should also be identifying which drivers are the fastest, and educating those drivers about the importance of avoiding bunching and the opportunity to provide a gentler ride as an alternative to holding to reduce bunching.
The body of this blog post doesn’t seem to mention bus lane location, but it seems likely that center bus lanes are less likely to be obstructed by delivery vehicles and taxi or similar services dropping off passengers than bus lanes adjacent to parking lanes.
Usually when you’re near capacity, it’s easier to run on pure headway management (passengers don’t look at schedules when trains come every 3 minutes). But yes, the interlining forces New York to run the subways based on a schedule; they still try to run it by headway management, and the results aren’t good.
That said, headway management doesn’t solve bunching. If you tell a bus driver “start driving 5 minutes behind the bus ahead of you,” you’re still going to get into bunching unless you add mid-route control points, at which the bus is held if it’s ahead (or sped up if it’s behind using conditional signal preemption, but that’s similar to holding the bus whenever it’s not behind).
Trams don’t bunch.
Replace the bunchiest buses with trams and you’re all set.