Bus Stop Consolidation and Blocks
There are arguments over bus stop spacing in my Discord channel. As the Queens bus redesign process is being finalized, there’s a last round of community input, and as one may expect, community board members amplify the complaints of people who reject any stop consolidation on “they’re taking my stop, I’ll have to walk longer” grounds. I wrote about this in 2018, as Eric and I were releasing our proposed Brooklyn bus redesign, which included fairly aggressive consolidation, to an average interstation of almost 500 meters, up from the current value of about 260. I’d like to revisit this issue in this post, first because of its renewed relevance, and second because there’s a complication that I did not incorporate into my formula before, coming from the fact that the city comprises discrete blocks rather than perfectly isotropic distribution of residents along an avenue.
The formula for bus stop spacing
The tradeoff is that stop consolidation means people have to walk longer to the bus stop but then the bus is faster. In practice, this means the bus is also more frequent by a proportionate amount – the resources required to operate a bus depend on time rather than distance, chiefly the driver’s wage, but also maintenance and fuel, since stops incur acceleration and idling cycles that stress the engines and consume more fuel.
The time penalty of each stop can be modeled as the total of the amount of time the bus needs to pull into the stop, the minimum amount of time it takes to open and close the doors, and the time it takes to pull out. Passenger boardings are not included, because those are assumed to be redistributed to other stops if a stop is deleted. In New York and Vancouver, the difference in schedules between local and limited stop buses in the 2010s was consistent with a penalty of about 25 seconds per stop.
The optimum stop spacing can be expressed with the following formula:

To explain in more detail:
- d is a dimensionless factor indicating how far one must walk, based on the stop spacing; the more isotropic passenger travel is, the lower d is, to a minimum of 2. The specific meaning of d is that if the stop spacing is n, then the average walk is n/d. For example, if there is perfect isotropy, then passengers’ distance from the nearest bus stop is uniformly distributed between 0 and n/2, so the average is n/4, and this needs to be repeated at the destination end, summing to n/2.
- Walk speed and walk penalty take into account that passengers prefer spending time on a moving bus to walking to the bus. In the literature that I’ve seen, the penalty is 2. Usually the literature assumes the walk speed is around 5 km/h, or 1.4 m/s; able-bodied adults without luggage walk faster, especially in New York, but the speed for disabled people is lower, around 1 m/s for the most common cases.
- Stop penalty, as mentioned above, can be taken to be 25 s.
- Average trip length is unlinked; for New York City Transit in 2019, counting NYCT local buses including SBS but not express buses, the average was 3,421 meters.
- Average bus spacing is the headway between buses on the route measured in units of distance, not speed; it’s expressed this way since the resources available can be expressed in how many buses can circulate at a given time, and then the frequency is the product of this figure with speed. In Brooklyn in the 2010s, this average was 1,830 m; our proposed network, pruning weaker routes, cut it to 1,180. The Queens figure as of 2017 appears similar to the Brooklyn figure, maybe 1,860 m. Summing the average trip length and average bus spacing indicates that passengers treat wait time as a worst-case scenario, or, equivalently, that they treat it as an average case but with a wait penalty of 2, which is consistent with estimates in the papers I’ve read.
In the most isotropic case, with d = 2, plugging in the numbers gives,

However, isotropy is more complex than this. For one, if we’re guaranteed that all passengers are connecting to one distinguished stop, say a subway connection point, then consolidating stops will still make them walk longer at the other end, but it will not make them walk any longer at the guaranteed end, since that stop is retained. In that case, we need to set d = 4 (because the average distance to a bus stop if the interstation is n is n/4 and at the other end we’re guaranteed there’s no walk), and the same formula gives,

The Queens bus redesign recognizes this to an extent by setting up what it calls rush routes, designed to get passengers from outlying areas in Eastern Queens to the subway connection points of Flushing and Jamaica; those are supposed to have longer interstations, but in practice this difference has shrunk in more recent revisions.
That said, even then, there’s a complication.
City blocks and isotropy
The models above assume that passengers’ origins are equally distributed along a line. For example, here is Main Street through Kew Gardens Hills, the stretch I am most likely to use a New York bus on:
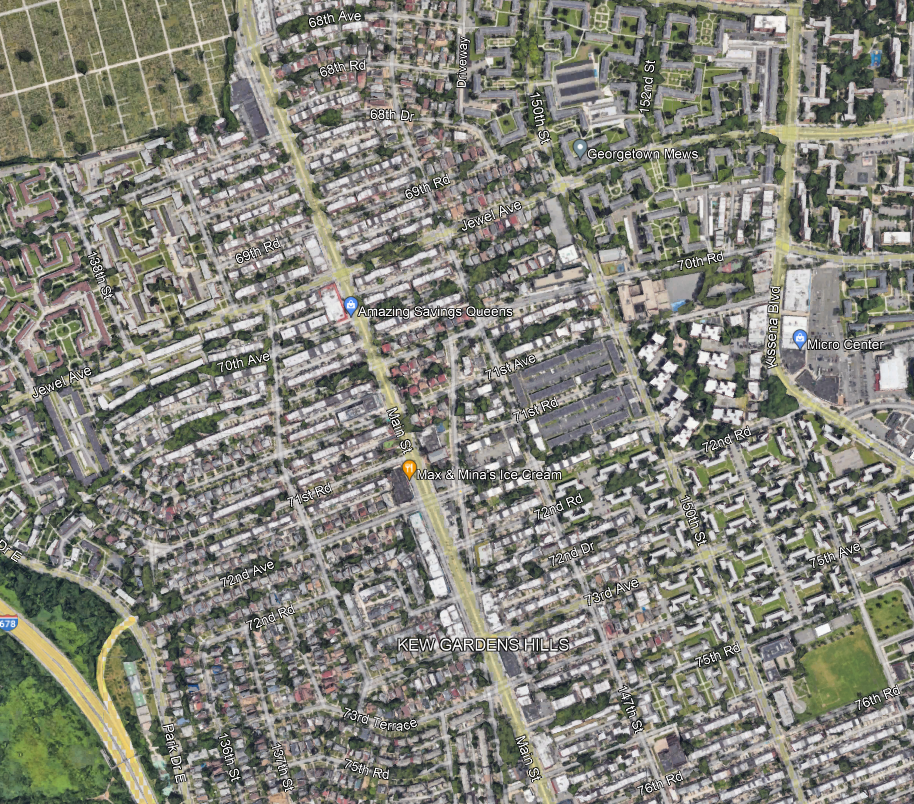
I always take the bus to connect to Flushing or Jamaica, but within Kew Gardens Hills, the assumption of isotropy means that passengers are equally likely to be getting on the bus at any point along Main Street.
And this assumption does not really work in any city with blocks. In practice, neighborhood residents travel to Main Street via the side streets, which are called avenues, roads, or drives, and numbered awkwardly as seen in the picture above (72nd Avenue, then 72nd Road, then 72nd Drive, then 73rd Avenue, then 75th Avenue…). The density along each of those side streets is fairly consistent, so passengers are equally likely to be originating from any of these streets, for the most part. But they are always going to originate from a side street, and not from a point between them.
The local bus along Main, the Q20, stops every three blocks for the most part, with some interstations of only two blocks. Let’s analyze what happens if the system consolidates from a stop every three blocks, which is 240 meters, to a stop every six, which is 480. Here, we assume isotropy among the side streets, but not continuous isotropy – in other words, we assume passengers all come from a street but are equally likely to be coming from any street.
With that in mind, take a six-block stretch, starting and ending with a stop that isn’t deleted. Let’s call this stretch 0th Street through 6th Street, to avoid having to deal with the weird block numbering in Kew Gardens Hills; we need to investigate the impact of deleting a stop on 3rd Street. With that in mind: passengers originating on 0th and 1st keep going to 0th Street and suffer no additional walk, passengers originating on 5th keep going to 6th and also suffer no additional walk, passengers originating on 2nd and 4th have to walk two blocks instead of one, and passengers originating on 3rd have to walk three blocks instead of zero. The average extra walk is 5/6 of a block. This is actually more than one quarter of the increase in the stop spacing; if there is a distinguished destination at the other end (and there is), then instead of d = 4, we need to use d = 3/(5/6) = 3.6. This shrinks the optimum a bit, but still to 576 m, which is about seven blocks.
The trick here is that if the stop spacing is an even number of blocks, then we can assume continuous isotropy – passengers are equally likely to be in the best circumstance (living on a street with a stop) and in the worst (living on a street midway between stops). If it’s an odd number of blocks, we get a very small bonus from the fact that passengers are not going to live on a street midway between stops, because there isn’t one. The average walk distance, in blocks, with stops every 1, 2, 3, … blocks, is 0, 0.5, 2/3, 1, 1.2, 1.5, 12/7, 2, … Thus, ever so slightly, planners should perhaps favor a stop every five or seven blocks and not every six, in marginal cases. To be clear, the stop spacing on each stretch should be uniform, so if there are 12 blocks between two distinguished destinations, there should be one intermediate stop at the exact midpoint, but, perhaps, if there are 30 blocks with no real internal structure of more or less important streets, a stop should be placed every five and not six blocks, especially if destinations are not too concentrated.

I’m curious: how do you measure impact of increased stop spacing during peak periods (lots of bus stops means the bus stops, lots) vs off peak (increased likelihood that nobody is getting on or off at any particular stop and since it’s a bus and not a train, no actual stop penalty)?
What’s the breakpoint where a potential passenger says no to increased distance based on personal attributes (older folks, especially) or time of day and weather (speaking for myself, plenty of times I’d walk more during a nice day, and at night and in the rain would delay the trip where possible)?
Good question! The distance between two buses is different by time of day, which argues in favor of closer stop spacing during busier periods. The numbers I give in the post aim for a compromise between peak and off-peak periods, averaging the distance over the daytime and evening (but not night).
If a particular stop has no riders, then you should probably cut it for low usage. The issue is that if the stop has riders, then it probably has just one rider. At least in New York, this is well below average – bus occupancy in 2019 averaged 17.1, whereas the average trip is around 13 stops at present-day spacing and 7 stops with any future consolidation, so at equilibrium we’re talking about 2.5 passengers per stop.
The amount of time supposedly saved by bus stop consolidation is exaggerated and contains many fallacies. The MTA suggests an average savings of 20 seconds per bus stop removed. This only considers savings in acceleration and deceleration time. It does not consider the fact that dwell times increase at some of the remaining stops and buses skip all lightly utilized stops (which were specifically targeted) if no one gets on or off. The actual savings is probably closer to 10 or 15 seconds. It also does not consider extra walking time. If the bus now saves three minutes, but you have to walk five minutes further, maybe two or three at each end, your trip will now take longer. If you miss a bus while walking further, your trip could be much longer especially since buses are noted to frequently not adhere to schedule.
I recently spoke about this to 300 people, mostly seniors, and received a huge applause. https://www.passengersunited.org/ridersreview
If you agree please add your name to the petition which has nearly 3,300 signatures. https://www.change.org/p/mta-oppose-the-mta-s-plan-to-eliminate-bus-stops
Also, read some of the thousand reasons or so why they signed. Our bus system is not only for young healthy people.
Alon addressed this. Consolidation does not increase dwell times, rather it distributes the same dwell time (because the same number of people are getting on/off) between fewer stops, but the total time is the same.
If average distance between stops is 260m and average ride length is 3421m, then the average trip is about 13 stops long. For a bus that carries 40 people, that means more than 3 people are getting on and 3 people getting off per stop. That implies that very few stops are currently being skipped, so this effect is negligible.
If this is your priority, you are focusing on the wrong thing. The distance between parallel bus routes is currently ~1km in much of the city. That means many people are forced to walk 500m just to get to the street a bus runs on. This is much more than the maximum ~215m needed to walk along a street to stops placed every 430m. To decrease walks to bus stops, the most effective measure would be to double the number of bus routes, spacing them 500m rather than 1000m apart, and running them half as often. You should support this, do you?
There is no yes or no answer to your question. When consolidating bus stops the MTA did not consider the spacing between bus routes and consolidated stops on routes with much greater spacing than 1000m apart. See my example for Northern Blvd. as far as running them less often, that depends on the current headways. Twice as many routes and reducing the headway from every five to ten minutes would be okay. But twice as many routes and reducing the headway from every 10 minutes to every 20 minutes would not be okay.
If the average trip is 13 stops and the stop penalty is 15 seconds then if you took 6 stops out that would save 90 seconds. If you add on walking another 125m on average at a fast pace that takes 75 seconds to walk – with people with small children or the elderly or disabled taking longer.
It’s basically a wash.
And don’t forget most bus trips are to/from a major stop so a reasonable number of stops will be skipped.
Alon. Don’t overlook that for many older people walking 6 or 7 blocks (500 meters) can be a real burden.
Waiting at a bus stop for 15 minutes in bad weather can also be a real burden.
This issue is greatly reduced if there is a shelter at the bus stop.
And fewer stops makes it more affordable to put shelters at all of them.
Except that if the bus stops are spaced every 5-6 blocks then the maximum walking distance along the line is only 2-3 blocks, plus any distance walking to the street the line is on. Walking to the line is the same distance regardless of stop spacing. For half of riders the walk distance doesn’t change at all, for one third of them it only adds an extra block, for one sixth it adds three blocks. Your concern is real, but it only applies to the small portion of the older population that cannot walk more than 5 blocks and lives between three to five blocks from a closed bus stop (if they live closer it is only a 3-5 block walk to a retained stop, if they live farther than it is already too far for them to reach the bus today.)
The key factor is what is the total walking distance to or from the bus stop before and after bus stop consolidation. On Northern Blvd bus stops were placed every two city blocks for good reason because there are no nearby parallel routes. Changing the stopping from every two blocks to every three wouldn’t have been so bad. However, every other bus stop was usually eliminated. That increased the maximum walk which had been one half mile, to 3/4 mile and that is unacceptable when the average local bus trip length is 2.3 miles. The domestic guideline is 1/4 walk to a local bus route.
@Allan Rosen
I’m afraid I don’t understand your math. Streets perpendicular to Northern Blvd are spaced 1/20th of a mile apart, which means going from two to four block stop spacing would in the worst case involve an extra walk of 0.1 miles, not 0.25.
Also, how is the maximum walk 0.5 mi before? I’m not sure what part of Northern you are referring to, but I don’t see anywhere you can walk 0.5 mi north or south of Northern without reaching some other bus line first (on Astoria, Bayside, 46th, etc.)
I lived in Kew Gardens Hills from October 1954 to May 1962 (72nd Rd & 137th St). During that time I regularly commuted to junior high in Rego Park and high school in Forest Hills. I also commuted for Manhattan summer jobs in 1958 and 1961. I was away at college from September 1959 onwards.
The area’s demographics have changed considerably. The current population is far less likely to rely on public transit for journey-to-work. Some of my recollection points to a shortcoming in your methodology for “optimum” bus stop spacing.
First, there was an additional route between Jewel Ave & Main St to/from the Union Tpk-Kew Gardens E&F station that ran Monday to Saturday. It was called the Vleigh Place Shuttle; it carried the same Q44 route designation, when I lived in Kew Gardens Hills. (It later received the Q44VP and Q74 short route name and was extended to Queens College.)
Almost all rush hour commuters, including myself and my father, used this route, rather than taking the bus to either Flushing or Jamaica.
This route’s usefulness became mute, when the bus route to Sutphin Blv, Jamaica was changed from Grand Central Pkwy-150th St-Hillside Ave to Main St-Queens Blv-Hillside Ave. The route change meant that Jamaica bound buses passed by the Van Wyck-Briarwood station. Travel time to Van Wyck was about the same as that to Union Tpk. This route is one the discontinued routes that has never been restored.
Despite this route’s popularity, several stops had no pickups between my stop and Union Tpk. This points out to an omission in your optimization.
What’s the penalty for sub-optimum bus stop spacing. I assume for shorter bus stop spacing it’s increased travel time due to the 25 second stop penalty. A bus stop is passed, if there are no boarding (or exiting) passengers. There is no stop penalty. Your optimization assumes that the bus will make all stops. This isn’t the case in practice for most routes with “sub-optimum” short distances between stops.
There is a metric that provides insight into the likelihood that a stop might receive passengers. That metric is the number of unlinked passenger trips (UPT) per vehicle-revenue-mile (VRM). This metric should be compared to bus stops per VRM. Let’s assume the trip-averaged bus stop distance is 500 feet. Then stops/VRM is 10.56 (5280/500). The average UPT/VRM for NYC local buses is around 8.0 UPT/VRM, according to the NTD. One reasonable estimate for the likelihood of passengers waiting at a bus stop would be the ratio: 8.0/10.56 or 0.76. If bus stop spacing were increased to the “more optimum” 1320 feet, the likelihood estimate would increase to 8.0/(5280/1320) or 2.0.
There is another shortcoming in your analysis. You have included only NYCT local buses to determine average trip distance. You need to include MTA Bus Company data, especially for Queens. There are obvious difficulties in using MTA Bus data because express service isn’t separate from local service in the NTD. However, MTA Bus represents about 25% of all local service.
The penalty for sub-optimum stop spacing is the actual operations varying substantially from the published schedule.
Say a bus takes 34 minutes to run if it stops at all stops, and 20 minutes to run if it stops at no stops. How are you going to schedule that 14 minute variance? (These are rounded numbers from a 10 mile line, peak speed 30 mph, stops initially at ~400 m and honestly not enough stop penalty). You should probably schedule to 34 minutes, which is likely closer to the peak need; but now during off-peak you’re likely to see lots of buses going too fast, with passengers missing entire departures as they see the bus whizzing past them six minutes (or more) early.
Just consolidating the stops to ~800 m changes the all stops run to 30 minutes, reducing the variance to 10 minutes. Still a lot, but a little bit harder for a fast driver to overrun. Smaller operational variations, over the course of an entire day, lead to more predictable operations, with fewer passengers missing buses and less bunching.
(These are rounded numbers from a 10 mile line, peak speed 30 mph, stops initially at ~400 m and honestly not enough stop penalty).
Examples need a real world basis for relevance.
There were 17,049 local bus trips scheduled on 24 May 2024, for Queens local buses. These are buses whose short route name starts with Q but not QM. The average trip length was 6.64 miles. Given a fixed distance between stops, this means the variance due to skipped stops is reduced by 66% from your example.
The maximum unmarked speed limit in NYC is 25 mph. Bus drivers are instructed not to exceed 20 mph on streets. There are also traffic signals. Let’s assume the effective duty cycle is 75%. (That’s a 50% duty cycle for a traffic signal every other block. NYC does not publish the location of its traffic signals – otherwise I might have traced out each route.) This means the average speed for buses between stops is 15 mph or 240 seconds per mile. Your figure at 30 mph was 120 seconds per mile. Let’s look at the 25 second penalty for a stop. Your figure was 25/120 or 21% of operating time. A more realistic figure for Queens is 25/240 or 10%. This means any variability due to skipped stops would have much less effect on scheduled trip duration.
Clearly, we have both had to make simplifications to models to reach conclusions. I believe this exercise has shown that a single simple model cannot be applied to all instances.
The average bus speed in Queens is 8.1 mph as of 2017, so a 7.5-minute mile, or 450 s. But then consolidating stops from every 250 m to every 500 means cutting around three stops per mile, so the saving is 75 s, which is 75/450 = 17%.
The average bus speed in Queens is 8.1 mph as of 2017
How did you derive this value?
Click the link anchored to “The Queens figure as of 2017.”
“Click the link anchored to “The Queens figure as of 2017.”
So, how did Scott Springer calculate the average speed?
N.B. the data tables for the Springer report appear to be from 2016.
Also, it would appear the average speed was average over routes not an average over trips. I’m making this assumption because there is no trip counts or total distance/time presented in the data.
For what it’s worth, I used the GTFS static tables to compare the Queens Bus Redesign. The GTFS static tables for the Redesign was included in the redesign web page, as a result of a FOIL request. (Guess who?)
The weekday results for Local/Ltd service Wednesday Mar 6, 2024 were:
exiting: 115,250 miles; 13,355 hours; 714,316 stops; 8.6 mph; 852 ft (260m)
redesign: 109,405 miles; 12,481 hours; 446,009 stops; 8.8 mph; 1,295 ft (394m).
Ooh. A couple points:
1. I’m surprised that weighting it by trips raises the average speed – I’d have expected the most frequent buses to be in more congested areas.
2. The redesign is cutting from 13,355 weekday hours to 12,481? Fuckers. They said it would be cost-neutral, not a service cut.
3. I should poke around other sources than GTFS to compare – I remember that the sources disagreed about the total daily service-hours in Brooklyn in 2018 (GTFS, printed timetables, employee rosters) by ~10%, and I read criticism that GTFS isn’t always reliable in New York.
4. In isolation, higher speed makes the impact of cutting stops on speed larger, because those 25 s/stop are a larger proportion of the trip. I’m assuming the redesign’s stop consolidation has such a small effect on speed because simultaneously it’s increasing service on more congested routes like the rush routes; the upshot is that making the LIRR usable within the city would allow a shift in resources away from routes that duplicate it and also get stuck in traffic in Flushing or Jamaica toward crosstown routes in lighter-traffic areas.
In isolation, higher speed makes the impact of cutting stops on speed larger,
I would hope the bigger takeaway would have been that a 52% increase in distance between stops resulted in only a 2% increase in terminal-to-terminal bus speed. This discrepancy should be enough to sound alarm bells. Have you ever calculated the correlation between these two parameters?
No, because too many other things happen in conjunction with stop consolidation (and, for example, the stops likeliest to be deleted under the current process are the ones most likely to have zero riders). That’s why I compare local and non-SBS limited buses on the same route.
“the stops likeliest to be deleted under the current process are the ones most likely to have zero riders”
If these stops have zero riders, what’s the advantage for eliminating them? :=)
“I compare local and non-SBS limited buses on the same route.“
I’ll bite. So far as I can tell, these are the Queens bus routes that have local and non-SBS limited service: Q10, Q114, Q17, Q25, Q27, Q36, Q4, Q43, Q46, Q5, Q58, Q6, Q65, Q83, Q85. (Derived from the GTFS schedule for May 22, 2024.)
What’s the correlation between bus stop spacing and bus speed for the portion of these routes and the times, when local and limited buses operate simultaneously?
Right, I suspect they eliminated the zero-rider stops and not the one- and two-rider stops, because of how the process works.
The Q10 has a large limited speed bonus but nearly all of it comes from taking a more direct route. Thq Q4 has a 5-6 minute limited speed gain/17 stops off-peak; at rush hour the speed gain is smaller, which I suspect is because the limited is more popular so it gets more riders. The Q5 has a 4-5 minute gain/15 stops off-peak, again reduced at rush hour – and on the farther out section on which the limited makes all local stops it’s slower than the local by 2 minutes at times. The Q25 has a 6 minute/21 stops limited speed gain reverse-peak but is actually 1 minute slower than the local in the peak direction. The more I look at it, the more it seems like the reason you can see low correlations between stop spacing and bus speed is that stop consolidation attracts more riders, who then slow down the bus since there’s front-door boarding with no prepayment on these routes.
The real lesson from your example is every possible stop needs to have a schedule, and the bus must not be more then 3 minutes early or late. (total of 6 minutes). With modern GPS we can track this, and dispatch needs to take action to keep that. If the bus is more than 3 minutes early tell the driver to wait and wait an extra minute (or turn off the signal priority system and wait at a light?), if the bus is more than 3 minutes late – you should have things in place to prevent that. Bus riders have places to be and they shouldn’t have to wonder if they will make it on time.
Don’t get me wrong – fast is critical as well. Do not slow your buses down any more than you must. I realize there is an inherent conflict in these two points. However people have places to go. They need to know that they will get there on time every time (or at least so often their boss never tells them to get a car), and they need to know when to walk out their front door. They need to know they won’t waste a lot of time on the bus.
That is the same fallacy the MTA is making that all buses stop at every stop. When my bus stop was eliminated in 2006, the MTA determined that a grand total of 54 passengers used that stop in 24 hours. Assuming no more than one person got on or off meant that something like one out of every ten buses stopped at that stop. Since the stop was eliminated, in most cases it just meant that the bus made an extra stop at the next stop instead of skipping that stop. So the number of times the bus has to stop virtually remains the same except that 54 more people a day have longer walks and longer trips with no one really benefitting.
Very interesting. I would think the key variable would be the quality of infrastructure (and perhaps weather) for walking/wheelchairing/etc. to and from each stop. In an ideal environment, walking a bit would actually be a plus rather than a minus, in addition to the bus benefits of spacing spots further apart.
Bus stop location/spacing by mathematics is almost as lame as the farside stop location kool aide. As you pointed out grid areas (much of Chicago) pretty much require stops for E-W to N-S routes even if they are closer together than the mathematical ideal; In other instances, randomly planted rail transit stations or major destinations dictate stop locations As aninstance near me, the mainentrance to alarge hospital complexand associated medical offices, is one block away from a veryweak crosstown service. The bus stops at both intersections partially as a convenience to patients who need shorter walks. In San Francisco, the numeric ideal is simply unrealistic in the many hilly areas where not even the most athletic of bus riders can or will walk multiple blocks up hill either coming or going.
In my experience as a rider attempting to persuade the local transit agencies to design better service, the planning staff trying to apply principles, formulae are sadly wasting time better spent out on the routes in question observing actual conditions. A couple of decades back, a recent hire planner proposed eliminating several local stop on SF Muni’s single busiest local bus line. The seniors howled and the plan was dropped. The hope had been to speed the local buses through a very dense area. The far smarter change a couple of years later was shifting the mix of local and limited stop buses so that the riders who needed close convenient stops would use the local (all stop), and the increased mix of expresses would gather those headed further out.
In another instance, the bus agency tried out a Rapid (definitely NOT legit BRT) overlay of a local bus route with terrible scheduling such that one often saw the local and Rapid playing leapfrog, then long gaps. Worse yet, the route had mostly low rise or single storey commercial buildings with few definable rider magnets for most of its length and only one cross-town line to transfer to/from. It turned out that the Rapid rarely saved more than a few minutes of an average 24 minute trip, while most trips were not end to end.
Lastly, if a given stop has low but regular usage, the bus need only stop if an intending rider is at the stop, or a rider signals to allight. No rider, keep moving. The only cost to the agency is maintaining the bus stop signage.
“The seniors howled and the plan was dropped” doesn’t sound like local conditions mattered. Rather, it sounds like the agency was subject to the heckler’s veto, and therefore could not provide the best service for everyone, including in particular the majority of riders who do not have the time or local knowledge to go to community meetings.
In the case of a grid like Chicago, you can still use these formulas to figure out the best stop spacing subject to the constraint that the grid points must have stops. Current practice is that with a grid route every 800 meters, there should be four stops per grid line; best practice is two stops per grid line. Vancouver’s grid is similar in that there’s about a major north-south road on the West Side every kilometer, and then the buses should stop at these roads and make one additional stop between each pair, without a local/limited distinction, which fucks up the frequency on these routes.
No. The seniors and younger parents resident in the “Tenderloin”were right to object to having less convenient service in the densest meighborhood in San Francisco. At the time 38 locals were very frequent, L (limiteds now designated R) weree less frequent. Flipping the frequencies was a far smarter way to retain convenience for the local riders while speeding longer distance riders by running more buses per hour. Muni’s route 38 and variants, were pre ovid the second busiest bus route in the US. (#1 at the time had been the M15 in Manhattan 1st Ave NB, 2nd Ave SB–presomably now less busy N of 63rd) As a long time rider to multiple destinatiomns on the route, II appreciate the improved service.
(I killed a duplicate comment.)
It’s not less convenient service; it’s walking two more blocks to a faster bus with fewer dizziness-inducing pullouts. It’s also a more frequent service than the local-and-limited split so common in North America, foisting headways of 9-12 minutes on routes that can support twice that. (The American notion of high frequency is a giant cope; in Canada, the frequent grids run every 8 minutes at worst, and many routes run more than that – and Nova Xarxa’s entire network runs every 3-8 depending on route, the median being 6.)
May I politely dissent? Having lived with transit in multiple forms, local only (very slow for long trips, but possibly more convenient if porting groceries, herding children), local and express (my preference for maximum flexibility), express only (great if your origin/destination pair fits, otherwise crap), and of course the many “transfer @…, then transfer again@…, I do favor mixed schedules.
About the “extra couple of blocks walking” I am about to turn 80; interestingly, I was 16 before I could keep up easily w/ my grandfather who was by then 86. I no longer can walk as fast;nor as comfortably up steep hills. YMMV. As an aside, SF Muni has actually improveda few routesrecently, including the main bus feeder to Golden Gate Park which facilitates going to huge music festivals.
“In my experience as a rider attempting to persuade the local transit
agencies to design better service, the planning staff trying to apply
principles, formulae are sadly wasting time better spent out on the
routes in question observing actual conditions. A couple of decades
back, a recent hire planner proposed eliminating several local stop on
SF Muni’s single busiest local bus line. The seniors howled and the
plan was dropped.“
[Attempts to blockquote simply fail to work at all with the hopelessly broken WYSIWG comment input box code. I’m sure even this will come out as a mess. Thanks, world wide Javascript heroes!]
Anyway, I rememeber that very very well.
A bunch of deranged loons “successfully” delayed conversion of mixed traffic lanes to bus lanes through the Tenderloin for well over a decade. Because, somehow “seniors”, or “communities of concern” (or in the case of the even more egregious “Calle 24” assholes who opposed MIssion Street bus lanes, “gentrification”.) Or something. Anything. Mostly just “kiss the ring.” Obeissance must be paid!
Well done! “Listening to Community Input” FTW! And so it repeats.
This is why we can’t have nice things, and never will have nice things.
“Bus stop location/spacing by mathematics is almost as lame as the farside stop location kool aide.“
Do you also have non-mathematical feels or vibes about the atmospheric carbon feedback cycle? Based solely on “observing actual conditions”, of course, not any types of “principles” or “formulae”.
Personal rule of stop spacing, if you can yell at the next stop coherently its too close (at least in the suburbs). Drives me up the wall in London where they keep an insane number of stops because they always have and no politician wants to take the pain and TfL thinks its too good to model/learn from abroad/think about cost control.
But even that’s nothing compared to the archaic insanity of some of the Japanese bus networks. I’ve been doing a case study on Himeji city, the local bus operator has 100 service patterns…..in a city of 500,000 and a pretty thick rail network.
The biggest issue in terms of UK spending is actually the projects outside London.
Take the line from Oxford to the car factory in Cowley. Surely the stations there could be built for the price it would cost to do in my back garden as per checkatrade.com plus the cost of a farm bridge to cost the railway, I.e. a few hundred thousand a stop.
Same with the Barking Riverside extension where things should have cost at most as much as the Helsinki airport line if not less for a tunnelled solution.
In comparison Crossrail that is perhaps 1.5-2x as a expensive as it should be given the huge complexities and where there are basically no comparisons to make is much better value.
I was sticking to bus operations. London has the only coherent bus network because TfL’s rail operations subsidise everything and the network effects are so humongous. It can afford some degree of incompetence in a way nowhere else can.
I agree cost disease both in capital and operations is the primary problem for the UK’s transit culture in general.
Even in London you are increasing the walk to the stop for perhaps 1/3rd of your customers by maybe 4 minutes in order to reduce journey times for the average trip by 2 minutes. I mean there’s a net gain but it’s not huge.
Especially when those who lose out will make a fuss.
And introducing all the ULEZ, bike lanes and the Bus lanes wasn’t? Excuses, and TfL has enough institutional heft to get away with it. They should have rolled it in during the introduction of modernised bus stands from the 1990’s. And speeding up average trip by 2 minutes is lot if you’re taking that bus 5 days a week 40 weeks a year. Not to mention it lowers your maintenance work per rider.
My maths is wrong anyway. The cost averages to 0 for the 1/3 of stops you are closing as the extra walking distance is 125m not 250m.
Yeah its probably worth the effort.
This seems relevant for providing feedback on WMATA’s ongoing better bus redesign. To ask some non-hypothetical questions:
Traffic lights should have bus priority. I.e when the bus is ready to go they should break cycle and go green for that road.
Doesn’t happen a lot, but it should and we easily have the technology.
Hey Alon which places have the best buses among rich countries, is there a German city you could recommend as a good example?
It’s really hard for me to say, given that the main reason I might be on buses in this country is that the trams are not working. I learned the expression Ersatzverkehr mit Bussen within days of arriving here.
I mean at megacity scale it would Seoul or Taipei among 1st world countries right. Seoul’s managed to keep bus ridership stable for decades thanks to its modernisation efforts in the context of affluence and a massive rail expansion.
https://www.seoulsolution.kr/sites/default/files/page/Seoul%20Statistical%20Series_03%20transportation.pdf
Based on my experiences:
Bergen, Bratislava, Hamburg are have good bus operations.
London, Dublin and Lisbon buses are bad.
Bergen has dedicated space for buses in the city center, including bus tunel and good suburban expreses.
Bratislava, my hometown, has bus lanes on some of the main corridors. What is better compared to other cities is loading speed, we use buses and troleybuses with lot of doors and crucialy city drivers are NOT selling tickets. Suburban buses are not goot though.
Stops are usualy spaced 600 meters apart, and almost all places are at most 600 far from transit stop. Most stops have shelter on city center direction, newer stops have kassel curbs and standardised height. Average speed is 20 kmph, more at night, less at trafic. Frequencies on main routes are 4 – 20 minutes ( trams have uniform 5 minute frequency ).
How common is it in Bratislava to use buses, as opposed to trams or trolleybuses?
Numbers for 2022 Bratislava city transit are following:
buses 133
troleybuses 27
trams 62
[Bilions of passenger kilometers]
https://imhd.sk/ba/doc/sk/10201/Prevadzkove-udaje-MHD-v-Bratislave.html#pr1
Bratislava hasn’t tried building an s-bahn with its legacy lines?
Thanks for the bus recs, they do good from some cursory looks. Wider stop spacing, not too many service types etc.
Geography is factor, for example in hilly Lisbon, with narrow, roundy streets, buses needs to have more stops and will be slow. It is different to walk 600 meters on flat versus to the hill. Also, stop penalty is smaler there.
Bratislava, Hamburg or, I suppose, New York have advantage of straight wider streets, with higher stop penalty.
My feeling is that around 400 – 600 meters is reasonable distance in most cities. Stops spacing is not only about speed, but also maintenance – shelter, electronic table, platform with kassel curb, you can not have this with 200 m spacing.
Also, stop penalty is even in the case when there are no passangers on the stop, because driver still needs to slow down, to check that there are no passangers.
New York usually doesn’t have shelter anyway; the Americans usually only install shelter as part of a PPP contract with an advertiser, rather than as a public service to bus riders, so installation is slow.
Is the walk speed around 5 km/h realistic number for New York ? I mean,it seems too optimistic even in less dense cities than New York. If you count waiting on streets crossings, having som bag or maybie kids, I thing average is lower than 5kmph, maybie 4 kmph. And looking on map of Queens, density seems relatively uniform, so optimal spacing is probably closer to 400 than 600 m.
In New York, it’s if anything low – New Yorkers walk fast, and anything less than 5 km/h gets you tagged as a tourist unless you’re visibly disabled or carrying luggage. Typical walk speed in Manhattan for an able-bodied adult is on the order of 45-50 s/block, which is around 6 km/h. Picking 5 is already a compromise with various kinds of encumbrance (wheelchair users average around 3.5-4 km/h).
To riff on a remark another commenter made above: if we can assume that approximately all passengers board/alight at a distinguished stop (a subway connection), should that also imply a gap in the stop spacing around this distinguished stop? A negligible fraction of people are interested in riding the bus for one stop. Thus if the ideal spacing for “ordinary” (“floating”) stops works out to, say, 500 m, should the closest such stop to a distinguished (“anchored”) stop be placed something like 750-1000 m away?
In theory, I can see this. In prcatice, probably not, because the distinguished stop is likely a node with a lot of density, so there may well be other destinations nearby. This is at least the situation at connection points that are also major centers in their own right, like Flushing and Jamaica; at connection points that have little else, your point is likelier to be correct.
Hey Alon,
question for you. How des this play out for grids with longer blocks. Like the busses that run on streets in Brooklyn perpendicular to the avenues. In some places, like midwood, the blocks are far enough apart that the obvious answer is every block gets a bus stop. But what about places like bedstuy Bushwick or southwest Brooklyn. Also, with longer blocks, how does this change the percentage of people that are using the route that live on the route and only walk along the bus line as opposed to coming from parallel streets, especially when the bus is on the most developed street, like ocean av
Ooh, good question!
In the case of buses on long blocks like the east-west ones in Bed-Stuy, the original continuous analysis holds. Passengers mostly live on long blocks rather than short ones, so they’re uniformly distributed along the street the bus runs on (or parallel streets), and the formula applies without the caveat about blocks. So per the formula, buses in this neighborhood and others with similar block spacing should stop every other long block.
Even if passengers live only on long blocks, passengers living on parallel side streets need to walk to a cross-street to get to the route. This creates a problem if there are mid-block stops, since living “behind” the stop on a side-street creates a 0.5 block average penalty. I believe it’s better to keep stops always at intersections even, and recover the average spacing using irregular intervals (e.g. 1 block spacing then 2 block spacing), than to use continuous spacing formulas and put stops mid-block.
Are there mid-block stops in Atlanta? Because in New York on the long blocks the practice is a stop at every intersection.
Not exactly. There are quite a few “tee” intersections, resulting from side streets coming off in alternation, so there are plenty of mid-block stops from the perspective of one of the sides. But Atlanta has an irregular grid and generally long blocks, it’s not designed well for buses, obviously.