Amtrak just released its report a week and a half ago, saying that Penn Expansion, the project to condemn the Manhattan block south of Penn Station to add new tracks, is necessary for new capacity. I criticized the Regional Plan Association presentation made in August in advance of the report for its wanton ignorance of best practices, covering both the history of commuter rail through-running in Europe and the issue of dwell times at Penn Station. The report surprised me by making even more elementary mistakes on the reality of how through-running works here than the ones made in the RPA presentation. The question of dwell times is even more important, but the Effective Transit Alliance is about to release a report addressing it, with simulations made by other members; this post, in contrast, goes over what I saw in the report myself, which is large enough errors about how through-running works that of course the report sandbags that alternative, less out of malice and more out of not knowing how it works.
Note on Penn Expansion and through-running
In the regional discourse on Penn Station, it is usually held that the existing station definitely does not have the capacity to add 24 peak trains per hour from New Jersey once the Gateway tunnel opens, unless there is through-running; thus, at least one of through-running and Penn Expansion is required. This common belief is incorrect, and we will get into some dwell time simulations at ETA.
That said, the two options can still be held as alternatives to each other, even as what I think is likeliest given agency turf battles and the extreme cost of Penn Expansion (currently $16 billion) is that neither will happen. This is for the following reasons:
Through-running is good in and of itself, and any positive proposal for commuter rail improvements in the region should incorporate it where possible, even if no dedicated capital investment such as a Penn Station-Grand Central connection occurs. This includes the Northeast Corridor high-speed rail project, which aims to optimize everything to speed up intercity and commuter trains at minimal capital cost.
The institutional obstacles to through-running are mainly extreme incuriosity about rest-of-world practices, which are generations ahead of American ones in mainline rail; the same extreme incuriosity also leads to the belief that Penn Expansion is necessary.
While it is possible to turn 48 New Jersey Transit trains per hour within the current footprint of Penn Station with no loss of LIRR capacity, there are real constraints on turnaround times, and it is easier to institute through-running.
The errors in the history
The errors in the history are not new to me. My August post criticizing the RPA still stands. I was hoping that Amtrak and the consultants that prepared the report (WSP, FX) would not stick to the false claim that it took 46 years to build the Munich S-Bahn rather than seven, but they did. The purpose of this falsehood in the report is to make through-running look like a multigenerational effort, compared with the supposedly easier effort of digging up an entire Manhattan block for a project that can’t be completed until the mid-2030s at the earliest.
In truth, as the August post explains, the real difficulties with through-running in the comparison cases offered in the report, Paris and Munich, were with digging the tunnels. This was done fairly quickly, taking seven years in Munich and 16 in Paris; in Paris, the alignment, comprising 17 km of tunnel for the RER A and 2 for the initial section of the RER B, was not even finalized when construction began. The equivalent of these projects in New York is the Gateway tunnel itself, at far higher cost. The surface improvements required to make this work were completed simultaneously and inexpensively; most of the ones required for New York are already on the drawing board of New Jersey Transit, budgeted in the hundreds of millions rather than billions, and will be completed before the tunnel opens unless the federal government decides to defund the agency over several successive administrations.
The errors in present operations
The report lists, on printed-pp. 40-41, some characteristics of the through-running systems used in Paris, Munich, and London. Based on those characteristics, it concludes it is not possible to set up an equivalent system at Penn Station without adding tracks or rebuilding the entire track level with more platforms. Unfortunately for the reputation of the writers of the report, and fortunately for the taxpayers of New York and New Jersey, those characteristics include major mistakes. There’s little chance anyone in the loop understands the RER, any S-Bahn worth the name, or even Crossrail and Thameslink; some of the errors are obviously false to anyone who regularly commuted on any of these systems. Thus, they are incapable of adjusting the operations to the specifics of Penn Station and Gateway.
Timetabling
A key feature of S-Bahn systems is that the trains run on a schedule. Passengers riding on the central trunk do not look at the timetable, but passengers riding to a branch do. I memorized the 15-minute off-peak Takt on the RER B when I took it to IHES in late 2016, and the train was generally on time or only slightly delayed, never so delayed that it was early. Munich-area suburbanites memorize the 20-minute Takt on their S-Bahn branch line. Some Thameslink branches drop to half-hourly frequency, and passengers time themselves to the schedule while operators and dispatchers aim to make the schedule.
And yet, the report repeatedly claims that these systems run on headway management. The first claim, on p. 40, is ambiguous, but the second, on the table on p. 41, explicitly contrasts “headway-based” with “timetable-based” service and says that Crossrail, the RER, and the Munich S-Bahn are headway-based. In fact, none of them is.
This error is significant in two ways. First, timetable-based operations explain why S-Bahn systems are capable of what they do but not of what some metros do. The Munich S-Bahn peaks at 30 trains per hour, with one-of-a-kind signaling; major metros peak at 42 trains per hour with driverless operations, and some small operations with short trains (like Brescia) achieve even more. The difference is that commuter rail systems are not captive metro trains on which every train makes the same stops, with no differentiation among successive trains on the same line; metro lines that do branch, such as M7 and M13 in Paris, are still far less complex than even relatively simple and metro-like lines like the RER A and B. The main exception among world metros is the New York City Subway, which, due to its extensive interlining, must run as a scheduled railroad, benchmarking its on-time performance (OTP) to the schedule rather than to intervals between trains. In the 2000s and 10s, New York City Transit tried to transition away from end-station OTP and toward a metric that tried to approximate even intervals, called Wait Assessment (WA); a document leaked to Dan Rivoli and me went over how this was a failure, leading to even worse delays and train slowdowns, as managers would make the dispatchers hold trains if the trains behind them were delayed.
The second consequence of the error is that the report does not get how crucial timetable-infrastructure planning integration is on mainline rail. The Munich S-Bahn has outer branches that are single-track and some that share tracks with freight, regional, and intercity trains. The 30 tph trunk does no such thing and could not do such thing, but the branches do, because the trains run on a fixed timetable, and thus it is possible to have a mix of single and double track on some sporadic sections. The Zurich S-Bahn even runs trains every 15 minutes at rush hour on a short single-track section of the Right Bank of Lake Zurich Line. Recognizing what well-scheduled commuter trains can and can’t do influences infrastructure planning on the entire surface section, including rail-on-rail grade separations, extra tracks, yard expansions, and other projects that collectively make the difference between a rail network and crayon.
Separation between through- and terminating lines
Through-running systems vary in how much track sharing there is with the rest of the mainline rail network. As far as I can tell, there is always some; near-complete separation is provided on the RER A, but its Cergy branch also hosts Transilien trains running to Gare Saint-Lazare at rush hour, and the Berlin and Hamburg S-Bahn systems have very little track-sharing as well. Other systems have more extensive track sharing, including Thameslink, the RER C and D, and the Zurich S-Bahn; the RER E and the Munich S-Bahn are intermediate in level of separation between those two poles.
It is remarkable that, while the RER A, B, and E all feature new underground terminals for dedicated lines, the situation of the RER C and D is different. The RER C uses the preexisting Gare d’Austerlitz, and has taken over every commuter line in its network; the through-connection between Gare d’Orsay and Gare d’Invalides involved reconstructing the stations, but then everything was connected to it. The RER D uses prebuilt underground stations at Gare du Nord, Les Halles, and Gare de Lyon, but then takes over nearly all lines in the Gare de Lyon network, with the outermost station, Malesherbes, not even located in Ile-de-France. Thameslink uses through-infrastructure built in the 1860s and runs as far as Petersborough, 123 km from King’s Cross on the East Coast Main Line, and Brighton, the terminus of its line, 81 km from London Bridge.
And yet, the report’s authors seem convinced the only way to do through-running is with a handful of branches providing only local service, running to new platforms built separately from the intercity terminal; they’re even under the impression the RER D is like this, which it is not. There’s even a map on p. 45, suggesting a regional metro system running as far as Hicksville, Long Beach, Far Rockaway, JFK via the Rockaway Cutoff and Queenslink, Port Washington, Port Chester, Hackensack, Paterson, Summit, Plainfield, New Brunswick, and the Amboys. This is a severe misunderstanding of how such systems work: they do not arbitrarily slice lines this way into inner and outer zones, unless there is a large mismatch in demand, and then they often just cut the outer end to a shuttle with a forced transfer, as is the case for some branches in suburban Berlin connecting to S-Bahn outer ends. Among the above-mentioned outer ends, the only one where this exception holds is Summit, where the Gladstone Branch could be cut to a shuttle or to trains only running to Hoboken – but then trains on the main line to Morristown and Dover have no reason to be treated differently from trains to Summit.
Were the report’s authors more informed about just the specific lines they look at on p. 41, let alone the broader systems, they’d know that separation between inner and outer services is contingent on specifics of track infrastructure, including whether there are four-track lines with neat separation into terminating express trains and through locals. But even if the answer is yes, as at Gare de Lyon and Gare d’Austerlitz, infrastructure planners will attempt to shoehorn whatever they can into the system, just starting from the more important inner lines, which generate more all-day demand. There don’t even need to be terminating regional trains; the Austerlitz system doesn’t, and the Gare de Lyon and Gare de l’Est systems only do due to trunk capacity limitations. In that case, they’d recognize that there is no need to have two commuter rail systems, one through-running and one not. Penn Station’s infrastructure already lends itself to allowing through-running on anything entering via the existing North River Tunnels.
Branching
S-Bahn systems usually try to keep the branch-to-trunk ratio to a manageable number. Usually, more metro-like systems have fewer branches: Crossrail has two on each side, the RER A has two to the east and three to the west, the Berlin Stadtbahn has two to the west plus short-turns and five to the east, the Berlin North-South Tunnel has three on each side. The Munich S-Bahn has five to the east and nine to the west, and the combined RER B and D system has three to the north and five to the south, but the latter has more service patterns, including local and express trains on the branches. Zurich has so much interlining that it’s not useful to count branches, and better to count services: there are 21 S-numbered routes serving Hauptbahnhof, of which 13 run through one of the two tunnels, as do some intercity trains.
If there are too many branches, then they’re usually organized as sub-branches – for example, Munich has seven numbered routes through the central tunnel, of which two have two sub-branches each splitting far out. Zurich has fewer than 13 branches on each side, but rather there are several services using each line, with inconsistent through-pairing – for example, the three services going to the airport, S2, S24, and S16, respectively run through to two separate branches of the Left Bank Line and to the Right Bank Line.
The table on p. 41 gets the branch count mildly wrong, but the significant is less in what it gets wrong about Europe and more in what it gets wrong about New York. A post-Gateway service plan is one in which New Jersey has 12 branches, but some can be viewed as sub-branches (like Gladstone and the Morristown Line), and more to the point, there are going to be two trunk lines. The current plan at New Jersey Transit is to assign the Northeast Corridor and North Jersey Coast Lines to the North River Tunnels alongside Amtrak, which is technically two branches but realistically four or even five service patterns, and the Morris and Essex, Montclair-Boonton, and Raritan Valley Lines to Gateway, which is four branches but could even be pruned to three with M&E divided into two sub-branches. The Erie lines have no way of getting to Penn Station today; to get them there requires the construction of the Bergen Loop at Secaucus, with an estimated budget of $1.3 billion in 2020, comparable to the total cost of all yet-unfunded required surface improvements in New Jersey for non-Erie service combined.
If the study authors were more comfortably knowledgeable of European S-Bahn systems, they’d know that multi-line systems, while uncommon, do exist, and divide branches in a similar way. The multiline systems (Paris, Madrid, Berlin, Zurich, and London) all have some reverse-branching, in a similar manner to how New York is soon going to have the New Haven Line reverse-branch to Penn Station and Grand Central. The NJT plan is solid and stands to lead to a manageable branch-to-trunk ratio, even with every single line going to Penn Station via the existing tunnel running through.
The consequence of the errors
The lack of familiarity with through-running commuter rail is evident in how the report talks about this technology. It is intimately related to the fact that the way investment should be done is different from what American railroaders are used to. For one, there needs to be much tighter integration between infrastructure and scheduling. For two, the scheduling needs to be massively simplified, with fewer operating patterns per line – usually one, occasionally two, never 13 as on the New Haven Line today. The same ignorance that leads Amtrak and its consultants to assert that the S-Bahn runs on headway management rather than a fixed timetable also leads them not to even know how through-running commuter rail networks plan out their routes and services.
From my position of greater familiarity as both a regular user and a researcher, I can point out that the required investments to make through-running happen in New York are entirely in line with the cheap surface projects done in the comparison cases. New rolling stock is required, with the ability to run on the different voltages of the three networks – but multi-voltage commuter rolling stock is the norm wherever multiple legacy electrification systems coexist, including Paris, London, and Hamburg. Some extensions of electrification and high platform conversions are required – but these are not expensive, and the latter is already partly funded at reasonable unit costs. Some rail-on-rail grade separations are required – but those are already costed and very likely to be funded, potentially out of the Bipartisan Infrastructure Law.
Penn Station would be used as the universal station in this schema, without the separation into a surface terminal and a through- underground station seen in Munich and Paris. But then, Paris and Munich don’t even universally have this separation themselves; Ostbahnhof was reconstructed for the S-Bahn but is still a single station, and the same is true of the RER C. In a way, Penn Station already is the underground through-station, built generations before the modern S-Bahn concept, complementing and largely replacing surface terminals like Hoboken and Long Island City because those are not in Manhattan.
None of this is hard; the hard part is the Gateway tunnel and that’s already fully funded and under construction. But it does require understanding that the United States is so many decades behind best practices that none of what American railroaders think they know is at all relevant. It’s obligatory to understand how the systems that work, in Europe and rich Asia, do, because otherwise, it’s like expecting someone who has never learned to count beyond 10 to prove mathematical theorems. The people who wrote this report clearly don’t have this understanding, and don’t care to get it, which is why what they write is not worth the electrons that make up the PDF.
The 2025-29 capital plan is out, and it is not good. There’s an outline of an ETA report to be released soon going over issues like accessibility, rolling stock costs, and the new faregates. But for now, I’d like to just focus on a high-level issue and how it relates to the subway’s history: State of Good Repair. The capital plan has a summary history of past capital plans on PDF-page 8, and it calls the 1990s and 2000s an era of underinvestment and deferred maintenance, the exact opposite of reality. It treats 2017 as a keystone year for system renewal, which it was not; it was, however, the year current MTA chair Janno Lieber was hired as the head of MTA Construction and Development (formerly Capital Construction). In effect, the plan falsifies the history of the system in order to treat the current leadership as saviors, in service of a plan to spend more money than in 2020-24 while having less to show for it, washing it all with the nebulous promise of State of Good Repair.
The history of State of Good Repair
Traditionally, capital investment is conceived as going to expansion. In New York in the first two thirds of the 20th century, this meant new subway and elevated lines, new connections between subway lines, station upgrades to lengthen the platforms, and new transfers between stations that had previously belonged to different operators. Maintenance was treated as an ongoing expense.
The finances of the subway after WW1 were shaky, and from the Depression onward, it never made money again. Of the two private operators, one, the IRT, was in bankruptcy protection during the Depression, while the public operator, the IND, was debt-ridden due to exceptionally high construction costs for that era and overbuilding. This made it attractive to defer maintenance, on the subway as on mainline rail everywhere in the United States. In 1951, bond money was designated for Second Avenue Subway, but then the money was raided for other priorities, including smaller extensions but also capital renewal, such as replacing the almost 50-year-old IRT rolling stock fleet.
In the 1970s, the city’s poor finances meant it couldn’t subsidize operations and maintenance as much as before, and the maintenance deferral led to a systemwide collapse. NYCSubway.org goes over the various elements of it: chunks of equipment and material were falling onto the street from the elevated lines, and onto the tracks from the retaining walls of open cuts; trains had flat wheels and no lubrication, leading to such squeal that the noise was worse than that of Concorde; train doors and lights malfunctioned; derailments and fires were common. By 1981, the mean distance between failures (MDBF) dropped to its lowest ever, 6,640 miles (10,690 km). One third of the system was under emergency 10 mph speed restrictions, and a quarter of the rolling stock had to be kept in reserve to substitute for equipment failures and could not be run in maximum revenue service. The new trains bought for the system, the R44 and R46, used new technology, for example higher top speed for the use on long express sections, but were defective to the point that the lawsuits against the vendors, St. Louis and Pullman respectively, bankrupted them. The origin of the conservatism of rolling stock orders and the pattern that all American rolling stock manufacture is done at transplant factories owned by European, Japanese, or formerly Canadian firms, are both the result of this history.
The State of Good Repair program as we know it dates to the 1980s, when the MTA, starting with the leadership of Richard Ravitch, began to prioritize maintenance and renewal over expansion. This meant five-year capital programs, to reduce the incentives to defer maintenance in a single year, and a lot of openly crying poverty, where leaders both before and after Ravitch would prefer to extoll the system and downplay its shortcomings. There was large spending on capital as a result, but no Second Avenue Subway. Instead, money went to renewal. Rolling stock was more conservative; the R62 was also imported from Japan, since Reagan cut federal aid to mass transit and so the MTA was free from Buy America’s strictures (in contrast, today states prefer to preemptively obey even when they’re not sure they will get federal funding, and even demand in-state plants). Its mean distance between failures was far higher than that of all other rolling stock, and this greater reliability continued into the R62A, R68, and R68A orders; the systemwide mean distance between failures kept climbing throughout the 1980s, 1990s, and 2000s, to a peak of around 180,000 miles, or around 280,000 km, in 2005 and again in 2010-11. The slow restrictions that characterized the system in the 1970s were lifted, and rolling stock availability for maximum service rose.
The construction of Second Avenue Subway beginning in 2007 was not viewed as a rebuke to the SOGR program, but rather as the legacy of its success. Leaders like Lee Sander spoke of growth and new lines, setting the stage for what is now known as IBX and was known in then as Triboro RX. The political discourse in the United States at the time was one of transit revival, due to the then-new decoupling of car driving and oil use from economic growth, and the high fuel prices; this was also around the time American discourse discovered European and Japanese high-speed rail, setting the stage for Proposition 1A approving the construction of California High-Speed Rail in 2008.
The present of State of Good Repair
I’ve repeatedly criticized SOGR as a scheme allowing agency heads to demand money with nothing to show for it. The behavior of current MTA leadership is one such example; it is not the only one – Amtrak did the same under Joe Boardman in the 2000s. But it needs to be made clear that the SOGR program of the 1980s and 90s was an unmitigated success. There was visible improvement in the system due to better maintenance of fixed plant and more prudent capital investments, such as the trainsets bought in the era from the R62 to the R160. The present problems of the SOGR concept come essentially because its success in the 1980s and 90s led agencies to talk about it as the next hot thing, even while going in a rather different direction.
In the 2010s, the subway started facing new problems – but these were not problems of undermaintenance. The MDBF crept down to a little less than 120,000 miles at the bottom, in 2017, and was 125,000 miles in 2023. The oldest trains are the worst, but much of the problem comes from other issues than slow replacement of fixed plant. For example, the ongoing slowdowns on the subway – even in the 2000s it was slower than before the 1970s collapse, and speeds are noticeably lower when I visit than when I lived in the city in 2006-11 – come not from insufficient maintenance, but from tighter flagging rules, which are designed to protect workers on adjacent track, but in fact have coincided with more worker injuries than in 1999, with a particular deterioration in worker safety in the 2010s. Andy Byford’s Save Safe Seconds campaign was the right response to the slowdowns, and helped stop the bleeding.
And yet, the idea of SOGR persists, even though the problem it purported to solve has been solved. The worst offender is Amtrak: in the Obama stimulus, it asked for $10 billion for SOGR on the Northeast Corridor, promising trivial reductions in travel times; Amtrak’s chair at the time, Joe Boardman, was the very one who deferred maintenance in order to make Amtrak look more profitable on paper in the service of the Bush administration’s goal of eventual privatization, replacing David Gunn, who was fired because he refused to do so.
In effect, SOGR is now a byword for “investments that aren’t sexy.” Some of those investments are still solid, like those done in the 1990s. Others are wastes of money; their lack of sexiness makes them ideal for managers who rate themselves by the input of how much money their agencies get rather than by outputs like ridership or service quality, since the lack of visible output disempowers civil society and good government watchdogs.
MTA Construction and Development head Jamie Torres-Springer essentially uses this definition in his defense of the capital plan, saying “We looked very closely at a couple of asset types that haven’t been focused on in the past. And to some people, they’re not the most exciting assets. They’re the ones that ensure that we can provide service. It’s structures and power and station components.”
The MTA’s capital plan is likewise denigrating the agency’s own past, saying, of the era in which MDBF rose by a factor of about nine in the span of 15 years, “Investment lagged again in the 1990s and early 2000s” and “After years of progress in the 1980s, investment fell off, culminating in a ‘Summer of Hell’ in 2017. That year, New York’s subway had one of the worst on-time performance of any major rapid transit systems in the world, with only 65% of weekday trains reaching their destinations on-time.”
The problems of train delays are not about investment or about maintenance. Rather, the train delays were about overly ambitious schedules, compounding with the problems of excessive interlining. Of course, interlining had always been present in the system, but the combination of new trains with better braking and signal timers installed based on the performance of older trains meant that the schedules could not be met without slowdowns; managers, in turn, changed how they measured punctuality from on-time performance to wait assessment, the latter more appropriate for subway lines with high frequency (like New York) and little complexity (unlike New York). MTA President Ronnie Hakim, coming from a legal rather than technical background, also denigrated the idea of speed, viewing it not as an essential feature of public transit but as a source of legal liability.
Non-sexy investment can target this; Byford alleviated some of the slowdowns with Save Safe Seconds. In the future, deinterlining the system, starting from DeKalb Avenue’s scrambling of the B, D, N, and Q, where trains lose two minutes due to schedule padding entirely to protect from cascading delays, is necessary. But this is not SOGR – in fact zero dollars are required in capital spending to deinterline DeKalb. Nor is it invisible – this is a visible change on the subway map, which passengers and good government watchdogs can judge for themselves, trading off fewer one-seat rides for higher speed and reliability.
But neither Lieber nor Torres-Springer seems interested in inexpensive fixes. No: both rate themselves by how much money they get rather than by whether it does any good, hence the denigration of the era in which SOGR was a success. As political appointees, they also have no loyalty to the system and its permanent staff, or even to well-regarded leaders (Byford, again) who do not come from the same political milieu. They fail because they exist to allow incompetent governors like Cuomo and Hochul to control a system they have no business running.
One of the dirty secrets of my (and ETA’s) New York commuter rail through-running proposal is that it barely connects Long Island to New Jersey. The later lines with the longer greenfield tunnels do, but the base proposal only through-runs the Port Washington Branch to New Jersey, and with some work it can also through-run some branches to the Hudson Line via Penn Station.
Credit: Kara Fischer, ETA; Flushing is not depicted on the map and is on the Port Washington Branch
It’s long been a criticism of the plan in comments and on social media that it doesn’t do anything to connect Newark with Jamaica. I’d like to address this briefly, since changes in work geography over the last decade have made the Port Washington connection more valuable relative to the Jamaica connection.
Job counts
For the main secondary centers that are or could be on this system, here are the job counts within 1 km of the station, in the business cycle peak years of 2007 and 2019:
Jamaica and Flushing both grew rapidly in the 2007-19 business cycle, but Flushing both started bigger and grew faster, to the point of approaching the job count near Newark Penn Station.
Long Island City has seen booming development, as the only near-center neighborhood in New York with significant construction rates; the number of residents has grown even faster, from 4,502 to 12,183 employed residents over the same period, but with a jobs-to-employed-residents ratio higher than 5, it is a business district first. Plans for an infill station at Queens Boulevard are on the MTA’s wishlist in the 20 Year Needs Assessment, at typically extreme MTA costs; this is separate from Sunnyside Junction, somewhat to the east, which has less development but could be a cross-platform transfer with East Side Access-bound trains.
Non-work trips
Flushing is a booming ethnic center for Chinese-New Yorkers. Jobs there serve the community wherever its members live, and so do non-work destinations, including cultural centers and well-regarded Chinese restaurants. This generates not only work trips, but also consumption trips. Without fast transit to Flushing, it’s a special occasion to go there for food, especially if one does not live on the subway; with fast transit, Flushing restaurants are capable of outcompeting more local alternatives for people arriving from inner New Jersey, and people from suburbs farther out may choose to take a more frequent LIRR than to drive.
Jamaica is not a regional center of much. There is one big trip generator there, other than the growing job center: JFK, via the AirTrain. Airport connections are valuable, but also overrated. The unlinked (likely total) ridership on the AirTrain in the first three months of 2024 was 1.924 million, or 21,143/day (not weekday), slightly higher than in 2019. This is not a high modal split, but airport arrivals are disproportionately going to Manhattan already, and the frequency between Penn Station and Jamaica is high enough that through-running and other modernization elements would only mildly increase this figure.
I can’t quite compare the two figures, since leisure trips, especially routine ones like going out to restaurants, are hard to measure. But Jamaica’s airport trips coming from better commuter rail are just not going to be significant in volume by the standards of the work trips of Long Island City or Flushing.
Through-running schemas
The reason I’ve advocated for through-running from New Jersey to the Port Washington Branch and no other LIRR line is operational. There is only enough capacity for at most 12 trains per hour, because the trains have to share tracks with Penn Station Access local trains to Stamford and with intercity trains. Connecting to an LIRR branch serving Jamaica would create complex branching, with the same line in Queens reverse-branching to different destinations, reducing reliability. It was hard enough to timetable the reverse-branched New Haven Line in our Northeast Corridor project. The Port Washington Branch, running completely separately from the rest of the system, sharing tracks only on the approach to and within Penn Station, is an ideal candidate.
It is a happy coincidence that the through-running schema for the LIRR that is easiest to implement also happens to serve the larger Queens business center between the two traditional ones. It would also be a great opportunity to build infill in Long Island City, which has emerged in the last few decades to be a much larger center. Another happy coincidence is that, while New Haven Line timetabling has been difficult, there is room in the schedule for two infill stations in Queens without upsetting the delicate track sharing between Penn Station Access local commuter trains and intercity trains within the East River Tunnels to Penn Station. Anything involving mainline rail through legacy cities is necessarily going to have to rely on tricks, waivers, and happy coincidences like this to cobble together a good system out of a region that had no reason to be built in 1900-30 around the commuter rail technology of the 1970s-2020s.
This is the second part of my series about the Regional Plan Association event about expanding capacity at Penn Station. Much of the presentation, at least in its first half, betrays wanton ignorance, with which area power brokers derive their belief that it is necessary to dig up an entire block south of Penn Station to add more station tracks, at a cost of $16.7 billion; one railroad source called the people insisting on Penn Expansion “hostage takers.” The first part covered casual ignorance about the history of commuter rail through-running in Europe, including cities that appear in the presentation. This part goes over the core claim made in the presentation regarding how fast trains can enter and exit Penn Station. More broadly, it goes over a core claim made in the source the presentation uses to derive its conclusion, a yet-unreleased consultant report detailing just how much space each train needs at Penn Station, getting it wrong by a factor of 5-10.
The issue is about the minimum time a train needs to berth at a station, called the dwell time. Dwell times vary by train type, service type, and peak traffic. Subways and nearly all commuter trains can keep to a dwell time of 30 seconds, with very few exceptions. City center stations like Penn Station are these exceptions; the RER and the Zurich S-Bahn both struggle with city center dwell times. The Berlin S-Bahn does not, but this is an artifact of Berlin’s atypically platykurtic job density, which isn’t reproducible in any American city. That said, even with very high turnover of passengers at central train stations, the dwell time is still usually measured in tens of seconds, and not minutes. In the limiting case, an American commuter train should be able to dump its entire load of passengers at one station in around two minutes.
The common belief among New York-area railroads is that Penn Station requires very long dwell times. This is not made explicit in the presentation; Foster Nichols’ otherwise sober part of the presentation alludes to “varying dwell times” on pp. 23 and 26, but documents produced by the railroads about their own perceived needs go back years and state precise times; for through-running, it was agreed that the dwell times would be set at 12 minutes in the Tri-Venture Council comprising Amtrak, the LIRR, and New Jersey Transit. The consultant report I reference below even thinks it takes 16 minutes. In truth, the number is closer to 2-3 minutes, and investments that would precede Penn Expansion, like Penn Reconstruction, would be guaranteed to reduce it below 2 minutes.
Dwell times in practice
Before going into what dwell times should be, it is important to sanity-check everything by looking at dwell times as they are. It is fortunate that examples of short dwell times abound.
As mentioned in my previous post, I have just returned from a trip to Brussels and London. My train going out of Berlin was late, so at Hauptbahnhof, the dwell time was just three minutes. The train, which had departed Ostbahnhof almost empty, filled almost to seated capacity at Hauptbahnhof, where there is no level boarding. DB routinely turns trains in four minutes at terminal stations that are located mid-line, like Frankfurt and Leipzig, but this time I observed such dwells at a station with almost complete seat turnover. In Japan, where there is level boarding and two door pairs per car rather than one, the dwell times on the Nozomi are a minute, even at Shin-Osaka, where through-trains transition from JR Central to JR West operation.
On commuter rail, dwell times are shorter, even though the trains are much more crowded at rush hour. The reason is a combination of higher toleration for standees, and higher toleration of mistakes – if passengers get on the wrong train or miss their stop, they will get off at the next stop in a few minutes rather than ending up in the wrong city.
As mentioned in the introduction, Penn Station is a limiting case on commuter rail, since it’s the only station in Manhattan for any possible through-trains today; a future tunnel to Grand Central, studied over 20 years ago as Alternative G and recurrently proposed since in various forms (for example, in the ETA writeup, or in this post of mine from last year), would still leave trains that use the preexisting North River Tunnels running through the East River Tunnels and not making a second Manhattan stop. Thus, the best comparison cases need to be themselves limiting cases, as far as possible.
For this, we need to go to Paris, especially its busiest lines, the RER A and B. The RER B has two central stations: Gare du Nord, Les Halles; Gare du Nord isn’t really in the central business district, but is such a large travel hub that its RER and Métro traffic levels are the highest in both systems. The theoretical dwell time (“stationnement”) is 30 seconds on the RER. In practice, at rush hour, it’s higher – but it’s still measured in tens of seconds. In the 2000s, the RER B reached 70-80 second dwell times at Gare du Nord at peak, before new work reduced the average to 55 seconds. I timed dwell times while living in Paris and riding the RER B regularly to IHES, and at rush hour, the two central stations and Saint-Michel-Notre-Dame were usually 50-60 seconds. This is optimized through signaling as well as wide platforms and single-level trains with four door pairs per car, though the internal configuration of the corridor of the RER B rolling stock still leaves something to be desired, especially if there are passengers with luggage (which there often are, as the line serves CDG Airport).
The RER A has four central business district stations: Les Halles, Auber, Etoile, La Défense; a fifth station, Gare de Lyon, is like Gare du Nord a transport hub with very high originating ridership. A report from the early 2010s lamenting that the theoretical throughput of 30 trains per hour was not achieved in practice blames a host of factors, including high dwell times due to traffic, reaching 50 seconds in the central section. The RER A rolling stock is bilevel with three triple-wide door pairs per car, and for a bilevel its internal circulation is good, but it’s still a bilevel train, and getting through a crowded rush hour car to disembark takes a lot of shuffling.
Is Paris a good comparison case?
Yes.
Part 1 of this series goes over the history of the RER, and points out that in 2019, the RER A had 1.4 million weekday trips, and the RER B 983,000. This compares with a combined LIRR and New Jersey Transit ridership of about 600,000 per weekday. About 67% of LIRR ridership is at rush hour; on SNCF-operated Transilien and RER lines, at the suburban stations, the figure is 46%, and my suspicion is that the RER B is somewhat lower than Transilien.
The higher peakiness in New York evens things up somewhat. But even then, peak hourly traffic into Penn Station from New Jersey was 27,223 passengers in 2019, per the Hub Bound report (Appendix III, Section C), and peak hourly traffic from the four-track East River Tunnels was 33,530; in contrast, the RER A’s peak hourly traffic last decade was 50,000.
Now, Paris does have multiple central stations, whereas there is only one in Manhattan on the LIRR and NJ Transit. That said, this only evens things up. My table on this only includes the SNCF-operated portion, and only includes boardings at a resolution of four hours, not one hour; thus, all central RER A stations are missing. From the table, we get the following maximum boarding counts between 4 and 8 pm and between 6 and 10 am on a work day:
Station
Line
Trains/hour
Boardings (pm)
Boardings (am)
Penn Station
LIRR
37
73,430
4,920
Penn Station
NJ Transit
20
56,664
7,838
Gare du Nord
RER B (both directions)
20
48,989
54,137
Gare du Nord
RER D (both directions)
12
34,512
28,073
Châtelet-Les Halles
RER D (both directions)
12
28,586
6,877
Gare de Lyon
RER D (both directions)
12
49,392
17,158
Haussmann-Saint Lazare
RER E
16
45,383
10,719
The numbers represent single-line trips, so people transferring cross-platform between the RER B and D at Gare du Nord count as boardings. The reason for including both morning and afternoon peak traffic is that afternoon boardings are largely symmetric with morning alightings and vice versa, and so the sum represents total on and off traffic on the train at the peak.
Peak traffic per train in a single direction occurs at Saint-Lazare on the RER E, which only began through-running in May of this year; the counts are from the mid-2010s, when the station was a four-track underground terminal. At the through-stations, total ons and offs per rush hour train are slightly lower than at Penn Station on NJ Transit and slightly higher than on the LIRR. Even taking into account that at Penn Station, 40% of the peak four hour traffic is at the peak hour, and the proportion should be somewhat smaller in Paris, the difference cannot be large. If Gare du Nord can support 60 second dwell times, Penn Station can support dwell times that are not much higher, at least as far as the train-platform interface is concerned.
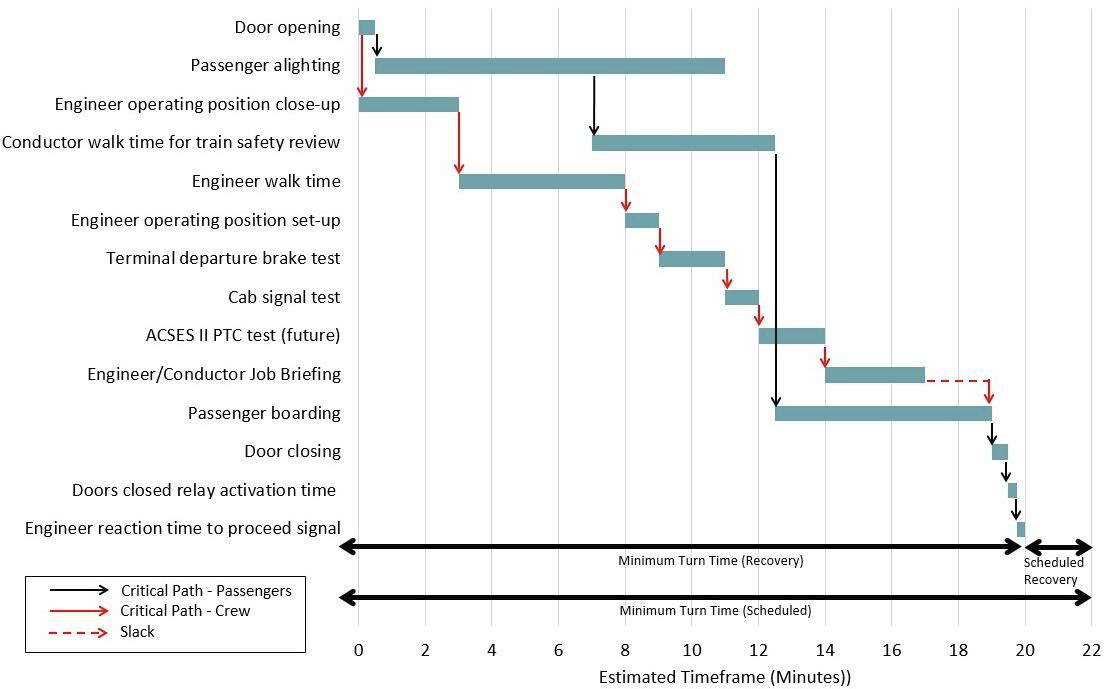
Gantt charts
A yet unreleased consultant report for the Penn Station Capacity Improvement Project (PCIP) details the tasks that need to be done for a through-running train at Penn Station. This is shown as a pair of Gantt charts, both for a future baseline, the second one assuming dropback crews and station scheduling guaranteeing that trains do not berth on two tracks facing the same platform at the same time. All of this is extravagant and unnecessary, and could not be done by people who are familiar with best practices in Europe or Japan.
This is said to be turn time in the chart and dwell time in the description. But the limiting factor is the passenger path and not the crew path, and for that, it doesn’t matter if a train from New Jersey then goes to Long Island or Stamford and a train from Long Island or Stamford goes to New Jersey or if it’s the other way around.
To be clear, 16 minutes is insanely long as an unpadded turn time, let alone a through-dwell time. The MBTA can do it in 10; I think so can Metro-North at the outer ends. ICE trains turn in four minutes at pinch points like Frankfurt Hauptbahnhof, with extensive rail passenger turnover. So let’s go over how to get from 16 down to a more reasonable number.
Passenger alighting
Alighting does not take 6.5 minutes at Penn Station, even at rush hour, even on trains that are configured for maximum seats rather than fast egress. The limiting factor is not the train doors – the RER D runs bilevels with two door pairs per car and narrow passageways, and would not be too out of place on NJ Transit. Rather, it’s the narrow platforms, which have fewer egress points than they should and poor sight lines. This was studied for the Moynihan Station project, which opened in 2021. The project added new staircases and escalators, and now the minimum clearance time is at most 2.03 minutes, on platform 9, followed by 2.02 minutes on platforms 4 and 5. The expected clearance time, taking into account that passengers prefer to exit near the 7th Avenue end but the egress points are not weighted toward that end, peaks at 4.83 minutes on platform 4 – but passengers can walk along the platform while the train is moving, just as they do on the subway or on the RER.
What’s more, Penn Reconstruction, a project that may or may not happen, but that is sequentially prior to the Penn Expansion project that the slide deck is trying to sell, is required to install additional vertical circulation at all platforms, to reduce the egress times below 2 minutes even in emergency conditions (one escalator out). This is because NFPA 130 requires evacuation in 4 minutes assuming every track that can be occupied is, which given timetabling constraints means both tracks facing each platform other than the single-track platform 9. Responding to Christine Berthet’s questions about through-running, the agency even said that Penn Reconstruction is going to bring all platforms into compliance, but still said dwell times would need to be 8 minutes.
Passenger boarding
Alighting and boarding peak at different times of day. As the above table shows, reverse-peak traffic at Penn Station is only 12% of the combined peak and reverse-peak traffic on NJ Transit, and only 6% on the LIRR. In any circumstance in which the alighting time needs to be stretched to the maximum (again, only somewhat more than 2 minutes), the boarding time can be set at 30 seconds, and vice versa.
Moreover, because the access points to the platforms include escalators, not all running in the peak direction, and not just staircases, reverse-peak traffic consumes capacity that is otherwise wasted. Even the 30 seconds for additional boarding time in the morning rush are generous.
Conductor walk time for safety review
This is not done in Europe. Conductors’ safety review comprises checking whether passengers are stuck in the gap between the platform and the train, which is done after boarding, and takes seconds rather than minutes, using CCTV if the sight lines are obstructed.
Door opening and closing
These do not take 30 seconds each; the total amount of time is in the single digits.
Engineer operating position set-up, and engineer/conductor job briefing
Crews switch out in 1-2 minutes at boundaries between train operating companies in Paris and Shin-Osaka. The RER B is operated by SNCF north of Gare du Nord and by RATP south of it, and they used to switch crews there – and the operating position had to be changed, since the two companies’ engineers preferred different setups, one preferring to sit and the other to stand. It took until the early 2010s to run crews through, and even then it took a few years to unify the line’s dispatching. It does not take 3 minutes to brief the engineer on the job.
Total combined time
On a through-train, using alighting times in line with the current infrastructure at Penn Station, the minimum dwell time is 2-3 minutes, provided trains can be timetabled so that no two tracks facing the same platform have a train present at the same time. If there are four through-platforms, then commuter trains can run every 5 minutes to each platform, which is borderline from the perspective of egress capacity at 7th Avenue but does work.
Intercity trains make this easier to timetable: they have lower maximum capacity unless standing tickets are sold, which they currently are not, and even if Amtrak runs 16-car EMUs, they’ll still have fewer seats than there are seats plus standing spaces on a 10-car NJ Transit train, and not all of them turn over at Penn Station. Potentially, platform 6 can be dedicated to intercity trains in both directions, and then platforms 4 and 5 can run eastbound, alternating, and platforms 7 and 8 can run westbound. Using the timetable string diagram here, the local NJ Transit trains on the Northeast Corridor would have to share a platform, running every 5 minutes, while the express trains can get a dedicated platform running every 10; the local trains are likely to be less crowded and also have more through-passengers, first because usually through-service is more popular in inner suburbs than in outer ones, and second because the likely pairing in our Northeast Corridor plan connects those trains to Long Island City and Flushing while the express trains awkwardly turn into local Metro-North trains to Stamford.
Note that intercity trains can be scheduled to dwell for just 2-3 minutes too, and not just commuter trains. That’s actually longer than Shinkansen express dwell times (involving a crew change at Shin-Osaka), and in line with what I’ve seen with full turnover in Berlin. The Avelia Liberty has better circulation than the ICE 3, since it has level boarding, and any future trainset can be procured with two door pairs per car, like the Velaro Novo or Shinkansen, rather than just one, if dwell times are a concern.
The incuriosity of consultant-driven projects
I spoke to some of the people involved about my problems with the presentation, and got very good questions. One of them pointed out that I am talking about two- and three-minute dwell times in big European cities, and asked, how come experienced international consultants like Arup and LTK, which prepared the Gantt chart above, don’t know this? What’s missing here?
This is a question I’ve had to face with the construction cost comparisons before, and the answer is the same: consultants are familiar with projects that use consultants. Anglo consultants like Jacobs, AECOM, Arup, and WSP have extensive international experience, with the sort of projects that bring in international consulting firms to supervise the designs. The bigger Continental European and East Asian countries have enough in-house engineering expertise that they don’t really bring them in.
This can be readily seen in two ways. First, getting any detailed information about rail projects in France and Germany requires reading the local language. Practically nothing gets translated into English. I almost exclusively use French sources when writing about the RER, which can be readily seen in this post and in part 1. My German is a lot less fluent than my French, but here too I have to rely on reading technical German to be able to say anything about the Berlin or Munich S-Bahn or the ICE at greater depth than English Wikipedia (for one example, compare English and German on switches). A lot of the information isn’t even online and is in railfan books and magazines. This is not an especially globalized industry, and a consultancy that works in English will just not see things that are common knowledge to the experts in France or Germany, let alone Japan.
And second, the few Continental European projects that are more globalized turn into small reference pools for American agencies looking to compare themselves to others. Woody Allen portrays a Barcelona with the works of the only architect his American audience will have heard of. The MTA compares its per-rider costs to those of the not-fully-open Barcelona Metro L9/10, MassDOT uses L9/10 to benchmark the North-South Rail Link (again with the wrong denominator), and VTA uses L9/10 as a crutch with which to justify its decision to build a single-bore San Jose subway. L9/10 is an atypically large project, and atypically expensive for Spain; it also, uniquely, uses more privatization of planning than is the norm in Spain, including design-build project delivery, whence the line from the one of the consultants I’ve had to deal with in the US, “The standard approach to construction in most of Europe outside Russia is design-build” (design-build to a good approximation does not exist in Germany, Spain except L9/10, or Italy, and is uncommon in France and done with less privatization of expertise than in the US).
To take these two points together, then, the elements of foreign systems that are likeliest to be familiar to either American railroaders or English-primary consultants are the biggest and flashiest ones. This can even include elements that are not consultant-driven, if they’re so out there that they can’t be missed, like a high-speed rail network: rail consultants know the TGV exists, even if they’re not as familiar with how SNCF goes around planning and building lines, and can sometimes imitate design standards. Commuter rail infrastructure that’s similarly flashy gets noticed, so the presentation mentions the RER and Munich S-Bahn, even while getting their histories wrong and fixating on the new station caverns that even a tourist on a short trip can notice.
Commuter rail operations are not flashy. The map of RER or S-Bahn lines is neat, which is why rail activists talk about through-running so much – it’s right there posted at every station and on every railcar. But the speed at which people get on and off the train is not as obvious, and it requires looking into detailed reports to do an even rudimentary comparison, none of which in the case of Paris is available in English or easy to find on Google (the word “stationnement” usually means “parking,” in the same manner that the word “dwell” usually means “to live in a place”).
The upshot is that consultant reports written by serious people who absorb the knowledge of the railroaders of the Northeastern US with some British sanity checks can still say things that are so wrong to make the entire report useless. The same process that produces the whopper that the Munich S-Bahn, built 1965-72, took 46 years to build, can produce a Gantt chart that has a combined boarding and alighting time with conductor check that’s more than five times longer than what Penn Station in its current configuration is capable of and more than 10 times longer than what Gare du Nord achieves with similar peak ridership. Based on this false belief regarding dwell times, the agencies are then convinced that through-running is difficult and, separately, many additional tracks at Penn Station are required to fully use the capacity of the under-construction Gateway tunnel, building which would waste $16.7 billion.
The Regional Plan Association ran an event 2.5 days ago about New York commuter rail improvements and Penn Station, defending the $16.7 billion Penn Station Expansion proposal as necessary for capacity. The presentation is available online, mirrored here, and I recommend people look at the slides to understand the depth of the ignorance and incuriosity of area decisionmakers about best practices displayed in the first half of the presentation; the second half, by Foster Nichols, is more debatable. I hope to make this a series of two or perhaps three posts, focusing on different aspects of why this is so bad. But for now, I’d like to just talk about what the presentation gets wrong about the history of commuter rail improvement in Europe, on pages 17-19. Suffice is to say, the extent of error that can be crammed into a single slide with little text astounded me. With such incuriosity about best practices, it’s not surprising that regional power brokers are trying to will the unnecessary Penn Expansion project into being, never mind that it has no transportation benefits despite its extravagant cost.
The rub is that the presentation on pp. 18-19 says that commuter rail through-running is really hard. Here is page 18:
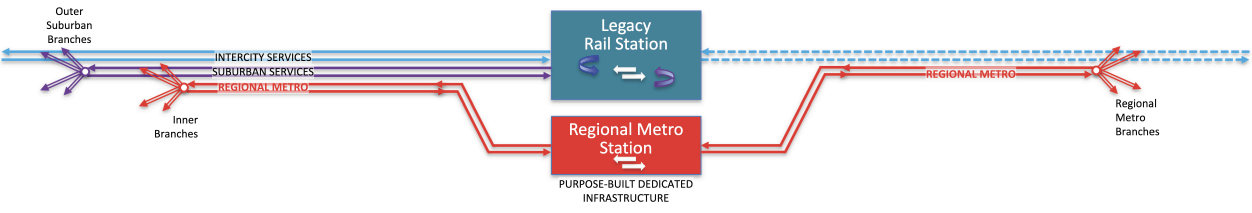
Regional metro systems comprise a targeted portion of regional rail networks centers of population, employment, business or major attractions like airports that support frequent, fast service
Regional metro systems typically do not operate within original historic train sheds
They operate in new tunnels, shoulder stations adjacent to existing major stations, and separate, simpler interlockings that facilitate frequent service
Then, page 19 shows maps of the RER, Munich S-Bahn, Elizabeth line, and Thameslink, quoting the length it took to build them as, respectively, “30 years,” “46 years,” “2001-2022,” and “1970s-80s, 2009-2020.” The conclusion is “Systems take decades to implement, usually in stages.”
And all of this is a pack of lies.
In fact, commuter rail through-running systems routinely reuse legacy stations, even fairly major ones: both Berlin and Munich Ostbahnhof were incorporated into their respective S-Bahns, and several Parisian train stations were reused for the RER, for example Gare d’Invalides or Luxembourg, with varying levels of modification. New stations are built from scratch underneath surface stub-end terminals like Gare du Nord and Gare de Lyon as depicted in the presentation, but if the station already has through-tracks then it can be used as-is, like Munich Ostbahnhof, and in some cases even stub-end stations are at such grade that their infrastructure can be used. If Boston chooses to build the North-South Rail Link, then, since North and South Stations are both large at-grade terminals, the link will have to include new underground platforms at both stations. But Penn Station is an existing through-station below grade; Amtrak already runs through, and so could commuter rail, without adding platforms.
And as for the lines about the systems having taken 30 and 46 years to build, this is so painfully wrong that it is perhaps best to go over their actual histories. The actual length of time it took depends on one’s definitions, especially for Paris, but the maximum one can support for Paris is 16 years; for Munich, it is seven years.
The history of the RER
The RER and Transilien are, together, the largest commuter rail network in Europe by ridership, with around 1.1 billion annual riders. Globally, only four systems surpass them: Tokyo, Seoul, Osaka, Mumbai; the first two are integrated metro-commuter rail networks to the point that it’s hard to distinguish which mode they are, Osaka is several competing companies none with the ridership of the combined Paris system, Mumbai runs with practically no metro accompanying it. The RER’s history, as I will shortly explain, also makes it a good prototype for modern commuter rail operations, of the same type that is called S-Bahn in Germany. New Yorkers would do especially well to understand this history, which has some parallels to the administrative situation in New York today.
The topline of this is that since the 1960s, Paris has connected its legacy commuter and intercity rail terminals with new through-tunnels, called the RER, or Réseau Express Régional. There are five lines, dubbed A through E. Métro operator RATP runs most of the RER A, and the RER B south of Gare du Nord; national railway SNCF runs the rest plus commuter train networks stub-ending at most of the historic terminals, called Transilien, signed with letters from H to R.
But the history of the RER goes back further – and none of it can be said to have taken 30 years. In short: the Métro was built, starting in the 1890s and opening in 1900, to be totally incompatible with mainline rail – for one, where mainline trains in France run on the left, the Métro runs on the right. This was on purpose: city residents in the Belle Epoque already looked down on the suburbs and worried that if the Métro were compatible with the mainlines, then it might be used to connect to the suburbs and bring suburbanites to their city. The stop spacing, separately, was very tight, even tighter than on New York local subway trains, let alone the London Underground. By the time the system reached the inner suburbs in the 1930s, it was clear that it could not by itself connect the growing suburbs to the city, it would be too slow.
Various proposals for investment in commuter rail go back to the 1920s, but little happened, with one exception: the Ligne de Sceaux, shown as the blue line on the first image entering the city from the south, was acquired by the forerunner of RATP, CMP, in 1938, as the rest of the French mainline network was nationalized. CMP was attracted to the line because of its atypically good penetration into the center of Paris – the other lines terminated farther from the historic center, for example at Gare du Nord or Gare de Lyon. The line was also not useful for SNCF as it was being formed, due to its isolation from the rest of the network. The line was electrified as it was acquired, and run as a regional line, still isolated from all others.
More serious plans for commuter rail through-running began in the 1950s, as postwar growth and suburbanization put more pressure on the system. Gare Saint-Lazare was especially under pressure, first because of growth in the western suburbs, and second because the Paris CBD had been creeping west, making its location more attractive for commuters. In 1956, Marc Langevin proposed an eight-line network; in 1959, RATP and SNCF began collaborating, planning east-west and north-south lines. As late as 1966, there were still plans for two separate north-south lines (for example, see here, p. 244), of which only one has been built and the other is no longer seriously proposed.
In the 1960s, the plans got more serious. Construction began in 1961, starting with the east-west axis, still with an uncertain alignment. Eventually, RATP would take over the Ligne de Vincennes (the eastern red line in the before map) in 1969 and the Ligne de Saint-Germain-en-Laye (the southernmost of the western red lines) in 1972, and connect them with a new tunnel, opening in 1977. Over the 1960s, the plans still had to be refined: it was only in 1963 that it was confirmed that the Ligne de Vincennes’ Paris terminal, Bastille, was too small to be used for this system, and therefore the new tunnels would have to begin farther east, to Nation, which opened in 1969 and is thus already depicted on the before map.
The Ligne de Vincennes was simultaneously modernized, starting in 1966. The entire systems had to be redone, including new platforms and electrification. Nation had to be built underground, starting 1965, complete in 1967 and opening with the rest of the line in 1969.
On the west, the cornerstone was laid in 1971, and construction began shortly later, starting with La Défense. Shuttle trains run by RATP opened between La Défense and Etoile in 1970, and extended to Auber in 1971. In 1972 the line was connected to the Ligne de Saint-Germain-en-Laye.
At the same time, deepening SNCF-RATP integration meant that the planned alignment within the city would need to change to connect to SNCF’s train stations better. Originally, the east-west axis was supposed to run as an express version of Métro Line 1, stopping at Etoile, Concorde, and Châtelet; this was modified to have it swerve north, replacing Concorde with Auber, which is connected to Saint-Lazare. East of Châtelet-Les Halles, the alignment swerves south to connect to Gare de Lyon instead of Bastille.
In 1977, the Nation-Auber section opened, finally offering through-service; the appellation RER A dates only from then. Simultaneously, the north-south axis that was actually built half-opened, connecting the Ligne de Sceaux onward to Les Halles, with cross-platform transfers from the south to the west. On the same date that the central section opened, RATP also inaugurated an entirely greenfield branch of the RER A to the east, initially to Noisy-le-Grand, eventually (by 1992) to the new Marne-la-Vallée development, where Eurodisney was built. Contemporary media reports called Les Halles the biggest metro station in the world, and President Valéry Giscard d’Estaing (center-right) spoke of public transport for everyone, not just the poor. The cost of this scheme was enormous: it cost 5 billion francs (update 8-9: see Alain Dumas’s comment below – it’s 5 billion FRF for the entire RER A, not just the Nation-Auber section), which would make it about $1 billion/km $350 million in 2023 prices, inflation since then more or less canceling out the franc:USD exchange rate. The RER B cost 400 million francs between Luxembourg and Les Halles, a distance of 2.3 km, and 1.6 billion to get to Gare du Nord and connect to the SNCF network to the north (opened 1981), a distance of 3.5 km.
The RER C then opened in 1979, as a second east-west line, on the Left Bank. Missing all of the main centers within Paris, it has always had far lower ridership than the RER A; it was also much easier and cheaper to build – all that was required was a short tunnel connecting Invalides on the west, previously a subsidiary commuter rail-only stop on the same lines to Montparnasse and Saint-Lazare, and Gare d’Orsay on the east, a commuter rail-only extension of the line to Austerlitz. This was built quickly – the decision was made in 1973, and the line opened within six years. This required a total rebuild of Gare d’Orsay with new underground platforms; Invalides required reconstruction as well, but could use the same station and track structures.
Subsequently, the system has added new lines and branches – the RER D opened from the north to new Gare de Nord platforms in 1982, was extended in 1987 along the same tracks used by the RER B to Les Halles but serving dedicated platforms at both stations, and was extended along a new tunnel to and beyond Gare de Lyon in 1995; the RER A acquired new western branches in 1988 to be operated by SNCF, requiring dual-voltage trains since those branches use 25 kV 50 Hz AC and not 1.5 kV DC like the RATP lines; the RER C acquired a new branch also in 1988 taking over part of the Petite Ceinture; the RER E was opened as a stub-end extension of lines from the Gare de l’Est network to a new underground station at Saint-Lazare in 1999, and was finally extended to the west with some through-service this year.
So in a sense, it’s taken 63 years to build the RER, starting 1961, and the work is not yet done. But the core through-running service opened in 1977, within 16 years, with some decisions made midway through the works. The total required work greatly exceeded anything New York needs to do – just what opened through 1977 includes 16 km of double-track central tunnel on the RER A, 3 km on the new branch to Noisy plus 6 km of new above-ground line, 2 km of tunnel on the RER B, and around one km of tunnel on the RER C, inaugurating eight new underground stations, all on the RER A. The RER A’s ridership reached 1.4 million per workday by 2019, and the RER B’s reached 983,000 – and a great majority of the work on both was done by 1981.
The history of the Munich S-Bahn
The Munich S-Bahn is not the oldest or busiest S-Bahn system in Germany; Berlin and Hamburg both have prewar systems, and Berlin’s ridership is considerably higher than Munich’s. Nonetheless, precisely because Berlin and Hamburg built so much of their infrastructure in the steam era, some lessons do not port well to cities today. In contrast, Munich’s entire system has been built after the war – in fact, the construction of the S-Bahn took place over just seven years, from the decision of 1965 to opening in 1972, timed with the Olympics.
As in Paris and many other cities, the history of proposals for rapid urban mainline rail in Munich stretches back decades before the decision was made. The first proposal was made in 1928, and there was more serious planning in Nazi Germany, as the Nazi Party had been founded in Munich and was interested in investing in the city due to that history; by 1941, there were plans for a three-line system, comprising a north-south, an east-west, and a circular tunnel. But little was built, and during the war, the resources of Germany toward rail were prioritized in a different direction.
After the war, Munich grew rapidly. It was not much of an industrial city in the early 20th century; early industrialization in Germany was mostly in the Ruhr and Saxony, while the professional services economy was centered on Berlin, whose metropolitan area in the 1930s was of comparable size to that of Paris. After the war, things changed, at least in the West: the Ruhr’s coal and steel economy stagnated, while southern Germany grew around new manufacturing of cars and chemicals; decentralization dispersed the professional services economy, and while most went to Frankfurt and Hamburg, a share went to Munich (for example, Siemens’ headquarters moved there from Berlin right after the war). The city’s wartime peak population was 835,000; it would surpass 1 million in 1957 and is 1.5 million today. The region, Oberbayern, comprising essentially the metro areas of Munich and Ingolstadt, would grow from 2 million at the beginning of the war to 2.8 million by 1960 and 4.8 million today, and is the richest region in the EU at this scale, with per capita income from work approaching that of New York.
This small size of Munich in 1900 means that it never had as extensive a rail network as Paris or Berlin. It had just two major urban stations: Hauptbahnhof, a terminal with a station throat leading to points west, and Ostbahnhof, a through-station with tracks leading east, south, and the west, the western tracks looping back south of city center to reach Hauptbahnhof. To this day, area railfans would like this loop to be incorporated into a regional S-Bahn system avoiding city center – but Munich is still a rather monocentric city. There was no U-Bahn, unlike in Berlin or Hamburg.
By 1961, the number of suburban commuters into Munich reached 114,000. The undersize rail network relative to the city’s current importance and the rapid growth in wealth meant that car ownership was high, leading to traffic congestion. The trams were slowed down by traffic, to the point of not running faster than walking in city center.
To resolve these problems, both an U-Bahn network and an S-Bahn network were planned. Early planning began in the 1950s, with the federal government taking over the wartime plans in 1956, but as in Paris, the extent of the system to be planned was up in the air: both an east-west axis and a north-south line were desired, and only in 1963 was the decision finalized that the north-south axis should be a municipal U-Bahn tunnel and not an S-Bahn. The study period began in 1961, with the plan approved in 1965 for the construction of a single east-west S-Bahn tunnel between Hauptbahnhof and Ostbahnhof, and a separate U-Bahn system with three branched trunk lines.
Construction was done on a tight timeline, since Munich was awarded the 1972 Olympics in 1966, and delays were not considered acceptable; the first U-Bahn line, U3/U6 running north-south, opened 1971, and the S-Bahn opened 1972, in what is described as a “record time.”
During the seven years of construction, other projects had to be done in parallel. Commuter rail lines had to be extensively upgraded: the project included 143 km of electrification, and 115 stations outfitted with new high platforms at a level of 760 mm mostly 210 meters long. Simultaneously, most of what has become the standard for good timetabling was invented, out of necessity on a network that had to share tracks and systems with other trains on its outer margin, most importantly the clockface schedule – the system was designed around a 20-minute Takt on each branch from the outset, with outer tails running every 40 minutes.
The central tunnel itself, the Stammstrecke, comprises six stations from Hauptbahnhof to Ostbahnhof of which all except Ostbahnhof are underground, and three have Spanish platforms. Ostbahnhof itself is used as a pinch point for some trains, reversing direction depending on branch. The Stammstrecke in total was built for 900 million DM, or $2.8 billion in 2023 PPPs; the overall line included 4.1 km of tunnel and about 7.3 more km of above-ground connections. (Update 8-9: cost fixed – I originally stated it to be 900 DM.)
There has been further investment adding new branches and upgrading the system. The new signal system LZB was installed in the central section experimentally when it opened in 1972, but it was not used on all trains, and was taken out of service in 1983, only returning in 2004 when its capacity was needed, boosting throughput from 24 trains per hour to 30. However, as in Paris, the core of the system’s high ridership, now about 900,000 per workday, comes from infrastructure that was there from the start, and thus it’s most correct to say that the system took not 46 years to build but seven.
Some lessons for New York
By the standards of Paris and Munich, New York has practically everything it needs to run through-service. The electrification systems on its three commuter railroads are not compatible, but multivoltage trains not only are routine, but also already present in New York; the current configurations all have one problem or another, but fundamentally, ordering multivoltage trains is a solved problem. Only a handful of outer branches need to be electrified, and all can be deferred, running with forced transfers until they are wired as is current practice on the Raritan Valley Line and for the most part also the outer Port Jefferson Branch. The LIRR and Metro-North are entirely high-platform and New Jersey Transit’s Manhattan-facing lines only have 68 low-platform stations of which 26 are already funded for high platform conversions.
By far the biggest missing element for New York by cost is the Gateway Program and its Hudson Tunnel Project, which is budgeted at $16 billion and is funded and beginning construction, with the New Jersey land tunnel contract just awarded. Even before the new tunnel opens, it can run some through-service after Penn Station Access opens from the Hell Gate Line, pairing it with some New Jersey Northeast Corridor trains.
On top of that, some surface improvements are prudent, such as some grade separations of rail junctions, the most expensive costing on the order of hundreds of millions (Hunter is $300 million on the budget, maybe $400 million by now); much of that is already getting funds from the Bipartisan Infrastructure Law or likely to get them in the near future, since the infrastructure is also used by Northeast Corridor intercity trains.
But it does not need to do anything that area railroaders have convinced themselves they need, especially not new tracks at Penn Station. Nor are decades of prep work needed – rapid installation of high platforms is completely feasible, as was done not just in Munich in the 1960s and 70s but also in suburban New York in the same period and in the 1980s and 90s, converting the LIRR and Metro-North to full high-platform operations and doing the same on the Northeast Corridor in New Jersey.
All that is needed is a modicum of curiosity about the world, curiosity that is not seen in the presentation with its whoppers about the timelines of the RER and Munich S-Bahn, or its belief that new underground tracks are always required as if Penn Station is the same as the surface Gare du Nord. I find myself having to explain to journalists who interview me that all of this can be done, but the people in charge of the railroads around New York cannot do it.
Between New York and New Haven, a distance of 120 km (from Penn Station) or 116 km (from Grand Central), the two fastest intercity trains of the day take 1:35 to travel, an average of 75 km/h. Most do the trip in about 1:40, averaging about 72 km/h. Commuter trains to Grand Central do it in about 1:40 three times a day, averaging 70 km/h, but the vast majority of even the rush express trains are slower, a few doing it in 1:52 and most in about two hours, averaging 58 km/h. This is not normal for a primary intercity corridor; the Acela averages about 120 km/h between New York and Washington and between New Haven and Boston, which is typical for non-high-speed intercity lines in Europe, while high-speed ones usually average 200 km/h or more. I’ve been asked by some big names in online transit content creation why this is so, and hope to explain why the trains are slow, and what it would take to reduce 40 minutes from the one-way trip time.
The contrast should be with the high-speed rail proposal that I’m working on at Marron, which cuts the intercity trip time between New York and New Haven to about 52 minutes, on the existing right-of-way, and the express commuter rail trip time to Grand Central to about 1:16. The result is not high-speed rail, but is a fast upgraded intercity rail line, on a par with the faster British and Swedish lines. Changes in right-of-way geometry, including buyouts of houses in expensive suburbs in Connecticut, could reasonably cut the intercity trip time to about 45 minutes; these are mapped here, the 52-minute trip corresponding to the alternatives that stay on the existing right-of-way and the 45-minute one to the alternatives that use the bypasses where they exist.
The primary culprit for the slow trip times today is poor scheduling practices. Those practices, in turn, come from mutual abuse between Amtrak and the commuter rail operators, in this case Metro-North and the Connecticut Department of Transportation, both of which display terminal incompetence on all matters related to rail. The state of the tracks contributes to the slowness, and thus the second most important issue is poor maintenance practices leading to unreliable infrastructure, which then feeds into poor scheduling. Metro-North and CTDOT are again especially bad even by American standards. Physical infrastructure problems add minutes here and there, but the most important interventions are cheap and for the most part can only work with better timetabling rather than on their own.
Of note, it is common to blame the low speeds on curves. However, the curves are not especially onerous – few restrict trains to slower speeds than about 150 km/h given good operating practices. In fact, the Northeast Corridor gets if anything curvier east of New Haven until after it crosses into Rhode Island, but the speed there is higher, as there is less dense commuter traffic complicating the schedule, and Amtrak’s level of incompetence is bad but less bad than that of CTDOT.
Timetable padding
Every rail timetable has to include contingency or buffer time. This takes into account primarily the need for trains to recover from delays, and secondarily suboptimal driver behavior, such as starting to brake a little too early. Switzerland pads its timetables 7%; the TGV network can only do about 10-13%, and the ICE network about 25%. What I and others have seen on Amtrak and Metro-North trains as well as what train drivers have told me suggests that the buffer time between New York and New Haven is 25% or even maybe 30%.
More complex networks require more padding, since delays on one train cascade to others. The ICE network mixes intercity trains together with much slower regional ones on the same tracks, all over Germany, and delays can cascade across the entire country, to the point that some people have begun to advocate that Germany build a separate high-speed rail network, not for speed (which activists here don’t care much about), but for the reliability of having a fast network and a slow network rather than one mixed network. The more segregated TGV network thus does better; the almost entirely dedicated-track Shinkansen system does even better, and JR East suggested 4% padding in its review of California High-Speed Rail. Switzerland is like Germany in having a single mixed-speed network, but it has more systematic processes for avoiding delays, such as strategic investment in bypasses around known bottlenecks.
The Northeast Corridor is not an especially complex network. It is a single line with branches, rather than a two-dimensional mesh like the German rail network. There is little freight traffic, which makes it possible to control freight through regular slots, with the number of potential slots greatly exceeding actual traffic so that if a train misses its slot, it can wait 10 or 15 minutes for the next one. Passenger traffic is high on all lines serving the corridor, and thus there is no need to cut corners on reliability (such as signals, or platforms) on any of the branches. It is a mixed-speed line, but nearly all of it has four tracks, and where commuter trains share tracks with intercity trains, they run express and the speed difference is not large. In the timetables we developed at Marron with Devin Wilkins, express commuter trains do Stamford-Grand Central in 28 minutes if they run as today, stopping only at Harlem-125th, and in 29 if they also stop at New Rochelle; intercity trains do Stamford-Penn Station in 25 minutes, on a marginally longer route into New York. Slotting intercity and express commuter trains on the same tracks between Stamford and New Rochelle is annoying, but is not an objectively hard scheduling problem.
This does not mean that Amtrak and Metro-North could just shave minutes off of the existing timetables, change nothing else, and run trains to the faster schedules. Other elements of the schedule would make the trains too unreliable. But it is possible to realign the schedules appropriately and cut the trip time by a factor of about 1.3/1.07 = 1.2.
Timetable complexity
The ideal schedule is one with as few variations as possible. This way, planners can write one schedule, ensure that it works, and, if there are problems with it, then develop an infrastructure program that builds around the bottlenecks. Switzerland, as usual, sets the standard, with its all-day repeating clockface timetable, or Takt. Swiss trains repeat regularly every hour, and on the busy lines every half hour; planners need to make sure one pattern works and then repeat it all day. It’s the planning equivalent of economies of scale in manufacturing.
New York planning, relative to the ideal, represents the list of what not to do, and it’s worse on busier lines such as the New Haven Line than on less busy lines. In effect, the New Haven Line schedule is the planning equivalent of rules for writing prose that illustrate each rule by breaking it – remember to not split infinitives, the passive voice should be avoided, eschew obfuscation, and so on – except that it is meant to be taken seriously. It has all of the following problems:
Where good planning begins with one peak hour and repeats it all day, the New Haven Line has few repeating patterns, and practically none at the peak.
Where good planning aims to have trains make consistent stops for legibility and for ease of planning around bottlenecks, the New Haven Line has bespoke stopping patterns – not counting branches, there are 16 trains entering Grand Central at the peak hour, which make 13 distinct stopping patterns.
Where good regional rail planning keeps the peak-to-base ratio low – Switzerland is almost 1:1, and even very large cities that need a huge volume of commuter trains at rush hour like Paris or Tokyo do not exceed 2:1 (and London is well below it) – the New Haven Line has, with branches, 20 trains entering Grand Central at the peak hour and 4 entering each off-peak hour.
Where good planning runs more or less the same service on weekends as in the off-peak on weekdays, the New Haven Line’s midday off-peak and weekend schedules are different even as they run the same number of trains (two express and two local per hour).
Where good planning aims to use the timetable for a prolonged period of time to reduce the need to redo the schedule, for example updating annually as in Switzerland, New York-area practice is to update several times a year, in what looks like a 3-6 month period.
Where good planning keeps the trains spaced far enough based on signal system constraints by default, Metro-North timetables somehow have trains on the shared trunk between Harlem and Grand Central sometimes arriving within less than the 2 minute minimum on the same track, requiring special speed restrictions, even with unimpressive traffic levels by urban commuter rail trunk standards.
Where good maintenance is done when trains are not running, that is, at night, in order to avoid disturbing weekday traffic, American planning assumes that daytime maintenance will always take some track out of service; the New Haven Line’s track renewal program has been so mismanaged that at no point since it began in the 1990s have all four tracks between New York and New Haven been operable along the entire line – some section is always shut down. Daytime maintenance is also a problem in Germany, and is a factor behind the poor schedule reliability here.
The constant tweaks to the timetable are also a feature of the New York City Subway, with its substantially simpler stopping patterns. There, the services are consistent, and change at a rate of a handful per decade (most recently, when Second Avenue Subway opened; the previous time was during the 2010 service cuts). However, frequency is micro-targeted based on crowding guidelines, so the planners never have time to optimize one schedule; moreover, with 24/7 service, daytime closures for maintenance are unavoidable. This way, where planners at healthy railroads write schedules, planners at American passenger railroads write service changes. The New York City Subway at least has the partial excuse of 24/7 service; Metro-North has no such excuse. The maxim that the Northeast Corridor is held together with duct tape, and is managed by people who are unfamiliar with any more advanced tools than duct tape, also applies to timetabling.
In contrast with today’s morass, the schedule we’ve been writing aims to simplify whenever possible. Branches are slotted into windows that could be used by local or express main line trains depending on the desired service pattern. From New Haven south, everything is on a repeating 10-minute Takt. The New Haven Line is reduced to four stopping patterns – local Stamford-Grand Central, local Stamford-Penn Station, express New Haven-Grand Central, intercity New Haven-Penn Station – each running every 10 minutes. It took weeks to find a pattern that worked with all the constraints of the right-of-way and allowed some future desired infrastructure changes, and even that required some track changes detailed below. Off-peak, the commuter train patterns could run every 20 minutes instead, using every other slot; the timetable should not be tweaked further.
It is particularly important to avoid timetable complexity beyond local and express trains east of Stamford. The line has four tracks, and could be run with commuter trains on the local tracks, making all stops before transitioning to the express tracks at Stamford, and intercity trains on the express tracks, running nonstop between Stamford and New Haven. In theory, this means this section could be run with less than 7% schedule padding, for example the Shinkansen’s 4%, but in practice, I suspect it cancels out with the more complex situation between Stamford and New Rochelle, so 7% is the best that can be squeezed with maximally simple schedules.
Speed zones and curves
The New Haven Line is rather curvy, having been built in the 1840s. But its speed limits are still too low for its curves. I wrote here about cant and cant deficiency, and am not going to repeat myself too much. But, in brief, the speed on curves is governed by the formula
where v is speed, a is lateral acceleration in the horizontal plane, and r is curve radius. The value of a is usually expressed not in units of acceleration, but in units of distance, scaled so that, on standard-gauge track, 150 mm (of cant) correspond to 1 m/s^2 lateral acceleration. Typical maximum regulatory limits on cant range between 160 and 180 mm; the US permits 7″, but nowhere is more than 6″ used, and the New Haven Line’s curves mostly range between 3″ and 5″ cant. Cant deficiency limits depend on the train – regular passenger trains typically do 130-150 mm at the relevant speeds, but in the US, the normal practice is to limit commuter trains to 3″ cant deficiency, and only use 5″ on Amtrak Regional trains (the Acela tilts and is capable of 7″ today, with the new trains rated for 9″).
The curves on the New Haven Line are, for the most part, built to a standard of 2° radius, or, in metric units, r = 873. The most aggressive common cant and cant deficiency limits, 180 and 150 mm respectively, allow a = 2.2, and thus v = 43.82 m/s = 157.77 km/h; our timetables limit commuter trains to 150 km/h, and there are surprisingly few curves with tighter limits. In contrast, current practice restricts a to about 1.2, which means trains take the same curves at a speed of about 116 km/h, which is rounded down to 70 mph.
The slowdowns also affect intercity rail more than is required. While Amtrak trains are cleared for 5″ cant deficiency, Metro-North prefers to timetable all trains at its own trains’ speed on curves. Then, because there are so few opportunities under current standards for trains to run faster than 70-75 mph within CTDOT territory, the entire line from the state line to New Haven is maintained to those standards, and thus even on relatively straight sections, there is no opportunity to gain speed. East of New Haven, the curves are if anything tighter, but Amtrak dominance means the tracks are cleared for 100-125 mph, cant is higher, and cant deficiency is higher as well.
All of these restrictions can be lifted. The work required to redo a line from 110 km/h to 160 km/h or even more is rather routine, as long as it can be done within the right-of-way. The standards for track irregularity get tighter as speed increases, but all of this can be handled with track laying machines, which use the track itself to do the work, at a pace of about 0.5 km/h, or about 1.5 km in a three-hour nighttime work window; the entire New Haven Line can be regraded in about a year this way.
Unfortunately, Metro-North is used to manual track inspections rather than modern machinery. It finally bought a track laying machine on the model of Amtrak, but appears not to use it very well; the productivity I hear quoted is one tenth what was expected. But what is hard for Metro-North and CTDOT is not objectively hard, and even other Northeastern American railroads are often capable of it.
Supportive infrastructure
Infrastructure construction and timetabling work in tandem normally. Swiss practice is to use insights from the timetable in theory and in practice to inform where to build new tracks. American practice does no such thing – for one, Metro-North is allergic to systematic track improvement, so over the generations, the timetable has diverged from the infrastructure that could support it.
In fact, a very high-frequency peak schedule requires eliminating at-grade conflicts whenever it is even remotely feasible. Shell Interlocking at CP 217, just south of New Rochelle, is a flat junction on which trains from the north can go to either Grand Central or Penn Station. Grade-separating the junction was occasionally on the wishlist for Northeast Corridor improvements, but Metro-North is not currently asking for it, even though it is especially important as Penn Station Access is about to open. The junctions with the branches farther north – New Canaan, Danbury, Waterbury – are flat as well, for which the solutions can be a forced transfer (as is sometimes practiced with Waterbury, the weakest of the three) or grade-separation. This does not cost a large amount of money – New Jersey Transit is applying for money for its equivalent of Shell, Hunter Flyover connecting the Raritan Valley Line to the Northeast Corridor, and the budget is $300 million in the plan and, I’ve been told, $400 million with recent inflation and perhaps some small cost overrun.
Then there is the issue of the Grand Central approaches. The current throat limits trains to 10 mph on the last mile into the station. In other words, the last mile takes six minutes. It should take about two, based on actual throat and turnout geometry; the turnouts are #12 until around 700 meters from the end of the platform, and in Germany, a 1:12 switch is 60 km/h, and closer to the platforms, the turnouts are #7 and (on one cluster of tracks) #6.5, where in a Germany, a 1:7 is 40 km/h. Even with bumper tracks, the last mile has no reason to take longer than two minutes, saving all Metro-North travelers to Grand Central four minutes. The turnouts would need to be regraded to tangential standards, but this can be done within their existing footprint; the cost of a new turnout in a selection of European countries and also on American freight railroads is around $250,000 in the prices of the 2010s, whereas Metro-North’s switches cost perhaps five times much in the same era.
Finally, the movable bridges impose certain speed restrictions. Those are the biggest projects currently in planning for speeding up the New Haven Line. In truth, the slowdowns imposed are secondary (though our timetables still assume they are fixed). They are also extremely expensive – one of them is currently slated for in situ replacement for $1 billion, for a span of 220 meters from tower to tower, on a river about 100 m wide. CTDOT rail projects are generally absurdly expensive even by American standards – infill stations on the Hartford Line are coming in at $50 million or more, twice the cost of suburban Boston and more than twice that of suburban Philadelphia – for which the culprit must be poor project management and lack of in-house expertise.
Conclusion
The New Haven Line is a busy railroad at the peak, but nothing about it is special. It is old, but no older than faster sections of the Northeast Corridor or fast legacy intercity main lines in parts of Europe, especially the United Kingdom. It is busy, but its total ridership is unimpressive by European S-Bahn standards – the single trunk line in Munich with its seven branches on each side generates about 900,000 daily riders, perhaps a bit more than all three New York-area commuter railroads combined. It is branched, but the branching is simpler than on the busier systems, and the graph of the Northeast Corridor overall is acyclic, simplifying planning.
The reason the trains are slow is not the infrastructure. The elements of the infrastructure that need to be fixed to shorten the trip times from about 1:35 intercity and 2:00 commuter to 0:52 intercity and 1:16 commuter are cheap. Rather, the reason is that the line is managed not just by Americans, which is usually bad enough, but specifically by Metro-North and CTDOT. The schedules are designed not to work; the maintenance is designed not to work either and is too expensive.
When I was visiting New York in June-July, I was stricken by how hard it was to figure out when the next train would come. Every subway station is equipped with countdown clocks, the A Division (numbered lines) and L trains having older installations than the rest of the B Division (lettered lines). However, the B Division stations that I used did not have many countdown clocks, and I found myself having to walk long distances along hot platforms to figure out which train to take. I counted the number of clocks at a few stations, and asked ETA members to do the same; now back in Berlin, I’ve done some counts here as well, confirming that it’s not just me – New York’s B Division platforms have fewer and harder to find countdown clocks than the standard on the Berlin U- and S-Bahn platforms, even though New York’s more complex subway network requires if anything more clocks as passengers have multiple options. Based on what I’ve seen in Berlin, I recommend that New York install a minimum of four overhead clocks per B Division platform, with the screen going in both directions.
The situation in Berlin
The U-Bahn platforms seem standardized to me. The traditional norm was that stations were built cut-and-cover, right underneath a major street, with an entrance at each end of the central island platform. Nowadays almost all stations have elevators and there are plans for retrofitting the rest, which BVG estimates will be completed in 2028, the date having been pushed later over the years I’ve lived in the city. The elevators always connect two levels, with opposite side doors for the two levels, so that wheelchair users don’t have to turn.
There are, at the stations I use, two overhead countdown clocks for each platform face. Nearly all platforms are islands, and each direction has separate countdown clocks. The clocks display the times on both sides, and are typically located at the quarter points of the station, so that passengers are never more than a quarter of the platform length from a clock, with good sight lines; the platforms are 100-110 meters long.
The S-Bahn is less standardized. A full-length eight-car train is 150 meters is long. The countdown clocks are double-sided and overhead as on the U-Bahn, and each platform face has a separate clock even when the tracks are in the same direction (as at Ostbahnhof), but the number is inconsistent; there are stations with just one, but Friedrichstraße on the North-South Tunnel has three.
The situation in New York
The A Division has overhead countdown clocks, connected to the train control system (automated train supervision, or ATS), installed in the early 2010s; the L has countdown clocks of the same provenance. The number of clocks per station is not fixed, but ranges between two and four per track. The B Division’s train control system let the control center know where trains were but not which train was which – that is, which train on the same track is an A, which is a D, and so on – and therefore the same system was not installed at the time. Years later, a different system was installed, with nicer graphics and a different connection to the control center, which is sometimes less accurate.
This newer system on the B Division has a combination of overhead clocks, often single- rather than double-sided, and floor-mounted clocks facing sideways, toward the tracks rather than toward the front and back of the platforms. The floor-mounted clocks are difficult to read unless I’m standing right there. The platforms are obstructed so it’s hard to tell from a distance where the clock is. Worse, many floor-mounted installations look identical from a distance to the clocks, but instead display advertisements or service changes but no information about the next train.
What’s more, there just aren’t a lot of these clocks. At 2nd Avenue on the F, heading downtown toward Marron, I counted a single clock, but six boards displaying system maps or ads. ETA’s Alex Sramek checked several stations in Lower Manhattan, including Chambers on the A/C/E and on the J/Z, Fulton Street, Cortlandt Street on the R/W, and Broad Street, and found one to three clocks, always a mix of overhead and floor-mounted – and the floor-mounted clocks sometimes would only show the next train and not the subsequent ones, even for platforms serving multiple routes.
There should be more clocks in New York than in Berlin. The platforms are much longer – the A Division platforms are 155 meters, the L and J/Z platforms are 145 meters, the other B Division platforms are 185 meters. The extensive branching means that even while waiting on the platform, regardless of what information is displayed outside the station, it is important to know when each service using the station will come, to plan out which line to take. I made mistakes on trips from Brooklyn to Queens just because I wasn’t sure what to do when transferring at West 4th, where, having just missed the E, I needed to make a decision on whether to wait for a delayed F or try to make the B/D and transfer to the E at 53rd, opted for the latter, and missed the E at 53rd.
If a Berlin U-Bahn station has two double-sided clocks, and a major S-Bahn station has three, then New York should have four per B Division platform. These should be overhead and double-sided – the floor-mounted screens are difficult to see from a distance along the direction relevant to most passengers, and easily confused with ads, ensuring that their utility is marginal.
I’ve written a lot about urban rail construction costs per kilometer, but from time to time, my colleagues and I have been asked about what happens if we compare costs, not per kilometer, but per rider. There’s an intuition among people in transportation advocacy (including anti-transit activists who prefer cars) that the construction costs of urban rail lines per rider are a meaningful measure of cost-effectiveness. This intuition is true, and yet, it must be interpreted delicately.
First, modes of transit with different operating cost structures should tolerate different levels of capital costs; in particular, the current practice in which subways are built at higher cost per rider than light rail, which in turn is built at higher cost than bus lanes, reflects real differences in operating costs and does not mean there is overinvestment in subways and underinvestment in buses. And second, costs per rider can be too low, in a sense – if a city’s construction costs per rider are very low, indicating a very high benefit-cost ratio, then it shouldn’t be lauded for its fiscal prudence but scolded for not having built these lines long ago and for not building more today. In truth, places with healthy decisionmaking about infrastructure expand their networks to the limit of cost-effectiveness, which means that costs per rider averaged over an entire region vary less than costs per kilometer, and this just reflects that cities build what they can, so low-cost cities can afford to build lines to lower-ridership areas, which higher-cost cities would reject as too expensive for the benefit. This way, costs per rider are not too different in New York and in cities that build for an order of magnitude lower cost per km than New York.
The meaning of cost per rider
In the remainder of this post, the meaning of “cost per rider” is “cost divided by the ridership on a working day.” In Europe, workers get around six weeks of paid vacation, and tend to take them in the summer, leading to depressed ridership around July or August, depending on the city; daily counts usually avoid this period, so for example Stockholm specifies that daily ridership figures are taken in winter. This, as I will explain shortly, does not unduly make European lines look more cost-effective than they actually are.
The cost per rider is best understood as a cost-benefit measurement. All benefits of public transportation scale with ridership, generally linearly: higher ridership indicates tighter economic and social ties if it comes from more travel, and better environmental outcomes if it is at the expense of car travel. What’s more, raw ridership measured in trips is better at capturing these benefits than passenger-km. The issue is that focusing on p-km overrates the success of extremely suburban systems, which have low environmental benefits for their p-km (the users are typically park-and-riders and therefore drive extensively, just not to their city center jobs) and usually also high net operating costs since they are peaky and tend to charge low per-p-km fares. Conversely, the short-hop trip is a net profit to the system – even subways with distance-based fares charge degressive rather than linear fares – and comes from dense networks that cut out car-based travel entirely. These effects roughly cancel out to the point that ridership is a good proxy for actual benefits.
That said, all outcomes need to be scaled to regional or even national incomes. Economic benefits are usually measured relative to worker wages anyway; in some business case analyses, such as that of the United Kingdom, the economic benefit is even scaled to rider income rather than regional or national income, which favors lines built to rich neighborhoods over lines built to poor ones, and isn’t really how cities need to think about their public transit networks. Social benefits are usually taken on a willingness-to-pay basis, and the same is true of health benefits including reduced air and noise pollution from cars and reduced car accidents.
The next step is then to compare the cost per rider with GDP per capita, which is not perfect but is good enough as a proxy for incomes. This also takes care of the issue of Europe’s synchronized summer troughs in local travel: those six weeks of paid vacation are visible in reduced GDP per capita, so the apparent bonus to the European system of using cost per daily trip where “day” means “workday outside the summer vacation season” rather than cost per annual trip cancels out with reduced annual GDP per capita.
The rough rule of thumb I use is that the absolute limit of cost-effectiveness for a subway or commuter rail line is when the cost per rider is equal to GDP per capita. This is a coincidence: a one-time cost has no reason to be equal to an annual income – this just follows from Börjesson-Jonsson-Lundberg’s estimate of the Stockholm Metro’s benefit-cost ratio compared with its cost per rider relative to the GDP per capita of 1960s’ Sweden. In practice, infrastructure is never built down to a benefit-cost ratio of 1, due to construction risks; in countries that make decisions based on benefit-cost analyses, the minimum is usually 1.2 or 1.3. In this schema, the United States can afford to build up to an envelope of $85,373/1.3 to $85,373, which is $65,000-70,000/rider in 2024 prices. The frontier lines, like the Interborough Express, are fairly close to this limit already; in practice, there’s a range, with some lines in the same city built well over the limit for political reasons (often airport connectors) and others built far below it.
Cost per rider by mode
The above analysis works for subways and commuter rail. It does not work for trams or buses. The reason is that surface transit never achieves the same low operating costs as metros, so in practice, the total cost to be truly comparable needs to be incremented by the additional operating costs.
To be clear, this is just a rule of thumb. There are different metro lines, even with the exact same technology in the same city, with different projected operating cost profiles; for example, in Vancouver, the Broadway extension of SkyTrain toward UBC was projected in the 2010s to reduce net operating costs as many buses would be replaced by fewer, larger trains, but the outward extension of the same system deeper into Surrey and Langley is projected to increase net operating costs. There are different ways to interpret this – for example, the Surrey extension is in a more auto-oriented area, with more likely car-to-train switchers (this is still much denser than an American park-and-ride); on net, though, I think the differences are not huge and could to an extent even be folded into the notion of cost per rider, which is substantially better on Broadway than in Surrey and Langley.
That said, metros consistently have much lower operating costs than light rail and buses in the same city; here are American cost profiles. As far as I can tell from CoMET data, most European and Asian metros cluster toward the bottom end of the American cost profile (such as the Chicago L; the New York City Subway is the top end among the big systems); bus operating costs are more or less proportional to driver wages times operating hours throughout the developed world. Here we need to briefly switch to cost per p-km, since mature urban rail networks use buses as short-hop feeders – the counterfactual to a bus-based network for New York isn’t people riding the same bus routes as today but at higher intensity, but people riding longer bus routes, so the cost would roughly scale to cost per p-km, not per passenger.
In rich Asia, metros are profitable. In Europe, it depends – the London Underground operationally broke even in the early 2010s, and the Berlin U-Bahn was said to do the same in the late 2010s. In healthy European systems, it’s never reported directly, since there’s fare integration across the region, so financial data are reported at metropolitan scale without much breakdown between the modes, but the farebox operating ratios in at least Germany and Scandinavia, and probably also Paris (which has much higher ridership density than London or Berlin, comparable costs per car-km, and higher fares than pre-2022 Berlin), suggest that metros and the inner sections of commuter rail systems can break even, and then the subsidies go to the buses and to suburban extensions.
Individual bus systems can be profitable, but never at metropolitan scale, not in the first-world cities I’m aware of. In New York, the buses between New Jersey and Manhattan are profitable and run by private companies, but that’s one specific section of the system, and on net the bus system in New Jersey, including not just these cross-tunnel buses but also internal buses within the state, loses money, covered by New Jersey Transit subsidies, and the financial performance of buses within New York is, frankly, terrible.
One potential complication is that BRT infrastructure is usually installed on the highest-performing individual routes, and those can have rather low operating costs. But then, the operating costs of the buses on Broadway in Vancouver are extraordinarily low, and still the projections are for the SkyTrain extension that would replace them to, on net, reduce systemwide operating subsidies. If your city has a bus corridor so strong that ordinary BRT would be profitable, the corridor has high enough ridership for a subway.
Light rail is essentially a via media between metros and buses: higher operating costs than metros, in theory lower ones than buses. I say in theory, because in the United States, light rail as a mode comprises different things, some behaving like lower-efficiency subways with shorter cars like the Boston Green Lines, and others running as mostly grade-separated urban rail in cities like the Los Angeles and Portland cities with extremely low ridership and high resulting operating costs. But a light rail system with serious ridership should comfortably obtain better operating outcomes than buses, if worse ones than metros.
Costs per rider can be too low
In New York, as mentioned above, the current urban rail extensions under construction (Second Avenue Subway Phase 2) or discussion (Interborough Express) have costs not far from the frontier relative to American incomes. In Berlin, the extensions instead are far cheaper; U8 to Märkisches Viertel was projected to cost 13,160€ per daily rider in 2021, which is a fraction of Germany’s GDP per capita.
This does not mean Berlin builds cost-effectively. It means Berlin builds too little. A line that costs less than one third the country’s GDP per capita should have been built when the GDP per capita was one third what it is now. If there are a lot of such possibilities in the city, it means there was a crisis it’s only now recovering from or there has been too much austerity, or both, in the case of Berlin.
Healthy construction environments – that is, not Germany, which has normal costs per kilometer and chooses to barely build intercity or urban rail – will instead build to the frontier of what’s cost-effective. In New York, it’s Second Avenue Subway; in Madrid, it’s extensions into deep suburbia making the system almost as long as that of New York, on one third the metro area population. Rational yes/no decisions on whether to build at all can coexist with good construction practices or with deeply irrational ones.
Two reports that I’ve collaborated on are out now, one about high-speed rail planning for Marron and one about Northeast Corridor maintenance for ETA. A third piece is out, not by me but by Nolan Hicks, about constant-tension catenary and its impact on speed and reliability. The context for the latter two pieces is that the Northeast Corridor has been in a recurrent state of failure in the last three weeks, featuring wire failures, circuit breaker failures, track fires, and transformer fires. The high-speed rail planning piece is of different origin – Eric interviewed officials involved in California High-Speed Rail and other American projects that may or may not happen and this led to synthesizing five planning recommendations, which aren’t really about the Northeast Corridor but should be kept in mind for any plan there as well.
The broader context is that we’re going to release another report specific to the Northeast Corridor, one that’s much more synthetic in the sense of proposing an integrated infrastructure and service planning program to cut trip times to about 1:53 New York-Washington and 2:00 New York-Boston, informed by all of these insights. Nolan’s piece already includes one key piece of information that’s come out of this work, about the benefits of constant-tension catenary upgrades: 1:53 requires constant-tension catenary, and if it is not installed, the trip time is 2:04 instead, making this the single biggest piece of physical infrastructure installation the Northeast Corridor needs.
The catenary issue
Trying to go to Philadelphia, I was treated to a train stuck at Penn Station without air conditioning, until finally, after maybe 45 minutes of announcements by the conductor that it would be a while and they’d make announcements if the train was about to move, I and the other passengers got out to the station, waiting for anything to change, eventually giving up as the train and several subsequent ones were canceled. My post from three days ago about Germany has to be read with this context – while publishing I was waiting for all three pieces above to appear.
I encourage people to read the ETA report for more detail about the catenary. In brief, overhead wires can be tensioned by connecting them to fixed places at intervals along the tracks, which leads to variable tension as the wires expand in the heat and contract in the cold; alternatively, they can be tensioned with spring wires or counterweights, which automatically provide constant tension. The ETA report explains more, with diagrams, some taken from Garry Keenor’s book on rail electrification, some made by Kara Fischer (the one who made the New Mexico public transit maps and others I’ll credit upon request, not the USDOT deputy chief of staff). The catenary on the Northeast Corridor has constant tension north of New York, and for a short stretch in New Jersey, but not on the vast majority of the New York-Washington half of the line.
Variable-tension catenary is generally unreliable in the heat, and is replaced with constant-tension catenary on main lines even in Europe, where the annual temperature range is narrower than in the United States. But it also sets a blanket speed limit; on the Northeast Corridor, it is 135 mph, or 217 km/h – the precision in metric units is because 217 km/h is the limiting speed of a non-tilting train on a curve of radius 1,746 meters, a common radius in the United States as it is a round number in American units (it’s 1°, the degree being the inverse of curve radius). This blanket speed limit slows trains by 11 minutes between New York and Washington, subject to the following assumptions:
The tracks otherwise permit the maximum possible speed based on curvature, up to 320 km/h; in practice, there are few opportunities to go faster than 300 south of New York. There is an FRA rule with little justification limiting trains to 160 mph, or a little less than 260 km/h, on any shared track; the rule is assumed removed, and if it isn’t, the cost is about one minute.
Trains have the performance of the Velaro Novo, which trainset is being introduced to the United States with Brightline West. Other trainsets may have slightly better or worse performance; the defective Avelia Liberty sets are capable of tilt and therefore the impact of maximum speed is larger.
Intercity trains make one stop per state, counting the District of Columbia as a state.
Intercity and regional trains are timetabled together, on a clockface schedule with few variations. If a train cannot meet these requirements, it stays off the corridor, with a forced transfer at Philadelphia or Washington. All train schedules are uniformly padded by 7%, regardless of the type of catenary. If variable-tension catenary requires more padding, then the impact of constant-tension catenary is increased.
The bulk of the difference between 1:53 and the current trip time of about 2:50 is about timetabling, not infrastructure – when the trains are running smoothly, there is extensive schedule padding, in one case rising to 35 minutes south of New York on a fast Regional. Rolling stock quality provides a boost as well, to both reliability and acceleration rates. Faster speeds on curves even without tilt matter too – American standards on this are too conservative, and on a built-out line like the Northeast Corridor, being able to run with 180 mm of cant and 130 mm of cant deficiency (see explanation here) is valuable. But once the regulatory and organizational issues are fixed, the biggest single piece of infrastructure investment required is constant-tension catenary, simultaneously reducing trip times and improving reliability.
Nolan’s piece goes more into costs for catenary repair, and those are brutal. The Northeast Corridor Project Inventory includes $611 million to just replace the catenary between Newark and New Brunswick, without constant-tension upgrades. This is 36.5 route-km, some four- and some six-track; the $16.7 million/cost electrifies a new line from scratch around six times over in non-English-speaking countries, and while the comparison is mostly to double-track lines, around half the cost of electrification is the substations and transformers, and those aren’t part of the project in New Jersey.
State of Good Repair projects always end up as black holes of money, because if half the money is spent and there’s no visible improvement, it’s easy for Amtrak to demand even more money, without having to show anything for it. An improvement project would be visible in higher speeds, better ride quality, higher reliability, and so on, but this is free money in which the cost is treated as a positive (jobs, the appearance of work, etc.) and not something to be minimized in pursuit of another goal. One conclusion of this is that no money should be given to catenary renewal. Money can be spent on upgrades with visible results, in this case constant-tension catenary. On all else, Amtrak cannot be trusted.
High-speed rail planning
The report we wrote on high-speed rail planning at Marron is longer than the ETA report, but I encourage people to read it as well, especially anyone who wishes to comment here. In brief, we give five broad recommendations, based on a combination of reviewing the literature on high-speed rail, cost overruns, and public infrastructure management, and interviewing American sources in the field.
The federal government needs to nurture local experimentation and support it with in-house federal expertise, dependable funding, and long-term commitment.
The FRA or another federal entity should have consistent technical standards to ensure scale and a clear operating environment for contractors.
The federal government should work with universities to develop the technology further, which in this case means importing standards that work elsewhere – high-speed rail in 2024 is a mature technology, not requiring the inventions of new systems that underlay the Japanese, French, and German networks.
Agencies building high-speed rail should have good project delivery, following the recommendations we gave in the subway construction costs report. Using consultants is unavoidable, but there needs to be in-house expertise, and agencies should avoid being too reliant on consultants or using consultants to manage other consultants.
Agencies and states should engage in project planning before environmental reviews and before making the decision whether to build; the use of environmental reviews as a substitute for planning leads to rushed designs, which lead to mistakes that often prove fatal to the project.
Currently, all American high-speed rail plans should be treated as case studies of what to avoid. However, this does not mean that all of them fail on all five criteria. For one, California High-Speed Rail largely used pan-European technical standards in its planning; Caltrain did not in related planning including the electrification project and the associated resignaling (originally intended to be the bespoke CBOSS). The criterion on technical standards becomes more important as different projects interact – for example, Brightline West is inconsistent about what it’s using. Then there’s Texas Central, which uses turnkey Shinkansen standards, but as it’s turned over to Amtrak is bound to get modifications that conflict with what Japan Railways considers essential to the Shinkansen, such as total lack of any infrastructure mixing with legacy trains.
Notably, none of this is about the Northeast Corridor directly. My own interpretation of the report’s recommendations points out to other problems. For example, the Northeast Corridor’s technical standards are consistent but also bad, coming from an unbroken legacy of American railroader traditions whose succors can barely find Germany on a map, let alone bother to learn from it or any other foreign country. This way, the New Haven Line, which with modern trainsets and associated standards has few curves limiting trains to less than 150 km/h, is on a blanket speed limit of 75 mph, or 121 km/h, in Connecticut, with several further slowdowns for curves. There’s long-term planning for the corridor, and it’s bipartisan, but this long-term planning involves agencies that fight turf wars and mostly want to get the others out of what they perceive as their own turfs. There is lush funding, but it goes to the wrong things – Moynihan Train Hall but no improvements at the track level of Penn Station, extensive track renewal at 1.5 orders of magnitude higher cost than in Germany, in-place bridge replacements on curvy track instead of nearby bypasses.
The current planning does use too many consultants – in fact, Penn Reconstruction’s interagency agreement stipulates that they use consultant-centric project delivery methods, with one possibility, progressive design-build (what most of the world calls design-build; what New York calls design-build is different and better), not even legal in New York state law, but the local power brokers are trying to legalize it and break their own construction cost records. But it’s not quite the same as not bothering to develop in-house talent – there is some, and sometimes it isn’t bad, but poor project management and lack of interagency coordination has caused the budgets for the big-ticket items that Amtrak wants to explode beyond anyone’s ability to manage. The five recommendations, applied to the Northeast, mostly speak to the low quality of the existing agencies, rather than to a hodgepodge of standards as is happening at the interface between California High-Speed Rail and Caltrain or Brightline West.
The ultimate problem on the Northeast Corridor is that it is held together with duct tape, by people who do not know how to use more advanced tools than duct tape. They constantly fight fires, sometimes literally, and never ask why fires always erupt when they’re around; it’s not the heat, because the Northeast isn’t any warmer than Japan or South Korea or Italy, and it’s not underinvestment 30+ years ago, because Germany has that history too. Nolan points out the electric traction backlog on the Northeast Corridor grew from less than $100 million in 2018 to $829 million today; the people in charge are substantially the same ones who deferred this much maintenance over the six-year period that included the Bipartisan Infrastructure Law. I didn’t get into this project in order to study other people’s failures again, as we did with the construction costs report. But everything I’m seeing on the Northeast Corridor, even more than in California or Texas, points to what may be the worst intercity rail planning of any even vaguely modern country.
The New York City Subway is showing solidarity with Israel: like public transportation in Israel, it does not usefully run on weekends. Today, while going from my hotel to Marron, I waited 16 minutes for the F train, and when I got to the platform, there was already a small crowd there; the headway must have been 20 minutes. Now writing this on the way north to Queens, I’m seeing canceled trains and going through reroutes hoping that it’s possible to get from Marron to the Queens Night Market in under an hour; revising hours later, I now know it would have been but the 7 train is skipping the nearest stop to the Night Market, 111th Street.
This is on my mind as I see that Governor Kathy Hochul, after abruptly canceling congestion pricing in legally murky circumstances, wants to also ban wearing masks on the subway. I write this on a car where I’m the only person wearing a mask as far I can see, but usually I do see a handful of others who wear one like me or Cid. Hochul told the New York Post that Jewish groups asked her to do so citing security concerns, since some anti-Semitic rioters cover their faces. Jewish and pro-Israel groups have said no such thing, and I think it’s useful to bring this up, partly because it does affect the subway, and partly because it speaks to how bad Hochul’s political knowledge is that she would even say this.
Now, I don’t think the mask ban is going very far. For a few days, instead of getting constant constituent calls all the time demanding that congestion pricing be restored, legislators were getting such calls only half the time, and got calls demanding they oppose the mask ban the other half. Congestion pricing is likely not within Hochul’s personal authority to cancel, but evidently the MTA board did not overrule her and did not sign that the state consented to congestion pricing; but a mask ban is definitely not within her authority, certainly not when it would be new policy rather than status quo policy (if not status quo law, since congestion pricing did get signed into law).
That said, the invocation of Jewish or pro-Israel concerns was troubling, for a number of reasons, chief of which is that the groups so named did not in fact demand a subway mask ban. The Anti-Defamation League asked for a mask ban at protests, where the current left-wing American protest culture involves wearing masks but very rarely medical ones. Hochul cited unnamed Jewish advisors, when at no point has any significant element in the American Jewish community called for this. There are a number of possibilities, all of which are derogatory to her judgment, knowledge, or other political skills.
The first possibility is that she’s just lying. Nobody asked for this, not on the subway, and she’s trying to change the topic from her total failure on congestion pricing; a mask ban at protests alone, as proposed by Los Angeles Mayor Karen Bass (at least before she just got corona), would not change the conversation on issues of public transportation.
The second is that she is using the ADL for cover because the ADL has little patience for anything it perceives as too left-wing, and Hochul wants to position herself as a moderate and her pro-congestion pricing opponents as too liberal. If that was the intent, then it’s dumb – subway advocacy is not at all radical, and the people spearheading both the lawsuit against Hochul and the rallies in favor of congestion pricing are neither anti-Israel nor baitable on this subject.
And the third is that she internalized a kind of conspiratorial anti-Semitism; she doesn’t weaponize it against Jews like properly anti-Semitic politicians, but a politician from Buffalo, thrust into a stage with different demographics from what she’s used to, might still believe, in the back of her mind, that Jews are conspiring and say things they do not mean. It’s complete hogwash – pro-Israel groups are open about who they are and what they want, and have little trouble calling for changes that they think are necessary for the protection of the great majority of American Jews who are at least somewhat pro-Israel. They have no need to whisper in a governor’s ear and every reason to call for such a ban in the open if they believe it is good; that they haven’t should end any suspicion that they want it.
In any of the above cases, the inevitable conclusion is that Hochul knows neither how to govern nor how to do politics effectively. She can’t distract the public from her own inability to run the state, certainly not by piling one failure upon another.