Category: Studies
Amtrak Doubles Down on False Claims About Regional Rail History to Attack Through-Running
Amtrak just released its report a week and a half ago, saying that Penn Expansion, the project to condemn the Manhattan block south of Penn Station to add new tracks, is necessary for new capacity. I criticized the Regional Plan Association presentation made in August in advance of the report for its wanton ignorance of best practices, covering both the history of commuter rail through-running in Europe and the issue of dwell times at Penn Station. The report surprised me by making even more elementary mistakes on the reality of how through-running works here than the ones made in the RPA presentation. The question of dwell times is even more important, but the Effective Transit Alliance is about to release a report addressing it, with simulations made by other members; this post, in contrast, goes over what I saw in the report myself, which is large enough errors about how through-running works that of course the report sandbags that alternative, less out of malice and more out of not knowing how it works.
Note on Penn Expansion and through-running
In the regional discourse on Penn Station, it is usually held that the existing station definitely does not have the capacity to add 24 peak trains per hour from New Jersey once the Gateway tunnel opens, unless there is through-running; thus, at least one of through-running and Penn Expansion is required. This common belief is incorrect, and we will get into some dwell time simulations at ETA.
That said, the two options can still be held as alternatives to each other, even as what I think is likeliest given agency turf battles and the extreme cost of Penn Expansion (currently $16 billion) is that neither will happen. This is for the following reasons:
- Through-running is good in and of itself, and any positive proposal for commuter rail improvements in the region should incorporate it where possible, even if no dedicated capital investment such as a Penn Station-Grand Central connection occurs. This includes the Northeast Corridor high-speed rail project, which aims to optimize everything to speed up intercity and commuter trains at minimal capital cost.
- The institutional obstacles to through-running are mainly extreme incuriosity about rest-of-world practices, which are generations ahead of American ones in mainline rail; the same extreme incuriosity also leads to the belief that Penn Expansion is necessary.
- While it is possible to turn 48 New Jersey Transit trains per hour within the current footprint of Penn Station with no loss of LIRR capacity, there are real constraints on turnaround times, and it is easier to institute through-running.
The errors in the history
The errors in the history are not new to me. My August post criticizing the RPA still stands. I was hoping that Amtrak and the consultants that prepared the report (WSP, FX) would not stick to the false claim that it took 46 years to build the Munich S-Bahn rather than seven, but they did. The purpose of this falsehood in the report is to make through-running look like a multigenerational effort, compared with the supposedly easier effort of digging up an entire Manhattan block for a project that can’t be completed until the mid-2030s at the earliest.
In truth, as the August post explains, the real difficulties with through-running in the comparison cases offered in the report, Paris and Munich, were with digging the tunnels. This was done fairly quickly, taking seven years in Munich and 16 in Paris; in Paris, the alignment, comprising 17 km of tunnel for the RER A and 2 for the initial section of the RER B, was not even finalized when construction began. The equivalent of these projects in New York is the Gateway tunnel itself, at far higher cost. The surface improvements required to make this work were completed simultaneously and inexpensively; most of the ones required for New York are already on the drawing board of New Jersey Transit, budgeted in the hundreds of millions rather than billions, and will be completed before the tunnel opens unless the federal government decides to defund the agency over several successive administrations.
The errors in present operations
The report lists, on printed-pp. 40-41, some characteristics of the through-running systems used in Paris, Munich, and London. Based on those characteristics, it concludes it is not possible to set up an equivalent system at Penn Station without adding tracks or rebuilding the entire track level with more platforms. Unfortunately for the reputation of the writers of the report, and fortunately for the taxpayers of New York and New Jersey, those characteristics include major mistakes. There’s little chance anyone in the loop understands the RER, any S-Bahn worth the name, or even Crossrail and Thameslink; some of the errors are obviously false to anyone who regularly commuted on any of these systems. Thus, they are incapable of adjusting the operations to the specifics of Penn Station and Gateway.
Timetabling
A key feature of S-Bahn systems is that the trains run on a schedule. Passengers riding on the central trunk do not look at the timetable, but passengers riding to a branch do. I memorized the 15-minute off-peak Takt on the RER B when I took it to IHES in late 2016, and the train was generally on time or only slightly delayed, never so delayed that it was early. Munich-area suburbanites memorize the 20-minute Takt on their S-Bahn branch line. Some Thameslink branches drop to half-hourly frequency, and passengers time themselves to the schedule while operators and dispatchers aim to make the schedule.
And yet, the report repeatedly claims that these systems run on headway management. The first claim, on p. 40, is ambiguous, but the second, on the table on p. 41, explicitly contrasts “headway-based” with “timetable-based” service and says that Crossrail, the RER, and the Munich S-Bahn are headway-based. In fact, none of them is.
This error is significant in two ways. First, timetable-based operations explain why S-Bahn systems are capable of what they do but not of what some metros do. The Munich S-Bahn peaks at 30 trains per hour, with one-of-a-kind signaling; major metros peak at 42 trains per hour with driverless operations, and some small operations with short trains (like Brescia) achieve even more. The difference is that commuter rail systems are not captive metro trains on which every train makes the same stops, with no differentiation among successive trains on the same line; metro lines that do branch, such as M7 and M13 in Paris, are still far less complex than even relatively simple and metro-like lines like the RER A and B. The main exception among world metros is the New York City Subway, which, due to its extensive interlining, must run as a scheduled railroad, benchmarking its on-time performance (OTP) to the schedule rather than to intervals between trains. In the 2000s and 10s, New York City Transit tried to transition away from end-station OTP and toward a metric that tried to approximate even intervals, called Wait Assessment (WA); a document leaked to Dan Rivoli and me went over how this was a failure, leading to even worse delays and train slowdowns, as managers would make the dispatchers hold trains if the trains behind them were delayed.
The second consequence of the error is that the report does not get how crucial timetable-infrastructure planning integration is on mainline rail. The Munich S-Bahn has outer branches that are single-track and some that share tracks with freight, regional, and intercity trains. The 30 tph trunk does no such thing and could not do such thing, but the branches do, because the trains run on a fixed timetable, and thus it is possible to have a mix of single and double track on some sporadic sections. The Zurich S-Bahn even runs trains every 15 minutes at rush hour on a short single-track section of the Right Bank of Lake Zurich Line. Recognizing what well-scheduled commuter trains can and can’t do influences infrastructure planning on the entire surface section, including rail-on-rail grade separations, extra tracks, yard expansions, and other projects that collectively make the difference between a rail network and crayon.
Separation between through- and terminating lines
Through-running systems vary in how much track sharing there is with the rest of the mainline rail network. As far as I can tell, there is always some; near-complete separation is provided on the RER A, but its Cergy branch also hosts Transilien trains running to Gare Saint-Lazare at rush hour, and the Berlin and Hamburg S-Bahn systems have very little track-sharing as well. Other systems have more extensive track sharing, including Thameslink, the RER C and D, and the Zurich S-Bahn; the RER E and the Munich S-Bahn are intermediate in level of separation between those two poles.
It is remarkable that, while the RER A, B, and E all feature new underground terminals for dedicated lines, the situation of the RER C and D is different. The RER C uses the preexisting Gare d’Austerlitz, and has taken over every commuter line in its network; the through-connection between Gare d’Orsay and Gare d’Invalides involved reconstructing the stations, but then everything was connected to it. The RER D uses prebuilt underground stations at Gare du Nord, Les Halles, and Gare de Lyon, but then takes over nearly all lines in the Gare de Lyon network, with the outermost station, Malesherbes, not even located in Ile-de-France. Thameslink uses through-infrastructure built in the 1860s and runs as far as Petersborough, 123 km from King’s Cross on the East Coast Main Line, and Brighton, the terminus of its line, 81 km from London Bridge.
And yet, the report’s authors seem convinced the only way to do through-running is with a handful of branches providing only local service, running to new platforms built separately from the intercity terminal; they’re even under the impression the RER D is like this, which it is not. There’s even a map on p. 45, suggesting a regional metro system running as far as Hicksville, Long Beach, Far Rockaway, JFK via the Rockaway Cutoff and Queenslink, Port Washington, Port Chester, Hackensack, Paterson, Summit, Plainfield, New Brunswick, and the Amboys. This is a severe misunderstanding of how such systems work: they do not arbitrarily slice lines this way into inner and outer zones, unless there is a large mismatch in demand, and then they often just cut the outer end to a shuttle with a forced transfer, as is the case for some branches in suburban Berlin connecting to S-Bahn outer ends. Among the above-mentioned outer ends, the only one where this exception holds is Summit, where the Gladstone Branch could be cut to a shuttle or to trains only running to Hoboken – but then trains on the main line to Morristown and Dover have no reason to be treated differently from trains to Summit.
Were the report’s authors more informed about just the specific lines they look at on p. 41, let alone the broader systems, they’d know that separation between inner and outer services is contingent on specifics of track infrastructure, including whether there are four-track lines with neat separation into terminating express trains and through locals. But even if the answer is yes, as at Gare de Lyon and Gare d’Austerlitz, infrastructure planners will attempt to shoehorn whatever they can into the system, just starting from the more important inner lines, which generate more all-day demand. There don’t even need to be terminating regional trains; the Austerlitz system doesn’t, and the Gare de Lyon and Gare de l’Est systems only do due to trunk capacity limitations. In that case, they’d recognize that there is no need to have two commuter rail systems, one through-running and one not. Penn Station’s infrastructure already lends itself to allowing through-running on anything entering via the existing North River Tunnels.
Branching
S-Bahn systems usually try to keep the branch-to-trunk ratio to a manageable number. Usually, more metro-like systems have fewer branches: Crossrail has two on each side, the RER A has two to the east and three to the west, the Berlin Stadtbahn has two to the west plus short-turns and five to the east, the Berlin North-South Tunnel has three on each side. The Munich S-Bahn has five to the east and nine to the west, and the combined RER B and D system has three to the north and five to the south, but the latter has more service patterns, including local and express trains on the branches. Zurich has so much interlining that it’s not useful to count branches, and better to count services: there are 21 S-numbered routes serving Hauptbahnhof, of which 13 run through one of the two tunnels, as do some intercity trains.
If there are too many branches, then they’re usually organized as sub-branches – for example, Munich has seven numbered routes through the central tunnel, of which two have two sub-branches each splitting far out. Zurich has fewer than 13 branches on each side, but rather there are several services using each line, with inconsistent through-pairing – for example, the three services going to the airport, S2, S24, and S16, respectively run through to two separate branches of the Left Bank Line and to the Right Bank Line.
The table on p. 41 gets the branch count mildly wrong, but the significant is less in what it gets wrong about Europe and more in what it gets wrong about New York. A post-Gateway service plan is one in which New Jersey has 12 branches, but some can be viewed as sub-branches (like Gladstone and the Morristown Line), and more to the point, there are going to be two trunk lines. The current plan at New Jersey Transit is to assign the Northeast Corridor and North Jersey Coast Lines to the North River Tunnels alongside Amtrak, which is technically two branches but realistically four or even five service patterns, and the Morris and Essex, Montclair-Boonton, and Raritan Valley Lines to Gateway, which is four branches but could even be pruned to three with M&E divided into two sub-branches. The Erie lines have no way of getting to Penn Station today; to get them there requires the construction of the Bergen Loop at Secaucus, with an estimated budget of $1.3 billion in 2020, comparable to the total cost of all yet-unfunded required surface improvements in New Jersey for non-Erie service combined.
If the study authors were more comfortably knowledgeable of European S-Bahn systems, they’d know that multi-line systems, while uncommon, do exist, and divide branches in a similar way. The multiline systems (Paris, Madrid, Berlin, Zurich, and London) all have some reverse-branching, in a similar manner to how New York is soon going to have the New Haven Line reverse-branch to Penn Station and Grand Central. The NJT plan is solid and stands to lead to a manageable branch-to-trunk ratio, even with every single line going to Penn Station via the existing tunnel running through.
The consequence of the errors
The lack of familiarity with through-running commuter rail is evident in how the report talks about this technology. It is intimately related to the fact that the way investment should be done is different from what American railroaders are used to. For one, there needs to be much tighter integration between infrastructure and scheduling. For two, the scheduling needs to be massively simplified, with fewer operating patterns per line – usually one, occasionally two, never 13 as on the New Haven Line today. The same ignorance that leads Amtrak and its consultants to assert that the S-Bahn runs on headway management rather than a fixed timetable also leads them not to even know how through-running commuter rail networks plan out their routes and services.
From my position of greater familiarity as both a regular user and a researcher, I can point out that the required investments to make through-running happen in New York are entirely in line with the cheap surface projects done in the comparison cases. New rolling stock is required, with the ability to run on the different voltages of the three networks – but multi-voltage commuter rolling stock is the norm wherever multiple legacy electrification systems coexist, including Paris, London, and Hamburg. Some extensions of electrification and high platform conversions are required – but these are not expensive, and the latter is already partly funded at reasonable unit costs. Some rail-on-rail grade separations are required – but those are already costed and very likely to be funded, potentially out of the Bipartisan Infrastructure Law.
Penn Station would be used as the universal station in this schema, without the separation into a surface terminal and a through- underground station seen in Munich and Paris. But then, Paris and Munich don’t even universally have this separation themselves; Ostbahnhof was reconstructed for the S-Bahn but is still a single station, and the same is true of the RER C. In a way, Penn Station already is the underground through-station, built generations before the modern S-Bahn concept, complementing and largely replacing surface terminals like Hoboken and Long Island City because those are not in Manhattan.
None of this is hard; the hard part is the Gateway tunnel and that’s already fully funded and under construction. But it does require understanding that the United States is so many decades behind best practices that none of what American railroaders think they know is at all relevant. It’s obligatory to understand how the systems that work, in Europe and rich Asia, do, because otherwise, it’s like expecting someone who has never learned to count beyond 10 to prove mathematical theorems. The people who wrote this report clearly don’t have this understanding, and don’t care to get it, which is why what they write is not worth the electrons that make up the PDF.
Quick Note on Capital City Income Premiums
There’s a report by Sam Bowman, Samuel Hughes, and Ben Southwood, called Foundations, about flagging British growth, blaming among other things high construction costs for infrastructure and low housing production. The reaction on Bluesky seems uniformly negative, for reasons that I don’t think are fair (much of it boils to distaste for YIMBYism). I don’t want to address the construction cost parts of it for now, since it’s always more complicated and we do want to write a full case on London for the Transit Costs Project soon, but I do want to say something about the point about YIMBYism: dominant capitals and other rich cities (such as Munich or New York) have notable wage premiums over the rest of the country, but this seems to be the case in NIMBY environments more than in YIMBY ones. In fact, in South Korea and Japan, the premium seems rather low: the dominant capital attracts more domestic migration and becomes larger, but is not much richer than the rest of the country.
The data
In South Korea and Japan, what I have is Wikipedia’s lists of GDP per capita by province or prefecture. The capital city’s entire metro area is used throughout, comprising Seoul, Incheon, and Gyeonggi in Korea, and Tokyo, Kanagawa, Chiba, and Saitama in Japan. In South Korea, the capital region includes 52.5% of GDP and 50.3% of population, for a GDP per capita premium of 4.4% over the country writ large, and (since half the country is metro Seoul) 9.2% over the rest of the country. In Japan, on OECD numbers, the capital region, labeled as Southern Kanto, has a 14.5% premium over the entire country, rising to around 19% over the rest of the country.
In contrast, in France, Ile-de-France’s premium from the same OECD data is 63% over France, rising to about 90% over provincial France. In the UK, London’s premium is 71% over the entire country and 92% over the entire country excluding itself; if we throw in South East England into the mix, the combined region has a premium of 38% over the entire country, and 62% over the entire country excluding itself.
Now, GDP is not the best measure for this. It’s sensitive to commute volumes and the locations of corporate headquarters, for one. That said, British, French, Korean and Japanese firms all seem to prefer locating firms in their capitals: Tokyo and Seoul are in the top five in Fortune 500 headquarters (together with New York, Shanghai, and Beijing), and London and Paris are tied for sixth, with one company short of #5. Moreover, the metro area definitions are fairly loose – there’s still some long-range commuting from Ibaraki to Tokyo or from Oise to Paris, but the latter is too small a volume to materially change the conclusion regarding the GDP per capita premium. Per capita income would be better, but I can only find it for Europe and the United States (look for per capita net earnings for the comparable statistic to Eurostat’s primary balance), not East Asia; with per capita income, the Ile-de-France premium shrinks to 45%, while that of Upper Bavaria over Germany is 39%, not much lower, certainly nothing like the East Asian cases.
Inequality
Among the five countries discussed above – Japan, Korea, the UK, Germany, France – the level of place-independent inequality does not follow the same picture at all. The LIS has numbers for disposable income, and Japan and Korea both turn out slightly more unequal than the other three. Of course, the statistics in the above section are not about disposable income, so it’s better to look at market income inequality; there, Korea is indeed far more equal than the others, having faced so much capital destruction in the wars that it lacks the entrenched capital income of the others – but Japan has almost the same market income inequality as the three European examples (which, in turn, are nearly even with the US – the difference with the US is almost entirely redistribution).
So it does not follow, at least not at first pass, that YIMBYism reduces overall inequality. It can be argued that it does and Japan and South Korea have other mechanisms that increase market income inequality, such as weaker sectoral collective bargaining than in France and Germany; then again, the Japanese salaryman system keeps managers’ wages lower than in the US and UK and so should if anything produce lower market income inequality (which it does, but only by about three Gini points). But fundamentally, this should be viewed as an inequality-neutral policy.
Discussion
What aggressive construction of housing in and around the capital does appear to do is permit poor people to move to or stay in the capital. European (and American) NIMBYism creates spatial stratification: the middle class in the capital, the working class far away unless it is necessary for it to serve the middle class locally. Japanese and Korean YIMBYism eliminate this stratification: the working class keeps moving to (poor parts of) the capital region.
What it does, at macro level, is increase efficiency. It’s not obvious to see this, since neither Japan nor Korea is a particularly high-productivity economy; then again, the salaryman system, reminiscent of the US before the 1980s, has long been recognized as a drag on innovation, so YIMBYism in effect countermands to some extent the problems produced by a dead-end corporate culture. It also reduces interregional inequality, but this needs to be seen less as more opportunity for Northern England as a region and more as the working class of Northern England as people moving to become the working class of London and getting some higher wages while also producing higher value for the middle class so that inequality doesn’t change.
More on American Incuriosity, New York Regional Rail Edition, Part 2: Station Dwell Times
This is the second part of my series about the Regional Plan Association event about expanding capacity at Penn Station. Much of the presentation, at least in its first half, betrays wanton ignorance, with which area power brokers derive their belief that it is necessary to dig up an entire block south of Penn Station to add more station tracks, at a cost of $16.7 billion; one railroad source called the people insisting on Penn Expansion “hostage takers.” The first part covered casual ignorance about the history of commuter rail through-running in Europe, including cities that appear in the presentation. This part goes over the core claim made in the presentation regarding how fast trains can enter and exit Penn Station. More broadly, it goes over a core claim made in the source the presentation uses to derive its conclusion, a yet-unreleased consultant report detailing just how much space each train needs at Penn Station, getting it wrong by a factor of 5-10.
The issue is about the minimum time a train needs to berth at a station, called the dwell time. Dwell times vary by train type, service type, and peak traffic. Subways and nearly all commuter trains can keep to a dwell time of 30 seconds, with very few exceptions. City center stations like Penn Station are these exceptions; the RER and the Zurich S-Bahn both struggle with city center dwell times. The Berlin S-Bahn does not, but this is an artifact of Berlin’s atypically platykurtic job density, which isn’t reproducible in any American city. That said, even with very high turnover of passengers at central train stations, the dwell time is still usually measured in tens of seconds, and not minutes. In the limiting case, an American commuter train should be able to dump its entire load of passengers at one station in around two minutes.
The common belief among New York-area railroads is that Penn Station requires very long dwell times. This is not made explicit in the presentation; Foster Nichols’ otherwise sober part of the presentation alludes to “varying dwell times” on pp. 23 and 26, but documents produced by the railroads about their own perceived needs go back years and state precise times; for through-running, it was agreed that the dwell times would be set at 12 minutes in the Tri-Venture Council comprising Amtrak, the LIRR, and New Jersey Transit. The consultant report I reference below even thinks it takes 16 minutes. In truth, the number is closer to 2-3 minutes, and investments that would precede Penn Expansion, like Penn Reconstruction, would be guaranteed to reduce it below 2 minutes.
Dwell times in practice
Before going into what dwell times should be, it is important to sanity-check everything by looking at dwell times as they are. It is fortunate that examples of short dwell times abound.
As mentioned in my previous post, I have just returned from a trip to Brussels and London. My train going out of Berlin was late, so at Hauptbahnhof, the dwell time was just three minutes. The train, which had departed Ostbahnhof almost empty, filled almost to seated capacity at Hauptbahnhof, where there is no level boarding. DB routinely turns trains in four minutes at terminal stations that are located mid-line, like Frankfurt and Leipzig, but this time I observed such dwells at a station with almost complete seat turnover. In Japan, where there is level boarding and two door pairs per car rather than one, the dwell times on the Nozomi are a minute, even at Shin-Osaka, where through-trains transition from JR Central to JR West operation.
On commuter rail, dwell times are shorter, even though the trains are much more crowded at rush hour. The reason is a combination of higher toleration for standees, and higher toleration of mistakes – if passengers get on the wrong train or miss their stop, they will get off at the next stop in a few minutes rather than ending up in the wrong city.
As mentioned in the introduction, Penn Station is a limiting case on commuter rail, since it’s the only station in Manhattan for any possible through-trains today; a future tunnel to Grand Central, studied over 20 years ago as Alternative G and recurrently proposed since in various forms (for example, in the ETA writeup, or in this post of mine from last year), would still leave trains that use the preexisting North River Tunnels running through the East River Tunnels and not making a second Manhattan stop. Thus, the best comparison cases need to be themselves limiting cases, as far as possible.
For this, we need to go to Paris, especially its busiest lines, the RER A and B. The RER B has two central stations: Gare du Nord, Les Halles; Gare du Nord isn’t really in the central business district, but is such a large travel hub that its RER and Métro traffic levels are the highest in both systems. The theoretical dwell time (“stationnement”) is 30 seconds on the RER. In practice, at rush hour, it’s higher – but it’s still measured in tens of seconds. In the 2000s, the RER B reached 70-80 second dwell times at Gare du Nord at peak, before new work reduced the average to 55 seconds. I timed dwell times while living in Paris and riding the RER B regularly to IHES, and at rush hour, the two central stations and Saint-Michel-Notre-Dame were usually 50-60 seconds. This is optimized through signaling as well as wide platforms and single-level trains with four door pairs per car, though the internal configuration of the corridor of the RER B rolling stock still leaves something to be desired, especially if there are passengers with luggage (which there often are, as the line serves CDG Airport).
The RER A has four central business district stations: Les Halles, Auber, Etoile, La Défense; a fifth station, Gare de Lyon, is like Gare du Nord a transport hub with very high originating ridership. A report from the early 2010s lamenting that the theoretical throughput of 30 trains per hour was not achieved in practice blames a host of factors, including high dwell times due to traffic, reaching 50 seconds in the central section. The RER A rolling stock is bilevel with three triple-wide door pairs per car, and for a bilevel its internal circulation is good, but it’s still a bilevel train, and getting through a crowded rush hour car to disembark takes a lot of shuffling.
Is Paris a good comparison case?
Yes.
Part 1 of this series goes over the history of the RER, and points out that in 2019, the RER A had 1.4 million weekday trips, and the RER B 983,000. This compares with a combined LIRR and New Jersey Transit ridership of about 600,000 per weekday. About 67% of LIRR ridership is at rush hour; on SNCF-operated Transilien and RER lines, at the suburban stations, the figure is 46%, and my suspicion is that the RER B is somewhat lower than Transilien.
The higher peakiness in New York evens things up somewhat. But even then, peak hourly traffic into Penn Station from New Jersey was 27,223 passengers in 2019, per the Hub Bound report (Appendix III, Section C), and peak hourly traffic from the four-track East River Tunnels was 33,530; in contrast, the RER A’s peak hourly traffic last decade was 50,000.
Now, Paris does have multiple central stations, whereas there is only one in Manhattan on the LIRR and NJ Transit. That said, this only evens things up. My table on this only includes the SNCF-operated portion, and only includes boardings at a resolution of four hours, not one hour; thus, all central RER A stations are missing. From the table, we get the following maximum boarding counts between 4 and 8 pm and between 6 and 10 am on a work day:
| Station | Line | Trains/hour | Boardings (pm) | Boardings (am) |
| Penn Station | LIRR | 37 | 73,430 | 4,920 |
| Penn Station | NJ Transit | 20 | 56,664 | 7,838 |
| Gare du Nord | RER B (both directions) | 20 | 48,989 | 54,137 |
| Gare du Nord | RER D (both directions) | 12 | 34,512 | 28,073 |
| Châtelet-Les Halles | RER D (both directions) | 12 | 28,586 | 6,877 |
| Gare de Lyon | RER D (both directions) | 12 | 49,392 | 17,158 |
| Haussmann-Saint Lazare | RER E | 16 | 45,383 | 10,719 |
The numbers represent single-line trips, so people transferring cross-platform between the RER B and D at Gare du Nord count as boardings. The reason for including both morning and afternoon peak traffic is that afternoon boardings are largely symmetric with morning alightings and vice versa, and so the sum represents total on and off traffic on the train at the peak.
Peak traffic per train in a single direction occurs at Saint-Lazare on the RER E, which only began through-running in May of this year; the counts are from the mid-2010s, when the station was a four-track underground terminal. At the through-stations, total ons and offs per rush hour train are slightly lower than at Penn Station on NJ Transit and slightly higher than on the LIRR. Even taking into account that at Penn Station, 40% of the peak four hour traffic is at the peak hour, and the proportion should be somewhat smaller in Paris, the difference cannot be large. If Gare du Nord can support 60 second dwell times, Penn Station can support dwell times that are not much higher, at least as far as the train-platform interface is concerned.
Gantt charts
A yet unreleased consultant report for the Penn Station Capacity Improvement Project (PCIP) details the tasks that need to be done for a through-running train at Penn Station. This is shown as a pair of Gantt charts, both for a future baseline, the second one assuming dropback crews and station scheduling guaranteeing that trains do not berth on two tracks facing the same platform at the same time. All of this is extravagant and unnecessary, and could not be done by people who are familiar with best practices in Europe or Japan.
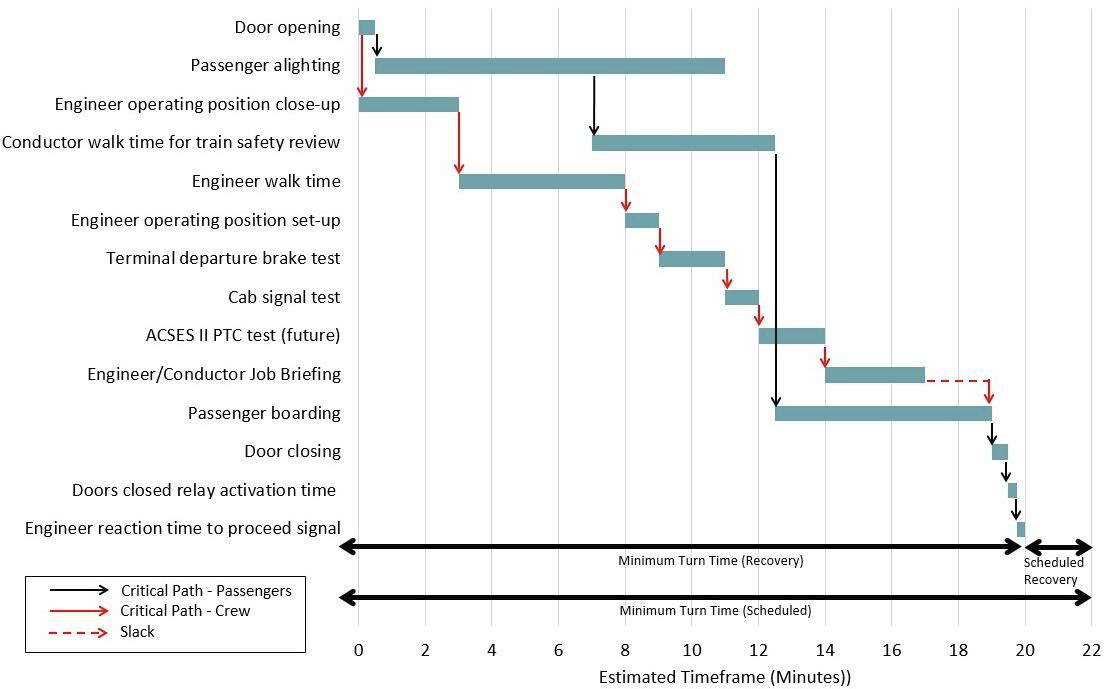

This is said to be turn time in the chart and dwell time in the description. But the limiting factor is the passenger path and not the crew path, and for that, it doesn’t matter if a train from New Jersey then goes to Long Island or Stamford and a train from Long Island or Stamford goes to New Jersey or if it’s the other way around.
To be clear, 16 minutes is insanely long as an unpadded turn time, let alone a through-dwell time. The MBTA can do it in 10; I think so can Metro-North at the outer ends. ICE trains turn in four minutes at pinch points like Frankfurt Hauptbahnhof, with extensive rail passenger turnover. So let’s go over how to get from 16 down to a more reasonable number.
Passenger alighting
Alighting does not take 6.5 minutes at Penn Station, even at rush hour, even on trains that are configured for maximum seats rather than fast egress. The limiting factor is not the train doors – the RER D runs bilevels with two door pairs per car and narrow passageways, and would not be too out of place on NJ Transit. Rather, it’s the narrow platforms, which have fewer egress points than they should and poor sight lines. This was studied for the Moynihan Station project, which opened in 2021. The project added new staircases and escalators, and now the minimum clearance time is at most 2.03 minutes, on platform 9, followed by 2.02 minutes on platforms 4 and 5. The expected clearance time, taking into account that passengers prefer to exit near the 7th Avenue end but the egress points are not weighted toward that end, peaks at 4.83 minutes on platform 4 – but passengers can walk along the platform while the train is moving, just as they do on the subway or on the RER.
What’s more, Penn Reconstruction, a project that may or may not happen, but that is sequentially prior to the Penn Expansion project that the slide deck is trying to sell, is required to install additional vertical circulation at all platforms, to reduce the egress times below 2 minutes even in emergency conditions (one escalator out). This is because NFPA 130 requires evacuation in 4 minutes assuming every track that can be occupied is, which given timetabling constraints means both tracks facing each platform other than the single-track platform 9. Responding to Christine Berthet’s questions about through-running, the agency even said that Penn Reconstruction is going to bring all platforms into compliance, but still said dwell times would need to be 8 minutes.
Passenger boarding
Alighting and boarding peak at different times of day. As the above table shows, reverse-peak traffic at Penn Station is only 12% of the combined peak and reverse-peak traffic on NJ Transit, and only 6% on the LIRR. In any circumstance in which the alighting time needs to be stretched to the maximum (again, only somewhat more than 2 minutes), the boarding time can be set at 30 seconds, and vice versa.
Moreover, because the access points to the platforms include escalators, not all running in the peak direction, and not just staircases, reverse-peak traffic consumes capacity that is otherwise wasted. Even the 30 seconds for additional boarding time in the morning rush are generous.
Conductor walk time for safety review
This is not done in Europe. Conductors’ safety review comprises checking whether passengers are stuck in the gap between the platform and the train, which is done after boarding, and takes seconds rather than minutes, using CCTV if the sight lines are obstructed.
Door opening and closing
These do not take 30 seconds each; the total amount of time is in the single digits.
Engineer operating position set-up, and engineer/conductor job briefing
Crews switch out in 1-2 minutes at boundaries between train operating companies in Paris and Shin-Osaka. The RER B is operated by SNCF north of Gare du Nord and by RATP south of it, and they used to switch crews there – and the operating position had to be changed, since the two companies’ engineers preferred different setups, one preferring to sit and the other to stand. It took until the early 2010s to run crews through, and even then it took a few years to unify the line’s dispatching. It does not take 3 minutes to brief the engineer on the job.
Total combined time
On a through-train, using alighting times in line with the current infrastructure at Penn Station, the minimum dwell time is 2-3 minutes, provided trains can be timetabled so that no two tracks facing the same platform have a train present at the same time. If there are four through-platforms, then commuter trains can run every 5 minutes to each platform, which is borderline from the perspective of egress capacity at 7th Avenue but does work.
Intercity trains make this easier to timetable: they have lower maximum capacity unless standing tickets are sold, which they currently are not, and even if Amtrak runs 16-car EMUs, they’ll still have fewer seats than there are seats plus standing spaces on a 10-car NJ Transit train, and not all of them turn over at Penn Station. Potentially, platform 6 can be dedicated to intercity trains in both directions, and then platforms 4 and 5 can run eastbound, alternating, and platforms 7 and 8 can run westbound. Using the timetable string diagram here, the local NJ Transit trains on the Northeast Corridor would have to share a platform, running every 5 minutes, while the express trains can get a dedicated platform running every 10; the local trains are likely to be less crowded and also have more through-passengers, first because usually through-service is more popular in inner suburbs than in outer ones, and second because the likely pairing in our Northeast Corridor plan connects those trains to Long Island City and Flushing while the express trains awkwardly turn into local Metro-North trains to Stamford.
Note that intercity trains can be scheduled to dwell for just 2-3 minutes too, and not just commuter trains. That’s actually longer than Shinkansen express dwell times (involving a crew change at Shin-Osaka), and in line with what I’ve seen with full turnover in Berlin. The Avelia Liberty has better circulation than the ICE 3, since it has level boarding, and any future trainset can be procured with two door pairs per car, like the Velaro Novo or Shinkansen, rather than just one, if dwell times are a concern.
The incuriosity of consultant-driven projects
I spoke to some of the people involved about my problems with the presentation, and got very good questions. One of them pointed out that I am talking about two- and three-minute dwell times in big European cities, and asked, how come experienced international consultants like Arup and LTK, which prepared the Gantt chart above, don’t know this? What’s missing here?
This is a question I’ve had to face with the construction cost comparisons before, and the answer is the same: consultants are familiar with projects that use consultants. Anglo consultants like Jacobs, AECOM, Arup, and WSP have extensive international experience, with the sort of projects that bring in international consulting firms to supervise the designs. The bigger Continental European and East Asian countries have enough in-house engineering expertise that they don’t really bring them in.
This can be readily seen in two ways. First, getting any detailed information about rail projects in France and Germany requires reading the local language. Practically nothing gets translated into English. I almost exclusively use French sources when writing about the RER, which can be readily seen in this post and in part 1. My German is a lot less fluent than my French, but here too I have to rely on reading technical German to be able to say anything about the Berlin or Munich S-Bahn or the ICE at greater depth than English Wikipedia (for one example, compare English and German on switches). A lot of the information isn’t even online and is in railfan books and magazines. This is not an especially globalized industry, and a consultancy that works in English will just not see things that are common knowledge to the experts in France or Germany, let alone Japan.
And second, the few Continental European projects that are more globalized turn into small reference pools for American agencies looking to compare themselves to others. Woody Allen portrays a Barcelona with the works of the only architect his American audience will have heard of. The MTA compares its per-rider costs to those of the not-fully-open Barcelona Metro L9/10, MassDOT uses L9/10 to benchmark the North-South Rail Link (again with the wrong denominator), and VTA uses L9/10 as a crutch with which to justify its decision to build a single-bore San Jose subway. L9/10 is an atypically large project, and atypically expensive for Spain; it also, uniquely, uses more privatization of planning than is the norm in Spain, including design-build project delivery, whence the line from the one of the consultants I’ve had to deal with in the US, “The standard approach to construction in most of Europe outside Russia is design-build” (design-build to a good approximation does not exist in Germany, Spain except L9/10, or Italy, and is uncommon in France and done with less privatization of expertise than in the US).
To take these two points together, then, the elements of foreign systems that are likeliest to be familiar to either American railroaders or English-primary consultants are the biggest and flashiest ones. This can even include elements that are not consultant-driven, if they’re so out there that they can’t be missed, like a high-speed rail network: rail consultants know the TGV exists, even if they’re not as familiar with how SNCF goes around planning and building lines, and can sometimes imitate design standards. Commuter rail infrastructure that’s similarly flashy gets noticed, so the presentation mentions the RER and Munich S-Bahn, even while getting their histories wrong and fixating on the new station caverns that even a tourist on a short trip can notice.
Commuter rail operations are not flashy. The map of RER or S-Bahn lines is neat, which is why rail activists talk about through-running so much – it’s right there posted at every station and on every railcar. But the speed at which people get on and off the train is not as obvious, and it requires looking into detailed reports to do an even rudimentary comparison, none of which in the case of Paris is available in English or easy to find on Google (the word “stationnement” usually means “parking,” in the same manner that the word “dwell” usually means “to live in a place”).
The upshot is that consultant reports written by serious people who absorb the knowledge of the railroaders of the Northeastern US with some British sanity checks can still say things that are so wrong to make the entire report useless. The same process that produces the whopper that the Munich S-Bahn, built 1965-72, took 46 years to build, can produce a Gantt chart that has a combined boarding and alighting time with conductor check that’s more than five times longer than what Penn Station in its current configuration is capable of and more than 10 times longer than what Gare du Nord achieves with similar peak ridership. Based on this false belief regarding dwell times, the agencies are then convinced that through-running is difficult and, separately, many additional tracks at Penn Station are required to fully use the capacity of the under-construction Gateway tunnel, building which would waste $16.7 billion.
Project 2025 and Public Transportation
The Republican Party’s Project 2025, outlining its governing agenda if it wins the election later this year, has been in the news lately, and I’ve wanted to poke around what it has to say about transportation policy, which hasn’t been covered in generalist news, unlike bigger issues. The answer is that, on public transportation at least, it doesn’t say much, and what it does say seems confused. The blogger Libertarian Developmentalism is more positive about it than I am but does point out that it seems to be written by people who don’t use public transit and therefore treat it as an afterthought – not so much as a negative thing to be defunded in favor of cars, but just as not a priority. What I’m seeing in the two pages the 922-page Project 2025 devotes to public transit is that the author of the transportation section, Diana Furchtgott-Roth, clearly read some interesting critiques but then applies them in a way that shows she didn’t really understand them, and in particular, the proposed solutions are completely unrelated to the problems she diagnoses.
What’s not in the report?
Project 2025 is notable not in what it says about public transit, but in what it doesn’t say. As I said in the lede, the 922-page Project 2025 only devotes slightly less than two pages to public transportation, starting from printed page 634. The next slightly more than one page is devoted to railroads, and doesn’t say anything beyond letting safety inspections be more automated with little detail. Additional general points about transportation that also apply to transit can be found on page 621 about grants to states and pp. 623-4 extolling the benefits of public-private partnerships (PPPs, or P3s). To my surprise, the word “Amtrak,” long a Republican privatization target, appears nowhere in the document.
There are no explicit funding cuts proposed. There are complaints that American transit systems need subsidies and that their post-pandemic ridership recovery has not been great. There is one concrete proposal, to stop using a portion of the federal gas tax revenue to pay for public transit, but then it’s not a proposal to use the money to fund roads instead in context of the rest of the transportation section. The current federal formula is that funds to roads and public transit are given in an 80:20 ratio between the two modes, which has long been the subject of complaints among both transit activists and anti-transit activists, and Project 2025 not only doesn’t side with the latter but also doesn’t even mention the formula or the possibility of changing it.
The love for P3s is just bad infrastructure construction; the analysis speaks highly of privatization of risk, which has turned entire parts of the world incapable of building anything. (Libertarian Developmentalism has specific criticism of that point.) But the section stops short of prescribing P3s or other mechanisms of privatization of risk. In this sense, it’s better than what I’ve heard from some apolitical career civil servants at DOT. In contrast, the Penn Station Reconstruction agreement among the agencies using the station explicitly states that the project must use an alternative procurement mechanism such as design-build, construction manager/general contractor, or progressive-design-build (which is what most of the world calls design-build), of which the last is illegal in New York but unfortunately there are attempts to legalize it. This way, Project 2025’s loose support for privatization of planning is significantly better than the actual privatization of planning seen in New York, ensuring it will stay incapable of building infrastructure.
This aspect of saying very little is not general to Project 2025, I don’t think. I picked a randomly-selected page, printed p. 346, which concerns education. There’s a title, “advance school choice policies,” which comprises a few paragraphs, but these clearly state what the party wants, which is to increase funding for school vouchers in Washington D.C., expanding the current program. Above that title is a title “protect parental rights in policy,” which is exclusively about opposing the rights of transgender children not to tell their parents they’re socially transitioning at school.
Okay, so what does Project 2025 say?
The public transit section of the report, as mentioned above, has little prescription, and instead complains about transit ridership. What it says is not even always true, regarding modal comparisons. For one, it gets the statistical definition of public transit in the United States wrong. Here is Project 2025 on how public transit is defined:
New micromobility solutions, ridesharing, and a possible future that includes autonomous vehicles mean that mobility options—particularly in urban areas—can alter the nature of public transit, making it more affordable and flexible for Americans. Unfortunately, DOT now defines public transit only as transit provided by municipal governments. This means that when individuals change their commutes from urban buses to rideshare or electric scooter, the use of public transit decreases. A better definition for public transit (which also would require congressional legislation) would be transit provided for the public rather than transit provided by a public municipality.
Leaving aside that the biggest public-sector transit agencies in the US are not municipal but state-run or occasionally county-run (in Los Angeles), the definition of public transit in federal statistics and funding is exactly what Project 2025 wants. There are private transit operators; the biggest single grouping is privately-operated buses in New Jersey running into Manhattan via the Lincoln Tunnel. These buses count as public transit in census commuting statistics; they have access to publicly-funded transit-only infrastructure including the Lincoln Tunnel’s peak-only Express Bus Lane (XBL) and Port Authority Bus Terminal.
What’s true is that rideshare vehicles aren’t counted as transit, but as taxis. Larger vanshare systems could count as public transit; the flashiest ones, like last decade’s Bridj in Boston and Chariot in San Francisco, were providing public transit privately, but went to great lengths to insist that they were doing something different.
Other complaints include waste, but as with the rest of this section, there isn’t a lot of detail. Project 2025 complains about the Capital Investment Grants (CIG) program, saying it leads to waste, but it treats canceling it as unrealistic and instead says “a new conservative Administration should ensure that each CIG project meets sound economic standards and a rigorous cost-benefit analysis.” In theory, I could read it as a demand that the FTA should demand benefit-cost analyses as a precondition of funding; current federal practices do not do so, and to an extent this can be blamed on changes in the early Obama administration. But the FTA is not even mentioned in this section, nor is there a specific complaint that American transit projects are federally funded based on vibes more than on benefit-cost analysis.
The two main asks as far as transit is concerned are about labor and grants to states.
On labor, the analysis is solid, and I can tell that the Project 2025 authors read some blue state right-wing thinktanks that do interface with the problems of transit agencies. Project 2025 correctly notes that transit worker compensation is driven by high fringe benefits and pensions but not wages; it’s loath to say “wages are well below competitive levels” but it does say “transit agencies have high compensation costs yet are struggling to attract workers.” So far, so good.
And then the prescribed solution, the only specific in the section, is to reinterpret a section of the Urban Mass Transportation Act of 1964 to permit transit agencies to reduce overall compensation, which is currently illegal. As a solution, it is unhinged: transit agencies are having trouble finding qualified hires, so reducing compensation is only going to make these problems worse. It doesn’t follow at all from Project 2025’s own analysis; what would follow is that agencies should shift compensation from benefits to cash pay, but that’s already legal, and at no point does Project 2025 say “we recommend that agencies shift to paying workers in cash and will legally and politically back agencies that do so against labor wishes,” perhaps with a mention that the Conservatives in the United Kingdom gave such support to rail operators to facilitate getting rid of conductors. There’s no mention of the problems of the seniority system. Furchtgott-Roth used to work at the Manhattan Institute, which talks about way more specific issues including backing management against labor during industrial disputes and how one could cut pensions, but this is nowhere in the report.
On grants to states, Project 2025 is on more solid grounds. It proposes on p. 621 that federal funding should be given to states by formula, to distribute as they see fit:
If funding must be federal, it would be more efficient for the U.S. Congress to send transportation grants to each of the 50 states and allow each state to purchase the transportation services that it thinks are best. Such an approach would enable states to prioritize different types of transportation according to the needs of their citizens. States that rely more on automotive transportation, for example, could use their funding to meet those needs.
American transit activists are going to hate this, because, as in Germany and perhaps everywhere else, they disproportionately use the public transit that most people don’t use. On pre-corona numbers, around 40% of transit commuters in the United States live in metropolitan New York, but among the activists, the New York share looks much lower than 40% – it’s lower than that in my social circle of American transit activists, and I lived in New York five years and founded a New York advocacy group. The advocates I know in Texas and Kentucky and Ohio are aware of their states’ problems and want ridership to be higher, but, at the end of the day, American transit ridership is not driven by these states. Texas is especially unfortunate in how, beyond Houston’s original Main Street light rail line, its investments have not been very good. Direct grants to states are likely going to defund such projects in the future, but such projects are invisible in overall US transit usage, unfortunately.
In the core states to US transit usage – New York, New Jersey, California, Massachusetts, Illinois, Washington, Pennsylvania – the outcome of such change would be to replace bad federal-state interactions with bad state politics. But then, to the extent that there’s a theme to the problems of Project 2025 beyond “they aren’t saying much,” it’s that it’s uninterested in solving competent governance problems in blue states, and essentially all of American public transit ridership today is about the poor quality of blue state governance.
What does this mean?
I’ve seen criticism of Project 2025 on left-wing social media (that is, Bluesky and Mastodon) that portrays it as evil. I haven’t read the document except for the transportation section and the aforementioned randomly-selected pair of pages, so I can’t judge fully, but on public transit, I’m not seeing any of this. I’m not seeing any clear defunding calls. I’m seeing a reference to anti-transit advocate Robert Poole, the director of transportation policy at Reason, but only on air traffic control; he’s written voluminously (and shoddily) about public transit, but Furchtgott-Roth isn’t referencing any of that.
What I am seeing is total passivity. Maybe it’s specific to Furchtgott-Roth, who I didn’t hear about before, and who just doesn’t seem to get transportation as an issue despite having served as a political appointee at USDOT. Or maybe, as Libertarian Developmentalism points out, it’s that the sort of people who’d write a Republican Party governing program don’t think about public transit very much and therefore resort to catechisms about reducing the role of the federal government and repealing a labor law that isn’t a binding constraint. Occasionally this can land on a proposal that isn’t uniformly bad, like granting money to states rather than projects; more commonly, it leads to misstating what the federal and state governments consider to be public transit. I’m not seeing anything nefarious here, but I am seeing a lot of ignorance and poor thinking about solutions.
Reports on High-Speed Rail and the Northeast Corridor
Two reports that I’ve collaborated on are out now, one about high-speed rail planning for Marron and one about Northeast Corridor maintenance for ETA. A third piece is out, not by me but by Nolan Hicks, about constant-tension catenary and its impact on speed and reliability. The context for the latter two pieces is that the Northeast Corridor has been in a recurrent state of failure in the last three weeks, featuring wire failures, circuit breaker failures, track fires, and transformer fires. The high-speed rail planning piece is of different origin – Eric interviewed officials involved in California High-Speed Rail and other American projects that may or may not happen and this led to synthesizing five planning recommendations, which aren’t really about the Northeast Corridor but should be kept in mind for any plan there as well.
The broader context is that we’re going to release another report specific to the Northeast Corridor, one that’s much more synthetic in the sense of proposing an integrated infrastructure and service planning program to cut trip times to about 1:53 New York-Washington and 2:00 New York-Boston, informed by all of these insights. Nolan’s piece already includes one key piece of information that’s come out of this work, about the benefits of constant-tension catenary upgrades: 1:53 requires constant-tension catenary, and if it is not installed, the trip time is 2:04 instead, making this the single biggest piece of physical infrastructure installation the Northeast Corridor needs.
The catenary issue
Trying to go to Philadelphia, I was treated to a train stuck at Penn Station without air conditioning, until finally, after maybe 45 minutes of announcements by the conductor that it would be a while and they’d make announcements if the train was about to move, I and the other passengers got out to the station, waiting for anything to change, eventually giving up as the train and several subsequent ones were canceled. My post from three days ago about Germany has to be read with this context – while publishing I was waiting for all three pieces above to appear.
I encourage people to read the ETA report for more detail about the catenary. In brief, overhead wires can be tensioned by connecting them to fixed places at intervals along the tracks, which leads to variable tension as the wires expand in the heat and contract in the cold; alternatively, they can be tensioned with spring wires or counterweights, which automatically provide constant tension. The ETA report explains more, with diagrams, some taken from Garry Keenor’s book on rail electrification, some made by Kara Fischer (the one who made the New Mexico public transit maps and others I’ll credit upon request, not the USDOT deputy chief of staff). The catenary on the Northeast Corridor has constant tension north of New York, and for a short stretch in New Jersey, but not on the vast majority of the New York-Washington half of the line.
Variable-tension catenary is generally unreliable in the heat, and is replaced with constant-tension catenary on main lines even in Europe, where the annual temperature range is narrower than in the United States. But it also sets a blanket speed limit; on the Northeast Corridor, it is 135 mph, or 217 km/h – the precision in metric units is because 217 km/h is the limiting speed of a non-tilting train on a curve of radius 1,746 meters, a common radius in the United States as it is a round number in American units (it’s 1°, the degree being the inverse of curve radius). This blanket speed limit slows trains by 11 minutes between New York and Washington, subject to the following assumptions:
- The tracks otherwise permit the maximum possible speed based on curvature, up to 320 km/h; in practice, there are few opportunities to go faster than 300 south of New York. There is an FRA rule with little justification limiting trains to 160 mph, or a little less than 260 km/h, on any shared track; the rule is assumed removed, and if it isn’t, the cost is about one minute.
- Trains have the performance of the Velaro Novo, which trainset is being introduced to the United States with Brightline West. Other trainsets may have slightly better or worse performance; the defective Avelia Liberty sets are capable of tilt and therefore the impact of maximum speed is larger.
- Intercity trains make one stop per state, counting the District of Columbia as a state.
- Intercity and regional trains are timetabled together, on a clockface schedule with few variations. If a train cannot meet these requirements, it stays off the corridor, with a forced transfer at Philadelphia or Washington. All train schedules are uniformly padded by 7%, regardless of the type of catenary. If variable-tension catenary requires more padding, then the impact of constant-tension catenary is increased.
The bulk of the difference between 1:53 and the current trip time of about 2:50 is about timetabling, not infrastructure – when the trains are running smoothly, there is extensive schedule padding, in one case rising to 35 minutes south of New York on a fast Regional. Rolling stock quality provides a boost as well, to both reliability and acceleration rates. Faster speeds on curves even without tilt matter too – American standards on this are too conservative, and on a built-out line like the Northeast Corridor, being able to run with 180 mm of cant and 130 mm of cant deficiency (see explanation here) is valuable. But once the regulatory and organizational issues are fixed, the biggest single piece of infrastructure investment required is constant-tension catenary, simultaneously reducing trip times and improving reliability.
Nolan’s piece goes more into costs for catenary repair, and those are brutal. The Northeast Corridor Project Inventory includes $611 million to just replace the catenary between Newark and New Brunswick, without constant-tension upgrades. This is 36.5 route-km, some four- and some six-track; the $16.7 million/cost electrifies a new line from scratch around six times over in non-English-speaking countries, and while the comparison is mostly to double-track lines, around half the cost of electrification is the substations and transformers, and those aren’t part of the project in New Jersey.
State of Good Repair projects always end up as black holes of money, because if half the money is spent and there’s no visible improvement, it’s easy for Amtrak to demand even more money, without having to show anything for it. An improvement project would be visible in higher speeds, better ride quality, higher reliability, and so on, but this is free money in which the cost is treated as a positive (jobs, the appearance of work, etc.) and not something to be minimized in pursuit of another goal. One conclusion of this is that no money should be given to catenary renewal. Money can be spent on upgrades with visible results, in this case constant-tension catenary. On all else, Amtrak cannot be trusted.
High-speed rail planning
The report we wrote on high-speed rail planning at Marron is longer than the ETA report, but I encourage people to read it as well, especially anyone who wishes to comment here. In brief, we give five broad recommendations, based on a combination of reviewing the literature on high-speed rail, cost overruns, and public infrastructure management, and interviewing American sources in the field.
- The federal government needs to nurture local experimentation and support it with in-house federal expertise, dependable funding, and long-term commitment.
- The FRA or another federal entity should have consistent technical standards to ensure scale and a clear operating environment for contractors.
- The federal government should work with universities to develop the technology further, which in this case means importing standards that work elsewhere – high-speed rail in 2024 is a mature technology, not requiring the inventions of new systems that underlay the Japanese, French, and German networks.
- Agencies building high-speed rail should have good project delivery, following the recommendations we gave in the subway construction costs report. Using consultants is unavoidable, but there needs to be in-house expertise, and agencies should avoid being too reliant on consultants or using consultants to manage other consultants.
- Agencies and states should engage in project planning before environmental reviews and before making the decision whether to build; the use of environmental reviews as a substitute for planning leads to rushed designs, which lead to mistakes that often prove fatal to the project.
Currently, all American high-speed rail plans should be treated as case studies of what to avoid. However, this does not mean that all of them fail on all five criteria. For one, California High-Speed Rail largely used pan-European technical standards in its planning; Caltrain did not in related planning including the electrification project and the associated resignaling (originally intended to be the bespoke CBOSS). The criterion on technical standards becomes more important as different projects interact – for example, Brightline West is inconsistent about what it’s using. Then there’s Texas Central, which uses turnkey Shinkansen standards, but as it’s turned over to Amtrak is bound to get modifications that conflict with what Japan Railways considers essential to the Shinkansen, such as total lack of any infrastructure mixing with legacy trains.
Notably, none of this is about the Northeast Corridor directly. My own interpretation of the report’s recommendations points out to other problems. For example, the Northeast Corridor’s technical standards are consistent but also bad, coming from an unbroken legacy of American railroader traditions whose succors can barely find Germany on a map, let alone bother to learn from it or any other foreign country. This way, the New Haven Line, which with modern trainsets and associated standards has few curves limiting trains to less than 150 km/h, is on a blanket speed limit of 75 mph, or 121 km/h, in Connecticut, with several further slowdowns for curves. There’s long-term planning for the corridor, and it’s bipartisan, but this long-term planning involves agencies that fight turf wars and mostly want to get the others out of what they perceive as their own turfs. There is lush funding, but it goes to the wrong things – Moynihan Train Hall but no improvements at the track level of Penn Station, extensive track renewal at 1.5 orders of magnitude higher cost than in Germany, in-place bridge replacements on curvy track instead of nearby bypasses.
The current planning does use too many consultants – in fact, Penn Reconstruction’s interagency agreement stipulates that they use consultant-centric project delivery methods, with one possibility, progressive design-build (what most of the world calls design-build; what New York calls design-build is different and better), not even legal in New York state law, but the local power brokers are trying to legalize it and break their own construction cost records. But it’s not quite the same as not bothering to develop in-house talent – there is some, and sometimes it isn’t bad, but poor project management and lack of interagency coordination has caused the budgets for the big-ticket items that Amtrak wants to explode beyond anyone’s ability to manage. The five recommendations, applied to the Northeast, mostly speak to the low quality of the existing agencies, rather than to a hodgepodge of standards as is happening at the interface between California High-Speed Rail and Caltrain or Brightline West.
The ultimate problem on the Northeast Corridor is that it is held together with duct tape, by people who do not know how to use more advanced tools than duct tape. They constantly fight fires, sometimes literally, and never ask why fires always erupt when they’re around; it’s not the heat, because the Northeast isn’t any warmer than Japan or South Korea or Italy, and it’s not underinvestment 30+ years ago, because Germany has that history too. Nolan points out the electric traction backlog on the Northeast Corridor grew from less than $100 million in 2018 to $829 million today; the people in charge are substantially the same ones who deferred this much maintenance over the six-year period that included the Bipartisan Infrastructure Law. I didn’t get into this project in order to study other people’s failures again, as we did with the construction costs report. But everything I’m seeing on the Northeast Corridor, even more than in California or Texas, points to what may be the worst intercity rail planning of any even vaguely modern country.
Public Transit Subsidies and Efficiency
A few days ago, Streetsblog covered a new study about the impact of transit subsidies on efficiency. Transportation economics research is skeptical of operating subsidies to public transit, arguing that it incentivizes waste. In contrast, the new study argues, the opposite is the case: systems with more subsidies are more efficient. In reality, this is a bad study – trivially and uninterestingly wrong. The real question of interest is not whether it is saying something – it isn’t – but why it is getting any positive press among transit advocates. The context here is important: non-technical advocates, having given up on building good transit, instead just want more subsidies for operations, as the costs rise (bus service being labor-intensive), with scant interest in outcomes like ridership.
What’s in the study?
The study, by Funk, Higgins, and Newmark, is a regression among the top 15 American metro areas, using data from 2016-9. Among those regions, higher subsidies to public transit correlate with higher efficiency. Efficiency is measured as average vehicle occupancy, regardless of whether the vehicle is a train or bus (but trains are calculated on a per-car basis, following NTD norms). Subsidies are measured per capita.
By Funk-Higgins-Newmark, New York has by far the most transit subsidies in the United States: the region subsidized public transit operations across all agencies by $444.50/capita in 2019 dollars. In contrast, regions that have rounding-error ridership were stingier: Dallas averaged $124.20/capita, and Phoenix $97.20. New York has much higher efficiency measured by vehicle occupancy, and secondary transit cities like Boston and San Francisco have lower efficiency than New York and higher than the no-transit Sunbelt cities.
Except that all they’re proving is that cities with higher transit ridership have both higher vehicle occupancy (partly due to higher crowding, partly due to real efficiency, because they run more trains and not just buses) and higher subsidies per capita. To switch to raw 2019 NTD data just because it’s easier to explain: the MTA, across all sub-agencies recorded in the NTD’s top 50 database linked above, spent $12.381 billion on operations in 2019 and earned just $6.359 billion from fares, which works out to somewhat more than $400 per capita in the MTA service region – but those $6 billion of subsidies covered something like 30 billion p-km and 4.6 billion unlinked trips, working out to $1.3 per trip. Even taking into account that unlinked trips are fake news (they double-count people who transfer between subway lines, even within the system), the subsidy per ride is on the on the order of $2/trip. Dallas, in contrast, spent $568 million on operations, got $66 million in fare revenue, and carried 69 million unlinked trips and 706 million p-km. Far from stingy, Dallas spent $7.28 on subsidizing each unlinked bus or rail trip. Houston likewise spent $5.65/trip and Phoenix (buses only) $4.33.
At no point does the study try to establish that if Dallas quadruples its transit subsidies, it will be able to raise its transit ridership by the factor of 67 required to match New York per capita. A snapshot regression of 15 metro areas has no chance of having enough statistical power to establish anything on the margin. The literature review is negative on transit subsidies, finding that they are associated with higher labor spending (for example, through reluctance to innovate in labor-saving technology) and with spreading service-hours too thinly at too low a frequency. To the contrary, all available research suggests that an increase in Dallas’s transit subsidy to match New York will just get wasted; ridership will increase, but so far below the increase in subsidy that the per trip subsidy will skyrocket even more.
In other words, the higher subsidy in New York per capita just showcases that a larger share of people in the New York region ride public transit, and therefore even a relatively low per-rider subsidy can amount to a hefty subsidy per resident. This is not at all surprising; by the same token, polities with larger numbers of schoolchildren spend a larger proportion of their economy on education, which says nothing about how well-funded the schools are (for example, Israel has a rather high education spending as a percentage of GDP, but low spending per student). Thus the study is not just wrong but also boringly so.
So why is it getting any positive press?
American advocacy and subsidies
For years, American transit advocates have been looking into the idea of federal subsidies to transit operations. Traditionally, these are not allowed, except in very small cities with even less relevant public transit than the systems of Dallas or Phoenix; instead, federal funding only goes to capital construction. In the Streetsblog piece, Kea Wilson writes about this connection to advocacy for federal subsidies; I’ve seen it from talking to advocates, who kept complaining, essentially, that federal subsidies require some clear piece of infrastructure to be built and that’s too constraining.
As corona hit, these efforts grew dramatically, since in an emergency it was valuable to inject cash into the systems to prevent long-term closures; then, as ridership hasn’t quite returned (it looks like 70% of pre-pandemic levels as of late 2023; in Berlin, with large reductions in fares, it was 95%), advocates started agitating for more subsidies, without much of a clear goal, certainly nothing related to outcomes. Instead, the demand is to have buses and trains run just so that cities can say that they’re running them. When such advocates say what they’d like to do with the money, it’s, in my experience, always about inputs, never outputs; one said that light rail trains should have a second crew member working as a train attendant just to make passengers feel safer.
In contrast, when I see advocates demand subsidies for concrete ridership-related improvements, it’s not really connected to any demand for federal subsidies. I don’t know what Riders Alliance thinks about federal subsidies to operations, but in its Six-Minute Service campaign, which in its opinion requires some additional state subsidies (and in mine and in that of ETA pays for itself on the subway), it talks about how it’s such a small increase in subsidy relative to existing ones, and doesn’t directly ask for federal subsidies. When it’s for something this specific, advocacy organizations feel confident asking for money directly.
So the belief that subsidies to operations help efficiency, based on a boringly wrong regression, is there in support of something different – in support of wanting subsidies with no clear goal, other than “fund transit.” It’s not really about frequent service, the most valid use of additional operating funds. It’s certainly not about capital extensions that reduce future operating costs, which are favored under the current regime. It’s about spending for its own sake.
The MTA 20 Year Needs Assessment Reminds Us They Can’t Build
The much-anticipated 20 Year Needs Assessment was released 2.5 days ago. It’s embarrassingly bad, and the reason is that the MTA can’t build, and is run by people who even by Northeastern US standards – not just other metro areas but also New Jersey – can’t build and propose reforms that make it even harder to build.
I see people discuss the slate of expansion projects in the assessment – things like Empire Connection restoration, a subway under Utica, extensions of Second Avenue Subway, and various infill stations. On the surface of it, the list of expansion projects is decent; there are quibbles, but in theory it’s not a bad list. But in practice, it’s not intended seriously. The best way to describe this list is if the average poster on a crayon forum got free reins to design something on the fly and then an NGO with a large budget made it into a glossy presentation. The costs are insane, for example $2.5 billion for an elevated extension of the 3 to Spring Creek of about 1.5 km (good idea, horrific cost), and $15.9 billion for a 6.8 km Utica subway (see maps here); this is in 2027 dollars, but the inescapable conclusion here is that the MTA thinks that to build an elevated extension in East New York should cost almost as much as it did to build a subway in Manhattan, where it used the density and complexity of the terrain as an argument for why things cost as much as they did.
To make sure people don’t say “well, $16 billion is a lot but Utica is worth it,” the report also lowballs the benefits in some places. Utica is presented as having three alternatives: subway, BRT, and subway part of the way and BRT the rest of the way; the subway alternative has the lowest projected ridership of the three, estimated at 55,600 riders/weekday, not many more than ride the bus today, and fewer than ride the combination of all three buses in the area today (B46 on Utica, B44 on Nostrand, B41 on Flatbush). For comparison, where the M15 on First and Second Avenues had about 50,000 weekday trips before Second Avenue Subway opened, the two-way ridership at the three new stations plus the increase in ridership at 63rd Street was 160,000 on the eve of corona, and that’s over just a quarter of the route; the projection for the phase that opened is 200,000 (and is likely to be achieved if the system gets back to pre-corona ridership), and that for the entire route from Harlem to Lower Manhattan is 560,000. On a more reasonable estimate, based on bus ridership and gains from faster speeds and saving the subway transfer, Utica should get around twice the ridership of the buses and so should Nostrand (not included in the plan), on the order of 150,000 and 100,000 respectively.
Nothing there is truly designed to optimize how to improve in a place that can’t build. London can’t build either, even if its costs are a fraction of New York’s (which fraction seems to be falling since New York’s costs seem to be rising faster); to compensate, TfL has run some very good operations, squeezing 36 trains per hour out of some of its lines, and making plans to invest in signaling and route design to allow similar throughput levels on other lines. The 20 Year Needs Assessment mentions signaling, but doesn’t at all promise any higher throughput, and instead talks about state of good repair: if it fails to improve throughput much, there’s no paper trail that they ever promised more than mid-20s trains per hour; the L’s Communications-Based Train Control (CBTC) signals permit 26 tph in theory but electrical capacity limits the line to 20, and the 7 still runs about 24 peak tph. London reacted to its inability to build by, in effect, operating so well that each line can do the work of 1.5 lines in New York; New York has little interest.
The things in there that the MTA does intend to build are slow in ways that cross the line from an embarrassment to an atrocity. There’s an ongoing investment plan in elevator accessibility on the subway. The assessment trumpets that “90% of ridership” will be at accessible stations in 2045, and 95% of stations (not weighted by ridership) will be accessible by 2055. Berlin has a two years older subway network than New York; here, 146 out of 175 stations have an elevator or ramp, for which the media has attacked the agency for its slow rollout of systemwide accessibility, after promises to retrofit the entire system by about this year were dashed.
The sheer hate of disabled people that drips from every MTA document about its accessibility installation is, frankly, disgusting, and makes a mockery of accessibility laws. Berlin has made stations accessible for about 2 million € apiece, and in Madrid the cost is about 10 million € (Madrid usually builds much more cheaply than Berlin, but first of all its side platforms and fare barriers mean it needs more elevators than Berlin, and second it builds more elevators than the minimum because at its low costs it can afford to do so). In New York, the costs nowadays start at $50 million and go up from there; the average for the current slate of stations is around $70 million.
And the reason for this inability to build is decisions made by current MTA leadership, on an ongoing basis. The norm in low- and medium-cost countries is that designs are made in-house, or by consultants who are directly supervised by in-house civil service engineers who have sufficient team size to make decisions. In New York, as in the rest of the US, the norms is that not only is design done with consultants, but also the consultants are supervised by another layer of consultants. The generalist leadership at the MTA doesn’t know enough to supervise them: the civil service is small and constantly bullied by the political appointees, and the political appointees have no background in planning or engineering and have little respect for experts who do. Thus, they tell the consultants “study everything” and give no guidance; the consultants dutifully study literally everything and can’t use their own expertise for how to prune the search tree, leading to very high design costs.
Procurement, likewise, is done on the principle that the MTA civil service can’t do anything. Thus, the political appointees build more and more layers of intermediaries. MTA head Janno Lieber takes credit for the design-build law from 2019, in which it’s legalized (and in some cases mandated) to have some merger of design and construction, but now there’s impetus to merge even more, in what is called progressive design-build (in short: New York’s definition of design-build is similar to what is used in Turkey and what we call des-bid-ign-build in our report – two contracts, but the design contract is incomplete and the build contract includes completing the design; progressive design-build means doing a single contract). Low- and medium-cost countries don’t do any of this, with the exception of Nordic examples, which have seen a sharp rise in costs from low to medium in conjunction with doing this.
And MTA leadership likes this. So do the contractors, since the civil service in New York is so enfeebled – scourged by the likes of Lieber, denied any flexibility to make decisions – that it can’t properly supervise design-bid-build projects (and still the transition to design-build is raising costs a bit). Layers of consultants, insulated from public scrutiny over why exactly the MTA can’t make its stations accessible or extend the subway, are exactly what incompetent political appointees (but I repeat myself) want.
Hence, the assessment. Other than the repulsively slow timeline on accessibility, this is not intended to be built. It’s not even intended as a “what if.” It’s barely even speculation. It’s kayfabe. It’s mimicry of a real plan. It’s a list of things that everyone agrees should be there plus a few things some planners wanted, mostly solidly, complete with numbers that say “oh well, we can’t, let’s move on.” And this will not end while current leadership stays there. They can’t build, and they don’t want to be able to build; this is the result.
Mineta Shows How not to Reduce Construction Costs
There’s a short proposal just released by Joshua Schank and Emma Huang at the Mineta Transportation Institute, talking about construction costs. It’s anchored in the experience of Los Angeles more than anything, and is a good example of what not to do. The connections the authors have with LA Metro make me less confident that Los Angeles is serious about reforming in order to be able to build cost-effective infrastructure. There are three points made in the proposal, of which two would make things worse and one would be at best neutral.
What’s in the proposal?
The report links to the various studies done about construction cost comparison, including ours but also Eno’s and Berkeley Law’s. It does so briefly, and then says,
Often overlooked are the inefficiencies and shortcomings inherent in the transportation planning process, which extend far beyond cost, to the quality of the projects, outcomes for the public, and benefits to the region. Rather than propose sweeping, but politically unfeasible, policy changes to address these issues, we focused on more attainable steps that agencies can take right now to improve the process and get to better outcomes.
Mineta’s more attainable steps, in lieu of what we say about project delivery and standardization, are threefold:
- Promise Outcomes, not Projects: instead of promising a concrete piece of infrastructure like a subway, agencies should promise abstract things: “mode-agnostic mobility solutions that ‘carried x riders per day’ or ‘reduced emissions by x%’ or ‘reduced travel time by x minutes,'” which may be “exclusive bus lanes, express bus services, or microtransit.”
- Separate the Planning and Environmental Processes: American agencies today treat the environmental impact statement (EIS) process as the locus of planning, and instead should separate the two out. The planning process should come first; one positive example is the privatized planning of the Sepulveda corridor in Los Angeles.
- Integrate Planning, Construction, and Operations Up Front: different groups handling operations and construction are siloed in the US today, and this should change. There are different ways to do it, but the report spends the longest time on a proposal to offload more responsibilities to public-private partnerships (PPPs or P3s), which should be given long-term contracts for both construction and maintenance.
Point #2 is not really meaningful either way, and the Sepulveda corridor planning is not at all a good example to learn from. The other two points have been to various extents been done before, always with negative consequences.
What’s the problem with the proposal?
Focusing on outcomes rather than projects is called functional procurement in the Nordic countries. The idea is that the state should not be telling contractors what to do, but only set broad goals, like “we need 15,000 passengers per hour capacity.” It’s a recent reform, along many others aiming to increase the role of the private sector in planning.
In truth, public transport is a complex enough system that it’s not enough to say “we need X capacity” or “we need Y speed.” Railways have far too many moving parts, to the point that there’s no alternative to just procuring a system. Too many other factors depend on whether it is a full metro, a tramway, a tram-train (in practice how American light rail systems function), a subway-surface line, or a commuter train. In practice, functional procurement in Sweden hasn’t brought in any change.
In the case of Sepulveda, LA Metro did send some of the high-level P3 proposals to Eric and me. What struck me was that the vendors were proposing completely different technologies. This is irresponsible planning: Sepulveda has a lot of different options for what to do to the north (on the San Fernando Valley side) and south (past LAX), and not all of them work with new technology. For example, one option must be running it through to the Green Line on the 105, but this is only viable if it’s the same light rail technology.
The alternative of microtransit is even worse. It does not work at scale; over a decade of promises by taxi companies that act like tech companies have failed to reduce the cost structure below that of traditional taxis. However, it does open the door for politicians who think they’re being innovative to bring in inefficient non-solutions that are getting a lot of hype. The report brings the example of a New York politician who was taking credit for (small) increases in subway frequency; well, many more politicians spent the 2010s saying that San Francisco’s biggest nonprofit, Uber, was the future of transportation.
The point recommending P3s for their integration of operations and infrastructure is even worse. The privatization of state planning has been an ongoing process in certain parts of the world – it’s universal in the English-speaking world and advancing in the Nordic countries. The outcomes are always the same: infrastructure construction gets worse.
The top-down Swedish state planning of the third quarter of the 20th century built around 104 km of the T-bana, of which 57 are underground, for $3.6 billion in 2022 prices. The present process, negotiated over decades with people who don’t like an obtrusive state and are inspired by British privatization, is building about 19 underground km, for $4.5 billion. This mirrors real increases in absolute costs (not just overruns) throughout Scandinavia. The costs of Sweden in the 1940s-70s were atypically low, but there’s no need for them to have risen so much since then; German costs have been fairly flat over this period, Italian costs rose to the 1970s-80s due to corruption and have since fallen, Spanish costs are still very low.
As we note in the Swedish case report, Nordic planners take it for granted that privatization is good, and ding Germany for not doing as much of it as the UK; of these two countries, one can build and one can’t, and the one that can is unfortunately not the one getting accolades. The United Kingdom, was building subways for the same costs as Germany and Italy in the 1960s and 70s, but its real costs have since grown by a factor of almost four. I can’t say for certain that it’s about Britain’s love affair with P3s, but the fact that the places that use P3s the most are the worst at building infrastructure should make people more critical of the process.
Britain Remade’s Report on Construction Costs
The group Britain Remade dropped a report criticizing Britain for its high infrastructure construction costs three days ago. I recommend everyone read Sam Dumitriu and Ben Hopkinson’s post on the subject. Sam and Ben constructed their own database. Their metro tunneling costs mostly (but not exclusively) come from our database but include more detail such as the construction method used; in addition, they have a list of tram projects, another list of highway projects, and a section about rail electrification. Over the last three days, this report has generated a huge amount of discussion on Twitter about this, with appearances in mainstream media. People have asked me for my take, so here it is. It’s a good report, and the recommendations are solid, but I think it would benefit from looking at historical costs in both the US and UK. In particular, while the report is good, the way it’s portrayed in the media misses a lot.
What’s in the report
Sam and Ben’s post talks about different issues, affecting different aspects of the UK, all leading to high costs:
NIMBYism
The report brings up examples of NIMBYs slowing down construction and making it more expensive, and quotes Brooks-Liscow on American highway cost growth in the 1960s and 70s. This is what has been quoted in the media the most: Financial Times call it the “NIMBY tax,” and the Telegraph spends more time on this than on the other issues detailed below.
The NIMBYs have both legal and political power. The legal power comes from American-style growth in red tape; the Telegraph article brings up that the planning application for a highway tunnel under the Thames Estuary is 63,000 pages long and has so far cost 250 million £ in planning preparations alone (the entire scheme is 9 billion £ for 23 km of which only 4.3 are in tunnel). The political power is less mentioned in the report, but remains important as well – High Speed 2 has a lot of gratuitous tunneling due to the political power of the people living along the route in the Home Counties.
Start-and-stop construction
British rail electrification costs are noticeably higher than Continental European ones. The report points out that construction is not contiguous but is rather done in starts and stops, leading to worse outcomes:

Lack of standardization
Sam and Ben bring up the point Bent Flyvbjerg makes about modularization and standardization. This is the least-developed point in the report, to the point that I’m not sure this is a real problem in the United Kingdom. It is a serious problem in the United States, but while both American and British costs of infrastructure construction are very high, not every American problem is present in the UK – for example, none of the British consultants we’ve spoken to has ever complained about labor in the UK, even though enoguh of them are ideologically hostile to unions that they’d mention it if it were as bad as in the US.
What’s not in the report?
There are some gaps in the analysis, which I think compromise its quality. The analysis itself is correct and mentions serious problems, but would benefit from including more things, I believe.
Historical costs
The construction costs as presented are a snapshot in time: in the 21st century, British (and Canadian, and American) costs have been very high compared with Continental Europe. There are no trends over time, all of which point to some additional issues. In contrast, I urge people to go to my post from the beginning of the year and follow links. The biggest missing numbers are from London in the 1960s and 70s: the Victoria and Jubilee lines were not at all atypically expensive for European subway tunnels at the time – at the time, metro construction costs in London, Italian cities, and German cities were about the same. Since then, Germany has inched up slightly, Italy has gone down due to the anti-corruption laws passed in the 1990s, and the United Kingdom has nearly quadrupled its construction costs over the Jubilee, which was already noticeably higher than the Victoria.
The upshot is that whatever happened that made Britain incapable of building happened between the 1970s and the 1990s. The construction cost increase since the 1990s has been real but small: the Jubilee line extension, built 1993-9, cost 218.7 million £/km, or 387 million £/km in 2022 prices; the Northern line extension, built 2015-21, cost 375 million £/km, or 431 million £/km in 2022 prices. The Jubilee extension is only 80% underground, but has four Thames crossings; overall, I think it and the Northern extension are of similar complexity. It’s a real increase over those 22 years; but the previous 20 years, since the original Jubilee line (built 1971-9), saw an increase to 387 million £/km from 117 million £/km.
The issue of soft costs
Britain has a soft costs crisis. Marco Chitti points out how design costs that amount to 5-10% of the hard costs in Italy (and France, and Spain) are a much larger proportion of the overall budget in English-speaking countries, with some recent projects clocking in at 50%. In the American discourse, this is mocked as “consultants supervising consultants.” Every time something is outsourced, there’s additional friction in contracting – and the extent of outsourcing to private consultants is rapidly growing in the Anglosphere.
On Twitter, some people were asking if construction costs are also high in other Anglo countries, like Australia and New Zealand; the answer is that they are, but their cost growth is more recent, as if they used to be good but then learned bad practices from the metropole. In Canada, we have enough cost history to say that this was the case with some certainty: as costs in Toronto crept up in the 1990s, the TTC switched to design-build, supposed inspired by the Madrid experience – but Spain does not use design-build and sticks to traditional design-bid-build; subsequently, Toronto’s costs exploded, going, in 2022 prices, from C$305 million/km for the Sheppard line to C$1.2 billion/km for the Ontario Line. Every cost increase, Canada responds with further privatization; the Ontario Line is a PPP. And this is seen the most clearly in the soft cost multiplier, and in the rise in complaints among civil servants, contractors, and consultants about contracting red tape.
Britain Remade’s political recommendations
Britain Remade seems anchored not in London but in secondary cities, judging by the infrastructure projects it talks most about. One of its political recommendations is,
Britain is one of the most centralised countries in the world. Too often, Westminster prioritises investments in long-distance intercity rail such as HS2 or the Northern Powerhouse Rail when they would be better off focusing on cutting down commuting times. Local leaders understand local priorities better than national politicians who spend most of their time in Westminster. If we really devolved power and gave mayors real powers over spending, we’d get the right sort of transport more often.
Britain Remade is campaigning for better local transport. We want to take power from Westminster and give it to local leaders who know better. But, we also want to make sure transport investment stretches further. That’s why we are calling for the government to copy what other countries do to bring costs down, deliver projects on time, and build more.
https://www.britainremade.co.uk/building_better_local_transport
Devolution to the Metropolitan counties – those covering Birmingham, Manchester, Liverpool, Leeds, Sheffield, and Newcastle – has been on the agenda in the UK for some time now. This reform is intended to give regions more power over spending, inspired by the success of devolution to London, where Transport for London has good operating practices and plenty of in-house capacity. More internationally-minded Brits (that is, to say, European-minded – there’s little learning from elsewhere except when consultants treat Singapore and Hong Kong as mirrors of their own bad ideas) will even point out the extensive regional empowerment in the Nordic countries: Swedish counties have a lot of spending power, and it’s possible to get all stakeholders in the room together in a county.
And yet, the United States is highly decentralized too, and has extreme construction costs. Conversely, Britain knew how to build infrastructure in the 1960s and 70s, under a centralized administrative state. Devolution to the Metropolitan counties will likely lead to good results in general, but not in infrastructure construction costs.
The media discourse
The report raises some interesting points. The start-and-stop nature of British electrification is a serious problem. To this, I’ll add that in Denmark, electrification costs are higher than in peer Northern European countries because its project, while more continuous, suffered from political football and was canceled and then uncanceled.
Unfortunately, all media discussion I can see, in the mainstream as well as on Twitter, misses the point. There’s too much focus on NIMBYism, for one. Britain is not the United States. In the United States, the sequence is that first of all the system empowered NIMBYs politically and legally starting in the 1960s and 70s, and only then did it privatize the state. In the United Kingdom, this is reversed: the growth in NIMBY empowerment is recent, with rapid expansion of the expected length of an environmental impact statement, and with multiplication of conflicting regulations – for example, there are equity rules requiring serving poor and not just rich neighborhoods, but at the same time, there must be a business case, and the value of time in the British benefit-cost analysis rules is proportional to rider income. This explosion in red tape is clearly increasing cost, but the costs were very high even before it happened.
Then, there are the usual incurious ideas from the Twitter reply gallery, including some people with serious followings: Britain must have stronger property rights (no it doesn’t, and neither does the US; look at Japan instead), or it’s related to a general cost disease (British health care costs are normal), or what about Hong Kong (it’s even more expensive).
Deutsche Bahn’s Europabahn Study
Deutsche Bahn released a study three days ago proposing to build a Europe-wide network of high-speed trains. There aren’t too many details – the fully study PDF is corrupted (update: this direct link works) – but we can already learn a lot from the proposed map, which is available. I’m glad that proposals like this are out, but this one reminds me of the recent proposal for a massive expansion of the Berlin U-Bahn, which leaves a lot to be desired, comprising both necessary priorities and questionable lines; this time, there are some priorities that should be included but aren’t.

The map is clearly intended as a Europe-wide network. For reasons I don’t quite get, Britain and its under-construction High Speed 2 system is not included – it’s not an EU or Schengen member but neither are Serbia and North Macedonia, and meanwhile, Northern Ireland is included.
In some places, the proposed lines are taken straight out of current proposals. This is the case in Spain, Portugal, Italy, and France: on the French map, lines that are in active planning like Bordeaux-Dax and Toulouse-Montpellier/Perpignan are visible and so are lines that are stalled like Marseille-Nice or the Paris-Orléans-Lyon relief line.
There’s little to comment on in these places, save that some of the international connections are underbuilt under current plans. It’s frustrating that the current plans include a connection from Bordeaux to Basque Country and thence Madrid, and a more direct connection from Madrid to Pamplona, but not the short connection from Pamplona to the French border for faster Paris-Madrid service; French and Spanish trains are fast and these two cities, the two largest single-core regions in the EU, should be no more than 4.5 hours apart via the most direct routing. Italy is also, equally frustratingly, missing a fast connection from Milan into Switzerland, hooking into the new tunnels across the Alps with additional under-construction fast lines on the Swiss side; this way, the route from Zurich to Milan has an orphaned-looking fast section in the middle.
In Eastern Europe and Scandinavia, the map looks taken from existing proposals as well. Finland’s system is based on existing proposals. Their benefit-cost ratios were assessed to be underwater earlier this year (using atypically low estimates of the travel time elasticity – Helsinki-Tampere looks like they’re estimating -0.17, which is ridiculous; try -2), but this doesn’t mean they won’t happen. Sweden recently decided against a domestic high-speed rail system, but this again may be revived. Czechia is planning its own system, with international connections. But farther east, the lines get more fanciful – the Romanian and Hungarian networks look pretty overbuilt relative to the sizes of the cities in those countries, which aren’t growing.
And then there’s the German core. The domestic and international lines here mostly look like a very extensive proposal. Practically every city is on the map, to the point that there’s a 300 km/h line from Leipzig to Chemnitz. Some of those yellow lines on the map are already in planning, like Augsburg-Ulm, Hanover-Hamm, and Erfurt-Fulda.
But then there are the missing ones. Fulda-Hanau, currently on the planning board, is for some reason omitted. Berlin is getting two new high-speed rail lines to the south, one to Dresden and a separate one to Görlitz (district population 248,000), but nothing to Halle and Leipzig, even though that would also speed up the trains to Munich. This can’t be about the false belief that a four-hour trip time is good enough and there’s no point in speeding it up further, because then why would they include a spur to Chemnitz? It’s a three-hour trip today with a 40-minute transfer at Leipzig; the time saved from speeding up Leipzig-Chemnitz is less than what could be saved just by timing the connection better, let alone by doing that and also speeding up Berlin-Leipzig.
The international connections are pretty good. There’s finally a fast line to Zurich, plus two to Prague, plus an all-fast connection from Munich south across the Alps. Paris-Frankfurt is on the map, via Mannheim. The slow section to the Belgian border is fixed; the Netherlands gets four distinct connections, of which two I do not get (the three southern ones can be consolidated to one without taking a huge hit to trip times).
But then those international connections mostly just feed existing or planned lines. Thus, the fast line from Munich to the Austrian border is not accompanied by speeding up the Westbahn; Salzburg, per DB, should get fast trains to Munich and the rest of Germany, and Linz should get fast trains via two different lines, but then Vienna should stay connected by a medium-speed link.
And yet, at least in and around Germany, it looks like DB is proposing too much, not too little: cities like Szczecin, Bremerhaven, Kiel, Rostock, Chemnitz, and Görlitz are too small to be worth building a dedicated line to. Either send an ICE at lower speed from the nearest large node or run slow trains and try to time some connections. It’s proposing a 6,000 km network for Germany; I did a fair amount of crayoning in 2021, and got to somewhat more than 4,000, including international connections. The current network, including lines that shouldn’t be changed like Berlin-Hamburg or that are under construction like Karlsruhe-Basel, is around 1,700. So as with the Berlin U-Bahn map, it’s best to think of the current proposal as about half good lines, and half things that most likely shouldn’t see the light of day (Chemnitz, again).
I suspect the reason small cities like Kiel are included is that high-speed rail plans in Germany face constant criticism by technical railfans who think that small cities generate more traffic than they actually do. Part of it is that railfans and Green voters take the train at far higher modal split than does the general public, and thus use the train to get to places where everyone else not only drives but will keep driving even with better frequencies and connections. The same group also doesn’t mind sitting two hours longer on a train than at TGV speeds. Thus, rail advocacy in Germany kneecaps itself by insisting on the least cost-effective treatments. DB may be responding to such advocacy by proposing high-speed lines even to cities that are far too small to justify such connections, to preempt any criticism that cities like Görlitz are left out.
And this is sad, because most of the cross-border connections on the map out of or near Germany are really solid, and unfortunately underrated in current planning. I hope DB takes them seriously enough to commit to partnering with the other-country railway (SNCF, ÖBB, etc.) and building them, rather than shoving them below the priority level of a high-speed line from Berlin to Rostock.
