Category: Transportation
On Worshiping Foreign Systems
Tucker Carlson has been wowed by Putin’s Russia as of late and is reporting about how great it is; I wouldn’t normally talk about it, except that among the things he crowed about was Kiyevskaya Station on the Moscow Metro. He described it as clean and drug-free, and showed videos that would not have looked out of place in present-day Paris or London, and all I could think about when I watched it was something that I read in Korean media, more than 11 years ago. The newspaper JoongAng criticized the construction of the infill station at Guryong, by comparing its extravagance with the much more spartan stations of the Washington Metro, without noticing how the Washington Metro’s above-ground infill stations cost substantially more than the underground infill at Guryong, the Potomac Yards station reaching four times the cost of Guryong. In both cases, and in some others, the foreign system is not really described as a real place, but as a tourist fantasy. Little learning can come from this.
In fact, there are many positive things one can learn from Russia about how to run rail transportation. Soviet metro planning was quite good, and Eastern Bloc successor states (including satellites, not just former USSR constituents) inherited it and have in some cases expanded on it even while rejecting central planning elsewhere, for example in thoroughly neoliberal Czechia. Good features of this planning tradition include all of the following:
- Clean radial metro network design, with a distinction between city center and outlying areas.
- Very high frequency on each line. Moscow peaks at 39 trains per hour, the highest number I know of on non-driverless metros. When I visited Prague, planned by the same tradition, I saw higher metro frequency than I do in Berlin, with its rigid five-minute headways.
- Central planning of routes, with integration with where housing construction is permitted.
Of note, Carlson’s video doesn’t touch on any of this. He gets the history of the station wrong – he says it was built 70 years ago, when in fact the metro station opened in 1937, and it’s only the two later lines on this three-line transfer that opened in 1953 and 1954. He says he is “just asking questions” and then takes the watcher on a short video trip of the long escalator down to the platform, the ornate details of and art on the station, and the platforms and trains. That’s not Soviet metro design; that’s just metros. The New York City Subway is atypically dirty so that the mosaic art and sculptures there are surrounded by grime, but London and Paris are clean, and some of the stations in Paris have interesting art on the platforms. Stockholm has exposed gneiss rock, which forms a natural arch, and sculptures on some of its platforms. To me, as a regular urban rail rider, all of this looks extremely ordinary, which should not surprise, as good metro planning makes the ordinary last for generations.
Much of it is the excitement of a tourist. To the American visitor, the ornate finishes of Kiyevskaya are new, but the sculptures on the New York City Subway are so familiar that they go unremarkable. I see this in how Americans speak of Europe in general, especially on matters of urbanism; Marco Chitti pointed out that Italian farmers’ markets are for tourists and politicians, while most Italians do their shopping at car-oriented hypermarkets – tourists don’t see how auto-oriented Italy is, and this influences urbanist thinking about the greatness of traditional premodern city centers.
I don’t know what Carlson thinks about urbanism in general. I doubt he’s thought about it much. There are other American right-wing populists who have; their views are common enough among architectural traditionalists that The American Conservative publishes Strong Towns and that at one point the Trump administration passed an executive order requiring all new federal buildings to use traditional architectural styles rather than postwar ones like brutalism or postmodernism.
And Soviet-style metro planning is the exact opposite of that kind of urbanist tradition. It lives off of high-density housing, which are called projects in American parlance and microdistricts in the Soviet tradition, and are ideally placed right next to metro stations so that people can get to work efficiently. In Moscow, the city is large enough to support many radial metro lines, so that districts can be fairly close to metro stations far out of the center; in smaller cities, central planning is required to ensure alternation between high-density housing near the trains and parkland far from them, for which the best examples are Nordic rather than Eastern Bloc.
Traditional architecture critics loathe that kind of housing. In Sweden, one can find right-wingers who view Million Program housing as a socialist conspiracy to depress people into being pliable subjects. Chuck Marohn is not conspiratorial like this, but still opposes spiky density and prefers uniform density, with rules about how new housing on a street should be of similar size to existing buildings (no more than 50% taller) rather than much taller as is typical of either modern redevelopment projects or project-style housing.
Carlson himself is not that influential in urbanism, in the grand scheme of things. But urbanists who go on tourist trips abroad and conflate their travelogues for intellectual insights abound. Their views are often idiosyncratic, based on whatever they liked on a trip, which could be a high-speed rail trip, a neighborhood in a tourist trap, a kind of shopping that locals rarely do, or something similar. In all cases, this is fundamentally about leisure: the (usually New Left) tourist is in the city for purposes of leisure and experiences it as such, but the local rarely is. A glimpse of this can even be seen in the video from Kiyevskaya: the Moscow Metro is very crowded at rush hour, but the video does not depict overcrowding.
It’s possible to learn from abroad, but it does not involve travelogues. It involves interacting with locals in a position of equality rather than in that of a heavyweight who uses taxi drivers as sources. It involves reading what locals say; two years ago, around when Russia invaded Ukraine, I found a list of Russian dissidents and looked at the LiveJournal of an urbanist activist, who was talking about how Russian cities undermaintain public spaces. I think highly of Seung Y. Lee precisely because he demystifies Korean and Japanese urban rail for the Western reader; one can read his complaints about the Seoul subway’s accessibility and still recognize that its 92% wheelchair accessibility is by most global standards very good. It’s possible to, from a position of learning, inform oneself and conclude that a foreign system is superior in most aspects to the domestic one. But that’s not what so many urbanists who speak of their own tourists experience do, and Carlson happens to have provided one political example of this.
Costs Per Rider and Willingness to Build
At the Transit Costs Project, we study the costs of urban rail lines per kilometer. This, with our usual controls, is a rough indicator of how efficient a city’s infrastructure construction program is. However, cost-effectiveness is different from efficiency, and is better measured not by just the cost but also the benefits, which are measured by ridership. Thus, cost-effectiveness is best measured by the cost of each project per rider. So what does it mean to compare different cities by their costs per rider, rather than per kilometer?
The answer is, “not much,” at least not as far as efficiency or good decisionmaking. In fact, while some projects persistently have costs per rider that are too high to be cost-effective (for example, it’s endemic to airport extensions), some cities have costs per rider that are too low, such as Berlin. The issue here is that if municipal or state decisionmaking is healthy, it will build cost-effective lines; if a line under discussion has a very high benefit-cost ratio, or equivalently a very low cost per rider, it means it should have been built long ago, and it speaks poorly to the local decisionmaking that it hasn’t been built already, as is unfortunately the case in Berlin.
Cost per rider and cost-effectiveness
As always, let’s start with Second Avenue Subway Phase 1, the project that launched my interest in construction costs and the Transit Costs Project writ large. The projected daily ridership is 202,000; the line came close to it in 2019, reaching about 163,000 (see data here; I’m taking boardings for the three new stations, adding the growth in ridership at Lexington/63rd, and multiplying by two to account for disembarkings), and would have likely reached projection by now but for the pandemic. The cost, in 2023 dollars, was $6.23 billion, or about $31,000 per projected weekday trip.
For another anchoring number, let’s use the Stockholm Metro’s entire construction from the 1940s to the 1970s. This is useful because in addition to costs per rider, there is a published ex post benefit-cost ratio, thanks to the work of Maria Börjesson. The cost of that system, in 2023 PPP dollars, was $3.7 billion, with a ridership of 1,265,900 per workday in 2019, or $2,900/rider, while the benefit-cost ratio is 6 without taking agglomeration into account, or 8.5 with. This does not mean that the value of a rider is only about $24,900; this was the value in the economic situation of postwar Sweden, a country that was substantially poorer than the Sweden of today. In 2023 PPP terms, Sweden’s GDP per capita in 1965, about midway through the opening of the original system, was about $19,400; today, Sweden is 3.5 times richer, and the US is 17% richer than Sweden.
The benefits of urban travel are largely proportional to GDP per capita. The economic benefits of agglomeration are proportional to the value of the economy writ large, and so are the benefits of reduced travel time, which in benefit-cost analyses are usually taken to be proportional to the average hourly wage. Conversely, the ability of a government to spend money on desired outcomes is proportional to its tax base, i.e. the size of its economy. All of this is approximate, but all we’re doing is first-order approximate analysis anyway, and so correcting for GDP per capita is valuable.
As it is, the difference between American and Swedish GDP per capita boils down entirely to working hours. Swedes work shorter hours than Americans, as they, like nearly everyone else in Europe, get much longer vacation time; as of 2022, Sweden’s GDP per hour worked was, by a rounding error, slightly higher than the US’s. However, at the same time, the daily ridership numbers for Sweden are specifically drawn from winter workday ridership, to avoid reporting figures from when ridership is lower during the summer vacation season, and the same is true for daily ridership counts in France. If we give Sweden and France credit by looking at ridership when people aren’t on vacation, we must compare the cost per rider with GDP per capita and not GDP per hour.
The upshot is that countries should be building metros up to a maximum capital cost per rider that’s about as large as their GDP per capita. The $24,900 computation for 1960s’ Sweden is ex post, and usually the ex ante benefit-cost ratio must be at least 1.2 or 1.3 for the project to go ahead due to risk. For light rail the allowable cost should be lower, and for bus projects it should be lower still, due to the higher lifetime operating costs; but for metros and metro-like urban rail projects (such as largely grade-separated light rail, or commuter rail tunnels like Citybanan), this analysis should hold. Second Avenue Subway Phase 1, which opened in a United States with a GDP of $73,300/capita in 2023 prices, is thus very cost-effective; Phase 2, budgeted at something like $70,000/rider in today’s prices, is marginal but makes it (in 2022, US GDP per capita in 2023 prices was $80,300).
Some more costs per rider
Our database of construction costs per km is largely complete, but we don’t have much ridership data. Worse, the costs per rider we do have have some biases. We have better information for the US and Canada than elsewhere, and for Europe than the rest of the non-North American world. Costs are also likeliest to be reported for megaprojects with notable delays or cost overruns and thus an incomplete database will be biased upward; large, international cities have better reporting in English than the rest and this introduces another upward bias in incomplete data (these are typically wealthy and therefore capable of affording a high cost per rider).
With that in mind, here are some (again, incomplete) examples:
- Crossrail cost $24 billion in 2023 PPP terms; ridership in late 2023 was 4.3 million a week, which is usually about 700,000/weekday, said to be above projections, with long-term projections rising to a million/weekday; on current ridership it’s $34,000/rider, and on future projections it’s $24,000.
- Paris Métro Line 14’s original section, opened by 2007, cost $2.44 billion in 2023 PPP terms; ridership in 2019, before more recent extensions and before corona, was 92 million, so around 320,000 per workday, which is $7,600/rider.
- Grand Paris Express was projected in 2021 to cost (in 2023 PPP dollars) around $65 billion, with a ridership projection of 2 million/day from 2022, and 2.3-2.4 million/day from 2012, for around $32,000/rider, or $28,000 if the older ridership projection is used.
- Milan Metro Line 5 cost $2.2 billion in 2023 PPP terms to date, and was said to carry 180,000 daily passengers in 2019, for $12,000/rider.
- Milan Metro Line 4 cost $2.63 billion, and was expected to carry 235,000 riders per day when complete, which would be $11,000/rider; it will be completed this year, but ridership so far is for only the half of the line that has opened so far ans is also still somewhat suffering from corona.
- The U-Bahn extensions in Berlin that are currently in development hell include U8 to Märkisches Viertel projected at 13,160€/rider (around $21,000 in 2023 PPP terms), a U6 extension to the former Tegel Airport projected at 27,200€/rider (around $43,000), and a U7 extension to the current BER airport projected at 23,000€/rider (around $36,000), among others brought up by the new coalition.
Willingness to build and Berlin’s problem
The above numbers should not be taken to mean that Italy and Germany are more cost-effective about metro construction. To the contrary, they indicate that they are leaving value on the table by not building.
Germany has a GDP per capita of $66,000 in PPP terms. The benefit-cost ratios of the U-Bahn extensions in Berlin that are being discussed but not actually brought forward and built are very high, and the U8 extension to Märkisches Viertel is scratching a ratio of 4. It is irresponsible that there isn’t a massive construction plan not just under discussion but in design and soon physical construction. This must include not just those lines but also others to be added until the benefit-cost ratio of the marginal line falls to slightly more than the minimum that deserves funding.
Italy has the same problem. No matter how pessimistic one’s view of the future of the economy of Italy is, the metro lines it is currently building, at least in Milan, are so cost-effective that there have to be more of them. In the 2010s, Italy was in a budget crunch and ended up using public-private partnerships to keep debt off-books, at very high implied interest rate based on the rate of payment to the concessionaire, about 8%. Today, fundamentally, even a stagnant economy with a GDP per capita of $55,000, which may finally overtake its 2007 peak this year, should be building more if the current extensive margin of Milan Metro construction is not even in the teens of thousands of dollars. Perhaps the benefit-cost ratios for Sweden rely not just on Sweden’s GDP per capita of the 1960s but on that of today, after 60 years of growth; but then even absent any of this growth, 55/3.5 > 12.
Paris showcases a healthier situation: the success of M14 endeared the region to driverless metros with longer interstations than the older metro lines but shorter ones than the RER, and with further growth in the region, the state decided to build the 200 km Grand Paris Express to improve circumferential rail service and add more fast radial connections from the suburbs to the city not along the RER. France’s GDP per capita is around $58,000 in PPP dollars; some elements of GPE may be marginal, but the project writ large has a solid benefit-cost-ratio starting with a 2.
Spain is like France in that when it can build, as it could before the Great Recession and as it can now after having recovered, it does. This is the right way to do it: low costs per km should translate to massive subway expansion. If you’re Madrid, you can build lines that would be completely ridiculous anywhere else in terms of land use, like MetroSur, because it’s cheap.
A Paris or Berlin cannot be so profligate as Madrid. Building a line like MetroSur here, which in the Spanish context looks silly but does pass cost-effectiveness muster, would be an economic albatross. But medium-cost cities can still cover most of the built-up area with subway and commuter rail lines; Paris is doing so but Berlin is not.
The problem for Berlin is not quite austerity, which afflicted Southern Europe last decade, producing negative economic growth. In the last coalition, it was the two most left-wing parties, the Greens and Die Linke, which opposed U-Bahn construction. In their view, trams are preferable; they complain about the high construction costs of subways, but don’t meaningfully engage with why they’re still necessary for fast urban transport beyond the range of the handful of inner neighborhoods where people vote for the Greens.
That said, in the current coalition, there’s no real political left. SPD is in it, but under an atypically conservative leader in Franziska Giffey, and the more left-wing faction in the party, including the youth league Jusos, is sidelined. Both parties in the coalition, CDU and SPD, are committed to building those U-Bahn extensions. But then nothing is happening; Giffey is not competent enough to do it, and CDU is too wrapped up in anti-environmental populism to do something that pisses off some environmentalists but makes others happy.
This way, the low costs per rider projected for Berlin U-Bahn expansion are not a testimony to cost-effectiveness. They’re a testimony to political unwillingness to build, for largely petty reasons. It is wasteful to build a subway line with a very high projected cost per rider relative to the country’s wealth, but it is equally wasteful not to build one with a low projected cost per rider, and the latter is what is happening in Berlin, unfortunately.
Security Theater on Metros
In comments, Sarapen asked me about security on urban rail. It’s common in developing Asia to require people to go through metal detectors to get to the platforms; I’ve seen this in Bangkok, she mentions this in the context of Manila, and it’s also the case on Indian metros and Chinese ones. Seung Y. Lee, a BART digital media worker and indispensable commentator on American and Asian metro history who sadly doesn’t blog enough, has an excellent post about it, talking about the use of security as a tool of social control, for example in Hong Kong.
But Sarapen is asking about the need for security to deter terrorism and violence, which do exist in the Philippines.
For this, I naturally went to the country facing terrorism and violence that I know most intimately. I haven’t visited in more than 11 years, and so I’ve never taken the light rail in either Tel Aviv or Jerusalem (which was open on my last visit but I didn’t visit the city then). So I went ahead and asked on my Discord server, and got this:
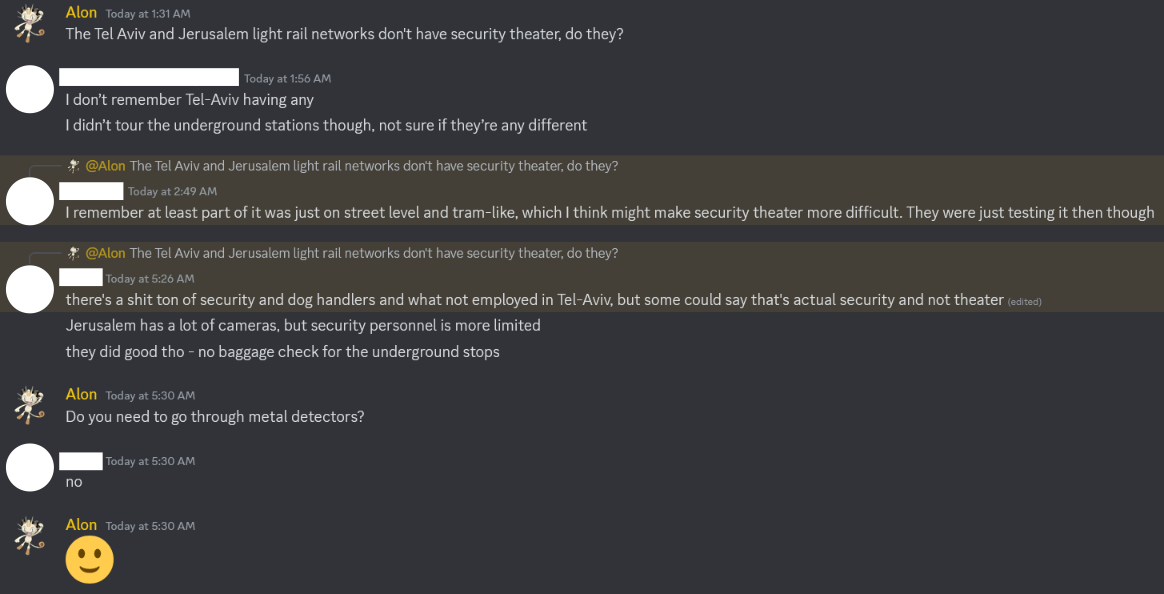
The person covered up by the two shorter white rectangles also posted a picture of a platform in Tel Aviv, with a vault for bomb disposal:
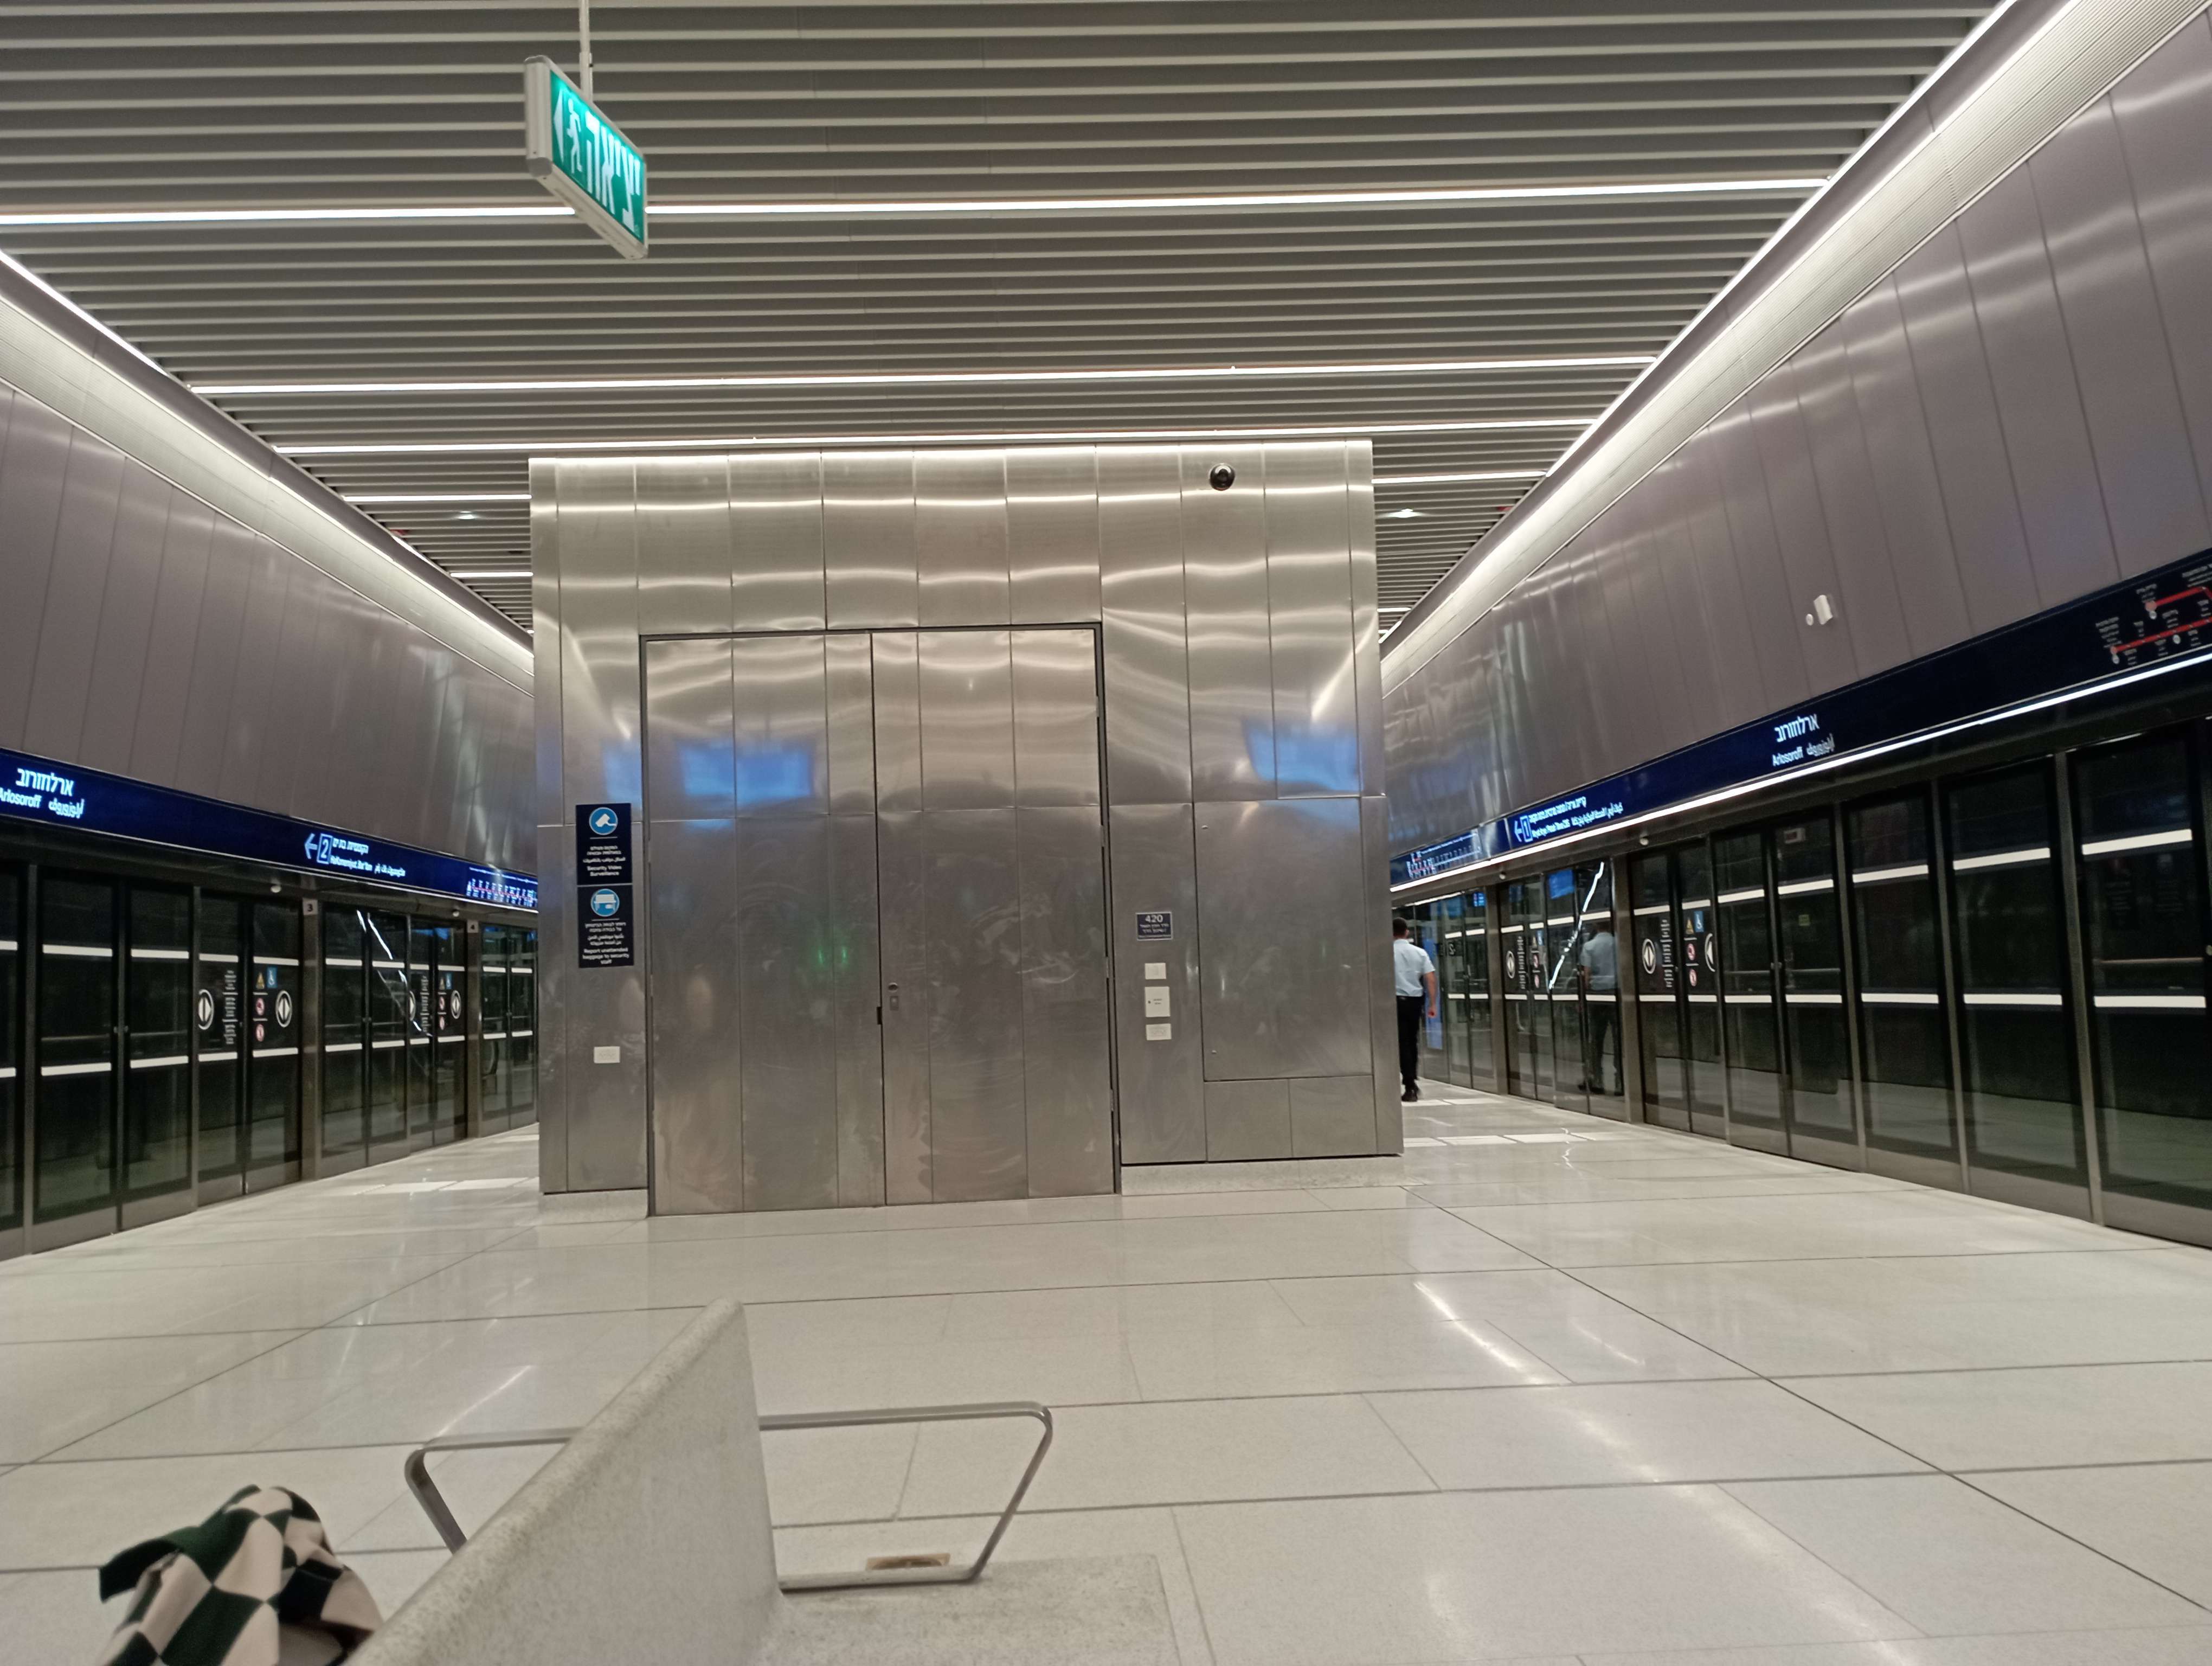
Israel Railways does have security theater – one has to open one’s bags in front of a security guard and go through a metal detector, and this being Israel, there is extensive racial profililng. But the light rail, including the underground portions in Tel Aviv, do not. There’s a lot of visible security presence, including cameras, security personnel, and K-9 units, but no metal detectors. This is in a country that, in the 1990s and early 2000s, underwent a wave of suicide bombings on buses, and still didn’t put metal detectors on them, because it’s infeasible to install such technology on surface transit, and too expensive and frankly not too useful on metros (a security line is an attractive bombing target).
This shouldn’t be too surprising, in a way. Western Europe did not install security theater on trains in response to far-left terrorism in the 1970s and 80s. Israel’s way of building and running public transportation is intended as a pan-European medley, using consultants who have done work in Europe, and with media discourse that looks up to Europe’s urban transportation systems (on other matters Israel looks up to the United States, but Israelis understand American public transportation is not good). If nobody in Europe (or at least Western Europe) does something, it’s unlikely Israel will do it, not on civilian public infrastructure.
Worthless Canadian Initiative
Canada just announced a few days ago that it is capping the number of international student visas; the Times Higher Education and BBC both point out that the main argument used in favor of the cap is that there’s a housing shortage in Canada. Indeed, the way immigration politics plays out in Canada is such that the cap is hard to justify by other means: traditionally, the system there prioritized high-skill workers, to the point that there has been conservative criticism of the Trudeau cabinet for greatly expanding low-skill (namely, refugee) migration; capping student visas is not how one responds to such criticism.
The issue is that Canada builds a fair amount of housing, but not enough for population growth; the solution is to build more – in a fast-growing country like Canada, the finance sector expects housing demand to grow and therefore will readily build more if it is allowed to.
Vancouver deserves credit for the quality of its transit-oriented development and to a large extent also for the amount of absolute development it permits (about 10 units per 1,000 residents annually); but its ability to build is much greater than that, precisely because rapid immigration means that more housing is profitable, even at higher interest rates. The population growth coming from immigration sends a signal to the market, invest in long-term tangible goods like housing. Thus, Vancouver deserves less credit for its permissiveness of development – large swaths of the city are zoned for single-family housing with granny flats allowed, including in-demand West Side neighborhoods with good access to UBC and Downtown jobs by current buses and future SkyTrain.
The rub is that restricting student immigration is probably the worst possible way to deal with a housing shortage. Students live at high levels of crowding, and the marginal students, who the visa cap is excluding, live at higher levels of crowding than the rest because they tend to be at poorer universities and from poorer backgrounds. The reduction in present-day demand is limited. In Vancouver, an empty nester couple with 250 square meters of single-family housing in Shaughnessy is consuming far more housing, and sitting on far more land that could be redeveloped at high density, than four immigrants sharing a two-bedroom apartment in East Vancouver.
In contrast, the reduction in future demand is substantial, because those students then graduate and get work, and many of them get high-skill, high-wage jobs (the Canadian university graduate premium is declining but still large; the American one is larger, but the US is also a higher-inequality society in general); having fewer students, even fewer marginal students who might take jobs below their skill level, is still a reduction in both future population and future productivity. What this means is that capital owners deciding where to allocate assets are less likely to be financing construction.
The limiting factor on housing production is to a large extent NIMBYism, and there, in theory, immigration restrictions are neutral. (In practice, they can come out of a sense of national greatness developmental conservatism that wants to build a lot but restrict who can come in, or out of anti-developmental NIMBYism that feels empowered to build less as fewer people are coming; this situation is the latter.) However, it’s not entirely NIMBYism – private developmental still has to be profitable, and judging by the discourse I’m seeing on Canadian high-rise housing construction costs in Toronto and Vancouver, it’s not entirely a matter of permits. Even in an environment with extensive NIMBYism like the single-family areas of Vancouver and Toronto, costs and future profits matter.
Eurostar Security Theater and French Station Size
Jon Worth has been doing a lot of good work lately pouring cold water on various press releases of new rail service in Europe. Yesterday he wrote a long post, reacting to some German rail discourse about the possibility of Eurostar service between London and Germany; he explained the difficulties of connecting Eurostar to new cities, discussing track and station capacity, signaling, and rolling stock.
Jon, whose background is in EU politics, wastes no time in identifying the ultimate problem: the UK demands passport controls, and this demand is unlikely to be waived in the near future due to concerns over Brexit and the need to have visible border control theater. In turn, the passport control and the accompanying security theater (not strictly required, but the UK insists for Channel Tunnel security) mean that boarding trains is a slow process since platforms must be kept sterile; thus, a Eurostar station requires dedicated platforms, and if it has significant rail traffic then it requires many of them, with low throughput per track. This particularly impacts the prospects of Eurostar service to Germany, because it would go via Belgium and Cologne, which has far from enough platforms for this operation.
What I’d like to add to this analysis is that Eurostar made a choice to engage in such controlled operations in the 1990s. The politics of Brexit can explain why there’s no reform that is acceptable to the British political system now; it cannot explain why this was chosen in the 1990s. The norm in Europe before Schengen was that border control officers would perform on-board checks while the train traveled between the last station in the origin country and the first station in the destination country; long nonstop trains between Paris and London or even Lille and London are ideal for such a system. Britain insists on the current system of border control before boarding because this way it can deny entry to people who otherwise would enjoy non-refoulement protections – but in the 2000s the politics in Britain was not significantly more anti-immigration than in, for example, Germany, or France.
Rather, the issue is that Britain insisted on some nebulous notion of separateness, and this interacted poorly with train station design in France compared with in Germany. Parisian train stations are huge, and have a large number of terminating tracks. Dedicating a few terminal tracks to sterile operations is possible at Gare du Nord, and would be possible at other Parisian terminals like Gare de Lyon if they pointed in the direction of a place that demanded them. SNCF has conceived of its operations, especially internationally, as airline-like, and this contributed to complacency about how the train stations are being treated like airports.
Germany developed different (and better) ways of conceiving of train operations. More to the point, Germany doesn’t really have Paris’s terminals with their surplus of tracks, except for Frankfurt and Munich. Cologne, the easiest place to get to London from, doesn’t have enough tracks for sterile operations. This is fine, because German domestic trains do not imitate airlines, even where there is room (instead, the surplus of tracks is used for timed connections between regional trains); this also cascades to international trains connecting to Germany, whether from countries that have more punctual rail networks like Switzerland or from countries that work by a completely different paradigm like Belgium or France.
And now Eurostar politically froze a system that was only workable at low throughput, at a handful of stations with more room for sterile operations than is typical. The system is still below its ridership projections from before opening; it was supposed to be part of a broader international rail network, but that never materialized, because of the burden of security theater, the high fares, and the indifference of Belgium to extending high-speed rail so that it would be useful for international travelers (the average speeds between Brussels-Midi and the German border are within the upper end of the range for upgraded classical lines, even though HSL 2 and 3 are new high-speed lines).
And now, with the knowledge of the 2010s, it’s clear that any future expansion of Eurostar requires forgoing the airline-like paradigm that led SNCF to stagnation in the same decade. This clashes with British political theater now, but there’s no other way forward.
And this even affects domestic British rail planning. London planners are fixated on Paris as their main comparison. This way, they are certain trains must turn slowly at city terminals, requiring additional tracks at Euston and other stations that are or until recently were part of High Speed 2, at a total cost of several billion pounds. In Germany and the Netherlands (at Utrecht) trains can move faster, down to turns of seven to eight minutes on German regional trains and four to five minutes on intercity trains pinching at terminal stations like Frankfurt. But planners in large cities look down on smaller cities; it’s no different from how planners in New York assume that because New York is bigger than Stockholm, Second Avenue Subway’s stations have higher ridership than the stations of Citybanan (in fact, Citybanan’s two stations, located in city center, are significantly busier).
This way, a particular feature of historic Parisian stations – they have a lot of tracks – got turned into something that every city’s train station is assumed to have. It means Eurostar can’t operate into other stations, because there is no surplus of platforms allowing segregating service to the UK away from all other traffic; it also means that planners in the UK that are trying to engineer stations assume British stations must be overbuilt to Parisian specs.
Small Metros Aren’t Lean, They’re Underbuilt
Reece Martin does very good vlogs on public transportation, and has begun text-blogging more regularly, which I appreciate greatly. But a post of his from six days ago, talking about lean metros, misses a key aspect of short metro systems. He compares old legacy systems like Paris or New York or Berlin’s with newer ones, like Hong Kong’s, and points out that the newer ones are rather short relative to city size, saying that it’s a leaner, lower-cost way of doing things. But in fact, the reason we see such short metros relative to city size is not efficiency, but underbuilding, leading to overcrowding.
What’s a lean metro?
Reece divides leanness into two kinds. The first is the ability of some cities to build driverless metros with very short trains at very high frequencies, to save money on station construction. He gives the examples of Copenhagen and Vancouver. This is particularly common in Italy: Milan Metro Lines 4 and 5 have 50 meter long trains, the Turin Metro has 55 meter long trains, the Brescia Metro has 40 meter long trains. With this setup and with the generally low construction costs of Italy, even Brescia can afford a metro, in a city proper of 200,000 with a built-up urban area of 673,000 (and rising) as of 2011.
The second kind of leanness is just building fewer lines. He talks about Toronto’s system, with two main trunk lines, one branch line with a transfer to a main line, and a total of 70 km of length. He also brings up Hong Kong, which has, counting both proper metro lines and the two inherited commuter lines, around 212 route-km, with very high ridership. This can be supported through transit-oriented development, for which Hong Kong is famous. It can also come from strong bus-rail connections as in Toronto: a blog post from last decade that I can no longer find points out that York Mills has what looks like 14,000 weekday boardings on pre-corona numbers, despite low-density land use immediately surrounding it, because of the strong connecting buses on the Toronto grid, favorably comparing it with American metros like Washington’s.
Small station metros
I don’t want to criticize the Italian trend too much, but I do want to separate it from the other systems Reece calls lean. The issue with the style of construction used in Brescia is that it’s really good, if your city is the size of Brescia. Small-station, partly cut-and-cover driverless metros should be in the toolkit of metro areas of about a million people, in order to save money. Other tools should be heavily relying on legacy commuter lines (as in Zurich) and using trams if they’re available (as in Bratislava or Brno), and likely combining all three solutions when feasible (in fact Zurich has a large tramway network in addition to the S-Bahn).
In a larger city, such light metro lines are only useful in a very restricted set of circumstances. Singapore has short trains on the Circle Line – but the Circle Line has not been cheap to build, and its last section has been extraordinarily expensive. On a radial line, it’s a nonstarter. A large city needs the very high throughput of a driverless metro but also larger trains; those can be medium-length trains, like the 90 meter trains of Paris Métro Line 1, or longer, like the 138 meter long trains of the now-driverless legacy lines in Singapore, or the 200 meter long platforms of the Shinbundang Line in Seoul. If the line is too short, the city may find it needs to build another just for relief, as the area that was once thought peripheral develops.
Short metros
If a metro system is short, even if its trains are long, it’s not generally a sign of efficient construction in the city. It’s a sign of underbuilding and overcrowding.
Hong Kong has very high crowding levels, even with a system length that, counted properly, is not that unreasonable: the MTR’s total route-length is almost the same as that of the Paris Métro, which has 227 km, and its ridership is, on pre-corona numbers, slightly higher, 1.7 billion a year compared with 1.5 billion. Now, to be clear, Paris has very high ridership for the system’s size. I suspect the reason I’ve never seen overcrowding on the Métro is that the nature of Parisian job concentration is such that the lines that get overcrowded are ones connecting the suburbs with the city, that is, the RER and M13, rather than predominantly intra-city lines like M1. But the situation in Hong Kong is overall less one of leanness and more one of not being to expand as fast as it would like due to extreme construction costs, which are a strong contender for the world’s second worst, after New York’s. (Toronto is an even stronger contender.)
Then there are the developing-world metros that are just far too short for their city size. Hong Kong is a city of 7 million with a little more than 200 km of metro and commuter rail. Cairo is a metro area of 22 million with 100 km of metro. Cairene construction costs are high, but when, depending on how much one trusts dead links from 10 years ago, the city has the world’s highest rail ridership per km, it needs a lot more; that Cairo has 100 km of metro rather than 800 like Shanghai, a similar-size city in a country that, during its peak expansion, was about as rich as Egypt, is not about leanness but about the Egyptian government’s spending priorities.
For a middle-income country that wants to get out of the middle-income trap that Egypt is stuck in (or Brazil, home to the almost as underbuilt São Paulo Metro), China is a decent benchmark. So is Paris – France is rich but also, precisely because it’s rich, rather motorized by any developing country standards, leading to a modal split of about 43% public transit, 43% cars for work trips in Ile-de-France. Using these benchmarks, your city should have on the order of 30 km of metro and new commuter rail per million residents. If you have 4.5 like Cairo, it’s not efficiency, it’s total disinterest in the living standards of the urban population.
Cost-Plus Contracting is Good
Because I write a lot about government waste, I get to interact with people who complain a lot about government waste, which exposes me to a range of views, some more reasonable than others. The less reasonable views themselves range from unhinged rants to things that sound like they could be true, that may even be true for parts of contracting other than public transportation or infrastructure megaprojects. It’s one of the latter views that I wish to talk about here. It’s all too common, in my experience, for people who complain about government waste in the United States to speak ill of cost-plus contracting, which they claim (incorrectly but plausibly) is a form of a waste and even (much less plausibly) fraud, in which contractors get paid regardless of how poor the job is. In truth, the only good way to build infrastructure megaprojects is with itemized contracts and with generous public-sector assumption of risk; this isn’t called cost-plus in the literature but itemization, but is close enough that from the perspective of citizen-activists it should be viewed as a cost-plus variant.
Itemization versus fixed-price contracting
Contracts can, broadly, be either itemized or fixed-price, the latter also known as lump-sum. A fixed-price contract has a single cost line for the entire project; an itemized contract instead prices each section, and certain elements that are agreed to be outside the contractor’s control, like materials, are adjusted automatically if prices on the world market change.
There are also mixed models. For example, in Stockholm, some contracts are fixed-price, some itemized, and others use an intermediate system called fixed price with adjustable quantities, in which some elements are itemized but others are not. Turkish construction contracts itemize about 65% of the costs in detail, covering the civil infrastructure, and then take each of the main sub-items of the other 35% (at the detail level of ventilation, power design, sewage, etc.) as a fixed-price contract.
In Southern Europe and Turkey, the items are public, published transparently by the government, as an anti-corruption measure. These are detailed, and take different costs of living into account, and thus in Italy the prices, published by the state, may differ by region. If the itemized prices are unrealistic, then the contractors are allowed to demand more, but those itemized lists help ground the contract.
This system far outperforms fixed-price contracts. We have standard references on this, namely Ryan (1, 2) and Bolotnyy-Vasserman, finding that itemization for power plants (in Ryan) or road maintenance (in Bolotnyy-Vasserman) leads to reduced overall costs, by about 20%. The reasons are that fixed-price contracting leads to increased friction in change orders, and that, relatedly, fixed-price contracting imposes risk on the private contractor, leading to higher bids for compensation. For this reason, all low-construction cost environments we’ve investigated itemize, to a significant extent. The Nordic countries are moving from itemized to fixed-price contracting under the influence of British practices and the requests of large international firms that are used to doing business in English-speaking countries or in other high-cost countries, and as they do so, their costs are moving from low to medium, in addition to other bad reforms.
So why do people think itemization is bad?
The big multinationals are just used to fixed-price contracts. In New York (where it’s usually not big multinationals), an additional issue is that the contractors prefer to be paid upfront, due to delays in payment under itemization. But more commonly, the contractors just don’t like having to give exact specifications, and are used to environments where they don’t and don’t notice how the costs in those places are much higher than in places that don’t govern in English.
But government contractors are hardly a popular figure among people who complain about government waste. So what gives?
I suspect that this is about the sight of the government assuming risk for something a private contractor does. The sight of a contractor complaining about a problem that the government then has to pay extra for is repulsive to the general public, which assumes that something shady is going on, regardless of whether it is. This leads to political pressure to insulate the public sector from unexpected changes.
The problem is that there is no way to fully insulate the public sector. Once the megaproject has been decided, the political cost for the government of walking away is larger than the economic penalties for the concessionaire. In practice, every attempt to privatize risk will get contractors to bid higher, while still not protecting the public from the risk of large cost overruns. Turkey is somewhat exceptional in this, but it still itemizes, and the way it enforces the maximum 20% cost overrun is by having so many contractors that it’s easy to blacklist malefactors; this is not available in richer countries with fewer, larger firms.
Janno Lieber Lies to New York About Costs and Regulations
After being criticized about the excessive size of subway stations designed on his watch, MTA head Janno Lieber fired back defending the agency’s costs. In a conversation with the Manhattan Institute, he said about us, “They’re not wrong that the stations are where the MTA stations add cost. But they are wrong about how they compare us – the cost per mile is misleading” (see discussion on social media here). Then he blamed labor and the fire code. Blaming labor is a small but real part of the story; this is common among the white-collar managers Eric and I have talked to, and deserves a separate explanation for why this concern is overblown. But the issue of the fire code is fraud, all the way.
I’ve previously seen some journalists and advocates who write about American construction costs talk about fire safety, which is mentioned occasionally as a reason designs cannot be changed. It’s not at all what’s going on, for two separate reasons, each of which, alone, should be grounds to dismiss Lieber and ensure he never works for the state again.
The first reason is that the fire safety regulation in the United States for train stations, NFPA 130, has been exported to a number of other countries, none of which has American costs or the specific American tradition of overbuilding stations. China uses NFPA 130. So does Turkey. Spain uses a modification. We can look at their designs and see that they do not build oversize stations. I’ve seen an environmental impact analysis in Shanghai, with the help of a Chinese student studying this issue who explained the main planning concerns there. I could write an entire blog post about China (not a 10,000-word case report, of course), but suffice is to say, if the train is projected to be 160 m long, the station dig will be that plus a few meters – and Chinese stations have mezzanines as I understand it. Spanish and Turkish stations have little overage as well; building a dig twice as long as the station’s platforms to house back-of-the-house spaces is unique to most (not all) of the Anglosphere, as design consultants copy bad ideas from one another.
Even the claim that NFPA 130 requires full-length mezzanines is suspect. It requires stations to be built so that passengers can evacuate in four minutes in emergency conditions, rising to six minutes counting stragglers (technically, the throughput needs to be enough to evacuate in four minutes, but with latency it can go up to six). The four minute requirement can be satisfied on the lettered lines of the subway in New York with no mezzanines and just an access point at each end of the platform, but it’s close and there’s a case for another access point in the middle; no full-length mezzanine is required either way. If the stations are any shorter, as on the numbered lines or in other North American cities, two escalators and a wide staircase at the end of each platform are more than enough, and yet the extensive overage is common in those smaller systems too (for example, in Vancouver, the Broadway extension is planned with 128 m long digs for 75 m trains, per p. 9 here).
“Fire safety” is used as an excuse by people with neither engineering background nor respect for anything quantitative or technical. Lieber is such a person: his background is in law and he seems incurious about technical issues (and this is also true of his successor at MTA Capital Construction, public policy grad Jamie Torres-Springer).
Perhaps due to this lazy incuriosity, Lieber didn’t notice that the MTA has extensive influence on the text of NFPA 130, bringing us to the second reason his claim is fraudulent. NFPA 130 is not to blame – again, it’s the same code as in a number of low- and medium-cost countries – but Nilo Cobau explains that the NFPA process is such that big agencies have considerable input, since there aren’t many places in the US that build subways. Nolan Hicks pointed out in the same thread, all linked in the lede paragraph, that the MTA has a voting member and two alternates on the board that determines NFPA 130 and hasn’t requested changes – and that Montreal, subject to the same codes, built a station with little overage (he says 160 m digs for 150 m platforms).
The handwaving of a fire code that isn’t even different from that of cheaper places is there for one purpose only: to deflect blame. It was a struggle to get Lieber and other New York leaders to even admit they have high costs, so now they try to make it the fault of anyone but themselves: fire safety regulations, organized labor, what have you.
Labor is a real issue, unlike fire safety, but it’s overblown by managers who look down on line workers and have generally never been line workers. Lieber graduated law school, was hired by USDOT at either junior-appointed or mid-level civil servant role, I can’t tell which, and then did managerial jobs; his successor as head of MTA Construction and Development, Jamie Torres-Springer, graduated public policy. These aren’t people who worked themselves up from doing engineering, architecture, planning, or ethnographic work; add the general hostility American white-collar workers have toward blue-collar workers, and soon people in that milieu come to believe that just because their top 5%er wages are much higher than they could earn anywhere else in the world, the sandhogs also earn much more than they could anywhere else in the world, when in truth New York sandhog and Stockholm miner wages and benefits are very close.
Occasionally the point that it’s not wages but labor productivity seeps in. There, at last, we see a real problem with labor. Eric and I found that about a third of the sandhogs on Second Avenue Subway didn’t really need to be there. Further cuts could be achieved through the use of more labor-efficient techniques, which the MTA is uninterested in implementing. The rest of the American labor premium comes from excessive staffing of white-collar supervisors, including representatives from each utility, which insists that the MTA pay for the privilege of having such representatives tell them what they can and cannot do in lieu of mapping the utilities and sending over the blueprints. All included, labor was around 50% of the cost of Second Avenue Subway, where the norm in Italy, Turkey, and Sweden is around 25% (note how higher-wage Sweden is the same as lower-wage Italy and much lower-wage Turkey); excessive labor costs contributed a factor of 1.5 premium to the project, but the other factor of 6 came from excessive station size, deep mining of stations (which thankfully will not happen at 106th and 116th Street; it will at 125th but that’s unavoidable), lack of system standardization, and a litany of project delivery problems that are generally getting worse with every iteration. Lieber personally takes credit for some of the privatization of planning to design-build consultancies, though to be fair to him, the project delivery problems predate him, he just made things slightly worse.
A New York that wants to build will not have incompetent political appointees in charge. It will instead hire professionals with a track record of success; as no such people exist within the American infrastructure construction milieu, it should use its own size and prestige to find someone from a low-cost city to hire, who will speak English with an accent and know more engineering than American legal hermeneutics. And it will not reward people who defraud the public about the state of regulations just because they’re too lazy to know better.
The United States Learned Little from Obama-Era Rail Investment
A few days ago, the US Department of Transportation (USDOT) announced Bipartisan Infrastructure Law grants for intercity rail that are not part of the Northeast Corridor program. The total amount disbursed so far is $8.2 billion; more will come, but the slate of projects funded fills me with pessimism about the future of American intercity rail. The total amount of money at stake is a multiple of what the Obama-era stimulus offered, which included $8 billion for intercity rail. The current program has money to move things, but is repeating the mistakes of the Obama era, even as Secretary of Transportation Pete Buttigieg clearly wants to make a difference. I expect the money to, in 10 years, be barely visible as intercity rail improvement – just enough that aggrieved defenders will point to some half-built line or to a line where the program reduced trip times by 15 minutes for billions of dollars, but not enough to make a difference to intercity rail demand.
What happened in the Obama era
The American Recovery and Reinvestment Act (ARRA), better known as the Obama stimulus, included $8 billion for what was branded as high-speed rail. Obama and Secretary of Transportation Ray LaHood spoke favorably of European and East Asian high-speed rail at the time. And yet, the impetus to spread the money across multiple states’ programs meant that the sum was, by spending, around half for legacy rail projects euphemistically branded as higher-speed rail, a term that denotes “faster than the Amtrak average.” Ohio, Wisconsin, and Illinois happily applied that term to slow lines. The other half went to the Florida and California programs, which were genuinely high-speed rail. In Florida, the money was enough to build the first phase from Orlando to Tampa, together with a small state contribution.
Infamously, Governor Rick Scott rejected the money after he was elected in the 2010 midterms, and so did Governors Scott Walker (R-WI) and John Kasich (R-OH). The money was redistributed to states that wanted it, of which the largest sums went to California and Illinois. And yet, what California got was a fraction of the $10 billion that the High-Speed Rail Authority had been hoping for when it went to ballot in 2008; in turn, the cost overruns that were announced in 2011 meant that even the original hoped-for sum could not build a usable segment. The line has languished since, to the point that Governor Gavin Newsom said “let’s be real” regarding the prospects of finishing the line. Planning is continuing, and the mostly funded, under-construction segment connecting Bakersfield, Fresno, and Merced is slated to open 2030-33 (in 2008 the promise was Los Angeles-San Francisco by 2020), but this is a fraction of what was promised by cost or utility; Newsom even defended the Bakersfield-Merced segment on the merits, saying that connecting three small, decentralized metro areas to one another with no onward service to Los Angeles or San Francisco would provide good value and taking umbrage at the notion that it was a “train to nowhere.”
In Illinois, the money went toward improving the Chicago-St. Louis line. However, Union Pacific owns the tracks and demanded, as a precondition of allowing faster trains, that the money be spent on increasing its own capacity, leading to double-tracking on a line that only run five trains a day in each direction; service opened earlier this year, cutting trip times from 5:20-5:35 in 2010 to 4:46-5:03 now, at a cost of $2 billion. This is a 457 km line; the cost per kilometer was not much less than that of the greenfield commuter line to Lahti, which has an hourly commuter train averaging 96 km/h from Helsinki and a sometimes hourly, sometimes bihourly intercity train averaging 120. In effect, UP extracted so much surplus that a small improvement to an existing line cost almost as much as a greenfield medium-speed line.
Lessons not learned
The failure of the ARRA to lead to any noticeable improvement in rail service can be attributed to a number of factors:
- The money was spread thinly to avoid favoring just one state, which was perceived as politically unacceptable (somehow, spending money on a flashy project with no results to show for it was perceived as politically acceptable).
- The federal government could only spend the money on projects that the states planned and asked for – there was no independent federal planning.
- There was inattention to best practices in legacy rail planning, such as clockface timetabling, higher cant deficiency (allowed by FRA regulation since 2010), etc.; while the high-speed rail program aimed to imitate European and East Asian examples, the legacy program had little interest in doing so, even though successful legacy rail improvements in such countries as the UK, Germany, Sweden, Switzerland, Austria, and the Netherlands were available already.
- A dual mandate of both jobs and infrastructure, so that high costs were a positive to an interest group that the federal government and the states announced they wanted to support.
- California specifically was a series of unforced errors, including a politicized High-Speed Rail Authority board representing parochial rather than statewide interests, disinterest in developing any state capacity to plan things (the expression “state capacity” wouldn’t even enter common American political discourse until the late 2010s), early commitment, and, once the combo of cost overruns and insufficient money on hand meant the project had no hope of finishing in the political lifetime of anyone important, disinterest in expediting things.
I have not seen any indication that Buttigieg and his staff learned any of these lessons, and I have seen some indication that they have not.
For one, the dual mandate problem is if anything getting worse, with constant invocations of job creation even as unemployment is below 4% where in 2010 it was 10%, and with growing protectionism; the US has practically no internal market for modern rolling stock and the recent spate of protectionism is leading to surging costs, where until recently there was no American rolling stock cost premium. This is not an intercity rail problem but an infrastructure problem in general in the US, and every time a politician says “this will create jobs,” a surplus-extracting actor gets their wings.
Then, even though the NGO space has increasingly been figuring out some best practices for regional trains, there is still no integration of these practices into infrastructure planning. The allergy to electrification remains, and mainline rail agency officials keep making things up about rest-of-world practices and getting rewarded for it with funds. Despite wide recognition of the extent of surplus extraction by the Class I freight carriers, there is no attempt to steer funding toward lines that are already owned by passenger rail-focused public-sector carriers, like the Los Angeles-San Diego line, much of the Chicago-Detroit line, and the New York-Albany line.
The lack of independent federal planning is if anything getting worse, relative to circumstances. In the Obama era, the Northeast Corridor was put aside. Today, it is the centerpiece of the investment program; I’ve been told that Biden asks about it at briefings about transportation investment and views it as his personal legacy. Well, it could be, but that would require toothy federal planning, and this doesn’t really exist – instead, the investment program is a staple job of parochial interests. Based on this, I doubt that there’s been any progress in federal planning for intercity rail outside the Northeast.
And finally, the money is still being spread too thinly. California is getting $3.1 billion, which is close to but not quite enough to complete Bakersfield-Merced, whose cost is in year-of-expenditure dollars at this point $34 billion for a 275 km system in the easiest geography it could possibly have. Another $3 billion is slated to go to Brightline West, a private scheme to run high-speed trains from Rancho Cucamonga in exurban Los Angeles, about 65 km from city center, to a greenfield site 4 km south of the Las Vegas Strip; the overall cost of the line is projected at $12 billion over a distance of 350 km. It’s likely that this split is worse than either giving all $6 billion to California or giving all of it to Brightline West. But as I am going to point out in the following section, it’s worse than giving the money to places that are not the Western United States.
The frustrating thing is that, just as I am told that Biden deeply cares about the Northeast Corridor, Buttigieg has been quoted as saying that he cares about developing at least one high-speed rail line, as a legacy that he can point to and say “I did that.” Buttigieg is a papabile for the 2028 presidential primary, and is young enough he can delay running for many cycles if he feels 2028 is not the right time, to the point that “I built that” will strengthen his political prospects even if he has to wait until opening in the 2030s. And yet, the money committed will not build high-speed rail. It might build a demonstration segment in California, but a Bakersfield-Fresno line and even a Bakersfield-Merced one with additional funds would scream “white elephant” to the general public.
Is it salvagable?
Yes.
There are, as I understand it, $21.8 billion in uncommitted funds.
What the $21.8 billion is required to achieve is a) a complete high-speed line, b) not touching the Northeast Corridor (which is funded separately and also poorly), c) connecting cities of sufficient size that passenger ridership would make people say “this is a worthy government investment” rather than “this is a bridge to nowhere on steroids.” Even a complete Los Angeles-Las Vegas line is not guaranteed to be it, and Brightline West is saving money by dumping passengers tens of kilometers along congested roads from Downtown Los Angeles.
Given adequate cost control, Chicago-Detroit/Cleveland is viable. It’s around 370 km Chicago-Toledo, 100 km Toledo-Detroit, 180 km Toledo-Cleveland, depending on alignments chosen; $21.8 billion can build it at the same cost projected for Brightline West, in easier topography. If money is almost but not quite enough, then either Cleveland or Detroit can be dropped, which would make the system substantially less valuable but still create some demand for completing the system (Michigan could fund Toledo-Detroit with state money, for example).
But this means that all or nearly all of the remaining funds need to go into that one basket, and Buttigieg needs to gamble that it works. This requires federal coordination – none of the four states on the line has the ability to plan it by itself, and two of them, Indiana and Ohio, are actively hostile. It’s politically fine as a geographic split as it is – that part of the Midwest is sacralized in American political discourse due to its industrial history, which history has also supplied it with large cities that could fill trains to Chicago and even to one another; politicians can more safely call Los Angeles “not real America” than they can Detroit and Cleveland.
But so far, the way the Northeast Corridor money and the recently-announced $8.2 billion for non-Northeast Corridor service have been spent fills me with confidence that this will not be done. The program is salvageable, but I don’t think it will be salvaged. There’s just no interest in having the federal government do this by itself as far as I can see, and the state programs are either horrifically expensive (California) or too compromised (Midwest, Southeast, Pacific Northwest).
So what I expect will happen is more spreading of the money to lines averaging 100 km/h or less, plus maybe some incomplete grants to marginal high-speed lines (Atlanta-Charlotte is a contender, but would get little traffic until it connects to the Northeast Corridor and would cost nearly the entire remaining pot). Every government source will insist that this is high-speed rail. Some parts will be built and end up failing to achieve much, like Chicago-St. Louis. Every person who is not already bought in will learn that the government is inefficient and it’s better to cut taxes instead, as is already done in Massachusetts. Americans will keep making excuses for why it’s just not possible to have what European and a growing list of Asian countries have, or perhaps why there’s no point in it since if it were good it would have been invented by the American private sector.
The MTA Sticks to Its Oversize Stations
In our construction costs report, we highlighted the vast size of the station digs for Second Avenue Subway Phase 1 as one of the primary reasons for the project’s extreme costs. The project’s three new stations cost about three times as much as they should have, even keeping all other issues equal: 96th Street’s dig is about three times as long as necessary based on the trains’ length, and 72nd and 86th Street’s are about twice as long but the stations were mined rather than built cut-and-cover, raising their costs to match that of 96th each. In most comparable cases we’ve found, including Paris, Istanbul, Rome, Stockholm, and (to some extent) Berlin, station digs are barely longer than the minimum necessary for the train platform.
MTA Construction and Development has chosen to keep building oversize stations for Second Avenue Subway Phase 2, a project that despite being for the most part easier than the already-open Phase 1, is projected to cost slightly more per kilometer. Nolan Hicks at the New York Post just published a profile diagram:

The enormous size of 125th Street Station is not going to be a grand civic space. As the diagram indicates, the length of the dig past the platforms will not be accessible to passengers. Instead, it will be used for staff and mechanical rooms. Each department wants its own dedicated space, and at no point has MTA leadership told them no.
Worse, this is the station that has to be mined, since it goes under the Lexington Avenue Line. A high-cost construction technique here is unavoidable, which means that the value of avoiding extra costs is higher than at a shallow cut-and-cover dig like those of 106th and 116th Streets. Hence, the $1 billion hard cost of a single station. This is an understandable cost for a commuter rail station mined under a city center, with four tracks and long trains; on a subway, even one with trains the length of those of the New York City Subway, it is not excusable.
When we researched the case report on Phase 1, one of the things we were told is that the reason for the large size of the stations is that within the MTA, New York City Transit is the prestige agency and gets to call the shots; Capital Construction, now Construction and Development, is smaller and lacks the power to tell NYCT no, and from NYCT’s perspective, giving each department its own break rooms is free money from outside. One of the potential solutions we considered was changing the organizational chart of the agency so that C&D would be grouped with general public works and infrastructure agencies and not with NYCT.
But now the head of the MTA is Janno Lieber, who came from C&D. He knows about our report. So does C&D head Jamie Torres-Springer. When one of Torres-Springer’s staffers said a year ago that of course Second Avenue Subway needs more circulation space than Citybanan in Stockholm, since it has higher ridership (in fact, in 2019 the ridership at each of the two Citybana stations, e.g. pp. 39 and 41, was higher than at each of the three Second Avenue Subway stations), the Stockholm reference wasn’t random. They no longer make that false claim. But they stick to the conclusion that is based on this and similar false claims – namely, that it’s normal to build underground urban rail stations with digs that are twice as long as the platform.
When I call for removing Lieber and Torres-Springer from their positions, publicly, and without a soft landing, this is what I mean. They waste money, and so far, they’ve been rewarded: Phase 2 has received a Full Funding Grant Agreement (FFGA) from the United States Department of Transportation, giving federal imprimatur to the transparently overly expensive design. When they retire, their successors will get to see that incompetence and multi-billion dollar waste is rewarded, and will aim to imitate that. If, in contrast, the governor does the right thing and replaces Lieber and Torres-Springer with people who are not incurious hacks – people who don’t come from the usual milieu of political appointments in the United States but have a track record of success (which, in construction, means not hiring someone from an English-speaking country) – then the message will be the exact opposite: do a good job or else.
