Category: Urban Transit
The Lagos Metro
Lagos is the second-largest city in the world without rail rapid transit (the largest is Karachi). Sources disagree on its population, but it looks like 21 million in the built-up area, consisting of most of Lagos State plus a few suburbs just outside it, such as Ota and Ijoko – in total, 1,000 km^2, someone more including the suburbs. All of the problems that rapid transit intends to fix – traffic jams, pollution, long commutes, overcrowding, unpopular jitneys – are present. I don’t want to repeat the case I made in this post in favor of aggressive investment in subway systems in Lagos and other big third-world cities. Instead, I want to talk about concrete features.
Here is the map – it’s slightly different from the version I circulated in previous posts. Note the following features:
1. Four of the lines – East-West (blue), Main Line (red), Ikorodu (brown), North-South (purple) – are four-track. This is because Lagos is so big that its outer margins require very wide stop spacing, which requires four tracks. The first three also run in wide enough rights-of-way for significant stretches, making four-track elevated structures easier to construct. Express stops are denoted with squares, local ones with circles. If two four-track lines intersect, the stop is denoted with a square, and is express for both lines. All four-track lines have two-track tails – the farthest-out square is the last station with four tracks, where locals turn, while expresses keep going to the end. Only one four-track line has an end without a tail: the Main Line terminates all trains at Leventis.
2. On the four-track stretches, the average interstation is a little less than 4 km. Average speed can approach 60 km/h, given that the rights-of-way are often quite straight. On the local tails of these lines the average looks like 2 km, or around 50 km/h. On the two-track radial lines, the average interstation is a little less than 1.5 km, or around 40 km/h; the difference with the local tails of the four-track lines is that the local tails are in suburban areas.
3. Every pair of radials intersects, usually in Lagos Island but sometimes elsewhere. Four circumferentials – Apapa (dark red), University (ochre), Ishaga (dark green), Idimu (magenta) – intersect all the radials. Whenever two lines intersect, there’s a station. Doing this requires a lot of lines to run in the same alignment in the center. This is not track sharing, but multi-track tunnels. The only eight-track tunnel, where the Main and Ikorodu Lines run together between Eko Bridge and Leventis, has a wide road to go under; the only ten-track el, where the East-West, Ota, and Ikorodu Lines parallel around the National Theatre, has an entire expressway to go over.
4. The southern ends of the Ota (yellow) and Ikeja (silver) Lines are in open water today. This is because the area is slated for land reclamation and intense development, called Eko Atlantic. The western margin of that area, around the station I call Eko Atlantic, is already reclaimed, but still undeveloped. That entire area (Victoria Island) is the favored quarter of Lagos, and is commercializing; farther east, in Lekki, there are grand plans for suburban redevelopment, and an immense amount of casual marketing in the media (“buy now and the land will triple its price in five years”).
The system I’m proposing differs from the current proposal. The current proposal only has five radials (with apparently just one crossing from the Mainland to Lagos Island), corresponding to my East-West Line, Main Line, Ota Line, and a hybrid of the Ikorodu Line and the two branches of the North-South Line; there is one circumferential, vaguely corresponding to my Idimu Line.
Some of the features of the current proposal are a good start. It’s not possible to build eighteen lines at once, and some prioritization is required. It’s even fine to start with shared tracks into Lagos Island and subsequently give lines their own way into Lagos Island. (On my map, everything paralleling the three existing road bridges is a bridge, the rest are tunnels).
However, the existing proposal suffers from several shortcomings, which will need to be fixed later:
- The stop spacing is too wide even in the center, intermediate between my local and express tracks.
- There is far too much branching. In any reasonable sequencing of the lines, the East-West Line will fill before the later ones (i.e. the ones going north-northeast) open, requiring new routes into Lagos Island.
- There isn’t enough service in Victoria Island, which is developing as a CBD, as is common for rich neighborhoods.
But the worst problem is that the under-construction route goes elevated along the Ring Road, skirting Lagos Island, with just two stops, Ebute Ero and Marina. This segment has little value and should be demolished once direct underground routes with more stops open. According to a paper that’s no longer online, one of the reasons third-world subway lines tend to underperform ridership expectations is that many of them use available rights-of-way and skirt the CBD, instead of building short tunnels to get to the center. This paper in turns is one of the references used by Bent Flyvbjerg in his paper arguing that in general urban rail has cost overruns and ridership shortfalls.
The big obstacle for constructing any subway system is cost. This is especially true in Lagos, where the construction cost of the current project (the Blue Line, corresponding to the inner part of the western half of my East-West Line) looks like $180 million per km, entirely elevated. I say “looks like” because while the cost is consistently $2-2.4 billion in exchange rate terms (around $5 billion in PPP terms), it’s not completely clear whether this is the Blue Line or also the Red Line.
My proposal is largely elevated, but the Lagos Island segments have to be tunneled. So do some other segments, for examples the inner parts of the North-South and Ikeja Lines, and most circumferentials. The system, totaling about 900 km, of which 200 is four-tracked, looks like it could be built only about one-quarter underground, or slightly more. Moreover, much of the underground construction could be cut-and-cover, including several segments in Lagos Island, and most of the circumferentials; only the underwater crossings and a few off-grid Lagos Island connections have to be bored.
The main analytic point here, carrying over to other cities, is the importance of prior planning. My map has 18 lines. This is useful because figuring out where stations should go, which stations on four-track lines get to be express stops, and how to sequence the lines should be based on long-term considerations. As I hinted in a post written right after I finished the first version of this map, about subway lines that intersect without a transfer, building the best lines 1-3 requires having a good idea where lines 4-12 will go. So even if Nigeria runs out of money after the first two lines are built, figuring out the built-out network is not useless – it informs the current network, and makes adding future lines less painful.
This is true for reducing construction costs, and not just for a good network. One of the positive features of the Paris Metro is that nearly all of it was planned as a whole, and as a result, difficult stations like Chatelet, Etoile, and Nation were built with the intention to have multiple Metro lines serve them. This meant that the stations could be built once, rather than multiple times, once for each line. Two lines, Metro 8 and 9, even run alongside each other for 1.7 km under the Grands Boulevards, which are wide enough for a four-track subway.
The planners of every system, regardless of whether it’s a metro for a city that doesn’t have any urban rail or an extension in a city with fifteen lines, should always think ahead. What are the future plans? What are the future needs? What is the expected future growth? In Lagos, the answer to the last question is “fast demographic and economic growth,” and this means the city should plan on a large system – hence my almost gridlike system of radials going north and northwest and circumferentials crossing the Mainland going southwest to northeast. But really, every city needs to ask itself how it wants its rail network to look, and plan the highest-priority segments accordingly.
Line Spacing, and Intersections Without Transfers (Hoisted from Comments)
This post is inspired by two separate things. The first is my work on a fantasy subway map for Lagos; here is the current live version. There are twelve radial lines, all serving the western half of Lagos Island, converging on nine transfer stations. Under the principle that whenever two lines intersect there should be a transfer station, this greatly constrains the paths the lines can take. Result: the path between two CBD stations, Eko Bridge and Leventis, carries ten tracks underneath it. This is under a wide street, and it might be possible with a double-deck four-track-wide tunnel and two more tracks deep-boring around it, but it’s not easy to construct.
The second inspiration is a post by Brian Stokle about subway line spacing. Brian looks not at spacing between successive stops on one line, but at spacing between parallel lines, averaging a few North American examples. The average is a little higher than half a kilometer, narrower than the typical stop spacing. On Twitter, Joshua Mello notes Boston’s spacing was narrower; in comments, I add examples from New York and Paris, which are a bit narrower than Brian’s examples but wider than Boston (New York is one block in Midtown, so 280 meters, and Paris is 300 between Metro 3 and Metro 8 and 9).
These two examples together illustrate the tradeoff in subway construction. Most subways have a stop every 1-1.5 km; newer systems are at the high end of this range, mostly because of the demographic weight of China. It’s normal for stop spacing to tighten in the core, but not to a large extent. In Tokyo, the average stop spacing is 1.2 km, and in Central Tokyo it’s perhaps 800 meters. In London, the Tube lines seem to tighten from an average of 1.2-1.5 km to 600-800 meters in Central London.
At the same time, subway line spacing is necessarily short. The reason is that modern CBDs are geographically small. Midtown is maybe 4 km^2, from 30th to 60th Streets and from between 2nd and 3rd Avenues to between 8th and 9th. The Paris CBD, from just west of Les Halles to just east of Etoile, is also about 4 km^2 (see job density on PDF-p. 6 here). The Tokyo CBD, defined around Otemachi, Nihonbashi, Hibiya, Shimbashi, and increasingly Roppongi, is maybe 5-6 km^2, in a metro area of 38 million people.
Subway networks in such CBDs are necessarily crowded. The CBD is where people want to go. A subway line can get away with skirting it – Paris M4 does, and is in a near-tie with M1 for highest ridership per km. But avoiding it entirely is a ridership killer, except specifically for circumferential lines concentrating off-CBD travel: in Paris this suppresses M10 ridership, and in New York, it suppresses ridership on the J/Z (even though they serve Lower Manhattan) and the L (even though it serves Union Square). This means that the CBD of a large city will have many subway lines converging on a relatively small area. New York has its five north-south lines through Midtown.
Ensuring that every pair of intersecting subway lines has a transfer in this environment is difficult. Line spacing is usually narrower than station spacing, requiring kludges like the block-long walkways in New York, such as between Times Square at 42nd/7th and Port Authority at 42nd/8th. Paris managed to have an almost perfect network – before M14 was built, it only had one missed connection, between M9 and M12 (built by a competing private company) – but only by having very short station spacing, unusual even by the standards of the early 1900s, ruling out significant suburban extensions of the kind that are routine in London and Tokyo.
The situation in smaller cities is actually easier. The CBD is very small, often smaller than a square kilometer, but there are fewer lines, so it’s easier to make sure lines intersect properly. It’s also much easier to get line spacing right outside the CBD, where there’s less intense demand, allowing line spacing compatible with stop spacing on any intersecting or circumferential line.
The fundamental issue here is really about planning for the future. It’s not hard to gets lines 1, 2, and 3 to intersect nicely, or even lines 1-6. But beyond that, a city will often find itself in a situation where the best street alignment for line 7 happens to be right between two stations on line 1, spaced too far apart for a transfer. This is what happened to Tokyo. In New York, the three constituent systems (IRT, BMT, and IND) were each internally planned cohesively, so when two lines within the same system intersect, there’s a transfer, and, with difficulty, the IRT/BMT intersections have transfers as well. But the IND connects poorly to the other two systems, sometimes deliberately, and the IND’s layout made future extensions and service changes break transfers. My proposal to reduce reverse-branching in New York runs into the problem of breaking the transfers designed by the IND around a specific service plan.
When lines are designed together, it’s easier to avoid this problem. Paris M8 and M9 share a route through the center, as they were built simultaneously as the street is wide enough for four tracks. In contrast, building a line under or next to an existing line is much more difficult; New York did it anyway, under Sixth Avenue, but this led to cost overruns that doomed the IND’s early plans for further expansion. It is also difficult to build a new station under an existing transfer station, as it usually requires underpinning; in Paris, this problem means that transfer stations tend not to have closely-aligned platforms, requiring long walks between lines. When I’m proposing running multiple lines in the same tunnel in Lagos, this is from the point of view of assuming coordinated planning, with sequencing that allows entire streets to be dug up at once.
However, in reality, even coordinated design has its limitations. Subway networks take multiple decades to build, and in the interim, the city changes. Planners can attempt to use zoning to shape city development in a way that facilitates further expansion, but some tendencies are too uncontrollable. For instance, high-income neighborhoods tend to commercialize; I mentioned Roppongi as a growing part of the Tokyo CBD earlier, which is an example of this trend. The hottest new part of New York commercial development, the Meatpacking District, is really not a subway hub. This means that even if a city plans out lines 1-12 to share tunnels appropriately, it may not be able to control where there will arise the most demand for line 13. Coordinated long-term planning makes things easier, but it will not solve the basic problem of optimal subway spacing and CBD size.
Modeling Jitney-Bus Competition
I just published a piece at the Bay City Beacon about Lyft Shuttle, the company’s foray into fixed-route buses. In the piece, I mentioned briefly that adding a competing operator can reduce the average quality of service. The piece, nominally 500 words, really 700, was far too short for me to expound on the model, even though people on social media had asked me about it before. So here it is.
The first assumption is that the routes are identical. This is largely true for some of the more northern Lyft Shuttle routes, duplicating Muni’s 2 and 41 buses (the 41 duplicator skips some inner stops, though).
The second assumption is that the bus has a fixed schedule, but the jitney can schedule itself in response to the bus. This is true of the case studies I know of (and, to make it very clear, “case study” means “I’ve read an article” or “I’ve heard it discussed on social media”): Israel’s Sherut vans, and Hudson County’s private jitneys. Both use dynamic schedules, which in plain English means drivers radioing each other (in Israel) or employing lookouts (in New Jersey); the bus companies have fixed schedules that are slower to change.
The third assumption is that marginal riders take whichever route they see first. This is the case with regular jitneys. Not all riders are marginal: there might be an explicit ethnic dimension, e.g. dollar vans in New York are more popular with unassimilated immigrants, because they provide amenities like use of their own language rather than English. Lyft Shuttle is booked via app, so the situation there is murkier; however, most likely the use case will involve passengers buying a ticket a few minutes in advance, possibly checking against a bus app to see which will come first. Some people will stick with one system over the other (tech boosters seem to hate public services, people without other reasons to download the Lyft app will probably stick to the bus), but some will be flexible.
Let us work this out first assuming perfect scheduling and then introducing schedule irregularities due to bunching.
Now, let’s assume the public bus arrives every 6 minutes. If the transit agency wishes to double service, it will schedule additional service at the midpoint between each pair of successive trips, providing 3-minute frequency. But if additional service comes from a private operator, the incentive is to schedule to compete and not to cooperate. Say the public bus arrives at my station at :00 on a 6-minute takt. The private operator can schedule itself to arrive at :03 on a 6-minute takt and get half of my station’s traffic, or it can schedule itself at :05 and get 5/6 of its traffic. Let’s set the fudge factor at 1 minute for now: if the separation is smaller, for example if the jitney comes at :05:30 and the public bus at :06, then I see both at the same time and am indifferent as to which to ride.
By itself, this still means adding service. However, it’s likely that there is going to be some service diversion – that some public bus riders will switch to the private service (e.g. because it usually comes first). If one quarter of the bus riders switch, then the schedule is cut to a bus every 8 minutes. The jitney still aims to arrive 1 minute before the bus for maximum revenue, perhaps getting bigger vehicles if it needs the capacity, as the New Jersey jitneys did. So now my bus comes at :00, :08, etc., and the jitney comes at :07, :15, etc. Average wait time is 3.125 minutes, whereas before it was 3 minutes.
The formula in general if both vehicles come every x minutes and are separated by 1 minute is 

Now, let’s introduce schedule irregularity into this system. As a toy model, let’s look at what happens if the bus can be up to 1 minute behind or ahead. If the route only has public buses, and one bus is off by 1 minute, then instead of two 6-minute gaps there’s a 5-minute gap and a 7-minute gap, for an average wait of 3:05. If the route has public buses and jitneys, scheduled 1 minute apart as above, then a 1-minute error is good for passengers if it evens out the schedules (it converts a 3.125-minute wait to a 2.5-minute wait), but bad for passengers if it makes the bus and the jitney arrive at exactly the same time (the wait rises to 4 minutes).
But really, bus schedules are an unstable equilibrium. (So are train schedules, but the instability is too slow to cause bunching). If a bus is a minute behind, then at the next bus stop it will have an above-average crowd size, since people had more time to show up and wait. Boarding time is a significant fraction of bus travel time, so the bus will go behind even further, until the bus behind it will catch up, at which point the two buses will leapfrog each other. It’s possible to reduce this effect by cutting boarding time, via low-floor buses and off-board fare collection with all-door boarding; Muni has implemented both, but this is still not enough to remove the instability. In practice, this imposes a minimum headway of about 3 minutes – below it, buses bunch so much that adding service doesn’t add any capacity. In theory it’s possible to go lower, but when ridership is high enough to justify 3-minute headways, it’s high enough for dwell times to make lower headways infeasible.
Jitneys do not have a 3-minute minimum headway; they’re more flexible about running express if they’re already full. This, in turn, means that schedules on jitney routes are more irregular than on buses, making wait times less predictable, and ultimately longer (since, at equal service, less even intervals translate to longer average waits). But more to the point, jitneys still aim to schedule themselves to come just before the bus does. This means that jitney arrival irregularity largely tracks bus arrival irregularity. So with this in mind, if the city bus gets delayed by a minute again, and the jitney adjusts, then we have the following service gaps, in minutes: 8, 1, 6, 1. Average wait time is now 3.1875 minutes.
So the question is, what effect does demand diversion from buses to jitneys have on bus irregularity? The answer is, not much. This depends on additional assumptions on dwell times and the initial delay. Delays compound exponentially, but the exponent (“Lyapunov exponent” in dynamics) is low; on a 6-minute bus route, a 1-minute delay means that future dwell times go up by 1/6, and at 2.5 seconds of variable dwell time per boarding or alighting (Muni average with all-door boarding, see PDF-p. 16 here) it takes 60*6/2.5 = 144 boardings and alightings to delay the schedule by another minute. Muni averages 127 boardings and alightings per hour, so it takes more than an hour for the 1 minute of delay to compound by another minute (strictly speaking, by ![\sqrt[6]{e} \approx 1.18](https://s0.wp.com/latex.php?latex=%5Csqrt%5B6%5D%7Be%7D+%5Capprox+1.18&bg=ffffff&fg=000000&s=0&c=20201002)
The point of this exercise is that on the timescales relevant to a bus route, schedule irregularity is approximately linear. So demand diversion from buses to jitneys has a linear effect on schedule irregularity: 25% diversion means that instead of a 1-minute delay there’s only a 45-second delay. A 1-minute delay with 6-minute buses is still better than no delay with 8-minute buses an jitney spaced a minute apart, so the jitneys still remove value. At higher delays, this is no longer true (average wait time is quadratic in the delay); the point of equality is about 1.61 minutes of bus delay due to schedule instability (other delays, like traffic, affect all routes equally regardless of frequency). So jitneys can add value on long, busy routes (don’t forget – the lower the headway, the more significant the assumed 1-minute separation is). But the routes the Lyft Shuttle jitney runs are less busy, and more importantly are short, with less opportunity for delay compounding; delays do not compound past the terminus with decent dispatching.
The upshot is that jitneys do not universally remove value from transportation networks. But on short 6-minute routes, they do even under mild assumptions on ridership diversion. There’s more service in operation, but from the riders’ perspective, wait times have increased and regularity has degraded. The logic of competing private companies is not always the logic of better service for passengers. Sometimes, having a government monopoly inherently improves efficiency.
Quick Note: What a Few Pictures Tell Us About BRT
The Boston BRT initiative is pushing hard for what it calls gold standard BRT in Boston, with the support of ITDP. Backed by a Barr Foundation grant, it launched a competition for pilot routes. Two years ago to the day, Ari Ofsevit already wrote a takedown of the idea of gold standard BRT in Boston, comparing the street width in Boston to the street widths in Bogota and Mexico City. In brief, most of Bogota’s BRT network runs on streets wider than 40 meters, and the rest is still 30-something; in Boston nothing is that wide except streets that have light rail in their medians like Commonwealth Avenue and Beacon Street, and the key corridors have segments going below 20.
In response to this problem, here is the photo Boston BRT is using to illustrate the technology:

I am not sure where this photo was taken. Judging by the 60 speed limit sign, it can’t be in the US. What we see in the photo is 4 travel lanes in each direction (2 car, 2 bus), a generous median for the station, generous medians on both sides of the main road, and service lanes. Paris’s 80-meter-wide Cours de Vincennes has in each direction a service lane, two parking lanes, one bus lane, and three car lanes, but no median between the two main carriageways. The depicted street has to be wider, which means it’s wider in meters than most Boston arterials are in feet. It’s very wide by the standards of Mexico City, Curitiba, and Bogota.
The BRT Report for Boston depicts another picture in that flavor on PDF-p. 14. It is also painfully misleading about existing BRT lines: its blurb about Mexico City omits the fact that the city has a large, expanding subway network with almost as much ridership as New York’s, and alongside Mexico; its blurb about Cleveland’s HealthLine BRT omits all the internal problems of the line, which make Cleveland urbanists denigrate it as a poor transportation solution.
BRT is a useful tool in cities’ kit for solving transportation problems. But proponents have to be honest about the tradeoffs involves: it is cheaper than a subway but also slower, less comfortable, and more expensive to operate; and it requires difficult choices about how to allocate street space. There are many examples of BRT on streets going down to about 30 meters, and Boston BRT could have also chosen to depict even narrower streets, to be relevant to Boston. Instead, it’s engaging in subterfuge: the report is claiming that BRT is faster than light rail and implying it’s the primary transit mode in Mexico City, and by the same token, the pictures all show wide enough streets for anything.
Core Connectors and In-Between Neighborhoods, Redux
Five years ago, I wrote about how American cities’ transit priorities cause them to underrate the neighborhoods with the best potential, which typically are also the poorer ones. Those are the in-between neighborhoods: beyond the gentrified core of the city, which is often within walking distance of the CBD in a small region, but not so far that they’re really suburbs. Instead of serving these neighborhoods, cities that want to look like they’re redeveloping build core connectors, i.e. short-range transit services within the gentrified (or gentrifying) center. I was specifically complaining about two plans, one in Providence and one in New Haven. The Providence plan involved a mixed-traffic streetcar, which has since been downgraded to a frequent bus. It’s this project that I wish to talk about in this post.
First, some background: in the 2000s and early 2010s, Rhode Island realigned I-195. This project, called Iway, rebuilt a segment of the freeway to higher standards, but also moved it so as to no longer cut off the Jewelry District from the CBD (called Downcity). Iway turned the Jewelry District from a post-industrial neighborhood to the next (possibly the only) frontier of gentrification in the city, and state elites needed to decide what to do with all this land. This led to plans to build what was in vogue in the late 2000s and early 2010s: a mixed-traffic streetcar, which would connect the Rhode Island Hospital and Jewelry District with Downcity and continue either north to the train station, or east to College Hill via the East Side Tunnel, a short bus-only tunnel cutting off a steep hill between Downcity and the Brown campus. This was from the start bad transit, and we in the Greater City community were skeptical. The plan was eventually scuttled, and the website’s registration lapsed without any redirect to the new plan, which is BRT.
The new BRT route is going between the train station and the Jewelry District. It’s planned to be very frequent, with a bus every 4-5 minutes, appropriate for the short length of the route, about 2 km between the hospital and the train station. The plan is to build open rather than closed BRT, with several branches interlining on the route. Overall, it looks like RIPTA is doing BRT right. And yet, it’s a terrible project.
The top bus corridor in Rhode Island is the R route (for Rapid), formed from the former 99 and 11 buses, which were by far the top two in ridership. It runs every 10 minutes, between Pawtucket and South Providence, serving some of the poorest parts of an already poor urban area. It has some BRT treatments, including hard-fought signal priority (Governor Carcieri vetoed it six times, and it took until the more progressive Lincoln Chafee replaced him for signal priority to go ahead). But buses run in mixed traffic, and fare collection is on-board. If any route deserves better frequency, it’s this one.
Moreover, the attempt to shoehorn multiple routes through the BRT path is compromising those routes. The R route is already detouring through the train station, which the old 99 route did not serve, and which forces a few minutes’ detour. Another bus, route 1, does not currently serve the train station, but will be rerouted once the BRT path opens; route 1 goes through the East Side tunnel, and making it detour to the train station would give it an especially circuitous path between the East Side and Downcity (the 1 already detours to enter the hospital, which is set back from the street). This, in turn, compromises the usefulness of the tunnel, which is that it interlines several routes between Downcity and Brown, which then go in different direction east of Brown.
There are potentially strong east-west corridors that could receive the R treatment. In the east, off-board fare collection on the buses using the tunnel would considerably speed up service. In the west, there are a few potentially strong routes: Broadway (carrying the 27 and 28 to Olneyville), Atwells in Federal Hill (carrying the 92 fake trolley, which runs through to the East Side and used to use the tunnel), and Westminster/Cranston (carrying the 17, 19, and 31). The highly-branched nature of the routes east of the tunnel makes through-service dicey, and this in turn is a matter of a broken bus network in East Providence. But overall, demand roughly matches that of the strongest corridor on the west, which is either Broadway or Westminster/Cranston, depending on how much branching one tolerates. This would create a second rapid bus trunk between College Hill and Olneyville. So why is the city investing in another route?
It’s not the train station. The train station itself is not a compelling transit destination. It’s too close to Downcity; even with a 5-minute bus frequency, it’s faster to walk from the central bus transfer point at Kennedy Plaza (or to the nearest point on the old 99 route on North Main or Canal) than to transfer to the right bus. It should be served by the routes for which it’s on the way, for example the northwest-bound 50, 56, and 57 routes. It’s unlikely anyone will transfer to a bus to the train station. Nor is it likely anyone will take the 1 from College Hill to the train station: walking downhill takes 15 minutes, and people going to a train station need more reliability than a mixed-traffic bus can provide. Walking uphill is more difficult, and there is less need for reliability, but even then, it seems that most people walk. This means the only real use of the train station connection is for people from the Jewelry District.
This brings me to the Jewelry District itself. The city wants to redevelop it, but it is not yet much of a destination. Nor is Providence itching for new development sites: residential rents are affordable on the East Side, and Downcity commercial property values are so low that the city’s tallest building is empty and was said at appraisal to have no value. So why the rush to give the Jewelry District better public transit than existing neighborhoods that direly need it, like South Providence, Olneyville, and Pawtucket?
The answer is contained in the title of this post. South Providence and Olneyville are in-between neighborhoods. Pawtucket is far enough away that it is getting a $40 million infill station on the Providence Line, but the state is not going to fund frequent service or integrated fares between the line and RIPTA buses. As far as Pawtucket’s predominantly poor and working-class residents are concerned, the train might as well not be there; nor will any gentrifiers move to Pawtucket for service to Boston (they get about the same travel time out of Providence and far better amenities). The focus for the city and the state is on redevelopment, and one can almost see the dollar signs in the eyes of the power brokers who passed this deal.
This neglect of the working class and of Providence’s nonwhite neighborhoods (South Providence is black, Olneyville is Hispanic) is not deliberate. But there is clear disparate impact: the Jewelry District gets BRT, South Providence and Olneyville can drop dead. Like everywhere else in the US, the power structure in Providence discourages investment in the in-between neighborhoods, even comfortable ones like the East Side. The in-between neighborhoods are intact enough that building something there is about providing transportation services, rather than about development and renaissance and the creative capital and other buzzwords. And providing services is too boring, too political, too underappreciated. Better to build something shiny and say “I did that,” even if it’s useless. What the elites consider shiny changes every few years – it was streetcars last decade and is frequent buses today – but the principle is the same: instead of investing for the benefit of residents of Providence and its inner suburbs, the state invests for the benefit of ribbon-cutters.
Rapid Transit in the Third World
Last month, I committed to producing a subway fantasy map for Lagos via a Twitter poll. I’m working on this, but before I go into Lagos itself, I want to talk about the third world in general. Good transportation in poor countries is of independent interest, but it also has some applications to thinking about solutions for rich countries, such as the countries my readers live in. The reason is that every principle of good transportation planning has edge cases, exceptions, and assumptions, and it is critical to evaluate these in the largest variety of situations. Understanding transportation in the United States can yield insights about Europe and vice versa; likewise, understanding the first world can yield insights about the third and vice versa.
The epistemological principle I use is that if I believe that a high concentration of factor A makes solution B work better, then a low concentration of factor A should make solution B work worse. I used that in a post about high-speed rail in Sweden, arguing against it due to the absence of factors that make it work better, namely, linear population distribution. Many good design principles formulated in rich countries depend on those countries’ high incomes, and are less relevant to countries that are only about as wealthy as the US and northwestern Europe were in 1900.
Everything is terrible
On nearly every indicator of technology or living standards, every poor country is worse than every rich country. There are some exceptions involving middle-income countries (for example, Russia and China have very good rail freight), but not in low-income countries. I wrote a piece in YIMBY recently describing the state of New York and Vienna in the early 20th century, which had very high crowding levels; much of the same story can describe many third-world cities today, especially in India, where tight zoning limits housing supply to the point of overcrowding. In Mumbai, the average residential floor space per person is 9 square meters, compared with 55 in Manhattan.
Pollution levels are very high as well, because of the combination of high population density and heavy industry (especially in North India), as well as the proliferation of cars. The amount of pollution caused by 50 or 100 cars per 1,000 people in a dense city where the cars don’t have catalytic converters can be many times worse than that caused by the 200 mostly diesel-powered cars per 1,000 people of Paris, or the 250 cars per 1,000 people of New York. The low motorization levels of lower-middle-income cities like Cairo, Lagos, or Mumbai aren’t a barrier to traffic, either: those cities routinely have traffic jams, just as the United States started having jams in the 1920s. These cities have centralized employment in the CBD, not a lot of road capacity coming in, and a culture in which the middle class drives (or is driven by chauffeurs).
This creates an urgency for improving public transportation in low-income countries that does not exist in the developed world. Third-world countries that build subways spend a much higher share of their GDPs on them than Europe and Japan do, and some, such as India and Bangladesh, spend more than the United States. If Paris hadn’t built the RER, Franciliens would drive or take the slower Metro; if Shanghai hadn’t built the Metro, Shanghainese would still be living in tiny apartments and riding buses in crawling traffic; if Lagos doesn’t build a metro, Lagosians will keep facing multi-hour commutes. The same situation also creates an urgency for improving other areas the government can invest in; good government, capable of making these investments at reasonable cost, without too much corruption, is crucial for economic and social development.
Concrete before electronics
The cost of advanced signaling systems, such as driverless technology, is approximately the same everywhere in the world, in exchange rate terms. The cost of civil infrastructure construction is approximately the same in PPP terms, and if anything may be a little lower in poor countries. The cost of labor that advanced technology avoids is proportional to wages. This means that the electronics-before-concrete principle is less valid in poorer countries, and is sometimes not valid at all. There are practically no driverless metros in developing countries; the only examples I can find of lines in operation include two lines in Sao Paulo and one in Manila, with a small handful more under construction. Brazil is middle-income, and the Philippines are lower-middle-income rather than poor.
This principle also extends to countries with existing rail lines that they could expand. Investments in concrete – additional tracks, grade separation, relief lines – are more valuable than in developed countries, while investments in electronics are less valuable. A city with a desperate transportation situation can expect that every rapid transit line it builds will fill quickly. Tunnels are in a way more future-proof than precise schedules and resignaling.
Regulate cars, not buses
A recurrent feature of transportation in poor cities without rapid transit or BRT is the minibus. It goes by various names; the most famous to the first-world reader is probably the Nairobi matatu, but it also exists in Lagos as the danfo, in the Philippines as the jeepney, and in Jakarta as the angkot. These vehicles are not popular with the segment of the population that the government listens to: they are typically noisy and dirty and the drivers are aggressive. The governor of Lagos State recently announced a plan to ban the danfos, saying they don’t meet the international standards of a great city and should be replaced with air-conditioned buses. This is while the city is still working on its first metro line.
In Delhi, attempts to give buses road priority met an intense backlash from high-income drivers. There was a failed lawsuit openly stating that car drivers’ time was more important. Eventually Delhi scrapped the system entirely.
In contrast, the most successful public transit in cities that were recently poor or low-income, such as Singapore or Seoul, is in an environment where state policy restrained cars and not buses. Singapore has had congestion pricing since in the 1970s, the first city in the world to implement this scheme, and levies high taxes on cars, as does Hong Kong. Seoul restrained domestic consumption, including of cars, in its period of early industrialization from the 1960s to the 1980s.
Nigeria has 60 cars per 1,000 people. Lagos has maybe 150. To a large majority of the city’s population, cars are traffic, not transportation. Numbers in other third-world megacities vary but are not too different: Cairo has about 200 as of 2011, Delhi about 170, Jakarta about 300. (Some car and population numbers are a few years out of date; caveat emptor.) Traffic restraint is the correct policy given massive traffic jams and growing pollution levels, and the sooner the city starts, the better it will look in a generation.
Plan for growth
Developing-world cities are going to be much larger and richer in 30 years than they are today. National population growth rates range from moderate in India and Bangladesh to explosive in Nigeria, Kenya, and Tanzania. Moreover, all of these countries have low urbanization rates today and fast migration from the villages to the cities, setting up fast urban population growth even where national population growth isn’t so high. Economic growth projections are dicier, but at least one estimate through 2024 is quite optimistic about India and East Africa.
The high-density context of most cities in question rules out any auto-based development pattern. The population density of the eastern half of the Indo-Gangetic Plain, from Delhi downriver to Bangladesh, is about 1,000 people per km^2, comprising nearly 600 million people. Nowhere in the developed world is this density seen outside city regions. Lombardy has 400 people per km^2, and is as hemmed by mountains as North India, producing large-scale thermal inversions; with high levels of car traffic and heavy industry, it is one of the most polluted regions of Europe. Southern Nigeria is not so dense, but with fast population growth, it eventually will be. Egypt’s population density along the Nile is well into the four figures.
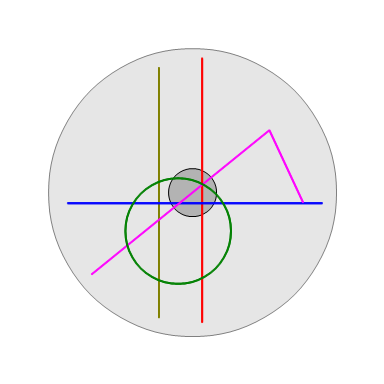
This also has implications for how rapid transit should be built. A metro line that passes through lightly-populated areas will soon sprout dense development around it, just as the early lines did in late-19th century London and early-20th century New York. Most New York railfans are familiar with the photo of farmland next to the 7 train in the 1910s; between 1900 and 1930, New York’s population doubled, while Queens’ population grew by a factor of 7. Such growth rates are realistic for some developing-world cities. For the same reason, it is worthwhile investing in grade-separated rights-of-way now, when they are cheap.
Another implication concerns capacity. Even Nairobi, which is not a megacity, can expect to become one soon, and requires many different rapid transit lines entering its center. Some of these can be accommodated on existing roads, as els or relatively easy subways under wide streets, but not all can. When the roads are wide enough, cities should consider four-track structures, since the relative construction cost of four-tracking is low for an el or a cut-and-cover subway.
Four-tracking has one additional benefit: local and express service, which is of critical importance in the very largest cities. In forums like Skyscraper City, Tokyo railfans often express concerns over China’s subways, which have no express tracks and little to no commuter rail, since they offer no path through the center faster than about 35 km/h (Tokyo’s express commuter lines, like Tokaido and Yokosuka, approach 60 km/h).
The final implication is that it’s fine to build a central business district from scratch. Shanghai is doing this in Lujiazui, but that is the wrong location, on the wrong side of a riverbend, with only one Metro line serving it, the overcrowded east-west Line 2; a north-south rail line would have to cross the river twice. A better location would have been People’s Square, served by Lines 1, 2, and 8. This is of especial relevance to cities whose traditional center is in a difficult location, especially Lagos but also Dar es Salaam.
BRT is not rapid transit
The failure of Delhi’s BRT line is in some sense atypical. The line was compromised from the start, and global pro-BRT thinktank ITDP expressed criticism from the start. However, other BRT projects draw cause for concern as well. Dar es Salaam’s BRT is instructive: the first phase cost about $8.5 million per km in exchange rate terms, or about $27 million per km in PPP terms, comparable to an average European light rail line or to an American BRT boondoggle. A hefty chunk of this cost comes from importing Chinese-made buses, which are priced in exchange-rate terms and not in PPP terms.
All else being equal, higher incomes strengthen the case for rail vs. BRT and lower incomes weaken it, since one of the major advantages of rail is fewer drivers per unit of passenger capacity. However, there is a countervailing force: the bulk of the cost of rail construction is local construction, priced in PPP terms, and not imported capital, priced in exchange rate terms. Trains still cost more than buses per unit capacity, but the bulk of the cost premium of rail over BRT is not the vehicles, and a weak currency reduces this premium.
And for all of the global marketing, by ITDP and by Jaime Lerner, the Curitiba mayor who invented modern BRT, BRT is not rapid transit. It is surface transit, which can achieve comparable speed to a tramway, but in a dense city with heavy traffic, this is not high speed. The busiest Parisian tramways, T1 and T3, average about 18 km/h. Modern rapid transit starts at 30 km/h and goes up as construction standards improve and stop spacing widens. BRT is still a useful solution for smaller cities, but in the larger ones, which need more speed, grade-separated rapid transit is irreplaceable.
Don’t neglect mainline rail
How are people going to travel between Jakarta and Surabaya, or between Lagos and Kano, or between Nairobi and Mombasa? They’re not going to fly; the capacity of air traffic is not high. They’re not going to take a vactrain. The only real solution is a high-speed rail network; Indonesia is already building HSR from Jakarta to Bandung, using Chinese technology, with plans for a further extension to Surabaya.
The most difficult part of building a new intercity rail network from scratch is serving the big cities. This is the big advantage of conventional rail over maglev or vactrains: it can run on legacy tracks for the last few kilometers. (In poorer countries, which import technology from richer ones, another advantage is that conventional rail isn’t vendor-locked.) Between this and the need to also accommodate medium-speed intercity rail to smaller cities, it’s important that developing-world cities ensure they have adequate right-of-way for any future system. Trunks should have a minimum of four tracks, with intensive commuter rail service on the local tracks, in a similar manner to Mumbai.
It is also important to build the metro to be mainline-compatible, in electrification and track gauge. It is wrong for India (and Pakistan) to build a single kilometer of standard-gauge metro; everything should be broad-gauge. Russia, where everything is on Russian gauge, does this better. African mainline rail networks are usually narrow-gauge and weak, and in some places (such as East Africa) are being rebuilt standard-gauge. Southeast Asia runs the gamut, with reasonable service in Jakarta, which is running frequent electric commuter rail using second-hand Japanese trains; this suggests future metro lines in Jakarta should be built narrow- rather than standard-gauge, to allow Tokyo-style through-service to commuter rail.
Conclusion
The biggest developing-world cities have problems with air pollution, traffic, overcrowding, and long commutes – precisely the problems that rapid transit is good at solving. They have equally great problems with infrastructure for electricity, running water, and sewage, and with access to health care, education, and such basic consumer goods as refrigerators. And they have limited tax capacity to pay for it all.
This makes building good transit – cost-effective, future-proof, and convenient enough to get high ridership – all the more critical. The smallest cities today may be able to get away with looking like smog-ridden midcentury Los Angeles, but even medium-size ones need to plan on models starting from New York or London or Tokyo, and the biggest ones, especially Lagos, should plan on looking like something that doesn’t really exist today.
To that effect, third-world governments need to absorb massive amounts of knowledge of good practices developed in Western Europe and high-income East Asia (and to a lesser extent Russia and China). But they cannot implement them blindly, but have to learn how to adapt them to local conditions: chiefly low incomes, but also weak currencies, import-dependence in technology, high expected future growth, and (in many cases) high expected population density. Nothing prevents a poor country from doing transit well: China, still a middle-income country, has more high-speed rail ridership than the rest of the world combined, and subway ridership per capita in Beijing, Shanghai, and Guangzhou is healthy. But India, Pakistan, Nigeria, and other poor countries with big cities have their work cut out for them if they want to solve their transportation problems.
New York’s MTA Genius Challenge
I don’t like the word “genius.” When people use it unironically, what I hear is “we haven’t met many smart people, so the first one we meet looks like a genius to us.” Math academia is very good about excising the word from anyone’s vocabulary. It drills you on the idea that you’re not Manjul Bhargava or anyone of that caliber, and if you are, you’re judged by what you’ve proved, not how theoretically smart you are. The tech industry uses the term more often, alongside related terms: rock star, 10x engineer, ninja. Most of it serves to convince coders that they’re masters of the universe, that all of them are above average and half of them are in the top 10% of coders.
New York State just issued a call for proposals for a $1 million grant, dubbed the MTA Genius Transit Challenge. I sent in a request for more information, and haven’t gotten a response yet; when I do, I will probably apply, if the specs and timeframe are within what I can give, but I doubt I will get it. My suspicion is that the state is looking for a tech company to privatize something to. Governor Andrew Cuomo wants someone to tackle one of the following three problems:
- Rail signaling, in context of how to maximize the subway’s capacity in trains per hour.
- Rolling stock maintenance schedules: the state isn’t saying what the ultimate issue is, but presumably it is reliability.
- Cell service and wi-fi underground.
I doubt that the tech industry is capable of doing much on the first two issues, while the third one is a solved problem (as in cities like Singapore and Boston) that just requires installing wires. The first two issues have a lot of potential improvements, but they come from the transportation field, including service planning.
Unfortunately, the panel judging the grant is tilted toward people in the tech industry. Only one has background in rail transportation: Sarah Feinberg, former administrator of the FRA, whose background prior to working at the US Department of Transportation is in politics and tech. Two more are academic administrators, neither with background in transportation: SUNY Chancellor-elect Kristina Johnson, an engineer with background in energy and 3D graphics, and Daniel Huttenlocher, dean and vice provost of Cornell Tech, whose background is in IT. The other five are in the tech industry; one is a professor who studies networks, with some applications to car transportation (congestion pricing) but not to rail. Missing from the panel are people who worked on ETCS, people who have developed driverless train technology, and professionals within the major rolling stock vendors.
The biggest tech fixes in New York area outside the three areas identified by Cuomo. One, train arrival boards, is already in development, with planned opening next year.
But an even bigger fix is speed: the subways in New York have permanent slow orders at some places, not because of deferred maintenance but because of past accidents. There is a railroading tradition, in the US but sometimes also elsewhere, of using slow orders to mask underlying safety issues, even when the accident in question had very little to do with speed. The subways in New York today are getting even slower, for a combination of legitimate reasons (temporary signal upgrades) and illegitimate ones (inexperienced crews assigned at the busiest times).
However, the solutions to these problems often combine many different viewpoints. Speeding up the subway involves ending the slow orders (which involves signaling, but isn’t exactly tech), improving scheduling to reduce delays at merges (which involves service planning), reallocating crews (which involves labor relations), and coming up with ways to reinstall signals with less impact to operations (which is itself a combination of signaling tech and service planning).
American tech industry titans like to think of themselves as omnicompetent; Elon Musk’s bad ideas about transportation, from Hyperloop to elevator-accessed tunnels for cars, stem from his apparent belief that he can understand everything better than anyone else. This is not how good interdisciplinary work happens; the best examples in science involve people who are specialized to the two fields they’re combining, or people in one field collaborating with people in another field. A governor that understood this would empanel people with a wider variety of fields of expertise within the transportation industry: service planning, civil engineering, signal engineering, local labor relations and regulations, rolling stock maintenance. There would be one tech person on the panel (among the existing panelists, the professor studying networks, Balaji Prabhakhar, seems the most relevant in background), rather than one non-tech person.
This sort of self-importance especially appeals to Cuomo. Cuomo is not managing the state of New York; he is running for president of the United States, which requires him to be able to say “I did that” about something. Solving big problems requires big money; reducing costs requires local tradeoffs, such as reducing construction costs by using more disruptive cut-and-cover techniques. That’s how you run a good government, but that’s not how you run a cautious political campaign for higher office, in which the other side will pounce on every negative consequence. As a result, Cuomo is hoping to solve problems using tech innovation without spending much money; but the parameters of his plan seem to guarantee that the panel can only solve small problems, without touching on the most fundamental concerns for people riding the subway.
The Yamanote Line: a Ring or a Radial?
Note: I am going to take some suggestions for post topics in the future. This post comes from a Twitter poll I ran the day before yesterday.
The Yamanote Line in Tokyo is a ring. Trains go around the ring as on any other circular rail line. However, the line is not truly circumferential, since it serves as a north-south trunk through Central Tokyo. In that way, it contrasts with fully circumferential rings, such as the Moscow Circle Line, Seoul Metro Line 2 (see update below), and the under-construction Paris Metro Line 15. It’s really a hybrid of radial and circumferential transit, despite the on-paper circular layout. In previous posts I’ve attacked one kind of mixed line and given criteria for when another kind of mixed line can work. In this post, I’m going to discuss the kind of mixed line Yamanote is: why it works, and in what circumstances other cities can replicate it.
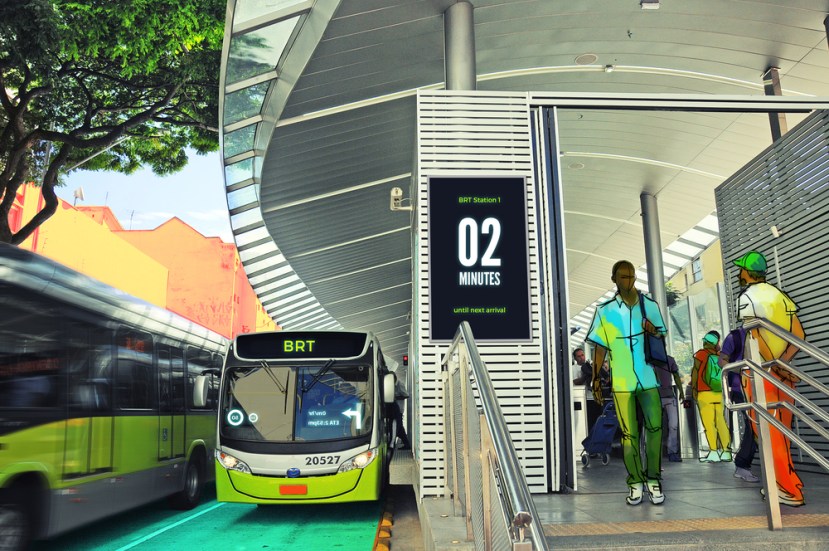
Consider the following diagram:
The red and blue lines are radial. The other three are hybrids. The yellow line is radial, mostly, but skirts city center and acts as a circumferential to its west; this kind of hybrid is nearly always a bad idea. The pink line is radial, but at the eastern end bends to act as a circumferential at the eastern end; this kind of hybrid is uncommon but can work in special cases, for example if Second Avenue Subway in New York is extended west under 125th Street. The green line is a Yamanote-style ring, offering radial service through city center but also circumferential service to the south and west.
On this map, the green line ensures there is circumferential service connecting what are hopefully the major nodes just west and south of city center. It doesn’t do anything for areas north and east of it. This means that this line works better if there is inherently more demand to the west and south than to the east and north. In Tokyo, this is indeed the case: the Yamanote ring offers north-south circumferential service west of Central Tokyo, through what are now the high-density secondary business districts of Ikebukuro, Shinjuku, and Shibuya. East of Central Tokyo, the only really compelling destinations, judging by subway ridership, are Oshiage and Asakusa, and neither is as big as Ikebukuro, Shinjuku, or Shibuya. Toyosu has high subway ridership, but is close enough to the water that it’s hard to build a circumferential through it.
Such a mixed line also becomes more useful if the radial component is better. The radial line can’t extend very far out, since the line needs to form a ring, so it should connect to very high-density neighborhoods just a few stops outside city center, or else provide additional service on an overloaded radial trunk. The Yamanote Line benefits from looking less like a perfect circle and more like upside-down egg, with two elongated north-south legs and two short (one very short) east-west legs; it extends its radial segment slightly farther out than it would otherwise be. In Tokyo, of course, all rail lines serving the center are beyond capacity, so the Yamanote Line’s extra two tracks certainly help; in fact, the two radial lines going north and south of Tokyo Station on parallel tracks, the Tohoku and Tokaido Lines, are two of the three most overcrowded in the city. (The third is the Chuo Line.) There’s even a dedicated local line, Keihin-Tohoku, covering the inner segments of both lines, making the same stops as Yamanote where they are parallel, in addition to the more express, longer-distance Tokaido and Tohoku Main Line trains.
Finally, there should not be radials that miss the mixed line; this is always a danger with subway lines that are neither pure radials nor pure circumferentials. Yamanote avoids this problem because it’s so close to the water at Shimbashi that the north-south subway lines all curve to the west as they go south, intersecting the ring. It’s actually the east-west lines that cross the Yamanote Line without transfers, like Tozai and Hanzomon; the north-south lines intersect the line with transfers.
The obvious caveat here is that while the Yamanote Line functions very well today, historically it did not originate as a circumferential in an area that needed extra service. It was built as a bypass around Central Tokyo, connecting the Tokaido and Tohoku Line at a time when Tokaido still terminated at Shimbashi and Tohoku at Ueno. Tokyo Station only opened 30 years later, and the ring was only completed another 10 years after that. Shinjuku only grew in the first place as the junction between the Yamanote and Chuo Lines, and Ikebukuro and Shibuya grew as the terminals of interwar private suburban railways. When the line opened, in 1885, Tokyo had 1.1 million people; today, the city proper has 9.5 million and the metro area has 38 million. The early rail lines shaped the city as much as it shaped them.
Nonetheless, with the economic geography of Tokyo today, the Yamanote Line works. Even though the history is different, it’s a useful tool for mature cities seeking to build up their rail networks. Provided the principles that make for the Yamanote Line’s success apply – stronger demand for circumferential service on one side of city center than on the others, demand for supplemental inner radial service, and good connections to other lines – this layout can succeed elsewhere.
Waterfront cities should take especial note, since they naturally have one side that potentially has high travel demand and one side that has fish. In those cities, there may be value in running the radial closest to the shoreline in a ring with an inland line.
This does not mean that every waterfront city should consider such a line. On the contrary: non-examples outnumber examples.
In Toronto, using two mainline tracks and connecting them to a ring to provide subway relief could have worked, but there are no good north-south corridors for such a ring (especially on the west), and the only good east-west corridor is Eglinton, which is being built incompatible with mainline rail (and has too much independent value to be closed down and replaced with a mainline link).
In Chicago, the grid makes it hard to branch lines properly: for example, a ring leaving the Red Line heading west at Belmont would necessary have to branch before Belmont Station, cutting frequency to the busiest station in the area. Plans for a circle line from last decade also faced limited demand along individual segments, such as the north-south segment of the Pink Line parallel to Ashland; ultimately, the planned line had too small a radius, with a circumference of 16 km, compared with 34.5 for Yamanote.
In Tel Aviv, there just isn’t any compelling north-south corridor outside the center. There are some strong destinations just east of Ayalon, like the Diamond Exchange and HaTikva, but those are already served by mainline rail. Beyond that, the next batch of strong destinations, just past Highway 4, is so far from Central Tel Aviv that the line would really be two radials connected by a short circumferential, more the London Circle Line when it was a full circle than the Yamanote Line, which is just one radial.
So where would a Yamanote-style circle be useful outside Tokyo? There are semi-plausible examples in New York and Boston.
In New York, it’s at the very least plausible to cut the G off the South Brooklyn Line, and have it enter Manhattan via the Rutgers Street Tunnel, as a branch of the F, replacing the current M train. There is no track connection enabling such service, but it could be constructed just west of Hoyt-Schermerhorn; consult Vanshnookraggen’s new track map. This new G still shouldn’t form a perfect circle (there’s far too much radial demand along the Queens Boulevard Line), but there are plausible arguments why it should, with a short tunnel just west of Court Square: namely, it would provide a faster way into Midtown from Williamsburg and Greenpoint than the overcrowded L.
In Boston, there is a circumferential alignment, from Harvard to JFK-UMass via Brookline, that can get a subway, in what was called the Urban Ring project before it was downgraded to buses. Two of the busiest buses in the region, the 1 and 66, go along or near the route. An extension from Harvard east into Sullivan and Charlestown is pretty straightforward, too. Beyond Charlestown, there are three options, all with costs and benefits: keep the line a semicricle, complete the circle via East Boston and the airport, and complete the circle via the North End and Aquarium. The second option is a pure circumferential, in which South Boston, lying between East Boston and JFK-UMass, would get better service north and south than west to Downtown. The third option cuts off East Boston, the lowest-ridership of the radial legs of the subway, and offers a way into the center from South Boston and Charlestown.
Of note, neither New York nor Boston is a clear example of good use of the Yamanote-style ring. This style of mixed line is rare, depending on the existence of unusually strong circumferential demand on just one side (west in Boston, east in New York), and on the water making it hard to build regular circles. It’s an edge case; but good transit planning revolves around understanding when a city’s circumstances produce an edge case, in which the simplest principles of transit planning (“every subway line should be radial or circumferential”) do not apply.
Update 5/16: commenter Threestationsquare reminds me that Seoul Metro Line 2 is the same kind of ring as Yamanote. The north leg passes through City Hall, near the northern end of the Seoul CBD, providing radial east-west service. The south leg serves a busy secondary commercial core in Gangnam, Tehran Avenue; Gangnam Station itself is the busiest in Seoul, and has sprouted a large secondary CBD.
Express Airport Connectors are a Scourge of Public Transit
Earlier this month, Andrew Cuomo unveiled a proposal to spend $10 billion on improvements to JFK Airport, including new terminals, highway expansion, and public transit access. I encourage readers to look at the plan: the section on highways proposes $1.5-2 billion in investment including adding lanes to the Van Wyck Expressway and to on-ramps, and has the cheek to say that this will reduce fuel consumption and greenhouse gas emissions. This while the section on mass transit gives it short shrift, only proposing superficial improvements to the AirTrain; in the unlikely the case that this is built, highway mode share will grow and transit mode share will fall. Put in plainer terms, the environmental case for the plan includes fraud.
However, this is not really the topic of this post. That Andrew Cuomo lies to the voters and doesn’t care about good transportation is by now a dog-bites-man story. Instead, I want to focus a little on a throwaway line in the plan, and more on the Regional Plan Association’s reaction. The throwaway line is that almost every major world airport has a one-seat train ride to city center, and by implication, so should JFK.
As an organization dedicated to environment-friendly public transit, the RPA should have made it very clear it opposes the plan due to its low overall transportation value and its favoring of highways over transit. Instead, the RPA immediately launched a brief detailing possible new airport connectors between JFK and Manhattan. The RPA has a lot of good technical people, and its list of the pros and cons of each option is solid. It correctly notes that using the LIRR and Rockaway Beach Branch would compete for traffic with LIRR trains serving Long Island, although it doesn’t mention associated problems like low frequency. The brief is based on prior RPA proposals, but the timing, just after Cuomo came out with his announcement, suggests an endorsement. There are several intertwined problems here:
There is no no-build option
A good study for public transit should not only consider different alignments and service patterns, but also question whether the project is necessary. The US requires environmental impact statements to include a no build option; European countries require a cost-benefit analysis, and will not fund projects with a benefit/cost ratio under 1.2, because of cost escalation risk.
The RPA study does not question whether a one-seat ride from JFK to Manhattan is necessary or useful. It assumes that it is. Everything else about the study follows from that parameter. Thus, it considers entirely express plans, such as the LIRR option, alongside local options. Everything is subsumed into the question of connecting JFK to Manhattan.
One of the alignments proposed is via the LIRR Atlantic Branch and Second Avenue Subway, which the RPA has long believed should be connected. The brief says that it would be slow because it would have to make many local stops; I’ll add that it would serve Midtown, where nearly all the hotels are, via a circuitous alignment. But with all these stops on the way, shouldn’t this be considered as primarily a new trunk line connecting Eastern Brooklyn with Second Avenue? The question of whether the eastern terminus should be Jamaica or JFK must be subsumed to a study of this specific line, which at any rate is unlikely to offer faster service to JFK than the existing AirTrain-to-E option. After all, the most optimistic ridership projection for a JFK connector is maybe 40,000 users per day, whereas the projection for the full Second Avenue Subway is 500,000. I don’t think a Second Avenue-Atlantic Branch connection is warranted, but if it is, the question of whether to serve JFK at the end is secondary.
Express airport connectors are a fetish
I lived in Stockholm for two years, where I went to the airport exclusively using the Arlanda Express, a premium express link running nonstop between the airport and city center. I imagine many visitors to Stockholm use it, are satisfied, and want to replicate it in their own cities.
Unfortunately, such replications miss something important: any air-rail link must go to the areas that people are likely to want to connect to. For locals who wish to travel to the airport, this means good connections to the local transit network, since they are likely to come from many neighborhoods. Not even a small city like Stockholm worries about providing rich areas like Vasastan and Roslag with a one-seat ride. For visitors, this means a one-seat ride to where the hotels are.
Stockholm is a largely monocentric city, with one city center where everything is. (It has an edge city in Kista, with more skyscrapers than Central Stockholm, but Kista can’t be reasonably connected to the airport). The situation in other cities is more complicated. And yet, express air links prioritize serving a big train station even if it’s poorly connected to the transit network and far from the hotels. Let us consider London and Paris.
In London, the five-star hotels cluster around the West End. Only two are at Paddington Station, and only a few more are an easy walking distance from it. This is where the Heathrow Express and the slower Heathrow mainline trains go. No wonder the Heathrow Express’s mode share, as of 2004, is 9%, whereas other Heathrow connections, mainly the Piccadilly line, total 27% (source, PDF-p. 28). The Piccadilly line beautifully passes through the parts of the West End with the largest concentration of hotels, and last time I was in London, I chose it as my Heathrow connection. Nonetheless, the government chose to build the Heathrow Express.
In Paris, the five-star hotels cluster in the west of the city as well, in the 8th arrondissement. The current airport connection is via the RER B, which offers express service in the off-peak when there’s capacity, but not in the peak, when there isn’t. Even so, it is a local commuter rail service, with good connections to the city transit system, and a two-seat ride to the 8th. Because of slow perceived speeds, the state is planning to build an express connector, originally planned to open in 2015 but since delayed to 2023. The express connector will dump passengers at Gare de l’Est, with no hotels within walking distance, no access to Metro lines serving the hotel clusters (Metro 7 does so peripherally, M4 and M5 not at all), and a long walk to the RER for passengers wishing to connect to longer-range destinations such as parts of the Left Bank.
I bring this up to show that the idea of the express air-rail link is a fetish rather than a transportation project, and by analogy, so is the one-seat ride. There is value in faster service and in minimizing the number of transfers, but express airport connectors attempt both even at the cost of building a line that doesn’t go where people want to go.
Ultimately, Cuomo doesn’t care about good transit
Cuomo has many concerns. The chief one is most likely winning the 2020 presidential primary. He has been running for president since the moment he was elected, and many of his policies – gay marriage, the feuds with Bill de Blasio, the desperate attempt to build shiny infrastructure with his name on it – are best viewed through that lens. To the extent that he is not running for president, he has attempted to cement absolute power within the state. He backed a palace coup in the State Senate that secured a Republican(-ish) majority even though the Democrats won most seats; a Democratic majority would be led by a different faction of the party, one more beholden to Democratic interest groups, and might send Cuomo bills that he would lose political capital if he either signed or vetoed them.
This is why I keep giving him as an example of an autocrat in various posts; here is the major takedown, but see also here. Autocrats are always bad for the areas that they govern, which as two separate implications. The first is that their choice of spending priorities is compromised by the need to expand their own power and glory: even if you believe that New York needs $1.5-2 billion in new highway spending, is the Van Wyck really the best place for it?
The second and worse implication is that it is hard for outside groups to convince autocrats to do better. Autocrats don’t have to listen; if they did, they would be democratic leaders. Cuomo happens to be an anti-transit autocrat, and this means that pro-transit groups in New York need to view him as an obstacle and work to weaken him, rather than to ask him to please consider their plans for an air-rail link.
The difficulty is that, precisely because local- and state-level democracy in the US is so weak, it is difficult for issue-oriented groups to go out and oppose the governor. Planners in Democratic cities are hesitant to attack budget-cutting Republican governors like Charlie Baker and Larry Hogan; attacking Democratic governors like Cuomo is a nonstarter. Nonetheless, the RPA needs to understand that it needs to oppose governments hostile to public transit rather than ask them to improve. When Cuomo proposes a bad transportation project, say “no” and move on to more important things; don’t try to work with him, because nothing good can come of that.
Boston NightBus: Planning Around Timed Connections
Over the last year, several people at the Boston advocacy group TransitMatters have been working on a plan to restore night bus service in the area, which is one of few big US cities with no transit between 1 and 5 am. See here for the original concept, from March of last year. The TransitMatters plan assumes limited financial resources, designing the plan around eight or nine routes, all running on an hourly takt schedule, meeting at one central location for a pulse, currently planned to be Copley Square. This seems fairly standard: in Vancouver, too, the daytime bus grid is replaced with a pulse-based system at night, with 30-minute headways on most lines.
So far, so good. The problem is that after additional work, including checking travel times on Google Maps but also some nighttime test drives, TransitMatters found that the original map would not work with an hourly takt. Hourly service with one vehicle per route requires one-way travel time to be 30 minutes minus turnaround time. Double-length routes, at one hour minus turnaround times, can also fit into the system, with two vehicles, but nothing in Boston is that long. Several of the routes turn out to be just a hair too long, and the plan evolved into one with 75-minute headways, too long and irregular for customers. In meetings with stakeholders, the relevant members of Transit Matters were told as much, that 75 minutes was too low a frequency.
I started doing work on this plan around then. Since I think a clockface schedule is important – especially if there’s money for more buses, because then the headways would be 30 minutes and not an awkward 37.5 minutes – I started to sketch ideas for how to reduce travel time. The revisions center the schedule, fitting route choices around the need for buses to complete the roundtrip in an hour minus two turnaround times; this is what I came up with. Time is saved by avoiding detours, even to relatively major destinations, and by not going as far as would be ideal if there were no need to maintain the takt. Many of the design principles are generally useful for designing takt-based schedules, including for commuter rail and for rail-bus connections.
Schedule padding should be based on expected punctuality
This is a point I’ve made before in talking about LIRR scheduling, where fragile timetabling contributes to high schedule padding. Overall, punctuality depends on the following possible attributes of transit services:
- Rail is more punctual than buses, and electric service is more punctual than breakdown-prone diesels.
- Grade-separated transit is more punctual than surface transit.
- Services are more punctual when there are fewer riders, especially buses, which only stop when riders request it.
- Surface transit is more punctual if it has dedicated lanes, or if (as on some Vancouver routes) it runs on a street with signal priority over intersecting traffic.
- Surface transit is more punctual off-peak, especially at night, when there’s no congestion.
- Transit service is more punctual the shorter the span is: a system that’s only supposed to run for 5 night hours has less room for schedule slips than one that’s supposed to run for 21 daytime hours. (This I credit to Ant6n.)
While NightBus involves surface buses running in shared traffic lanes using on-board fare collection, the expected traffic is so low that travel time is likely to be close to the travel time depicted on Google Maps without traffic, and significant variations are unlikely. This means it’s possible to get away with less schedule padding, even though the plan requires 8 routes to converge at one pulse point. The maximum one-way travel time should be taken to be around 26 minutes. 24 minutes is better, and ideally not all routes should be 26 (they’d wait for one another at the pulse point, so it matters how many routes are near the maximum and not just what the maximum is).
Routes should run as fast as necessary and as far as possible
Sometimes, the optimal routing is already the fastest – for example, maybe it really is optimal to link two nodes with a nonstop route. Usually, it is not: on rapid transit there are intermediate stops, on surface transit there are detours and slower segments when freeways are available. When the schedule is tight, there is a plethora of tradeoffs that must be made about travel time. A detour to a major destination, so important that in isolation it would improve service despite the slowdown for through-passengers, must be weighed against other detours. On fast commuter rail line, where there is a significant stop penalty, the equivalent is the intermediate stop; I discussed this 5 years ago in the context of the Lowell Line. The overall length of the route is also a variable: when possible, the outer end should be as far as possible while maintaining the takt.
In the context of NightBus, I used this rule for all routes:
- The N17, running parallel to the Red Line to Ashmont, runs straight on Dorchester Avenue, whereas in the original plan it detoured to serve Kane Square; there is no time to detour to Kane Square, so in the revised plan it skips it, and passengers going there would need to walk 500 meters.
- The N28, running on Washington Street and Blue Hill Avenue, terminates at the future Blue Hill Avenue commuter rail stop, and not the Mattapan trolley stop. At night the trolleys don’t run, so the connection isn’t important, and the few hundred meters cut from the route give the buses 2 crucial minutes with which to make the 26-minute one-way schedule.
- The N32/39 cannot go on Huntington (N39) and thence to Hyde Park (N32); it can either go on Huntington to less valuable Roslindale or on a route parallel to the Orange Line to Hyde Park. I believe the latter option is better, but this is up for debate.
- The N57 follows the Green Line B Branch to Boston College (taking 20 minutes), not the 57 into Watertown (which would take about 27); I think this is also the optimal decision independently of the need to make the pulse, but the pulse makes it far better. Note that this means the route would have to use unmarked bus stops, since in the daytime there is no bus paralleling the B Branch.
- The N1 terminates at Davis Square, without going farther into Cambridge or into Arlington (as N77).
- The N82 and N110 use Storrow Drive to skip Downtown Boston’s slow streets. The buses run on a pulse, so there is no need for more than one bus to serve the same route – they’d be scheduled to bunch, rather than overlying to provide higher frequency. The N111 to East Boston, Chelsea, and Revere serves Downtown Boston instead. This cuts service from Downtown to Malden and Medford, but Downtown is a 9-5 neighborhood, so there’s less need to connect it in every direction at night.
- The N111 terminates in central Revere and not in North Revere.
Not all transit services are meant for all social classes
At night, buses go at approximately the same speed as cars, provided cars can’t take freeways. If the cars are carrying multiple passengers, as ride-sharing counterproposals plan to, then they probably can’t take freeways. In theory, this means buses would be for everyone, since they were as fast as taxis. In practice, this is only true for people using one route – diagonal trips are still faster by taxi. But worst, the hourly frequency is brutal. People who can plan their night travel around the schedule would use the bus; so would people who can’t afford taxis. But people in the top two-thirds of the income distribution are unlikely to use NightBus, or any ride-sharing alternative (if ride-sharing can afford more vehicles for higher frequency, so can buses).
What this means is that the service needs to be designed around the needs of low-income riders. As a note of caution, in popular parlance there’s a tendency to conflate low-income riders with other groups, such as elderly riders, and pit their needs against good transit practices like wider stop spacing, off-board fare collection, frequent grids, and so on. Those practices are applicable to everyone, and if they appear to favor middle-class riders, it’s because when the buses are too slow, the middle class drives and the poor keep taking the bus, so faster buses have higher proportions of richer riders.
With that caveat in mind, what I mean when I talk about low-income riders is the distribution of origins and destinations. The various draft plans proposed by Transit Matters members all focused on serving lower-income neighborhoods. This is why it’s not such a problem that the N1 only goes as far as Davis Square: that is the favored quarter of the Boston area, and the areas cut off from service, such as Arlington, are rich enough that few would ride an hourly or even half-hourly bus. Additional decisions made based on this principle include,
- The N32/N39 route serves Hyde Park and not Roslindale. At equal incomes, I’d probably suggest serving Roslindale, which makes for a shorter route, and allows the route to use the extra time gained to get to Forest Hills via a longer route on Huntington and pass near Longwood. But incomes are not equal: Roxbury is much poorer than Longwood and Jamaica Plain, and Hyde Park is poorer than Roslindale.
- The N57 serves Boston College, which is middle-income but still poorer than Watertown.
- The N111 serves Chelsea, and probably would regardless of average incomes, but it could instead go parallel to the Blue Line, serving somewhat less poor and less dense areas.
The schedule’s importance is higher at lower frequency
None of the above principles really matters to a subway with 2-minute peak headways and 4-minute off-peak headways. Some of these subways don’t even run on a fixed schedule: it’s more important to maintain even headways than to have trains come when the nominal schedule says they will. The point where clockface scheduling starts to become important seems contentious among transit planners. Swiss planners use clockface schedules down to (at highest) 7.5-minute headways, and say that 11-minute headways are a recipe for low ridership. In Vienna and Berlin, timed transfers are offered on the U-Bahn on 5-minute trains. At the opposite end, hourly and even half-hourly services must be designed around a schedule with quick connections, to prevent passengers from having to wait the full headway.
In borderline cases – the 7.5-15 minute range – transfers can be timed, and at the less frequent end some overtakes, but there is no real need to design the rest of the schedule around the headway. The main reason to operate with tight turnarounds is to reduce fleet and crew requirements. Any looseness in the schedule, beyond the minimum required for punctuality and crew comfort, should be thought of as a waste. However, the waste is capped by the overall headway. Concretely, if your favorite transit route takes 31 minutes one-way after factoring in turnaround time and schedule padding, then it needs 2 vehicles to provide hourly service, lying idle half the time; to provide 10-minute service, it needs 7 vehicles, lying idle only 11% of the time. So if frequency is high enough, the route should be designed without regard to turnaround times, because the effect is reduced.
But NightBus is hourly; 30-minute service is aspirational. This means that the schedule is more important than anything else. Even if a single neighborhood feels genuinely screwed over by the decisions made to keep the routes at or under 26 minutes – for example, if Revere and Mattapan prefer service going farther out even at the cost of 70- or 75-minute frequency – good transit activists must think in systemwide terms. Maintaining the hourly takt throughout the service area is more important than North Revere and the last few hundred meters in Mattapan.
Ultimately, buses and trains are not all that different
There are major differences between buses and trains in capital costs, operating costs, reliability, and so on, leading to familiar tradeoffs. Even at medium-size transit systems such as the MBTA, frequent bus networks are convoluted and at times fully gridded, while rapid transit networks are invariably radial at least to some extent,. Buses also can’t consistently use timed transfers at high frequency.
However, there are many similarities, especially with small bus networks, which are designed around a pulse rather than a grid:
- Public transit works with transfers and central dispatching. This makes it better at pulse-based network than any taxi (including ride-hailing apps) or ride-sharing service.
- Vehicles are large – not to the same extent of course, but relatively speaking (trains in large cities, buses in small ones or at night). There’s less room for the everywhere-to-everywhere one-seat rides that taxis provide at higher cost. If there’s budget for more service-hours, it’s spent on higher frequency or longer routes and not on adding more one-seat rides.
- Routes are centrally planned, with decisions made about one area affecting service in other areas. It is not possible for routes to evolve by private spontaneous action except in the thickest markets, far bigger than what small bus networks can support.
- The importance of the schedule and of timed transfers is proportional to the headway, and inversely proportional to frequency.
This is good news, because it means that the large body of good industry practices for rail planning, inherited from such countries as Switzerland and Japan, can be adapted for buses, and vice versa. I did not invent the principle of running trains as fast as necessary; it’s a Swiss planning principle, which led the country to invest in rail just enough to enable trains to go between Zurich, Basel, and Bern in one hour minus turnaround and transfer time. Nor did I expect, when I started getting involved in Transit Matters, that this would be so helpful in designing a better bus plan.

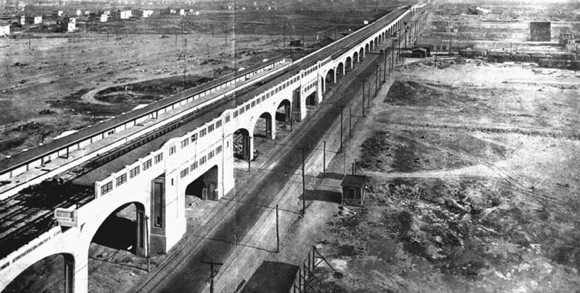