Category: Vancouver
Fare Practices
Here’s a table of urban public transport fares for various cities, covering the United States, Canada, parts of Europe, Turkey, and Japan. Included are single fares, multi-ride discounts, day passes, weeklies, and monthlies, with the last three shown with their ratios to single fares. As far as possible we’ve tried doing fares as of 2026, but it’s possible a few numbers are not updated and depict 2025 figures.
The thing to note is that in Continental Europe, there are steeply discounted monthlies – only two cities in the table charge for a monthly more than for 30 single-trips (Paris at 35.5, Bari at 35). Most Italian cities cluster around 20, and Barcelona, Lisbon, and especially Porto are even lower. Berlin used to have a multiplier of 32 before the 9€ monthly and the subsequent Deutschlandticket but the current multiplier is 15.75 within the city. Stockholm has a monthly multiplier of 24.7. Prague’s multiplier is 12.
Japanese monthly fares are strange by Western standards, in the sense that they are station-to-station, with subsegments allowed but no trips outside the segment; subject to this constraint the multiplier is 30-40, with small additional discount for buying 3-6 months in advance, but the unrestricted monthly fare is very high. London and Istanbul functionally do not have monthlies, in the sense that the multiplier is so high (78.5 Istanbul-wide, and it’s not truly unlimited but is capped at 180 trips/month) that except for trips within Central London it might as well not exist.
American and Canadian monthly fares are usually higher than in Continental Western Europe, with multipliers in the 30s. New York’s multiplier was especially high, about 46, and the MTA has just abolished the monthly fare entirely and phased out the MetroCard (as of the new year, starting in two hours), making people use the weekly cap with OMNY instead, which has a multiplier of 11.7 and, over a 30-day month, forces a monthly multiplier of 50. Toronto has a very high monthly multiplier as well, 46.6. This is bad practice: a high monthly discount functions as a technologically simple off-peak discount (indeed, London pairs its stingy monthly discount with a substantial off-peak discount), and OMNY itself is buggy to the point that fare inspectors on the buses can’t tell if someone has actually paid except by looking at debit card statements, which do not show one as having paid if one has a valid transfer or has reached the weekly cap (and not tapping in this case is still illegal fare dodging in New York law).
The practice of the cap, increasingly popular in the US under London influence, is rare as well. London’s fare cap originates in its complex zone system: the Underground has nine zones with zone 1 only covering Central London so that passengers taking multiple trips per day can expect to take trips across different zones that they may not be familiar with; there isn’t fare integration, but rather there’s a special surcharge on some commuter train trips and a discount on buses; peak and off-peak fares are different. Thus, the calculation for the passenger of whether to buy tickets one at a time or get a pass is difficult, so Oyster does this calculation automatically to give the most advantageous fare. In a Continental city where fares are either flat regionwide or have zones with limited granularity (often the entire metro is in the innermost zone) and monthly discounts are steep, the calculation is simple: an even semi-regular rider should always get a monthly.
American and Canadian cities typically have flat fares or a simple zone system, good fare integration between buses and the subway or light rail, and commuter rail that’s functionally unusable for urban trips rather than resembling the subway with a $2 surcharge. The use case of London does not apply to such cities. New York should not have a fare cap, but a heavily surcharged single trip, perhaps $5, and an attractive flat monthly fare, perhaps $130. This system ensures passengers are incentivized to pay and there is little opportunistic fare dodging as the user has already prepaid for the entire month, so it pairs well with proof-of-payment fare collection, common in many of the European examples (though metro systems outside Germany and its immediate vicinity do have faregates).
The overall level of the fare is determined by the willingness of the government at various levels to subsidize public transport; the table can be used to compare these at PPP rates as well. However, the distribution of fares across different products and distances is not a matter of subsidy but a matter of good and bad industry practices, and the best practice for simple fare collection is to offer a prepaid monthly at a heavy discount compared with the single ride.
The Meaning of Construction Costs Per Rider
I’ve written a lot about urban rail construction costs per kilometer, but from time to time, my colleagues and I have been asked about what happens if we compare costs, not per kilometer, but per rider. There’s an intuition among people in transportation advocacy (including anti-transit activists who prefer cars) that the construction costs of urban rail lines per rider are a meaningful measure of cost-effectiveness. This intuition is true, and yet, it must be interpreted delicately.
First, modes of transit with different operating cost structures should tolerate different levels of capital costs; in particular, the current practice in which subways are built at higher cost per rider than light rail, which in turn is built at higher cost than bus lanes, reflects real differences in operating costs and does not mean there is overinvestment in subways and underinvestment in buses. And second, costs per rider can be too low, in a sense – if a city’s construction costs per rider are very low, indicating a very high benefit-cost ratio, then it shouldn’t be lauded for its fiscal prudence but scolded for not having built these lines long ago and for not building more today. In truth, places with healthy decisionmaking about infrastructure expand their networks to the limit of cost-effectiveness, which means that costs per rider averaged over an entire region vary less than costs per kilometer, and this just reflects that cities build what they can, so low-cost cities can afford to build lines to lower-ridership areas, which higher-cost cities would reject as too expensive for the benefit. This way, costs per rider are not too different in New York and in cities that build for an order of magnitude lower cost per km than New York.
The meaning of cost per rider
In the remainder of this post, the meaning of “cost per rider” is “cost divided by the ridership on a working day.” In Europe, workers get around six weeks of paid vacation, and tend to take them in the summer, leading to depressed ridership around July or August, depending on the city; daily counts usually avoid this period, so for example Stockholm specifies that daily ridership figures are taken in winter. This, as I will explain shortly, does not unduly make European lines look more cost-effective than they actually are.
The cost per rider is best understood as a cost-benefit measurement. All benefits of public transportation scale with ridership, generally linearly: higher ridership indicates tighter economic and social ties if it comes from more travel, and better environmental outcomes if it is at the expense of car travel. What’s more, raw ridership measured in trips is better at capturing these benefits than passenger-km. The issue is that focusing on p-km overrates the success of extremely suburban systems, which have low environmental benefits for their p-km (the users are typically park-and-riders and therefore drive extensively, just not to their city center jobs) and usually also high net operating costs since they are peaky and tend to charge low per-p-km fares. Conversely, the short-hop trip is a net profit to the system – even subways with distance-based fares charge degressive rather than linear fares – and comes from dense networks that cut out car-based travel entirely. These effects roughly cancel out to the point that ridership is a good proxy for actual benefits.
That said, all outcomes need to be scaled to regional or even national incomes. Economic benefits are usually measured relative to worker wages anyway; in some business case analyses, such as that of the United Kingdom, the economic benefit is even scaled to rider income rather than regional or national income, which favors lines built to rich neighborhoods over lines built to poor ones, and isn’t really how cities need to think about their public transit networks. Social benefits are usually taken on a willingness-to-pay basis, and the same is true of health benefits including reduced air and noise pollution from cars and reduced car accidents.
The next step is then to compare the cost per rider with GDP per capita, which is not perfect but is good enough as a proxy for incomes. This also takes care of the issue of Europe’s synchronized summer troughs in local travel: those six weeks of paid vacation are visible in reduced GDP per capita, so the apparent bonus to the European system of using cost per daily trip where “day” means “workday outside the summer vacation season” rather than cost per annual trip cancels out with reduced annual GDP per capita.
The rough rule of thumb I use is that the absolute limit of cost-effectiveness for a subway or commuter rail line is when the cost per rider is equal to GDP per capita. This is a coincidence: a one-time cost has no reason to be equal to an annual income – this just follows from Börjesson-Jonsson-Lundberg’s estimate of the Stockholm Metro’s benefit-cost ratio compared with its cost per rider relative to the GDP per capita of 1960s’ Sweden. In practice, infrastructure is never built down to a benefit-cost ratio of 1, due to construction risks; in countries that make decisions based on benefit-cost analyses, the minimum is usually 1.2 or 1.3. In this schema, the United States can afford to build up to an envelope of $85,373/1.3 to $85,373, which is $65,000-70,000/rider in 2024 prices. The frontier lines, like the Interborough Express, are fairly close to this limit already; in practice, there’s a range, with some lines in the same city built well over the limit for political reasons (often airport connectors) and others built far below it.
Cost per rider by mode
The above analysis works for subways and commuter rail. It does not work for trams or buses. The reason is that surface transit never achieves the same low operating costs as metros, so in practice, the total cost to be truly comparable needs to be incremented by the additional operating costs.
To be clear, this is just a rule of thumb. There are different metro lines, even with the exact same technology in the same city, with different projected operating cost profiles; for example, in Vancouver, the Broadway extension of SkyTrain toward UBC was projected in the 2010s to reduce net operating costs as many buses would be replaced by fewer, larger trains, but the outward extension of the same system deeper into Surrey and Langley is projected to increase net operating costs. There are different ways to interpret this – for example, the Surrey extension is in a more auto-oriented area, with more likely car-to-train switchers (this is still much denser than an American park-and-ride); on net, though, I think the differences are not huge and could to an extent even be folded into the notion of cost per rider, which is substantially better on Broadway than in Surrey and Langley.
That said, metros consistently have much lower operating costs than light rail and buses in the same city; here are American cost profiles. As far as I can tell from CoMET data, most European and Asian metros cluster toward the bottom end of the American cost profile (such as the Chicago L; the New York City Subway is the top end among the big systems); bus operating costs are more or less proportional to driver wages times operating hours throughout the developed world. Here we need to briefly switch to cost per p-km, since mature urban rail networks use buses as short-hop feeders – the counterfactual to a bus-based network for New York isn’t people riding the same bus routes as today but at higher intensity, but people riding longer bus routes, so the cost would roughly scale to cost per p-km, not per passenger.
In rich Asia, metros are profitable. In Europe, it depends – the London Underground operationally broke even in the early 2010s, and the Berlin U-Bahn was said to do the same in the late 2010s. In healthy European systems, it’s never reported directly, since there’s fare integration across the region, so financial data are reported at metropolitan scale without much breakdown between the modes, but the farebox operating ratios in at least Germany and Scandinavia, and probably also Paris (which has much higher ridership density than London or Berlin, comparable costs per car-km, and higher fares than pre-2022 Berlin), suggest that metros and the inner sections of commuter rail systems can break even, and then the subsidies go to the buses and to suburban extensions.
Individual bus systems can be profitable, but never at metropolitan scale, not in the first-world cities I’m aware of. In New York, the buses between New Jersey and Manhattan are profitable and run by private companies, but that’s one specific section of the system, and on net the bus system in New Jersey, including not just these cross-tunnel buses but also internal buses within the state, loses money, covered by New Jersey Transit subsidies, and the financial performance of buses within New York is, frankly, terrible.
One potential complication is that BRT infrastructure is usually installed on the highest-performing individual routes, and those can have rather low operating costs. But then, the operating costs of the buses on Broadway in Vancouver are extraordinarily low, and still the projections are for the SkyTrain extension that would replace them to, on net, reduce systemwide operating subsidies. If your city has a bus corridor so strong that ordinary BRT would be profitable, the corridor has high enough ridership for a subway.
Light rail is essentially a via media between metros and buses: higher operating costs than metros, in theory lower ones than buses. I say in theory, because in the United States, light rail as a mode comprises different things, some behaving like lower-efficiency subways with shorter cars like the Boston Green Lines, and others running as mostly grade-separated urban rail in cities like the Los Angeles and Portland cities with extremely low ridership and high resulting operating costs. But a light rail system with serious ridership should comfortably obtain better operating outcomes than buses, if worse ones than metros.
Costs per rider can be too low
In New York, as mentioned above, the current urban rail extensions under construction (Second Avenue Subway Phase 2) or discussion (Interborough Express) have costs not far from the frontier relative to American incomes. In Berlin, the extensions instead are far cheaper; U8 to Märkisches Viertel was projected to cost 13,160€ per daily rider in 2021, which is a fraction of Germany’s GDP per capita.
This does not mean Berlin builds cost-effectively. It means Berlin builds too little. A line that costs less than one third the country’s GDP per capita should have been built when the GDP per capita was one third what it is now. If there are a lot of such possibilities in the city, it means there was a crisis it’s only now recovering from or there has been too much austerity, or both, in the case of Berlin.
Healthy construction environments – that is, not Germany, which has normal costs per kilometer and chooses to barely build intercity or urban rail – will instead build to the frontier of what’s cost-effective. In New York, it’s Second Avenue Subway; in Madrid, it’s extensions into deep suburbia making the system almost as long as that of New York, on one third the metro area population. Rational yes/no decisions on whether to build at all can coexist with good construction practices or with deeply irrational ones.
Worthless Canadian Initiative
Canada just announced a few days ago that it is capping the number of international student visas; the Times Higher Education and BBC both point out that the main argument used in favor of the cap is that there’s a housing shortage in Canada. Indeed, the way immigration politics plays out in Canada is such that the cap is hard to justify by other means: traditionally, the system there prioritized high-skill workers, to the point that there has been conservative criticism of the Trudeau cabinet for greatly expanding low-skill (namely, refugee) migration; capping student visas is not how one responds to such criticism.
The issue is that Canada builds a fair amount of housing, but not enough for population growth; the solution is to build more – in a fast-growing country like Canada, the finance sector expects housing demand to grow and therefore will readily build more if it is allowed to.
Vancouver deserves credit for the quality of its transit-oriented development and to a large extent also for the amount of absolute development it permits (about 10 units per 1,000 residents annually); but its ability to build is much greater than that, precisely because rapid immigration means that more housing is profitable, even at higher interest rates. The population growth coming from immigration sends a signal to the market, invest in long-term tangible goods like housing. Thus, Vancouver deserves less credit for its permissiveness of development – large swaths of the city are zoned for single-family housing with granny flats allowed, including in-demand West Side neighborhoods with good access to UBC and Downtown jobs by current buses and future SkyTrain.
The rub is that restricting student immigration is probably the worst possible way to deal with a housing shortage. Students live at high levels of crowding, and the marginal students, who the visa cap is excluding, live at higher levels of crowding than the rest because they tend to be at poorer universities and from poorer backgrounds. The reduction in present-day demand is limited. In Vancouver, an empty nester couple with 250 square meters of single-family housing in Shaughnessy is consuming far more housing, and sitting on far more land that could be redeveloped at high density, than four immigrants sharing a two-bedroom apartment in East Vancouver.
In contrast, the reduction in future demand is substantial, because those students then graduate and get work, and many of them get high-skill, high-wage jobs (the Canadian university graduate premium is declining but still large; the American one is larger, but the US is also a higher-inequality society in general); having fewer students, even fewer marginal students who might take jobs below their skill level, is still a reduction in both future population and future productivity. What this means is that capital owners deciding where to allocate assets are less likely to be financing construction.
The limiting factor on housing production is to a large extent NIMBYism, and there, in theory, immigration restrictions are neutral. (In practice, they can come out of a sense of national greatness developmental conservatism that wants to build a lot but restrict who can come in, or out of anti-developmental NIMBYism that feels empowered to build less as fewer people are coming; this situation is the latter.) However, it’s not entirely NIMBYism – private developmental still has to be profitable, and judging by the discourse I’m seeing on Canadian high-rise housing construction costs in Toronto and Vancouver, it’s not entirely a matter of permits. Even in an environment with extensive NIMBYism like the single-family areas of Vancouver and Toronto, costs and future profits matter.
The Need for Ample Zoning Capacity
An article by Vishaan Chakrabarti in last month’s New York Times about how to make room for a million more people in New York reminded me of something that YIMBY blogs a decade ago were talking about, regarding zoning capacity. Chakrabarti has an outline of where it’s possible to add housing under the constraints that it must be within walking distance of the subway, commuter rail, or Staten Island Railway, and that it must be of similar height to the preexisting character of the neighborhood. With these constraints, it’s possible to find empty lots, parking lots, disused industrial sites, and (in near-Midtown Manhattan) office buildings for conversion, allowing adding about half a million dwellings in the city. It’s a good exercise – and it’s a great explanation for why those constraints, together, make it impossible to add a meaningful quantity of housing. Transit-oriented development successes go far beyond these constraints and build to much higher density than is typical in their local areas, which can be mid-rise (in Europe) or high-rise (in Canada and Asia).
The issue with the proposal is that in practice, not all developable sites get developed. The reasons for this can include any of the following:
- The parcel owner can’t secure capital because of market conditions or because of the owner’s particular situation.
- The parcel is underdeveloped but not empty, and the owner chooses not to redevelop, for a personal or other reason.
- The area is not in demand, as is likely the case near the Staten Island Railway or commuter rail stations in Eastern Queens, or in much of the Bronx.
- The area is so auto-oriented, even if it is technically near a station, that prospective buyers (and banks) demand parking, reducing density.
New York has, on 2020 census numbers, 8.8 million people; 1 million additional New Yorkers is 11% more people. Cities that permit a lot of housing have an envelope for much more than 11% extra population. In New York’s history, it was computed in 1956 that under the then-current 1916 zoning code, the city’s zoned capacity was 55 million people, but under the proposed code that would be enacted in 1961, the zoned capacity would fall to 12 million. In Los Angeles, The Homeowner Revolution makes the point (on PDF-page 19) that in 1960, zoned capacity was 10 million in the city proper, four times the city’s population, but by 1990 it fell to 3.9 million, 11% more than the city’s population.

Technically, the same extra zoned capacity that Chakrabarti finds for New York has existed in Los Angeles for a generation. In practice, for all the above reasons why development never reaches 100% of capacity even in expensive areas, Los Angeles builds very little housing, and rents are very high, perhaps comparable to those of New York even as wages are much lower.
What this means is that the way forward for any transit-oriented development plan has to get out of the mentality that the buildings need to be of similar size to the existing character of the neighborhood. This constraint is too strict, and not at all observed in any successful example that I know of.
To Americans, the most accessible example of transit-oriented development success is Vancouver; some sections of the Washington suburbs (especially Arlington) qualify as well, but the extent there is much less than in Canada, and consequently ridership on Washington Metro has lagged that of its Canadian counterparts. In Vancouver, the rule that Chakrabarti imposes that the preexisting parcels must be empty or nonresidential is largely observed – as far as I can tell, the city has not upzoned low-density residential areas near SkyTrain, and even in Burnaby, the bulk of redevelopment has been in nonresidential areas.
The redevelopment in Vancouver proper looks like this:

And here is Metrotown, Burnaby:

The surface parking may look obnoxious to urbanists, but the area has more jobs, retail, and housing than the parking lots can admit, and the modal split is very high.
European transit-oriented development is squatter – the buildings are generally less tall, and they’re spread over a larger contiguous area, so that beyond the resolution of a few blocks the density is high as well. But it, too, often grows well beyond tradition. For example, here is Bercy, a redevelopment of the steam-era railyards at Gare de Lyon, no longer necessary with modern rail technology:
In the future, a New York that wants to make more room will need to do what Vancouver and Paris did. There is no other way.
The Four Quadrants of Cities for Transit Revival
Cities that wish to improve their public transportation access and usage are in a bind. Unless they’re already very transit-oriented, they have not only an entrenched economic elite that drives (for example, small business owners almost universally drive), but also have a physical layout that isn’t easy to retrofit even if there is political consensus for modal shift. Thus, to shift travel away from cars, new interventions are needed. Here, there is a distinction between old and new cities. Old cities usually have cores that can be made transit-oriented relatively easily; new cities have demand for new growth, which can be channeled into transit-oriented development. Thus, usually, in both kinds of cities, a considerably degree of modal shift is in fact possible.
However, it’s perhaps best to treat the features of old and new cities separately. The features of old cities that make transit revival possible, that is the presence of a historic core, and those of new cities, that is demand for future growth, are not in perfect negative correlation. In fact, I’m not sure they consistently have negative correlation at all. So this is really a two-by-two diagram, producing four quadrants of potential transit cities.
Old cities
The history of public transportation is one of decline in the second half of the 20th century in places that were already rich then; newly-industrialized countries often have different histories. The upshot is that an old auto-oriented place must have been a sizable city before the decline of mass transit, giving it a large core to work from. This core is typically fairly walkable and dense, so transit revival would start from there.
The most successful examples I know of involve the restoration of historic railroads as modern regional lines. Germany is full of small towns that have done so; Hans-Joachim Zierke has some examples of low-cost restoration of regional lines. Overall, Germany writ large must be viewed as such an example: while German economic growth is healthy, population growth is anemic, and the gradual increase in the modal split for public transportation here must be viewed as more intensive reuse of a historic national rail network, anchored by tens of small city cores.
At the level of a metropolitan area, the best candidates for such a revival are similarly old places; in North America, the best I can think of for this are Philadelphia, Boston, and Chicago. Americans don’t perceive any of the three as especially auto-oriented, but their modal splits are comparable to those of small French cities. But in a way, they show one way forward. If there’s a walkable, transit-oriented core, then it may be attractive for people to live near city center; in those three cities it’s also possible to live farther away and commute by subway, but in smaller ones (say, smaller New England cities), the subway is not available but conversely it’s usually affordable to live within walking distance of the historic city center. This creates a New Left-flavored transit revival in that it begins with the dense city center as a locus of consumption, and only then, as a critical mass of people lives there, as a place that it’s worth building new urban rail to.
New cities
Usually, if a city has a lot of recent growth from the era in which it has become taken for granted that mobility is by car, then it should have demand for further growth in the future. This demand can be planned around growth zones with a combination of higher residential density and higher job density near rail corridors. The best time to do transit-oriented development is before auto-oriented development patterns even set in.
There are multiple North American examples of how this works. The best is Vancouver, a metropolitan area that has gone from 560,000 people in the 1951 census to 2.6 million in the 2021 census. Ordinarily, one should expect such a region to be entirely auto-oriented, as most American cities with almost entirely postwar growth are; but in 2016, the last census before corona, it had a 20% work trip modal split, and that was before the Evergreen extension opened.
Vancouver has achieved this by using its strong demand for growth to build a high-rise city center, with office towers in the very center and residential ones ringing it, as well as high-density residential neighborhoods next to the Expo Line stations. The biggest suburbs of Vancouver have followed the same plan: Burnaby built an entirely new city center at Metrotown in conjunction with the Expo Line, and even more auto-oriented Surrey has built up Whalley, at the current outer terminal of the line, as one of its main city centers. Housing growth in the region is rapid; YIMBY advocacy calls for more, but the main focus isn’t on broad development (since this already happens) but on permitting more housing in recalcitrant rich areas, led by the West Side, which will soon have its Broadway extension of the Millennium Line.
Less certain but still interesting examples of the same principle are Calgary, Seattle, and Washington. Calgary, a low-density city, planned its growth around the C-Train, and built a high-rise city center, limiting job sprawl even as residential sprawl is extensive; Seattle and the Virginia-side suburbs of Washington have permitted extensive infill housing and this has helped their urban rail systems achieve high ridership by American standards, Seattle even overtaking Philadelphia’s modal split.
The four quadrants
The above contrast of old and new cities misses cities that have positive features of both – or neither. The cities with both positive features have the easiest time improving their public transportation systems, and many have never been truly auto-oriented, such as New York or Berlin, to the point that they’re not the best examples to use for how a more auto-oriented city can redevelop as a transit city.
In North America, the best example of both is San Francisco, which simultaneously is an old city with a high-density core and a place with immense demand for growth fueled by the tech industry. The third-generation tech firms – those founded from the mid-2000s onward (Facebook is in a way the last second-generation firm, which generation began with Apple and Microsoft) – have generally headquartered in the city and not in Silicon Valley. Twitter, Uber, Lyft, Airbnb, Dropbox, and Slack are all in the city, and the traditional central business district has expanded to South of Market to accommodate. This is really a combination of the consumption-oriented old-city model, as growing numbers of employees of older second-generation firms chose to live in the city and reverse-commute to Silicon Valley, and the growth-oriented new-city model. Not for nothing, the narrower metropolitan statistical area of San Francisco (without Silicon Valley) reached a modal split of 17% just before corona, the second highest in the United States, with healthy projections for growth.
But then there is the other quadrant, comprising cities that have neither the positive features of old cities nor those of new cities. To be in this quadrant, a city must not be so old as to have a large historic core or an extensive legacy rail network that can be revived, but also be too poor and stagnant to generate new growth demand. Such a city therefore must have grown in a fairly narrow period of time in the early- to mid-20th century. The best example I can think of is Detroit. The consumption-centric model of old city growth can work even there, but it can’t scale well, since there’s not enough of a core compared with the current extent of the population to build out of.
Vancouver, Stockholm, and the Suburban Metro Model
I was asked by an area advocate about SkyTrain, and this turned into a long email with various models to compare Vancouver with. In my schema contrasting suburban metro systems and S-Bahns, Vancouver is firmly in the first category: SkyTrain is not commuter rail, and Vancouver’s commuter rail system, the West Coast Express, is so weak it might as well not exist. The suburban metro model forces the region to engage in extensive transit-oriented development, which Vancouver has done. Has it been successful? To some extent, yes – Vancouver’s modal split is steadily rising, and in the 2016 census, just before the Evergreen Line opened, was 20%; supposedly it is 24% now. But it could have done better. How so?
Could Vancouver have used the S-Bahn model?
No.
There is a common line of advocacy; glimpses of it can be found on the blog Rail for the Valley, by a writer using the name Zweisystem who commented on transit blogs like Yonah and Jarrett‘s in the 2000s. Using the name of Karlsruhe’s tram-train as inspiration, Zwei has proposed that Vancouver use existing commuter rail corridors in suburban and exurban areas and streetcars in the urban core.
The problem with this is that Vancouver has very little legacy mainline rail infrastructure to work with. There are two mainlines serving city center: the Canadian Pacific, and Canadian National. The CP line hugs the coast, full of industrial customers; the CN line is farther inland and has somewhat more fixable land use, but the Millennium Line partly parallels it and even after 20 years its ridership is not the strongest in the system. Most of the urban core is nowhere near a rail mainline.
This is completely unlike the Central European S-Bahn-and-streetcars systems, all of which have legacy commuter lines radiating in all directions, and use legacy streetcars rather than newly-built light rail lines. In the last generation they’ve expanded their systems, building connections and feeding rapid transit, but none of these is a case of completely getting rid of the streetcars and then restoring them later; the busiest system that’s entirely new, that of Paris, is largely orbitals and feeders for the Métro and RER.
Vancouver did in fact reuse old infrastructure for the suburban metro concept. The Expo Line involved very little greenfield right-of-way use. Most of the core route between the historic core of Vancouver and New Westminster is in the private right-of-way of a historic BC Electric interurban; this is why it parallels Kingsway but does not run elevated over it. The tunnel in Downtown Vancouver is a disused CP tunnel; this is why the tracks are stacked one over the other rather than running side by side – the tunnel was single-track but tall enough to be cut into two levels. This limited the construction cost of the Expo Line, which the largely-elevated Millennium Line and the partly underground, partly elevated Canada Line could not match.
The Stockholm example
In my post about S-Bahns and suburban metros, I characterized Stockholm as an archetypal suburban metro. Stockholm does have an S-Bahn tunnel nowadays, but it only opened 2017, and ridership so far, while rising, is still a fraction of that of the T-bana.
Stockholm’s choice of a full metro system in the 1940s, when it had about a million people in its metro area, had its critics at the time. But there wasn’t much of a choice. The trams were fighting growing traffic congestion, to the point that some lines had to be put in a tunnel, which would later be converted for the use of the Green Line as it goes through Södermalm. Working-class housing was overcrowded and there was demand for more housing in Stockholm, which would eventually be satisfied by the Million Program.
And there were too few commuter lines for an S-Bahn system. Swedes were perfectly aware of the existence of the S-Bahn model; Berlin and Hamburg both had S-Bahns running on dedicated tracks, and Copenhagen had built its own system, called S-Tog in imitation of the German name. But they didn’t build that. None of this was the integrated Takt timetable that Munich would perfect in the 1970s, in which branches could be left single-track or shared with intercity trains provided the regular 20-minute headways could be scheduled to avoid conflicts; the track sharing required in the 1940s would have been too disruptive. Not to mention, Stockholm had too few lines, if not so few as Vancouver – only two branches on each of two sides of city center, with most of the urban core far from the train.
So Stockholm built the T-bana, with three highly branched lines all meeting at T-Centralen, the oldest two of the three having a cross-platform transfer there and at the two stations farther south. The roughly 104 km system (57 km underground) cost, in 2022 US dollars, $3.6 billion. Stockholm removed all the regular streetcars; a handful running all or mostly in private rights-of-way were retained with forced transfers at outlying T-bana stations like Ropsten, as was the narrow-gauge Roslagsbana (with a forced transfer at KTH, where I worked for two years).
At the same time the T-bana was under construction, the state built the Million Program, and in the Stockholm region, the housing projects were designed to be thoroughly oriented around the system. The pre-Million Program TOD suburb of Vällingby was envisioned as part of a so-called string of pearls, in which towns would radiate from each T-bana station, with local retail and jobs near the station surrounded by housing. In 2019, the T-bana had 1,265,900 riders per workday, Citybanan had 410,300, and the remaining lines 216,100; Sweden reports modal split for all trips and not just work trips, but the commute modal split appears to be 40% or a little higher, a figure that matches Paris, a metro area of 13 million that opened its first metro line in 1900.
So why is Stockholm better?
There are parallels between Stockholm and Vancouver – both are postwar cities with 2.5 million people in their metropolitan areas with rapid growth due to immigration. Their physical geographies are similar, with water barriers inhibiting the contiguous sprawl of many peers. Both extensively employed TOD to shape urban geography around the train: Stockholm has Vällingby and other, less famous examples of TOD; Vancouver has Metrotown and smaller examples of residential TOD along the Expo Line, alongside a famously high-rise downtown. But the T-bana has more than twice the annual ridership of SkyTrain, and Stockholm has around twice the modal split of Vancouver – this is not a matter of Canadians riding buses more than Europeans do. So what gives?
Part of it is about TOD models. Stockholm is an exceptionally monocentric city, and this has created a lot of demand for urban rail to Central Stockholm. But Vancouver’s high-rise city center has a lot of jobs, and overall, around 30% of Metro Vancouver jobs are in the city or the University Endowment Lands (that is, UBC), and the proportion of Stockholm County jobs within an equivalent area is similar. Vancouver has never built anything as massive as the Million Program, but its housing growth rate is one of the highest in the world (around 11 gross units/1,000 people per year in the 2010s), and much of that growth clusters near the Expo Line and increasingly also near the worse-developed Millennium and Canada Lines.
I suspect that the largest reason is simply the extent of the systems. SkyTrain misses the entire West Side of Vancouver west of Cambie, has poor coverage in Surrey and none in Langley, and does not cross the Burrard Inlet. The T-bana has no comparable lacunae: Roslag is served by Roslagsbanan, and the areas to be served by the under-construction extensions are all target TOD areas with much less present-day density than North Vancouver, the cores of Fairview and Kitsilano, or the town centers in Surrey other than Whalley.
What’s more, Stockholm’s construction costs may be rising but those of Vancouver (and the rest of Canada) are rising even faster and from a higher base. Nya Tunnelbanan is currently budgeted at $3.6 billion in PPP terms – 19 underground km for about the same cost as the existing 104 – but Vancouver is building half of the most critical SkyTrain extension, that under Broadway, for C$2.83 billion (US$2.253 billion in PPP terms) for just 5 km, not all underground. The projected cost per rider is still favorable, but it’s less favorable for the planned extension to Langley, and there’s no active plan for anything to the North Shore.
The silver lining for Vancouver is that the West Side is big and underdeveloped. The region has the money to extend SkyTrain not just to Arbutus as is under construction but all the way to UBC, and the entire swath of land between Central Broadway and UBC screams “redevelop me.” The current land use is a mix of mid-rise, townhouses (“missing middle”), and single-family housing; Shaughnessy, whose northern end is within a kilometer of under-construction SkyTrain stations, is single-family on large lots, and can be redeveloped as high-rise housing alongside closer-in areas. Canada does not have Europe’s allergy to tall buildings, and this is a resource that can be used to turn Vancouver into a far more transit-oriented city along the few corridors where it can afford to build. The suburban metro is always like this: fewer lines, more development intensity along them.
The Interborough Study
I was excited about the idea of Interborough Express (IBX) as announced by New York Governor Kathy Hochul, and then last week her office released a preliminary report about the alternatives for it, and I got less excited. But it’s not that the study is bad, or that Hochul is bad. Rather, the study is a by the numbers alternatives analysis, shorter than the usual in a good way; its shortcomings are the shortcomings of all American planning.
The main rub is that the report looks at various options for the IBX route, broken down by mode. There’s a commuter rail option, which bakes in the usual bad assumption about commuter rail operations, including heavier trains (lighter trains are legal on US tracks as of 2018) and longer dwell times that are explained as a product of the heavier trains (dwell times have nothing to do with train mass). That’s par for the course – as we saw yesterday, everything that touches mainline rail in North America becomes stupid even in an otherwise understandable report.
But even excluding commuter rail, the study classifies the options by mode, focusing on bus rapid transit and light rail (and no subway, for some reason). It compares those two options and commuter rail on various measures like expected ridership and trip times. This is normal for American alternatives analyses for new corridors like IBX: they look at different modes as the main decision point.
This is also extraordinarily bad governance. There are some fundamental questions that are treated as afterthoughts, either not studied at all or mentioned briefly as 1-2 sentences:
- How far north should the line go? The IBX plan is to only go from Jackson Heights to the south, in contrast with older Triboro proposals going into the Bronx.
- What should the stop spacing be? The stops can be widely spaced, as in the current proposal, which stops mainly at intersection points with other lines, or more closely spaced, like an ordinary subway line.
- Under a light rail option, should the line be elevated where the trench is too narrow or at-grade?
- Should freight service be retained? What are the benefits of retaining freight rail service on the Bay Ridge Branch and what are the incremental costs of keeping it versus taking over the right-of-way?
- How large should the stations be?
- How frequent should the trains be? If freight service is retained, what frequencies are compatible with running freight on the same tracks for part or all of the line?
A better study must focus on these questions. Some of them, moreover, must be decided early: urban planning depends on whether the line goes into the Bronx or not; and industrial planning depends on what is done with freight service along the corridor.
Those questions, moreover, are more difficult than the modal question. A BRT option on a rail corridor without closely parallel arterial roads should be dismissed with the same ease that the study dismisses options not studied, and then the question of what kind of rail service to run is much less important than the scope of the project.
But American planning is obsessed with comparing public transit by mode rather than by corridor, scope, or any other aspect. Canadian planning has the same misfeature – the studies for the Broadway SkyTrain extension looked at various BRT and light rail options throughout, even though it was clear the answer was going to be SkyTrain, and omitted more fundamental questions regarding the cost-construction disruption tradeoff or even the scope of the project (the original studies from 2012 did not look at truncating to Arbutus, an option that had been talked about before and that would eventually happen due to cost overruns).
So overall, the IBX study is bad. But it is interestingly bad. Andrew Cuomo was a despicable governor who belongs in prison for his crimes. Less criminal and yet similarly loathsome people exist in American public transit. And yet, Hochul and her office are not like that, at all. This is not a sandbag, or a corrupt deal. It’s utterly ordinary in its failure; with all the unique failures of the Cuomo era stripped, what is left is standard American practice, written more clearly than is usual, and it just isn’t up to par as an analysis.
Hochul has been moving on this project very quickly, and good transit advocates should laud this. It should not take long to publish a report comparing alternatives on more fundamental questions than mode, such as scope, the role of freight, and the extent of civil infrastructure to be used. The costs and benefits of IBX heavily depend on the decisions made on such matters; they should not be brushed aside.
I Gave a Talk About Canadian Construction Costs
There was a conference I got invited to, consisting of three talks, two about state capacity by me and by Tyler Cowen, and one by a Canadian extramural Conservative politician named Ginny Roth (she’s a columnist but her talk was about how Conservatives could use the insights of state capacity to win elections, hence my appellation). It was run by entrepreneurs named Chris and Matt Spoke, doing a series of online meetings trying to introduce fresh ideas to what they hope will be the next crop of Tory leaders; there’s going to be one on housing in the future, and the YIMBY comments I made seemed popular with the crowd.
Here is a link to my slides. They shouldn’t be too surprising given my usual talk on construction costs and what I said before about the growth in Canadian costs. But I made sure to put the increase in costs in Canada all together in two slides, one about Toronto, sourced to Stephen Wickens, and one about the rest of Canada, sourced to both our database and to a comparison of Calgary’s costs through the 2000s with Calgary’s West LRT costs.
The organizers are in Toronto, so I didn’t talk too much about the situation in Vancouver. I said a few sentences about how I can see there was a real increase in costs from a difference between the half-elevated Canada Line and the 87% underground Broadway subway under construction, but I didn’t go into the history of the Canada Line’s cut-and-cover method or the cost estimates from the early 2010s, which had the Broadway subway costing C$250 million/km. I talked more about Toronto, where the increase in costs is larger; Vancouver, even with the cost increases, remains North America’s lowest-construction-cost city, since the other cities have had even bigger increases, including Toronto, Los Angeles, and Seattle.
I want to highlight, as I brought up 1.5 years ago, that while Canada has American (i.e. bad) mainline rail, and Americanizing construction costs, it is YIMBYer than both the US and Europe. I worry it won’t last for long, because the style of Canadian redevelopment is at fairly small radius from an arterial or a subway station and those will eventually run out, forcing upzoning of large swaths of single-family land for the benefit of everyone except the handful of aggrieved homeowners who dominate municipal politics. (There was not enough time to talk about the importance of high-level decisionmaking, that is at the provincial level and not the municipal one.)
High-Speed Rail and the Pacific Northwest
The Pacific Northwest seems like the perfect region for high-speed rail: its cities form a neat line from Vancouver to Portland and points south, grow at high rates with transit-oriented development, and have sizable employment cores around the train station. And yet, when I generated my high-speed rail maps, I could only include it as a marginal case, and even that inclusion was charitable:
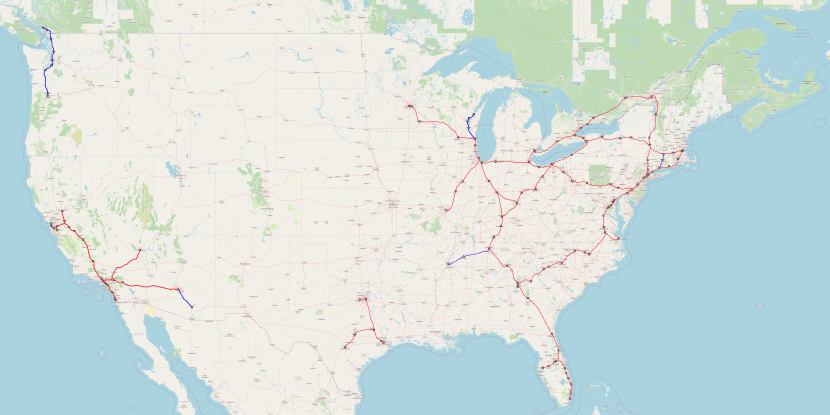
Red means lines that should definitely get high-speed rail, blue means marginal cases, some with strong medium-speed tie-ins.
(Full-size image is available here.)
There’s been a lot of criticism over why I’m including Atlanta-Jacksonville but not Vancouver-Seattle-Portland, and I’d like to explain why the model says this.
Density
The population density in the Western United States is very low. What this means in practice is that cities are far apart – the best example is Denver, a large metropolitan area that is 537 km from the nearest million-plus metro area (Albuquerque). A high-speed line can connect two cities, maybe three, but will not form the multi-city trunk that one sees in Germany or Italy, or even Spain or France. Lines can still make sense if they serve enormous cities like Los Angeles, but otherwise there just isn’t much.
This relates to Metcalfe’s law of network effects. In a dense region, the 500-800 km radius around a city will have so many other cities that network effects are obtained as the system grows. Even Florida, which isn’t dense by European standards, has cities placed closely enough that a medium-size system can connect Miami, Orlando, Tampa, and Jacksonville, and then with a 500 km extension reach Atlanta. The I-85 corridor can likewise accrete cities along the way between Washington and Atlanta and get decent ridership.
In the Pacific Northwest, any intercity infrastructure has to live off Vancouver, Seattle, and Portland – that’s it. Spokane is small, orthogonal to the main line, and separated by mountains; Salem and Eugene are small and Salem is technically in the Portland combined statistical area; California’s cities are very far away and separated by mountains that would take a base tunnel to cross at speed. And Seattle is just not that big – the CSA has 5 million people, about the same as Berlin, which has within 530 km every German metropolitan area.
The model
The model thinks that with Vancouver (2.6)-Seattle (5) at 220 km and Seattle-Portland (3.2) at 280, ridership is as follows, in millions of passengers per year in both directions combined:
| City S\City N | Vancouver | Seattle |
| Seattle | 2.33 | — |
| Portland | 1.63 | 2.76 |
In operating profits in millions of dollars per year, this is,
| City S\City N | Vancouver | Seattle |
| Seattle | 33.32 | — |
| Portland | 52.98 | 50.23 |
This is $135 million a year. It’s actually more optimistic than the official WSDOT study, which thinks the line can’t make an operating profit at all, due to an error in converting between miles and kilometers. The WSDOT study also thinks the cost of the system is $24-42 billion, which is very high. Nonetheless, a normal cost for Vancouver-Portland HSR is on the order of $15 billion, a bit higher than the norm because of the need for some tunnels and some constrained urban construction through I-5 in Seattle.
It isn’t even close. The financial ROI is 0.9%, which is below the rate of return for government debt in the very long run. Even with social benefits included, the rate is very low, maybe 2.5% – and once social benefits come into play, the value of capital rises because competing government investment priorities have social benefits too so it’s best to use the private-sector cost of capital, which is 4-5%.
This exercise showcases the value of density to intercity rail networks. You don’t need Dutch density, but Western US density is too low – the network effects are too weak except in and around California. It would be mad to build Atlanta-Jacksonville as a high-speed rail segment on its own, but once the Florida network and the I-85 network preexist, justified by their internal ridership and by the Piedmont’s connections to the Northeast, connecting Atlanta and Jacksonville becomes valuable.
Growth
The one saving grace of the Pacific Northwest is growth. That’s why it’s even included on the map. Lines in the 1.5-1.8% ROI region are not depicted at all, namely Houston-New Orleans and Dallas-Oklahoma City-Kansas City-St. Louis, both discounted because none of the cities connected has local public transportation or a strong city center. The Pacific Northwest is not discounted, and also benefits from strong growth at all ends.
The gravity model says that ridership is proportional to the 0.8th power of the population of each city connected. To get from 0.9% to 2% requires a factor of 2.2 growth, which requires each city to grow by a factor of 2.2^0.625 = 1.65.
Is such growth plausible? Yes, in the long run. In 2006-16, Metro Vancouver grew 16%; in 2010-9, the core three-county Seattle metro area (not CSA) grew 16% as well, and the core Portland metro area (again, not CSA) grew 12%. At 16% growth per decade, the populations will rise by the required factor in 34 years, so building for the 20-year horizon and then relying on ridership growth in the 2050s and 60s isn’t bad. But then that has a lot of risk embedded in it – the growth of Seattle is focused on two companies in a similar industry, and that of Vancouver is to a large extent the same industry too.
Moreover, the region’s relative YIMBYism can turn into NIMBYism fast. Metro Vancouver’s housing growth is healthy, but the region is fast running out of developable non-residential areas closer in than Surrey, which means it will need to replace single-family housing on the West Side with apartment buildings, which it hasn’t done so far. Growing construction costs are also threatening the ability of both Vancouver and Seattle to feed commuters into their central business districts by rail – Seattle may have built U-Link for costs that exist in Germany, but the Ballard/West Seattle line is $650 million/km and mostly above-ground, and the Broadway subway in Vancouver, while only C$500 million/km, is still on the expensive side by non-Anglo standards. It’s useful to plan around future growth and safeguard the line, but not to build it just on the promise of future growth, not at this stage.
Costs Matter: Some Examples
A bunch of Americans who should know better tell me that nobody really cares about construction costs – what matters is getting projects built. This post is dedicated to them; if you already believe that efficiency and social return on investment matter then you may find these examples interesting but you probably are not looking for the main argument.
Exhibit 1: North America
Vancouver
I wrote a post focusing on some North American West Coast examples 5 years ago, but costs have since run over and this matters from the point of view of building more in the future. In the 2000s and 10s, Vancouver had the lowest construction costs in North America. The cost estimate for the Broadway subway in the 2010s was C$250 million per kilometer, which is below world median; subsequently, after I wrote the original post, an overrun by a factor of about two was announced, in line with real increases in costs throughout Canada in the same period.
Metro Vancouver has always had to contend with small, finite amounts of money, especially with obligatory political waste. The Broadway subway serves the two largest non-CBD job centers in the region, the City Hall/Central Broadway area and the UBC, but in regional politics it is viewed as a Vancouver project that must be balanced with a suburban project, namely the lower-performing Surrey light rail. Thus, the amount of money that was ever made available was about in line with the original budget, which is currently only enough to build half the line. Owing to the geography of the West Side, half a line is a lot less than half as good as the full line, so Vancouver’s inability to control costs has led to worse public transportation investment.
Toronto
Like Vancouver, Toronto has gone from having pretty good cost control 20 years ago to having terrible cost control today. Toronto’s situation is in fact worse – its urban rail program today is a contender for the second most expensive per kilometer in the world, next to New York. The question of whether it beats Singapore, Hong Kong, London, Melbourne, Manila, Qatar, and Los Angeles depends on project details, essentially on scoring which of these is geologically and geographically the hardest to build in assuming competent leadership, which is in short supply in all of these cities. I am even tempted to specifically blame the most recent political interference for the rising costs, just as the adoption of design-build in the 2000s as an in-vogue reform must be blamed for the beginning of the cost blowouts.
The result is that Toronto is building less stuff. It’s been planning a U-shaped Downtown Relief Line for decades, since only the Yonge-University-Spadina (“YUS”) line serves downtown proper and is therefore overcrowded. However, it’s not really able to afford the full line, and hence it keeps downgrading it with various iterations, right now to an inverted L for the Ontario Line project.
Los Angeles
Los Angeles’s costs, uniquely in the United States, seemed reasonable 15 years ago, and no longer are. This, as in Canada, can be seen in building less stuff. High-ranking officials at Los Angeles Metro explained to me and Eric that the money for capital expansion is bound by formulas decided by referendum; there is a schedule for how to spend the money as far as 2060, which means that anything that is not in the current plan is not planned to be built in the next 40 years. Shifting priorities is not really possible, not with how Metro has to buy off every regional interest group to ensure the tax increases win referendums by the required 2/3 supermajority. And even then, the taxes imposed are rising to become a noticeable fraction of consumer spending – even if California went to majority vote, its tax capacity would remain very finite.
New York
The history of Second Avenue Subway screams “we would have built more had costs been lower.” People with deeper historic grounding than I do have written at length about the problems of the Independent Subway System (“IND”) built in the 1920s and 30s; in short, construction costs were in today’s terms around $140 million per km, which at the time was a lot (London and Paris were building subways for $30-35 million/km), and this doomed the Second System. But the same impact of high costs, scaled to the modern economy, is seen for the current SAS project.
The history of SAS is that it was planned as a single system from 125th Street to Hanover Square. The politician most responsible for funding it, Sheldon Silver, represented the Lower East Side. But spending capacity was limited, and in particular Silver had to trade that horse for East Side Access serving Long Island, which was Governor George Pataki’s base. The package was such that SAS could only get a few billion dollars, whereas at the time the cost estimate for the entire 13-km line was $17 billion. That’s why SAS was chopped into four phases, starting on the Upper East Side. Silver himself signed off on this in the early 2000s even though his district would only be served in phase four: he and the MTA assumed that there would be further statewide infrastructure packages and the entire line would be complete by 2020.
Exhibit 2: Israel
Israel is discussing extending the Tel Aviv Metro. It sounds weird to speak of extensions when the first line is yet to open, but that line, the Red Line, is under construction and close enough to the end that people are believing it will happen; Israelis’ faith that there would ever be a subway in Tel Aviv was until recently comparable to New Yorkers’ faith until the early 2010s that Second Avenue Subway would ever open. The Red Line is a subway-surface Stadtbahn, as is the under-construction Green Line and the planned Purple Line. But metropolitan Tel Aviv keeps growing and is at this point an economic conurbation of about 3-4 million people, with a contiguous urban core of 1.5 million. It needs more. Hence, people keep discussing additions. The Ministry of Finance, having soured on the Stadtbahn idea, bypassed the Ministry of Transport and introduced a complementary three-line underground driverless metro system.
The cost of the system is estimated at 130-150 billion shekels, which is around $39 billion. This is not a sum Israelis are used to seeing for a government project. It’s about two years’ worth of IDF spending, and Israeli is a militarized society. It’s about 10% of annual GDP, which in American or EU-wide terms would be $2 trillion. The state has many competing budget priorities, and there are so many other valid claims on the state coffers. It is therefore likely that the metro project’s construction will stretch over many years, not out of planning latency but out of real resource limits. People in Israel understand that Gush Dan has severe traffic congestion and needs better transportation – this is not a point of political controversy in a society that has many. But this means the public is willing to spend this amount of money over 15-20 years at the shortest. Were costs to double, in line with the costs in most of th Anglosphere, it would take twice as long; were they to fall in half, in line with Mediterranean Europe, it would take half as long.
Exhibit 3: Spain
As the country with the world’s lowest construction costs for infrastructure, Spain builds a lot of it, everywhere. This includes places where nobody else would think to build a metro tunnel or an airport or a high-speed rail line; Spain has the world’s second longest high-speed rail network, behind China. Many of these lines probably don’t even make sense within a Spanish context – RENFE at best operationally breaks even, and the airports were often white elephants built at the peak of the Spanish bubble before the 2008 financial crisis.
One can see this in urban rail length just as in high-speed rail. Madrid Metro is 293 km long, the third longest in Europe behind London and Moscow. This is the result of aggressive expansion in the 1990s and 2000s; new readers are invited to read Manuel Melis Maynar’s writeup of how when he was Madrid Metro’s CEO he built tunnels so cheaply. Expansion slowed down dramatically after the financial crisis, but is starting up again; the Spanish economy is not good, but when one can build subways for €100 million per kilometer, one can build subways that other cities would not. In addition to regular metros, Madrid also has regional rail tunnels – two of them in operation, going north-south, with a third under construction going east-west and a separate mainline rail tunnel for cross-city high-speed rail.
Exhibit 4: Japan
Japan practices economic austerity. It wants to privatize Tokyo Metro, and to get the best price, it needs to keep debt service low. When the Fukutoshin Line opened in 2008, Tokyo Metro said it would be the system’s last line, to limit depreciation and interest costs. The line amounted to around $280 million/km in today’s money, but Tokyo Metro warned that the next line would have to cost $500 million/km, which was too high. The rule in Japan has recently been that the state will fund a subway if it is profitable enough to pay back construction costs within 30 years.
Now, as a matter of politics, on can and should point out that a 30-year payback, or 3.3% annual interest, is ridiculously high. For one, Japan’s natural interest rate is far lower, and corporations borrow at a fraction of that interest; JR Central is expecting to be paying down Chuo Shinkansen debt until the 2090s, for a project that is slated to open in full in the 2040s. However, if the state changes its rule to something else, say 1% interest, all that will change is the frontier of what it will fund; lines will continue to be built up to a budgetary limit, so that the lower the construction costs, the more stuff can be built.
Conclusion: the frontier of construction
In a functioning state, infrastructure is built as it becomes cost-effective based on economic growth, demographic projections, public need, and advances in technology. There can be political or cultural influences on the decisionmaking process, but they don’t lead to huge swings. What this means is that as time goes by, more infrastructure becomes viable – and infrastructure is generally built shortly after it becomes economically beneficial, so that it looks right on the edge of viability.
This is why megaprojects are so controversial. Taiwan High-Speed Rail and Korea Train Express are both very strong systems nowadays. Total KTX ridership stood at 89 million in 2019 and was rising on the eve of corona, thanks to Korea’s ability to build more and more lines, for example the $69 million/km, 82% underground SRT reverse-branch. THSR, which has financial data on Wikipedia, has 67 million annual riders and is financially profitable, returning about 4% on capital after depreciation, before interest. But when KTX and THSR opened, they both came far below ridership projections, which were made in the 1990s when they had much faster economic convergence before the 1997 crisis. They were viewed as white elephants, and THSR could not pay interest and had to refinance at a lower rate. Taiwan and South Korea could have waited 15 years and only opened HSR now that they have almost fully converged to first-world Western incomes. But why would they? In the 2000s, HSR in both countries was a positive value proposition; why skip on 15 years of good infrastructure just because it was controversially good then and only uncontroversially good now?
In a functioning state, there is always a frontier of technology. The more cost-effective construction is, the further away the frontier is and the more infrastructure can be built. It’s likely that a Japan that can build subways for Korean costs is a Japan that keeps expanding the Tokyo rail network, because Japan is not incompetent, just austerian and somewhat high-cost. The way one gets more stuff built is by ensuring costs look like those of Spain and Korea and not like those of Japan and Israel, let alone those of the United States and Canada.
