In our construction costs report, we highlighted the vast size of the station digs for Second Avenue Subway Phase 1 as one of the primary reasons for the project’s extreme costs. The project’s three new stations cost about three times as much as they should have, even keeping all other issues equal: 96th Street’s dig is about three times as long as necessary based on the trains’ length, and 72nd and 86th Street’s are about twice as long but the stations were mined rather than built cut-and-cover, raising their costs to match that of 96th each. In most comparable cases we’ve found, including Paris, Istanbul, Rome, Stockholm, and (to some extent) Berlin, station digs are barely longer than the minimum necessary for the train platform.
MTA Construction and Development has chosen to keep building oversize stations for Second Avenue Subway Phase 2, a project that despite being for the most part easier than the already-open Phase 1, is projected to cost slightly more per kilometer. Nolan Hicks at the New York Post just published a profile diagram:
The enormous size of 125th Street Station is not going to be a grand civic space. As the diagram indicates, the length of the dig past the platforms will not be accessible to passengers. Instead, it will be used for staff and mechanical rooms. Each department wants its own dedicated space, and at no point has MTA leadership told them no.
Worse, this is the station that has to be mined, since it goes under the Lexington Avenue Line. A high-cost construction technique here is unavoidable, which means that the value of avoiding extra costs is higher than at a shallow cut-and-cover dig like those of 106th and 116th Streets. Hence, the $1 billion hard cost of a single station. This is an understandable cost for a commuter rail station mined under a city center, with four tracks and long trains; on a subway, even one with trains the length of those of the New York City Subway, it is not excusable.
When we researched the case report on Phase 1, one of the things we were told is that the reason for the large size of the stations is that within the MTA, New York City Transit is the prestige agency and gets to call the shots; Capital Construction, now Construction and Development, is smaller and lacks the power to tell NYCT no, and from NYCT’s perspective, giving each department its own break rooms is free money from outside. One of the potential solutions we considered was changing the organizational chart of the agency so that C&D would be grouped with general public works and infrastructure agencies and not with NYCT.
But now the head of the MTA is Janno Lieber, who came from C&D. He knows about our report. So does C&D head Jamie Torres-Springer. When one of Torres-Springer’s staffers said a year ago that of course Second Avenue Subway needs more circulation space than Citybanan in Stockholm, since it has higher ridership (in fact, in 2019 the ridership at each of the two Citybana stations, e.g. pp. 39 and 41, was higher than at each of the three Second Avenue Subway stations), the Stockholm reference wasn’t random. They no longer make that false claim. But they stick to the conclusion that is based on this and similar false claims – namely, that it’s normal to build underground urban rail stations with digs that are twice as long as the platform.
When I call for removing Lieber and Torres-Springer from their positions, publicly, and without a soft landing, this is what I mean. They waste money, and so far, they’ve been rewarded: Phase 2 has received a Full Funding Grant Agreement (FFGA) from the United States Department of Transportation, giving federal imprimatur to the transparently overly expensive design. When they retire, their successors will get to see that incompetence and multi-billion dollar waste is rewarded, and will aim to imitate that. If, in contrast, the governor does the right thing and replaces Lieber and Torres-Springer with people who are not incurious hacks – people who don’t come from the usual milieu of political appointments in the United States but have a track record of success (which, in construction, means not hiring someone from an English-speaking country) – then the message will be the exact opposite: do a good job or else.
There’s a common trope about a new exurban subdivision with nothing but houses, and living in a new building in a relatively new urban neighborhood, I get it. Of course, where I live is dense and walkable – it’s literally in Berlin-Mitte – but it still feels underserved by retail and other neighborhood-scale amenities. But at the same time, those amenities are starting to catch up, following the new residences.
I’ve known since I moved here that the place is pessimally located relative to supermarkets. My previous apartment, in Neukölln, was on a residential street, across the corner from a Penny’s, and about 600 meters from the Aldi on the other side of the Ring and 700 from a Lidl that I went to maybe twice in the year I was there because I thought it was too far. My current place was around 800 meters from the nearest supermarket when I moved here in 2020; very recently a slightly closer Bio Company has opened, with not great selection. Other services seem undersupplied as well, like restaurants, which Cid and I have become acutely aware of as the temperature crossed -5 degrees in the wrong direction. For other stores, we typically have to go to Alexanderplatz or Kottbusser Tor.
I bring this up not to complain – I knew what I was getting into when I rented this place. Rather, I bring this up because I’m seeing this combination of not great neighborhood-scale services and gradual change bringing such services in. The gradual change doesn’t seem like a coincidence – the new things I’ve seen open here in the last 3.5 years are high-end, like the aforementioned Bio Company store, or some yuppie cafes, are exactly what you’d open to cater to people living in new buildings in Berlin.
And that brings me back to the common stereotype of new subdivisions. All they have is residential development. This is not just about exurbia, because I’m seeing this here, in the middle of the city. It’s not even just about capitalist development, because it can also be seen in top-down construction of new neighborhoods: the Million Program suburban housing projects around Stockholm were supposed to be work-live areas, like pre-Million Program Vällingby, but they turned into bedroom communities, because it was more desirable to locate commercial uses in city center or near key T-bana stations.
This is true even when the new development is not purely residential, which the development here isn’t. There are office buildings, including one being built right as we speak. But these, too, take time to bring in neighborhood-scale amenities, and those amenities, in turn, are specific to office workers, leading to a number of cafes that only open around lunch hours.
If anything, the fact that this is infill showcases how this is not so bad when a city develops through accretion of new buildings, in this case as new land becomes available (this is all in the exclusion zone near the Wall), but often also on the margin of the city as it gets a new subway line or as land near its periphery becomes valuable enough to develop. There are a lot of services a walk away; it’s not an especially short walk, but what I get within a 1 km radius is decent and what I get within 1.5 is very good to the point that we still discover new things within that radius of an apartment I’ve lived in for 3.5 years.
And in a way, the archetypical new suburban subdivision often has the same ability to access neighborhood-scale amenities early, just with a snag that they’re farther away than is desirable. It involves driving 10-15 minutes to the strip mall, but in new suburban subdivisions other than the tiny handful that are transit-oriented development, it’s assumed everyone has a car; why else would one even live there? (At the ones that are transit-oriented, early residents can take the train to places with more retail development, which a lot of people do even in mature neighborhoods for more specialized amenities.)
In Northern Europe right now, there’s a growing backlash to perceived injury to people’s prosperity inflicted by the green movement. In Germany this is seen in campaigning this year by the opposition and even by FDP not against the senior party in government but against the Greens. In the UK, the (partial) cancellation of High Speed 2 involved not just cost concerns but also rhetoric complaining about a war on cars and shifting of high-speed rail money to building new motorway interchanges.
I bring this up for a few reasons. First, to point out a trend. And second, because the Berlin instantiation of the trend is a nice example of what I talked about a month ago about conspiracism.
The trend is that the Green Party in Germany is viewed as Public Enemy #1 by much of the center-right and the entire extreme right, the latter using the slogan “Hang the Greens” at some hate marches from the summer. This is obvious in state-level political campaigning: where in North-Rhine-Westphalia and Schleswig-Holstein the unpopularity of the Scholz cabinet over its weak response to the Ukraine war led to CDU-Green coalitions last year (the Greens at the time enjoying high popularity over their pro-Ukraine stance), elections this year have produced CDU-SPD coalitions in Berlin and Hesse, in both cases CDU choosing SPD as a governing partner after having explicitly campaigned against the Greens.
This is not really out of any serious critique of the Green Party or its policy. American neoliberals routinely try to steelman this as having something to do with the party’s opposition to nuclear power, but this doesn’t feature into any of the negative media coverage and barely into any CDU rhetoric. It went into full swing with the heat pump law, debated in early summer.
In Berlin the situation has been especially perverse lately. One of the points made by CDU in the election campaign was that the red-red-green coalition failed to expand city infrastructure as promised. It ran on more room for cars rather than pedestrianization, but also U-Bahn construction; when the coalition agreement was announced, Green political operatives and environmental organizations on Twitter were the most aghast at the prospects of a massive U-Bahn expansion proposed by BVG and redevelopment of Tempelhofer Feld.
And then this month the Berlin government, having not made progress on U-Bahn expansion, announced that it would trial a maglev line. There hasn’t been very good coverage of this in formal English-language media, but here and here are writeups. The proposal is, of course, total vaporware, as is the projected cost of 80 million € for a test line of five to seven kilometers.
This has to be understood, I think, in the context of the concept of openness to new technology (“Technologieoffenheit”), which is usually an FDP slogan but seems to describe what’s going on here as well. In the name of openness to new tech, FDP loves raising doubts about proven technology and assert that perhaps something new will solve all problems better. Hydrogen train experiments are part of it (naturally, they failed). Normally this constant FUD is something I associate with people who are out of power or who are perpetually junior partners to power, like FDP, or until recently the Greens. People in power prefer to do things, and CDU thinks it’s the natural party of government.
And yet, there isn’t really any advance in government in Berlin. The U8 extension to Märkisches Viertel is in the coalition agreement but isn’t moving; everyfew months there’s a story in the media in which politicians say it’s time to do it, but so far there are no advances in the design, to the point that even the end point of the line is uncertain. And now the government, with all of its anti-green fervor – fervor that given Berlin politics includes support for subway construction – is not so much formally canceling it as just neglecting it, looking at shiny new technologies that are not at all appropriate for urban rail just because they’re not regular subways or regular commuter trains, which don’t have that identity politics load here.
I wrote nearly five years ago that the lowest-hanging fruit for speeding up trains are in the slowest sections. This remains true, but as I (and Devin Wilkins) turn crayon into a real proposal, it’s clear what the second-lowest hanging fruit is: curves in otherwise fast sections. Fixing such curves sometimes saves more than a minute each, for costs that are not usually onerous.
The reason for this is that curves in fast zones tend to occur on a particular kind of legacy line. The line was built to high standards in mostly flat terrain, and therefore has long straight sections, or sections with atypically gentle curves. Between these sections the curves were fast for the time; in the United States, high standards for the 19th century meant curves of radius 1,746 meters, at which point each 100′ (30.48 meters) of track distance correspond to one degree of change in azimuth; 30.48*180/pi = 1,746.38. For much more information about speed zones, read this post from four weeks ago first; I’m going to mention some terminology from there without further definitions.
These curves are never good enough for high-speed rail. The Tokaido Shinkansen was built with 2,500 meter curves, and requires exceptional superelevation and a moderate degree of tilting (called active suspension) to reach 285 km/h. This lateral acceleration, 2.5 m/s^2, can’t really be achieved on ordinary high-speed rolling stock, and the options for it always incur higher acquisition and operating costs, or buying sole-sourced Japanese technology at much higher prices than are available to Japan Railways. In practice, the highest number that can be acheived with multi-vendor technology is around 2.07 m/s^2, or at lower speed around 2.2; 1,746*2.07 = 3,614.22, which corresponds to 60.12 m/s, or 216 km/h.
If a single such curve appears between two long, straight sections, then the slowdown penalty for it is 23.6 seconds from a top speed of 300 km/h, 35.5 from a top speed of 320 km/h, or 67 seconds from a top speed of 360 km/h. The curve itself is not instantaneous but has a few seconds of cruising at the lower speed, and this adds a few seconds of penalty as well.
Case in point: the curve between Kingston and Wickford Junction in South County, Rhode Island is such a curve. The red line below denotes a 4 km radius curve, good for a little more than 320 km/h (360 with tilt), deviating from the black line of the existing curve.
The length of the existing curve is about 1.3 km, so to the above penalties, add 6 seconds if the top speed is 300 km/h, 7 if it’s 320, or 8.7 if it’s 360 (in which case the curve needs to be a bit wider unless tilting is used). If it’s not possible to build a wider curve than this, then from a top speed of 360 km/h, the 320 km/h slowdown adds 10 seconds of travel time, including a small penalty for the 1.3 km of the curve and a larger one for acceleration and deceleration; thus, widening the curve from the existing one to 4 km radius actually has a larger effect if the top speed on both sides is intended to be 360 and not 320 km/h.
The inside of this curve is not very developed. This is just about the lowest-density part of the Northeast Corridor. I-95 has four rather than six lanes here. Land acquisition for curve easement is considerably easier than in higher-density sprawl in New Jersey or Connecticut west of New Haven.
The same situation occurs north of Providence, on the Providence Line. There’s a succession of these 1,746 meter curves, sometimes slightly tighter, between Mansfield and Canton. The Canton Viaduct curve is unfixable, but the curves farther to the south are at-grade, with little in the way; there are five or six such curves (the sixth is just south of the viaduct and therefore less relevant) and fixing all of them together would save intercity trains around 1:15.
For context, 1.3 km of at-grade construction in South County with minimal land acquisition should not cost more than $50 million, even with the need to stage construction so that the new alignment can be rapidly connected to the old one during the switchover. Saving more than a minute for $50 million, or even saving 42 seconds for $50 million, is around 1.5 orders of magnitude more cost-effective than the Frederick Douglass Tunnel in Baltimore ($6 billion for 2.5 minutes); there aren’t a lot of places where it’s possible to save so much time at this little cost.
It creates a weird situation in which while the best place to invest in physical infrastructure is near urban stations to allow trains to approach at 50-80 km/h and not 15-25, the next best is to relieve 210 km/h speed zones that should be 300 km/h or more. It’s the curvy sections with long stretches of 120-160 km/h that are usually more difficult to fix.
I poked around some comparable data for commuting around New York for 2007 and 2019 the other day, using OnTheMap. The motivation is that I’d made two graphics of through-commutes in the region, one in 2017 (see link here, I can’t find the original article anymore) and one this year for the ETA report (see here, go to section 2B). The nicer second graphic was made by Kara Fischer, not by me, but also has about twice the volume of through-commutes, partly due to a switch in source to the more precise OnTheMap, partly due to growth. It’s the issue of growth I’d like to go over in this post.
In all cases, I’m going to compare data from 2007 and 2019. This is because these years were both business cycle peaks, and this is the best way to compare data from different years. The topline result is that commutes of all kinds are up – the US had economic growth in 2007-19 and New York participated in it – but cross-regional commutes grew much more than commutes to Manhattan. New Jersey especially grew as a residential place, thanks to its faster housing growth, to the point that by 2019, commute volumes from the state to Manhattan matched those of all east-of-Hudson suburbs combined. The analysis counts all jobs, including secondary jobs.
For the purposes of the tables below, Long Island comprises Nassau and Suffolk Counties, and Metro-North territory comprises Westchester, Putnam, and Duchess Counties and all of Connecticut.
2007 data
From\To
Manhattan
Brooklyn
Queens
Bronx
Staten Island
Long Island
Metro-North
New Jersey
Manhattan
449,308
30,716
22,028
17,746
1,974
17,574
20,281
29,031
Brooklyn
385,943
299,056
76,499
16,121
9,288
40,847
17,175
25,887
Queens
328,785
89,982
216,988
19,227
4,350
107,634
21,737
18,555
Bronx
184,594
35,994
29,818
97,397
2,337
20,200
41,316
15,467
Staten Island
59,572
30,241
7,223
2,326
49,679
7,514
3,655
17,919
Long Island
163,988
45,121
77,337
12,724
5,103
926,912
32,806
12,557
Metro-North
124,952
12,606
14,228
24,131
1,962
29,344
1,897,392
15,413
New Jersey
245,373
23,455
17,496
11,022
8,109
17,460
22,073
3,523,860
2019 data
From\To
Manhattan
Brooklyn
Queens
Bronx
Staten Island
Long Island
Metro-North
New Jersey
Manhattan
570,321
56,019
44,063
31,947
4,000
20,678
22,146
35,243
Brooklyn
486,757
429,234
119,588
26,192
17,073
43,410
18,301
33,119
Queens
384,186
134,063
308,903
36,339
7,640
121,194
25,216
22,863
Bronx
224,583
62,377
58,124
135,288
4,364
26,172
45,347
17,387
Staten Island
59,778
40,994
13,971
5,218
56,953
9,877
3,510
19,442
Long Island
191,239
59,241
102,939
23,246
8,132
971,193
40,130
14,724
Metro-North
153,482
21,283
23,498
37,147
3,179
40,586
1,874,618
20,819
New Jersey
345,551
40,397
29,523
17,467
14,134
23,439
29,755
3,614,386
Growth
From\To
Manhattan
Brooklyn
Queens
Bronx
Staten Island
Long Island
Metro-North
New Jersey
Manhattan
26.93%
82.38%
100.03%
80.02%
102.63%
17.66%
9.20%
21.40%
Brooklyn
26.12%
43.53%
56.33%
62.47%
83.82%
6.27%
6.56%
27.94%
Queens
16.85%
48.99%
42.36%
89.00%
75.63%
12.60%
16.00%
23.22%
Bronx
21.66%
73.30%
94.93%
38.90%
86.74%
29.56%
9.76%
12.41%
Staten Island
0.35%
35.56%
93.42%
124.33%
14.64%
31.45%
-3.97%
8.50%
Long Island
16.62%
31.29%
33.10%
82.69%
59.36%
4.78%
22.33%
17.26%
Metro-North
22.83%
68.83%
65.15%
53.94%
62.03%
38.31%
-1.20%
35.07%
New Jersey
40.83%
72.23%
68.74%
58.47%
74.30%
34.24%
34.80%
2.57%
Some patterns
Commutes to Manhattan are up 24.37% over the entire period. This is actually higher than the rise in all commutes in the table combined, because of the weight of intra-suburban commutes (internal to New Jersey, Metro-North territory, or Long Island), which stagnated over this period. However, the rise in all commutes that are not to Manhattan and are also not internal to one of the three suburban zones is much greater, 41.11%.
This 41.11% growth was uneven over this period. Every group of commuters to the suburbs did worse than this. On net, commutes to New Jersey, Metro-North territory, and Long Island, each excluding internal commutes, grew 21.34%, 15.95%, and 18.62%, all underperforming commutes to Manhattan. Some subgroups did somewhat better – commutes from New Jersey and Metro-North to the rest of suburbia grew healthily (they’re the top four among the cells describing commutes to the suburbs) – but overall, this isn’t really about suburban job growth, which lagged in this period.
In contrast, commutes to the Outer Boroughs grew at a collective rate of 50.31%. All four intra-borough numbers (five if we include Manhattan) did worse than this; rather, people commuted between Outer Boroughs at skyrocketing rates in this period, and many suburbanites started commuting to the Outer Boroughs too. Among these, the cis-Manhattan commutes – Long Island to Brooklyn and Queens, and Metro-North territory to the Bronx – grew less rapidly (31.29%, 33.1%, 53.94% respectively), while the trans-Manhattan commutes grew very rapidly, New Jersey-Brooklyn growing 72.23%.
New Jersey had especially high growth rates as an origin. Not counting intra-state commutes, commutes as an origin grew 45% (Long Island: 25.75%; Metro-North territory: 34.75%), due to the relatively high rate of housing construction in the state. By 2019, commutes from New Jersey to Manhattan grew to be about equal in volumes to commutes from the two east-of-Hudson suburban regions combined.
Overall, trans-Hudson through-commutes – those between New Jersey and anywhere in the table except Manhattan and Staten Island – grew from 179,385 to 249,493, 39% in total, with New Jersey growing much faster as an origin than a destination for such commutes (53.63% vs. 23.93%); through-commutes between the Bronx or Metro-North territory and Brooklyn grew 56.48%, reaching 128,153 people, with Brooklyn growing 72.13% as a destination for such commutes and 33.63% as an origin.
What this means for commuter rail
Increasingly, through-running isn’t about unlocking new markets, although I think that better through-service is bound to increase the size of the overall commute volume. Rather, it’s about serving commutes that exist, or at least did on the eve of the pandemic. About half of the through-commutes are to Brooklyn, the Bronx, or Queens; the other half are to the suburbs (largely to New Jersey).
The comparison must be with reverse-commutes. Those are also traditionally ignored by commuter rail, but Metro-North made a serious effort to accommodate the high-end ones from the city to edge cities including White Plains, Greenwich, and Stamford, where consequently transit commuters outearn drivers in workplace geography. The LIRR, which long ran its Main Line one-way at rush hour to maintain express service on the two-track line, sold the third track project as opening new reverse-commutes. But none of these markets is growing much, and the only cis-Manhattan one that’s large is Queens to Long Island, which has an extremely diffuse job geography. In contrast, the larger and faster-growing through-markets are ignored.
Short (cis-Manhattan) trips are growing healthily too. They are eclipsed by some through-commutes, but Long Island to Queens and Brooklyn and Metro-North territory to the Bronx all grew very fast, and at least for the first two, the work destinations are fairly clustered near the LIRR (but the Bronx jobs are not at all clustered near Metro-North).
The fast job growth in all four Outer Boroughs means that it’s better to think of commuter rail as linking the suburbs with the city than just linking the suburbs with Penn Station or Grand Central. There isn’t much suburban job growth, but New Jersey has residential growth (the other two suburban regions don’t), and the city has job growth, with increasing complexity as more job centers emerge outside Manhattan and as people travel between them and not just to Manhattan.
At both TransitMatters and my ongoing Northeast Corridor high-speed rail timetabling project, one question we face is how to mix local and express trains on the same line. I blogged about this years ago, but that was from first principles and this is from a much better position of using Devin Wilkins’ code and analysis of recent research on rail timetabling to evaluate alternatives.
Most of this post is going to be about the Worcester Line in Boston, which we used as a test case; thus, the following two sections cover how to modernize the line, which will be covered in greater detail in an upcoming TransitMatters report, and you can skip them if you genuinely don’t care about Boston. But much of the analysis generalizes, especially when it relates to the issue of American commuter suburbs and their land use. This land use makes neat express patterns hard to justify in most cases, and the outcome in historic American planning has often been irregular patterns, which in postwar suburban New York led to regularizing around zonalexpress trains, designed to be usable only by rush hour suburb-to-city commuters and nobody else. Nonetheless, it’s still possible to run coherent timetables that make suburb-to-city commutes convenient while also making other trips viable – it just requires running fewer express trains in most cases.
The Worcester Line’s current situation
The Worcester Line connects Boston and Worcester. It is 71 km long and double-track and has 17 stops on the way. There is a planned infill station within Boston at West Station in Allston, and one to four potential infill locations on the way (Newton Corner is the most interesting; the other three are US 20 and the poorly-named Plantation Street in Worcester and Parsons Street in Faneuil). On the way, it passes largely through commuter suburbs of Boston, with one intermediate city, Framingham, station #12 out of Boston, at km-point 34.4, dividing the line into an inner and outer zone. Atypically for a Boston commuter line, seven stations in the inner zone not only don’t have level boarding, but also don’t even have a railcar length’s worth of high platform for wheelchair accessibility (called “mini-highs” in Boston).
All trains are pulled by diesel locomotives. Currently, off-peak and on weekends, all trains make all stops, running roughly hourly. At rush hour, trains either run local between Framingham and Boston, or express between Worcester and Boston, the latter trains running nonstop between the last station in Boston (Boston Landing, #3) and West Natick (#11) and running local beyond; each of the two patterns ran roughly half-hourly before corona, but currently runs roughly every 45 minutes.
Exceptionally, reverse-peak and some midday trains do not stop at the Newton stations (#4-6), where not only are the platforms low but also they only serve one track, and so the peak trains use the track with Newton platforms and the reverse-peak trains use the track without; they switch to the usual right-hand running farther west, the line running infrequently enough it can be scheduled. However, a project to build high platforms on both tracks at these stations is currently in design, and all future modernization assumes it will be completed by then; the current pattern is so atypical that what should generalize is the timetable after completion, not the current one.
Worcester Line modernization and timetabling
Modernization of the Worcester Line means, at a minimum, high platforms at all stations and electrification. This is the starting point of everything that follows; while the North American rail network has practically no electrification measured by route-length, the electrified share measured by ridership is fairly high (nearly all ridership in metro New York is on electric lines, for one).
The combination of those two, plus the improvements in reliability that would follow permitting less timetable padding, would make trip times much faster. Where today, locals to Framingham take 58 minutes and expresses to Worcester take 1:26, EMUs would do these trips in 35 and 46 minutes respectively even with infill stations, or maybe slightly more with schedule padding. This would induce higher ridership, requiring higher frequency – not to mention that at stations 15-20 minutes out of Boston, which the Newton stations will be if this is implemented, increasing frequency from a train every 30 minutes to a train every 15 or ideally less would increase ridership in and of itself.
Then, there’s planning for intercity trains beyond Worcester, to Springfield, which is called East-West Rail in Massachusetts. The plans have gotten some funding, but it isn’t enough, and the current plans are still measured in diesel trains per day and not electric trains per hour. But for future planning, we look at space for faster trains, running even faster than Boston-Worcester express trains. Internally in meetings, Devin has come to calling the three patterns local (current locals), local-express (current expresses, so named because they run local between Framingham and Worcester), and Heart-to-Hub (trains running express between Framingham and Worcester, named after a daily express train that got a lot of love from Worcester boosters but not much ridership). The Heart-to-Hub’s ridership was low and therefore its main use is to speed up Boston-Springfield trips. We express frequency in trains per hour at rush hour in both directions, in the order above: 4/4/0 means the local and local-express patterns run every 15 minutes and there are no Heart-to-Hubs, 4/2/2 means the locals run every 15 minutes and the other two run every 30 minutes, etc.
To boost frequency to 4/4/0 or 4/2/2, even with very fast EMU acceleration rates, requires additional infrastructure. The options are to rebuild Framingham from an at-grade two-track station to an elevated four-track station, so that locals could terminate while local-express and Heart-to-Hub trains continue west, and to add a third track in Wellesley (current stops #7-9, the overtake done toward the east). An ongoing plan to triple-track both Wellesley and Natick is budgeted at $400 million, including four station rebuilds; even net of the rebuilds, it’s expensive, and being able to build a shorter triple-track section would save a lot. (Another option is a modified 4/0/4, with the locals running all the way to Worcester; close to 100% of the riders from the local outer-zone stations would transfer at Framingham.)
Anything beyond eight trains per hour requires too much extra infrastructure – at a minimum, both quad-tracking Framingham and triple-tracking Wellesley, and even then the timetable would be fragile. A coherent 4/4/2 pattern would even require an additional passing track around Southborough (stop #14): the issue is that local-express and Heart-to-Hub trains have narrow windows to depart between pairs of local trains, so if there are four local trains per hour and six express trains, then two pairs of express trains have to be closely spaced, forcing an overtake on the outer section even though the speed difference between them is small.
Thankfully, the Worcester Line can live with eight peak trains per hour indefinitely: it’s a doubling over current frequency, and modernization stands to raise ridership by more than that but largely off-peak, as the modal split at rush hour is healthy.
Short-turn trains
Eight trains per hour on the Worcester Line, four running local to Framingham and four running express to Framingham and continuing on to Worcester, is solid. But are there other ways to shove more trains in? This is where the compromises that lead to irregular express patterns become apparent.
The first possibility is to add short-turn trains: those are trains that run short of the outer terminal. Technically, Framingham locals can be thought of as short-turns, but it’s perhaps better to think of Framingham as the outer terminal of local trains, and then conceive of local trains turning short of that. Newton is a good candidate for short-turns: it is on the dense side for an American suburb, it’s close to Boston, and there’s a place for trains to short-turn off the track via a disused connection to Riverside, where the Green Line D branch terminates. But this still doesn’t work, for a subtle reason that generalizes.
The generalization is that instead of the three names for future Worcester Line trains, we will have more patterns, so let’s refer to them by letters. Local trains are L; local trains that turn short are M. Express trains are X (local-express) and Y (Heart-to-Hub), but in the most general case, it’s fine to think in terms of just L, M, and X, since on the inner zone, X and Y make the same stops.
The issue is that X and Y trains still have to fit between L trains or between L and M trains. Under the 4/2/2 option, with Framingham overtakes and no short-turns, outbound departures look roughly as follows:
:00 X :02 L :15 Y :17 L (Repeat every half hour)
L is allowed to take at most 11 more minutes to get to the overtake point than X/Y, otherwise X/Y have to be slowed down. Under our current assumptions, this is the exact difference. So there’s no space for additional trains unless they turn short, enough that by the time they’d be overtaken mid-line, they’re on the spur to Riverside. This leads to the following principle: if short-turn locals are added to a line with local and express trains, the express train must run behind a short-turn local and not a full-line local. Concretely, where would M short-turns fit? It would look roughly as follows:
:00 X :02 L :07 M :15 Y :17 L :22 M (Repeat every half hour)
This shoves more frequency on the line, which is good for residents of the stations served by M, neutral to slightly bad for everyone else, and costly. The issue is that on the section where M trains run, the operating costs are those of eight local trains per hour, but the maximum gap is not 7.5 but 10 minutes. Moreover, the trains arriving after the longer gap are L trains and not M trains. Thus, the L trains would end up considerably more crowded than the M trains – all passengers traveling beyond the short-turn would be on L and so would two-thirds of the passengers traveling on the short-turn section. Ideally, if there are programmed irregular gaps on a line with short-turn trains, the short-turns should arrive after the longer gap and not after the shorter gap; if L departs :02 and M departs :12, then L takes just one-third of the passengers on the shared section and M takes two-thirds, which manages capacity better. But the presence of X and Y makes this impossible, because X and Y have to run behind M and ahead of L and still have a fairly long gap from M to avoid having to overtake.
Irregular express patterns
Okay, so short-turn trains are not a good way to add capacity to a line with a mix of local and express trains. This leads to the next step: slowing down some express trains, reducing the speed difference between locals and expresses, and compensating by running more express trains serving different stations.
On the Worcester Line, this means running trains in the pattern Y-X-L, with X making more stops to slow it down a little. But this then raises the question of which intermediate stops get to run express.
The New York City Subway standard of having express stops at regular intervals every three to six stations doesn’t work on commuter rail. The subway is designed around four-track trunk lines with cross-platform transfers at express stations, and those work because the trains are very frequent (or, off-peak, used to be). What works for a four-track system that runs local trains every five minutes doesn’t work for a two-track one that runs them every 15. On a commuter rail network, if a station only gets local trains, there is not going to be an opportunity to transfer, not at the scale we’re talking about.
The simplest answer to who gets the express stations is “the busiest stations.” This is a valid answer. Here is the RER B, between Massy-Palaiseau and Cité-Universitaire, the last station within Paris, where all trains make all stops. Off-peak, the southbound stopping patterns include S trains to Robinson on a branch, K trains making all stops to Massy, and P trains running express to Massy and local beyond, each every 15 minutes; at peak, the S is as before, the K skips one stop, there’s an L pattern skipping stops and running local from Massy to Orsay, and the P runs the fastest and is express to Orsay and only local past that, each every 12 minutes.
There are no overtake locations on the RER B; because of this, the shared trunk to Bourg-la-Reine has to run local at rush hour. The express patterns still run on a regular clockface schedule every 12 minutes at rush hour and every 15 off-peak, but they aren’t neat, due to the density of traffic. The stations that always get served are the busiest ones – Bourg-la-Reine, La Croix de Berny, Antony, Massy – and are an order of magnitude busier than the stations that get skipped the most. This is not an artifact of service – at the distance of those stations from Paris, a train every 12 or 15 minutes is enough for ridership not to depend too much on frequency. There really is much higher demand at Bourg-la-Reine and Massy than at the minor stations.
In contrast, here is ridership per station between Boston Landing and Framingham, on weekdays:
Boston Landing: 479 Newtonville: 429 West Newton: 243 Auburndale: 203 Wellesley Farms: 285 Wellesley Hills: 322 Wellesley Square: 591 Natick: 697 West Natick: 914 Framingham: 995
So, the first thing to notice is that Framingham, the busiest station, has 995 weekday boardings, which is maybe 290,000 per year, which would be by far the least busy on the RER B (the least busy on the entire RATP-run part of the RER is La Hacquinière, on the outer tail of the RER B, with 419,294/year). But also, the spread is much smaller than on the RER B, a factor of about 5 rather than 16. The spread in potential demand is actually larger, since Auburndale and West Newton are close enough to Boston that the hourly frequencies hurt a lot, whereas Framingham and West Natick both are farther away and get much more rush-hour frequency at any case.
A line like the Worcester Line should only even be running express trains in the first place to speed up some outer-zone trips, and with the expectation that Framingham could develop to something bigger. But that brings in the issue of land use in American suburbs.
Land use and commuter rail ridership
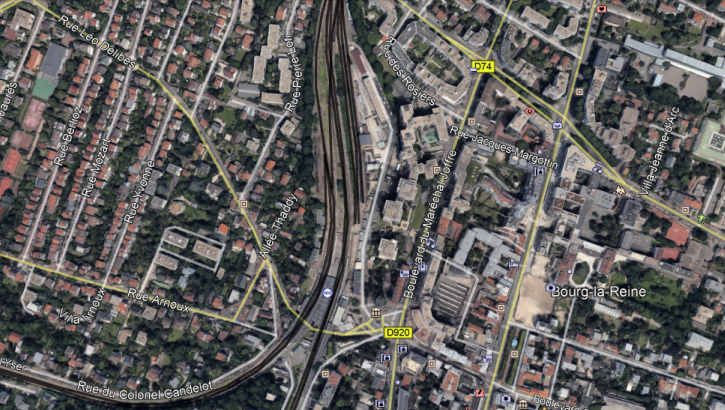
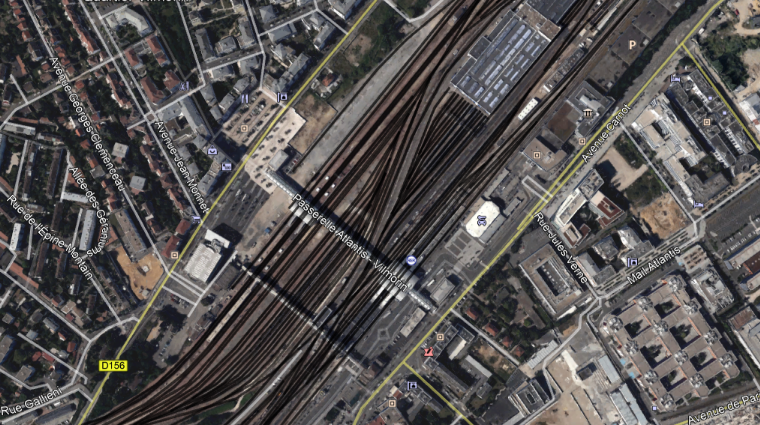
I encourage people to compare land use near American and Parisian commuter rail stations. Here is Bourg-la-Reine:
And here is Massy:
These are town centers. Massy is a postwar suburb developed around the train station, with town center development near the station and plenty of later urban renewal as the area got a TGV station. There’s visibly more stuff near Massy or Bourg-la-Reine than near the minor stations on the RER B, in the same way there is more stuff near a major transfer point on most subways than near a station on one line on a tail. They anchor express service.
The land use near American commuter rail stations works differently. It is lower-density, of course, but more importantly, it is uniformly low-density. Density isn’t especially oriented near the train stations. Occasionally there is walkable retail from the train, but it’s not consistent, and there are no clusters of mid-rise buildings with retail and some local office jobs. American suburbanization of residences may follow the train, with gray near the lines and green between them, but suburbanization of jobs never does, instead following highways.
In this context, there’s no real distinguishing feature that allows some stations to get more express service than others. Riders get to the station by car; the fares and schedules don’t allow for integration with suburban buses, and there is no reason for anyone in these suburbs to rely on bikes when all local destinations are auto-centric. The car has a fairly long range within suburbia, and thus riders drive to a better park-and-ride or kiss-and-ride; the busiest suburban American train station, Ronkonkoma, with around 10,000 weekday riders pre-corona, is a parking lot with practically nothing else near it.
What this means is that express trains often generate their own demand, as passengers start driving to them, neglecting other stations. It creates a fiction of lopsided demand with similar ratios between busier and less busy stations as on the RER B, with no underlying reason for it; the Worcester Line has no such ratio, but the LIRR Main Line does, largely due to the park-and-ride effect. Once planners accept that everyone needs an express trains, schedules evolve to be ever more irregular and less reliable, in the search of the perfect express. Caltrain even came up with the push model, in which the scheduler’s job is to push passengers to park-and-rides with open spots, and otherwise there would be no reason to run trains other than the fastest express trains.
This, in turn, guarantees bad service – these irregular patterns repel riders who are not city-bound commuters, and the frequency is never good enough to sustain such patterns off-peak. In the most extreme cases, it can even backfire: the LIRR’s split between Grand Central and Penn Station frequencies has made it so that so far, the East Side Access project has generated zero new ridership. It’s sometimes possible to salvage something: in the case of Framingham and Worcester, both cities have skeletons of bus networks, and coordinated planning could ensure that the buses would be timed with the train and have free transfers. But at most stations, it’s pointless to try to turn them into distinguished nodes beyond the usual for a local train station.
The upshot is that the only way to run coherent timetables is to focus on local trains. Express trains are for express stops, and few places in the suburban United States are worth the effort; Framingham and Worcester are two of those few because of their town center development, but nothing else on the line is.
In that sense, when I harp on the need for high platforms and electrification, it’s not just because these are good practices in and of themselves, but also because they’re necessary for making local service work. Otherwise, the stop penalty kills you: Boston-Worcester is 1:38 on all-local off-peak trains today, which is an average speed of 43 km/h. And nothing except local stretches works in the context of continuous, isotropic suburban density.
The US government has just announced a large slate of grants to rail from the Bipartisan Infrastructure Law. Amtrak has a breakdown of projects both for itself and partners, totaling $16.4 billion. There are a few good things there, like Delco Lead, or more significantly more money for the Hudson Tunnel Project (already funded separately, but this covers money the states would otherwise be expected to fund). There are also conspicuously missing items that should stay missing – But by overall budget, most of the grant is pretty bad, covering projects that are in principle good but far too expensive per minute saved.
This has implications to the future of the Northeast Corridor, because the total amount of money for it is $30 billion; I believe this includes Amtrak plus commuter rail agencies. Half of the money is gone already, and some key elements remain unfunded, some of which are still on agency wishlists like Hunter Flyover but others of which are still not, like Shell Interlocking. It’s still possible to cobble together the remaining $13.6 billion to produce something good, but there have to be some compromises – and, more importantly, the process that produced the grant so far doesn’t fill me with confidence about the rest of the money.
The Baltimore tunnel
The biggest single item in the grant is the replacement tunnel for the Baltimore and Potomac Tunnel. The B&P was built compromised from the start, with atypically tight curves and steep grades for the era. An FRA report on its replacement from 2011 goes over the history of the project, originally dubbed the Great Circle Passenger Tunnel when first proposed in the 1970s; the 2011 report estimates the cost at $773 million in 2010 prices (PDF-p. 229), and the benefits at a two-minute time saving (PDF-p. 123) plus easier long-term maintenance, as the B&P has water leakage in addition to its geometric problems. At the time, the consensus of Northeastern railfans treated it as a beneficial and even necessary component of Northeast Corridor modernization, and the agencies kept working on it.
Since then, the project’s scope crept from two passenger tracks to four tracks with enough space for double-stacked freight and mechanical ventilation for diesel locomotives. The cost jumped to $4 billion, then $6 billion. The extra scope was removed to save money, said to be $1 billion, but the headline cost remained $6 billion (possibly due to inflation, as American government budgeting is done in current dollars, never constant dollars, creating a lot of fictional cost overruns). The FRA grant is for $4.7 billion out of $6 billion. Meanwhile, the environmental impact statements upped the trip time benefit of the tunnel for Amtrak from two to 2.5 minutes; this is understandable in light of either higher-speed (and higher-cost) redesign or an assumption of better rolling stock than in the 2011 report, higher-acceleration trains losing more time to speed restrictions near stations than lower-acceleration ones.
That this tunnel would be funded was telegraphed well in advance. The tunnel was named after abolitionist hero Frederick Douglass; I’m not aware of any intercity or commuter rail tunnel elsewhere in the developed world that gets such a name, and the choice to name it so about a year ago was a commitment. It’s not a bad project: the maintenance cost savings are real, as is the 2.5 minute improvement in trip time. But 2.5 minutes are not worth $6 billion, or even $6 billion net of maintenance. In 2023 dollars, the estimate from 2011 is $1.1 billion, which I think is fine on the margin – there are lower-hanging fruit out there, but the tunnel doesn’t compete with the lowest-hanging fruit but with the $29 billion-hanging fruit and it should be very competitive there. But when costs explode this much, there are other things that could be done better.
Bridge replacements
The Northeast Corridor is full of movable bridges, which are wishlisted for replacement with high fixed spans. The benefits of those replacements are there, mainly in maintenance costs (but see below on the Connecticut River), but that does not justify the multi-billion dollar budgets of many of them. The Susquehanna River Rail Bridge, the biggest grant in this section, is $2.08 billion in federal funding; the environmental impact study said that in 2015 dollars it was $930 million. The benefits in the EIS include lower maintenance costs, but those are not quantified, even in places where other elements (like the area’s demographics) are.
Like all state of good repair projects, this is spending for its own sake. There are no clear promises the way there are with the Douglass Tunnel, which promises to have a new tunnel with trip time benefits, small as they are. Nobody can know if these bridge replacement projects achieved any of their goals; there are no clear claims about maintenance costs with or without this, nor is there any concerted plan to improve maintenance productivity in general.
The East River Tunnel project, while not a bridge nor a visible replacement, has the same problem. The benefits are not made clear anywhere. There are some documents we found in the ETA commuter rail report saying that high-density signaling would allow increasing peak capacity on one of the two tunnel pairs from 20 to 24 trains per hour, but that’s a small minority of the overall project and in the description it’s an item within an item.
The one exception in this section is the Connecticut River. This bridge replacement has a much clearer benefit – but also is a down payment on the wrong choice. The issue is that pleasure boat traffic has priority over the railroad on the “who came first” principle; by agreement with the Coast Guard, there is a limited number of daily windows for Amtrak to run its trains, which work out to about an Acela and a Regional every hour in each direction. Replacing this bridge, unlike the others, would have a visible benefit: more trains could run (once new rolling stock comes in, but that’s already in production).
Unfortunately, the trains would be running on the curviest and also most easily bypassable section of the Northeast Corridor. The average speed on the New Haven-Kingston section of the Northeast Corridor is low, if not so low on the less curvy but commuter rail-primary New Haven Line farther west. The curves already have high superelevation and the Acelas tilt through them fully; there’s not much more that can be done to increase speed, save to bypass this entire section. Fortunately, a bypass parallel to I-95 is feasible here – there isn’t as much suburban development as west of New Haven, where there are many commuters to New York. Partial bypasses have been studied before, bypassing both the worst curves on this section and all movable bridges, including that on the Connecticut. To replace this bridge in place is a down payment on, in effect, not building genuine high-speed rail where it is most useful.
Other items
Some other items on the list are not so bad. The second largest item in the grant, $3.79 billion, is increasing the federal contribution to the Hudson Tunnel Project from about 50% to about 70%. I have questions about why it’s necessary – it looks like it’s covering a cost overrun – but it’s not terrible, and by cost it’s by far the biggest reasonable item in this grant.
Beyond that, there are some small projects that are fine, like Delco Lead, part of a program by New Jersey Transit to invest around New Brunswick and Jersey Avenue to create more yard space where it belongs, at the end of where local trains run (and not near city center, where land is expensive).
What’s not (yet) funded
Overall, around 25% of this grant is fine. But there are serious gaps – not only are the bridge replacements and the Douglass Tunnel not the best use of money, but also some important projects providing both reliability and speed are missing. The two most complex flat junctions of the Northeast Corridor near New York, Hunter in New Jersey and Shell in New Rochelle, are missing (and Hunter is on the New Jersey Transit wishlist); Hunter is estimated at $300 million and would make it much more straightforward to timetable Northeast Corridor commuter and intercity trains together, and Shell would likely cost the same and also facilitate the same for Penn Station Access. The Hartford Line is getting investment into double track, but no electrification, which American railroads keep underrating.
Blair Lorenzo and I gave the talk yesterday, as advertised. The slide deck was much more in her style than in mine – more pictures, fewer words – so it may not be exactly clear what we said.
Beyond the written report itself (now up in web form, not just a PDF), we talked about some low-hanging fruit. What we’re asking for is not a lot of money – the total capital cost of electrification and high platforms everywhere and the surface bottlenecks we talk about like Hunter Junction is around $6 billion, of which $800 million for Portal Bridge need to happen regardless of anything else; Penn Reconstruction is $7 billion and the eminently cancelable Penn Expansion is $17 billion. However, it is a lot of coordination, of different agencies, of capital and operations, and so on. So it’s useful to talk about how to, in a way, fail gracefully – that is, how to propose something that, if it’s reduced to a pilot program, will still be useful.
The absolute wrong thing to do in a pilot program situation is to just do small things all over, like adding a few midday trains. That would achieve little. There is already alternation between hourly and half-hourly commuter trains in most of the New York region; this doesn’t do much when the subway or a subway + suburban bus combination runs every 10-12 minutes (and should be running every six). The same can be said for CityTicket, which incrementally reduces fares on commuter rail within New York City but doesn’t integrate fares with the subway and therefore produces little ridership increase.
Instead, the right thing to do is focus on one strong corridor. We propose this for phase 1, turning New Brunswick-Stamford or New Brunswick-New Rochelle into a through-line running every 10 minutes all day, as soon as Penn Station Access opens. But there are other alternatives that I think fall into the low-hanging fruit category.
One is the junction fixes, like Hunter as mentioned above (estimated at $300 million), or similar-complexity Shell in New Rochelle, which is most likely necessary for any decent intercity rail upgrade on the Northeast Corridor. It costs money, but not a lot of it by the standards of what’s being funded through federal grants, including BIL money for the Northeast Corridor, which is relevant to both Hunter and Shell.
The other is Queens bus redesign. I hope that as our program at Marron grows, we’ll be able to work on a Queens bus redesign that assumes that it’s possible to connect to the LIRR with fare integration and high frequency; buses would not need to all divert to Flushing or Jamaica, but could run straight north-south, leaving the east-west Manhattan-bound traffic to faster, more efficient trains.
At the Effective Transit Alliance, we’re about to unveil a report explaining how to modernize New York’s commuter rail system (update 10-31: see link to PDF here). The individual elements should not surprise regular readers of this blog, but we go into more detail about things I haven’t written before about peakiness, and combine everything together to propose some early action items.
To that effect, we will present this in person on Wednesday November 1st, at 1 pm. The event will take place at Marron, in Room 1201 of 370 Jay Street; due to NYU access control, signing up is mandatory using this form, but it can be done anytime until the morning of (or even later, but security will be grumpy). At the minimum, Blair Lorenzo and I will talk about commuter rail and what to do to improve it and take questions from the audience; we intend to be there for two hours, but people can break afterward and still talk, potentially.
The ongoing conspiracy theories about 15-minute cities make me think about the issue of conspiracies and extremism more in general. The difference between what the conspiracy theories say and what the actual program is is vast. This is true even when there is lively critique of the program by non-conspiracists, critique that the conspiracists seem unaware of, or at best indifferent to. This set of facts about conspiracists – they are wrong even when the things they oppose happen to have serious problems; they are uninterestingly wrong; they do not cooperate with serious critics and often react violently against them – is general.
It’s relevant here for two reasons. First, because there’s a growing amount of anti-environmental and anti-public transport extremism, in which the possession of a large, polluting car is treated as an identity market. Such extremism never seriously interacts with any real critique of public transport construction programs or any kind of critique of urbanism. And second, because I have a lot of readers who come from a rationalist or Effective Altruism background and like doing what they call steelmanning: finding the strongest argument someone could make for a stance even if they didn’t make it, and arguing with that. I beseech my rationalist readers: please stop steelmanning – if extremists refuse to engage with any serious critique even when it argues against the same thing they argue against, it’s not to their credit and you should make inferences from that instead of acting as their lawyers.
But first, what are 15-minute cities and what’s the conspiracy theory?
15-minute cities
For some background, there is a trend in the urbanist world of calling for urbanism that enables people to make all their regular travel needs – retail, recreation, child care, social spaces, work – within a 15-minute travel radius by public or non-motorized transportation. Some versions of this vision drop work from these needs, due to the realization that people in cities travel 30-60 minutes each way to work and not 15. Parisian urban politics tends to believe in this vision, with work included: the city tries to spread work places around the city as isotropically as possible, creating jobs in residential neighborhoods rather than in city center; when I critique the vision, I usually focus on its implementation there, since the city’s political leadership adheres to it, and global adherents of the model generally think highly of Paris and of Mayor Anne Hidalgo.
This conspiracy theory is not just the usual opposition to transit-first or pedestrian- and bike-first cities from drivers. Drivers who oppose bike lanes and prioritization of public transport and resent cities that don’t expand highways speak of a war on cars. The conspiracy theorists who think 15-minute cities are a confinement attempt love cars and love driving, as an anti-environmental identity marker, but care little about highway expansion; they think they’re being literally imprisoned and spied on.
There is an extensive critique of 15-minute cities from within the world of urbanism. I’ve long complained that it’s a consumption-centric model of urbanism; I think little of Hidalgo. I’m fairly neoliberal about the primacy of work over consumption, but Marco Chitti, who isn’t, points out that these 15-minute cities exist by the grace of service workers who commute in from elsewhere taking far longer than 15 minutes to get to work. Paris itself has long been critiqued for its museumification.
And none of the conspiracy theories about 15-minute cities comes close to touching any of the serious critiques. The critique that 15-minute cities center consumption over production is a YIMBY line, YIMBYs generally backing production theory in which people choose where to live based on access to jobs, not consumption amenities. But the conspiracy theorists tilt NIMBY, viewing developers as part of the conspiracy to make their lives worse (by making it easier for other people to live nearby); the conspiracy theorists who want to be more developmental and have heard of YIMBY are busy complaining that YIMBYs don’t back developing more single-family housing on the fringes of urban areas.
Likewise, the more social critique of Marco and others talks about inequality. The conspiracy theorists once again don’t care about any of this. They identify in opposition to anything that reeks of socialism. (There are of course far left conspiracy theorists, but these aren’t the ones saying that 15-minute cities are about confinement.) They hate the state and, for all of their hate of the idea of government by lawsuit, they hate the idea of government by bureaucrats more; one of them told me that the concept of an ambitious civil servant is scary and it’s good to force civil servants to keep their heads down.
I bring up the notions of social equality, the state, and upzoning to point out that the solutions to the real problems of Paris today are the exact opposite of what the conspiracy theorists who think 15-minute cities are confinement want. There’s no point in discussing those real problems around extremists, because the extremists at best don’t care, and at worst negatively care.
Other examples
The example above of how conspiracy theories about 15-minute cities have nothing to do with the real problems of that kind of urbanism, and there isn’t even a kernel of truth, generalizes outside urbanism and transportation. Much of it concerns anti-vaccination extremism, but there are other cases.
For example, there have been Jihadist conspiracy theories that vaccination is a Western plot to sterilize Muslim men. Based on that theory, Jihadists have attacked vaccination drives in Pakistan, murdering aid workers. Far too many organs steelman those theories, arguing that they were a natural byproduct of CIA meddling, citing in some cases a fake vaccination drive set up by the CIA to harvest people’s DNA. The truth is that, first of all, it was a real vaccination drive, in which a single doctor was trying to send over DNA to find Osama bin Laden (and didn’t). But second and more importantly, this anti-vaccination sentiment predates this episode, going back to the mid-2000s. The primary grievance the Jihadists have about vaccines did not mention anything about the CIA harvesting DNA; the Jihadists appeared completely unaware, having developed their theories completely independently.
For another example, in 1980s Germany, there was a public dispute over how to commemorate the Nazis, called the Historikerstreit. Historians on the right, like Ernst Nolte, charged that Germany ought to be prouder of its past, that Hitler was just concerned about the crimes of communism, that the Holocaust was just an overreaction to the gulags; right-wing publications like FAZ published Nolte’s popular writings on this. To Nolte and others, the anti-Semitism was just an unfortunate byproduct of how many Jews were communists. The right lost that debate; historians on the left, like Eberhard Jäckel, pointed out that Hitler in fact underestimated the Soviet Union because he thought Jews and Bolshevism were weak. The rat cage torture, which Nolte said Hitler was most concerned about, appeared nowhere in Mein Kampf, whereas anti-Semitic conspiracy theories did; the only quote from Hitler about it is ambiguous and from 1943. Moreover, far from centering communism as the great evil, Hitler also called capitalism a Jewish conspiracy to produce social alienation. Nolte was in effect steelmanning the Nazis, inventing an argument that they were not interested in to distract from what they were interested in and what they did.