Setting Speed Zones
At the Boston meetup two days ago, I was asked about what tools I use to generate timetables, for example for my New York commuter rail posts. The answer is that I use speed zones and then run this code on them – but then the question is how to figure out speed zones. I hope that this sequence of steps will help advocates who are interested in rail modernization.
Generating curve radii
The most difficult element to fix on mainline rail is the right-of-way geometry. Most other things that can restrict a train’s speed can be fixed with more modern maintenance, but right-of-way geometry doesn’t change without physical construction, often in constrained areas – if they weren’t constrained, the curves would have been built wider in the first place.
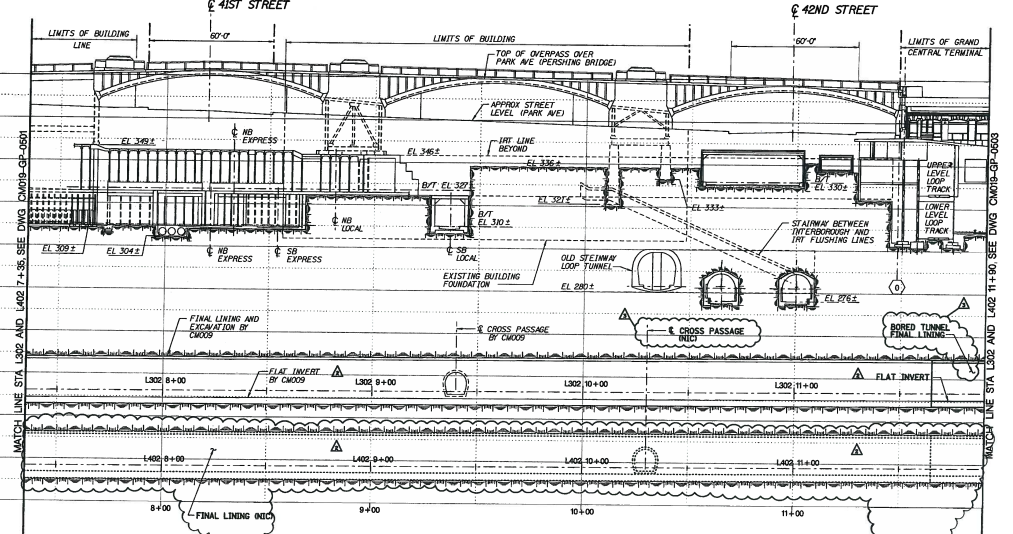
The best case scenario is that there exist track maps with exact curve radii. I have these for large chunks of the Northeast Corridor, but not all. For example, here is Metro-North (with thanks to The Korot). Curves on such maps are denoted as circles or bumps deviating from a line, with the direction of the circle indicating the direction of the curve’s curvature. On this and other American maps, the radius is listed in degrees, and the cant (see the section below) in inches.
To convert the radius from degrees to more usual units, set one degree to be 1,746 meters, and note that degrees measure curvature and not radius, so a two degree curve has half the radius of a one degree curve. More precisely, the formula is that degrees measure the change in azimuth over 100 feet; 100 feet are 30.48 meters, and converting 30.48 from degrees to radians gives 1,746.37536… meters.
For example, on the Metro-North chart, let’s look at Harrison, New York. It’s on PDF-p. 24 of the chart; Harrison is sandwiched between two curves with opposite orientations, with the platforms on tangent (uncurved) track. The curve just west of Harrison has radius 1° 58′ 30″, which is 884.24069… meters; the curve just east has radius 2° 2′ 15″, which is 857.11674… meters.
Converting curve radii to speeds
The formula for the speed of a train, in SI units, is

I wrote about lateral acceleration, cant, and cant deficiency two and a half years ago. In short, lateral acceleration, in m/s^2, is the centrifugal force coming from the action of the train rounding the curve at speed. For the purposes of the formula, it is measured in the horizontal plane. To reduce the centrifugal force felt by the passengers (for comfort and safety) as well as that felt by the train body (for safety and maintenance costs), the tracks will typically be banked so that the inner rail is lower than the outer rail, which is called cant or superelevation, and is written in units of distance, such as mm or inches.
The speed of a train on canted track is typically higher than the perfect balancing speed, where the force of gravity counteracts that of centrifugal force; thus, on a fast train there is a residual force pointing to the outside of the train, which can be written down as lateral acceleration in the plane of the tracks (in m/s^2), but is more typically written down in the same units as superelevation, representing the additional superelevation required for the speed to perfectly balance, which is called cant deficiency or underbalance.
The conversion rate between cant (or cant deficiency) is the track gauge measured between the middle of the two rails, divided by the gravitational constant (9.8 m/s^2). Track gauge is typically given as inner rail to inner rail; standard gauge is 1,435 mm inner rail to inner rail. The relevant quantity to superelevation calculations is a few cm more; on standard gauge, it’s taken to be about 1,470-1,500 mm, so the conversion rate is 1 m/s^2 = 150 mm of cant or cant deficiency. The two quantities, cant and cant deficiency, are additive.
The American track charts that I have specify the actual cant. However, the values tend to be too conservative. Again with the example of Harrison, the slightly wider western curve has 5″ cant and the slightly tighter eastern curve has 4.125″ cant. Regulations for maximum cant depend on the country and maintenance standards. The absolute maximum cant I am aware of on any standard-gauge railway is 200 mm on the Tokaido and Tohoku Shinkansen. The reasons not to raise cant further include maintenance difficulties and the risk of a train running at lower speed or even stopping on the track. On lines that are not captive to just high-speed trains, the highest cant I am aware of is 180 mm, in Germany, and this is rare; 160 mm is more common. The American limit is 7″, but frequent inspections are required at that point to ensure that the tracks don’t get bent out of shape to produce higher cant; 8″ is a do-not-exceed level, and in practice track irregularities may lead to exceeding it if there isn’t regular track maintenance.
In practice, raising the cant is usually easy – it can be done with a track geometry machine automatically. However, in one case, it is not: that of S-curves, which have exactly the shape implied by the letter S. Our example of Harrison has two reverse curves in close proximity, but is not an S-curve, as there are hundreds of meters of tangent track between the two curves. Other places do have S-curves, and there, the maximum cant must be lowered somewhat; regulations vary on this, but in Europe, the maximum change in cant is 30-55 mm per second depending on the country (there’s a secondary regulation on mm per meter, but on the Northeast Corridor, the binding rule is mm/s, not mm/m). For example, if we take 45 mm/s, and 180 mm of cant, then it takes four seconds to reverse a curve; note that it is four and not eight, because half of the increase in cant, called a superelevation spiral, is within the curve. Harrison’s current curves impose a hard limit of about 150 km/h, at which point the hundreds of meters of tangent track make it trivially easy to have full superelevation. However, other places, most infamously among Northeastern railfans Elizabeth, there is an actual S-curve, forcing lower cant and lower speeds.
Finally, the maximum cant deficiency depends on the track, the train, and the regulations. Traditionally, American regulations limited most passenger trains to 3″ of cant deficiency, which is ridiculously conservative; in the 2000s, a waiver allowing 5″ in some cases was derided as the “magic high-speed rail waiver” because it applied not just to higher-speed tracks but also to lower-speed lines that had through-service to higher-speed tracks. Since then, FRA regulations have changed, and now the practical limit in the US, with extensive testing, is 6″, or 150 mm cant deficiency, at most speeds. European limits tend to be around 130-150 mm; high-speed trains are at the lower end of this range unless they are tilting trains, which nearly all trains are not. Cant deficiency, like cant, requires its own superelevation spiral on S-curves, but the limits are in practice looser than for cant, and in some cases trains can change superelevation abruptly, with no spiral, for example on switches.
The upshot is that in the typical case, the most aggressive assumption should be 180 mm cant, 150 mm cant deficiency, for a lateral acceleration in the horizontal plane of 2.2 m/s^2. Most lines will not have this pair of aggressive assumptions: 180 mm is only viable when it’s guaranteed that trains will not stop on a canted curve, which is a reasonable assumption on a reliable high-speed line and even on a German high-speed line. Moreover, if there is any freight on the line, superelevation must fall drastically: slower trains would be at cant excess, and freight trains have high center of mass (diesel locomotives and double-stacked containers both have higher center of mass than electric passenger trains) and therefore have tight cant excess limits. Aggressive assumptions are viable on the Northeast Corridor and on controllable commuter lines with no or almost no freight, such as the LIRR, but not everywhere else.
Finding curve radii
In some cases, curve radii are spelled out in a chart. In others, they are not, and must be figured out. Our program’s schedule writer, Devin Wilkins, tells me she has just found a track chart for SEPTA, but otherwise, I have no such charts south of New York. There, the dirty, imperfect method of estimating curve radii must be used.
For that, I use Google Earth. Nowadays, Google Earth Pro is free, and comes with a circle tool. In theory, I can fidget with the radius of a circle until I find that it approximates the arc of a curve well. This requires paying special attention to how the drawn curve compares with not just the broad outline of the curve but also the exact arc of each track or even each rail: the drawn curve should be at the same relative position to the rails, such as following one rail of one track, or right in the center of one track, or right between the track centers, and so on.
In cases of uncertainty, it’s also possible to use Google Earth line tools, which state the azimuth of each line. If I can find the exact start and end points of each curve, and the azimuths of the tangents on both side, then I can draw the chord with a line tool, verifying that its azimuth is the exact arithmetic mean of the azimuths of the two tangents; if it is not the mean, then either I made an error (more likely) or the curve is not a perfect circle (possible but less likely). The radius of the curve is approximately the length of the chord times 180/pi divided by change in azimuth; more precisely, the radius is

This method is error-prone, especially for short, sharp curves. Computing the start and end points of the curve will always have errors, and if the change in azimuth is small, then these will lead to large errors. The circle tool method suffers from the same drawback: it’s easier to use it to estimate the radius of a curve with 60 degree change in azimuth than that of one with 10 degree change.
Over time I’ve gotten this method down to the point that my errors from what I later find with track charts such as that of Metro-North are fairly small, and not very biased in the larger-radius direction. But it takes time and practice and ideally you should avoid it for short, sharp curves.
Update 10-28: Ari Ofsevit has a third method, using chord lines.
Other speed limits
Speed limits on intercity trains mostly come from curves. But there are other things to keep in mind, not all of which are fixable:
- Tunnels increase air resistance to the point that unless the tunnels are constructed with large enough radius to have a lot of free air (modern tunnels are, legacy ones aren’t), or unless the trains are pressurized, the speed limit has to be lower just to avoid popping passengers’ ears at entry and exit.
- Switches generally have low speed limits – they have tight curves and no superelevation – making all complex junctions and major stations slow.
- Terminal stations have another set of speed limits coming from the bumper tracks. American limits are very conservative – 10 mph where a ramp down from 40 or 50 km/h is more normal in Europe – but even 50 km/h is not 200 km/h.
- Some pieces of infrastructure are so shoddy that they limit the dynamical axle load of the train, which is derived from both static axle load, which is a function of train mass, and speed. As usual, American limits on this are conservative, assuming high static axle load and fixing a low speed on some very old bridges, instead of permitting lighter trains to run faster. But it is sometimes a real problem.