Did the Netherlands Ever Need 300 km/h Trains?

Dutch high-speed rail is the original case of premature commitment and lock-in. A decision was made in 1991 that the Netherlands needed 300 km/h high-speed rail, imitating the TGV, which at that point was a decade old, old enough that it was a clear success and new enough that people all over Europe wanted to imitate it to take advantage of this new technology. This decision then led to complications that caused costs to run over, reaching levels that still hold a European record, matched only by the almost entirely tunneled Florence-Bologna line. But setting aside the lock-in issue, is it good for such a line to run at 300 km/h?

The question can be asked in two ways. The first is, given current constraints on international rail travel, did it make sense to build HSL Zuid at 300 km/h?. It has an easy answer in the negative, due to the country’s small size, complications in Belgium, and high fares on international trains. The second and more interesting is, assuming that Belgium completes its high-speed rail network and that rail fares drop to those of domestic TGVs and ICEs, did it make sense to build HSL Zuid at 300 km/h?. The answer there is still negative, but the reasons are specific to the urban geography of Holland, and don’t generalize as well.

How HSL Zuid is used today

This is a schematic of Dutch lines branded as intercity. The color denotes speed and the thickness denotes frequency.

The most important observation about this system is that HSL Zuid is not the most frequent in the country. Frequency between Amsterdam and Utrecht is higher than between Amsterdam and Rotterdam; the frequency stays high well southeast of Utrecht, as far as Den Bosch and Eindhoven. The Dutch rail network is an everywhere-to-everywhere mesh with Utrecht as its central connection point, acting as the main interface between Holland in the west and the rest of the country in the east. HSL Zuid is in effect a bypass around Utrecht, faster but less busy than the routes that do serve Utrecht.

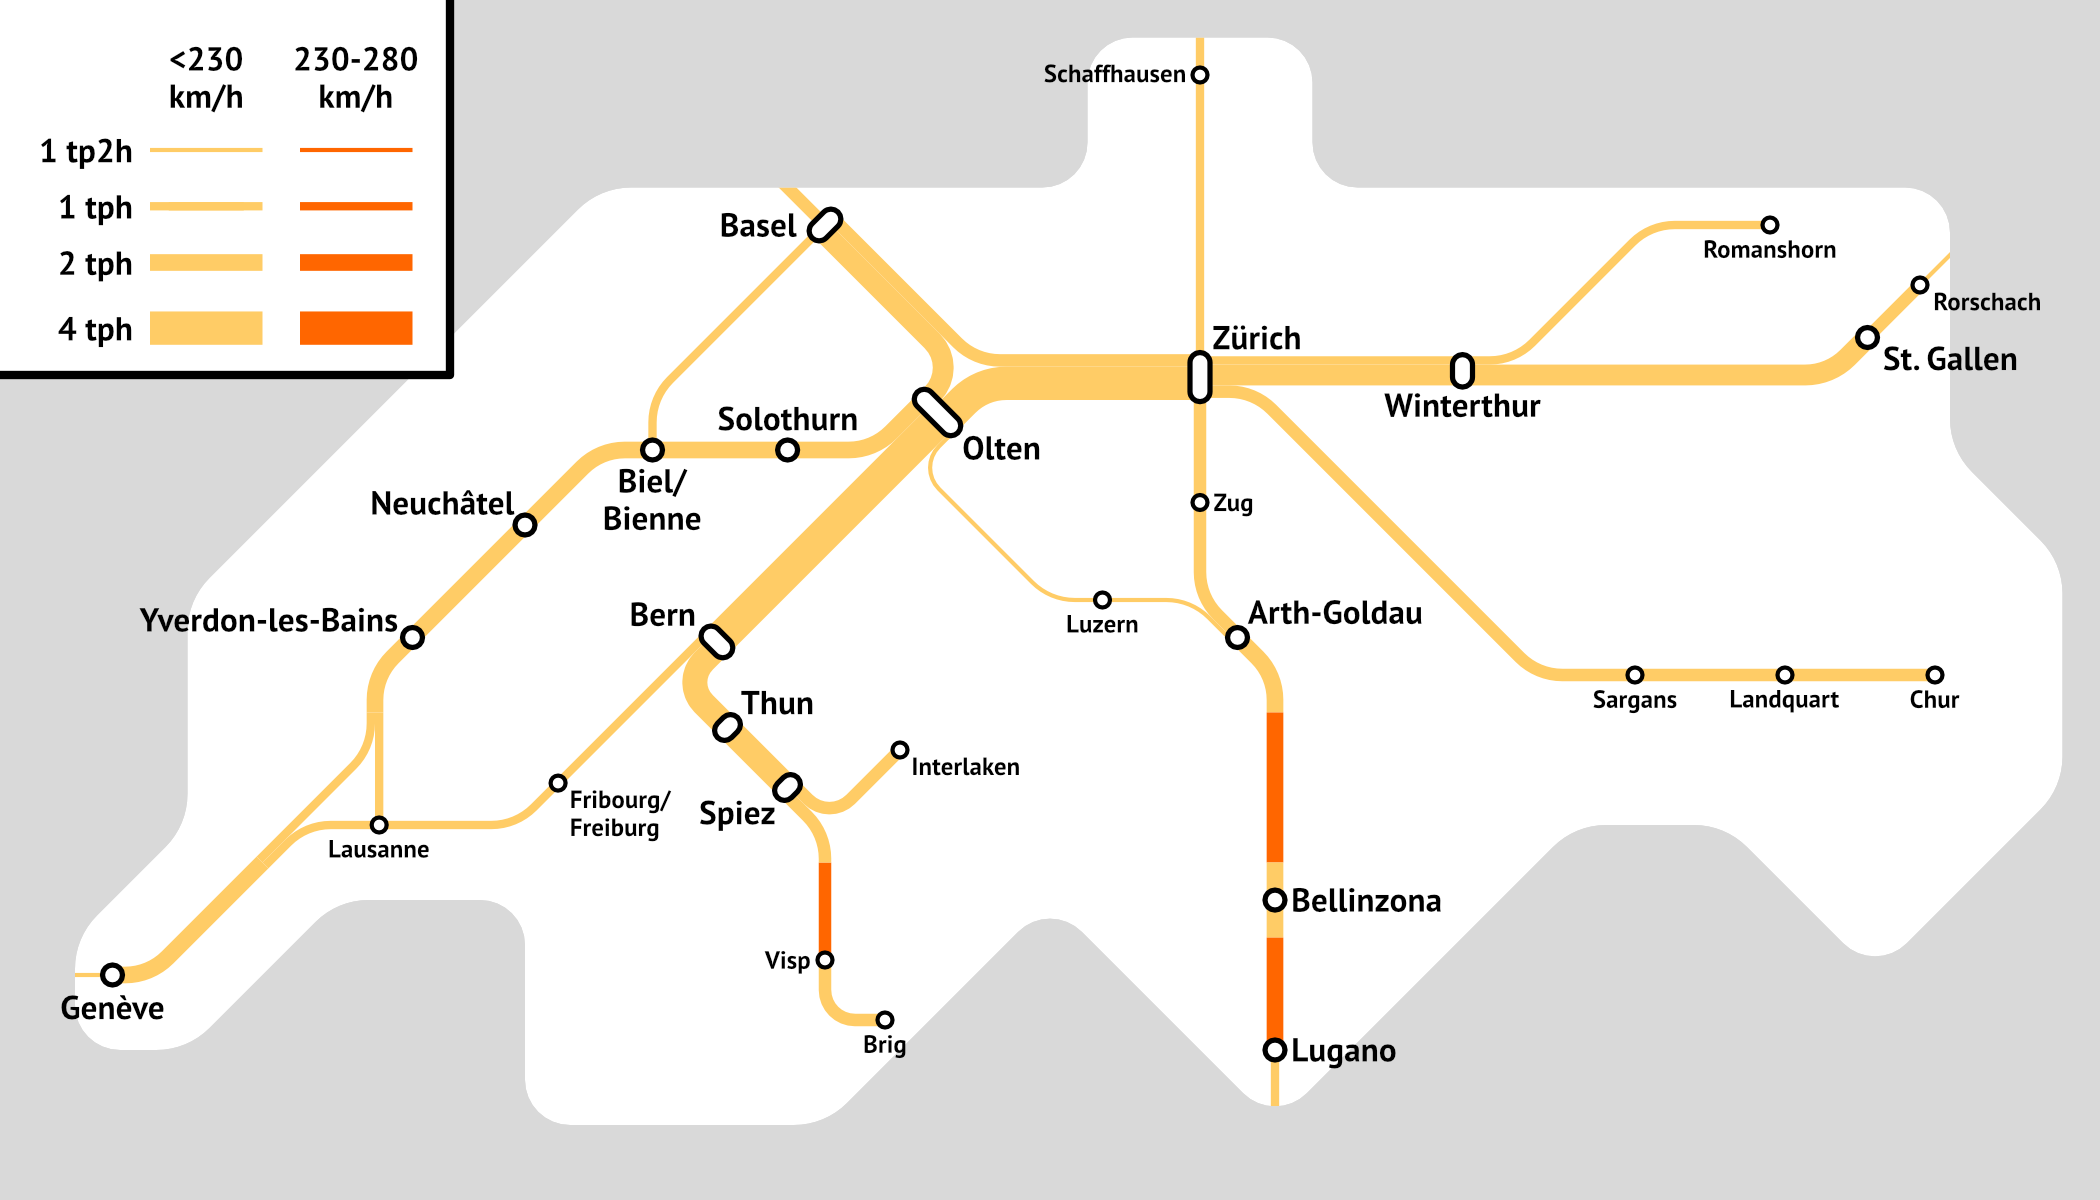
This needs to be compared with the other small Northern European country with a very strong legacy rail network, Switzerland. The map, with the same thickness and color scheme but not the same length scale, is here:

The orange segments are Alpine base tunnels, with extensive freight rail. The main high-cost investment in passenger-dedicated rail in Switzerland is not visible on the map, because it was built for 200 km/h to reduce costs: Olten-Bern, with extensive tunneling as well as state-of-the-art ETCS Level 2 signaling permitting 110 second headways. The Swiss rail network is centered not on one central point but on a Y between Zurich, Basel, and Bern, and the line was built as one of the three legs of the Y, designed to speed up Zurich-Bern and Basel-Bern trains to be just less than an hour each, to permit on-the-hour connections at all three stations.

By this comparison, HSL Zuid should not have been built this way. It is not useful for a domestic network designed around regular clockface frequencies and timed connections, in the Netherlands as much as in Switzerland. There is little interest in further 300 km/h domestic lines – any further proposals for increasing speeds on domestic trains are at 200 km/h, and as it is the domestic trains only go 160. In a country this size, so much time is spent on station approaches that the overall benefit of high top speed is reduced. Indeed, from Antwerp to Amsterdam, Eurostar trains take 1:20 over a distance of 182 km, an average speed comparable to the fastest classical lines in Europe such as the East Coast Main Line or the Southern Main Line in Sweden. The heavily-upgraded but still legacy Berlin-Hamburg line averages about 170 km/h when the trains are on time, and if German trains ran with Dutch punctuality and Dutch padding it would average 190 km/h.

What about international services?

The fastest trains using HSL Zuid are international, formerly branded Thalys, now branded Eurostar. They are also unfathomably expensive. Where NS’s website will sell me Amsterdam-Antwerp tickets for around 20€ if I’m willing to chain trips on slow regional trains, or 27€ on intercities doing the trip in 1:37 with one transfers, Eurostar charges 79-99€ for this trip when I look up available trains in mid-August on a weekday. For reference, the average domestic TGV trip over this distance is around 18€ and the average domestic ICE trip is around 22€. It goes without saying that the line is underused by international travelers – the fares are prohibitive.

Beyond Antwerp, the other problem is that Belgium has built HSL 1 from the French border to Brussels, HSL 2 and 3 from Leuven to the German border, and HSL 4 from Antwerp to the Dutch border, but has not bothered building a fast line between Brussels and Antwerp (or Leuven). The 46 km line between Brussels South and Antwerp Central takes 46 minutes by the fastest train. A 200 km/h high-speed line would do the trip in about 20, skipping Brussels Central and North as the Eurostars do.

But what if the fares were more reasonable and if Belgian trains weren’t this slow? Then, we would expect to see a massive increase in ridership, since the line would be connecting Amsterdam with Brussels in 1:40 and Paris in slightly more than three hours, with fares set at rates that would get the same ridership seen on domestic trains. The line would get much higher ridership.

And yet the trip time benefits of 300 km/h on HSL Zuid over 250 km/h are only 3 minutes. While much of the line is engineered for 300, the line is really two segments, one south of Rotterdam and one north of it, totaling 95 km of 300 km/h running plus extensive 200 and 250 km/h connections, and the total benefit to the higher top speed net of acceleration and deceleration time is only about 3 minutes. The total benefit of 300 km/h relative to 200 km/h is only about 8 minutes.

Two things are notable about this geography. The first is that the short spacing between must-serve stations – Amsterdam, Schiphol, Rotterdam, Antwerp – means that trains never get the chance to run fast. This is partly an artifact of Dutch density, but not entirely. England is as dense as the Netherlands and Belgium, but the plan for HS2 is to run nonstop trains between London and Birmingham, because between them there is nothing comparable in size or importance to Birmingham. North Rhine-Westphalia is about equally dense, and yet trains run nonstop between Cologne and Frankfurt, averaging around 170 km/h despite extensive German timetable padding and a slow approach to Cologne on the Hohenzollernbrücke.

The second is that the Netherlands is not a country of big central cities. Randstad is a very large metropolitan area, but it is really an agglomeration of the separate metro areas for Amsterdam, Rotterdam, the Hague, and Utrecht, each with its own set of destinations. The rail network needs to serve this geography with either direct trains or convenient transfers to all of the major centers. HSL Zuid does not do that – it has an easy transfer to the Hague at Rotterdam, but connecting to Utrecht (thus with the half of the Netherlands that isn’t Holland) is harder.

In retrospect, the Netherlands should have built more 200 and 250 km/h lines instead of building HSL Zuid. It could have kept the higher speed to Rotterdam but then built direct Rotterdam-Amsterdam and Rotterdam-Utrecht lines topping at 200 km/h, using the lower top speed to have more right-of-way flexibility to avoid tunnels. Separate trains would be running from points south to either Amsterdam or Utrecht, and fares in line with those of domestic trains would keep demand high enough that the frequency to both destinations would be acceptable.

In contrast, 300 km/h lines, if there are no slow segments like Brussels-Antwerp in their midst and if fares are reasonable, can be successful, if the single-core cities served are larger and the distances between stations are longer. The distances do not need to be as long as on some LGVs, with 400 km of nonstop running between Paris and Lyon – on a 100 km nonstop line, such as the plans for Hanover-Bielefeld including approaches or just the greenfield segment on Hamburg-Hanover, the difference between 200 and 300 km/h is 9 minutes, so about twice as much as on HSL Zuid and HSL 4 relative to their total length. This works, because while western Germany is dense much like the Netherlands, it is mostly a place of larger city cores separated by greater distances. The analogy to HSL Zuid elsewhere in Europe is as if Germany decided to build a line to 300 km/h standards internally to the Rhine-Ruhr region, or if the UK decided to build one between Liverpool and Manchester.

Can Ridership Surges Disrupt Small, Frequent Driverless Metros?

A recent discussion about the Nuremberg U-Bahn got me thinking about the issue of transfers from infrequent to frequent vehicles and how they can disrupt service. The issue is that driverless metros like Nuremberg’s rely on very high frequency on relatively small vehicles in order to maintain adequate capacity; Nuremberg has the lowest U-Bahn construction costs in Germany, and Italian cities with even smaller vehicles use the combination of short stations and very high frequency to reduce costs even further. However, all of this assumes that passengers arrive at the station evenly; an uneven surge could in theory overwhelm the system. The topic of the forum discussion was precisely this, but it left me unconvinced that such surges could be real on a driverless urban metro (as opposed to a landside airport people mover). The upshot is that there should not be obstacles to pushing the Nuremberg U-Bahn and other driverless metros to their limit on frequency and capacity, which at this point means 85-second headways as on the driverless Parisian lines.

What is the issue with infrequent-to-frequent transfers?

Whenever there is a transfer from a large, infrequent vehicle to a small, frequent one, passengers overwhelm systems that are designed around a continuous arrival rate rather than surges. Real-world examples include all of the following:

  • Transfers from the New Jersey Transit commuter trains at the Newark Airport station to the AirTrain.
  • Transfers from OuiGo TGVs at Marne-la-Vallée to the RER.
  • In 2009, transfers from intercity CR trains at Shanghai Station to the metro.

In the last two cases, the system that is being overwhelmed is not the trains themselves, which are very long. Rather, what’s being overwhelmed is the ticket vending machines: in Shanghai the TVMs frequently broke, and with only one of three machines at the station entrance in operation, there was a 20-minute queue. A similar queue was observed at Marne-la-Vallée. Locals have reusable farecards, but non-locals would not, overwhelming the TVM.

In the first case, I think the vehicles themselves are somewhat overwhelmed on the first train that the commuter train connects to, but that is not the primary system capacity issue either. Rather, the queues at the faregates between the two systems can get long (a few minutes, never 20 minutes).

In contrast, I have never seen the transfer from the TGV to the Métro break the system at Gare de Lyon. The TGV may be unloading 1,000 passengers at once, but it takes longer for all of them to disembark than the headway between Métro trains; I’ve observed the last stragglers take 10 minutes to clear a TGV Duplex in Paris, and between that, long walking paths from the train to the Métro platforms, and multiple entrances, the TGV cannot meaningfully be a surge. Nor have I seen an airplane overwhelm a frequent train, for essentially the same reason.

What about school trips?

The forum discussion brings up two surges that limit the capacity of the Nuremberg U-Bahn: the airport, and school trips. The airport can be directly dispensed with – individual planes don’t do this at airside people movers, and don’t even do this at low-capacity landside people movers like the JFK and Newark AirTrains. But school trips are a more intriguing possibility.

What is true is that school trips routinely overwhelm buses. Students quickly learn to take the last bus that lets them make school on time: this is the morning and they don’t want to be there, so they optimize for how to stay in bed for just a little longer. Large directional commuter volumes can therefore lead to surges on buses: in Vancouver, UBC-bound buses routinely have passups in the morning rush hour, because classes start at coordinated times and everyone times themselves to the last bus that reaches campus on time.

However, the UBC passups come from a combination of factors, none of which is relevant to Nuremberg:

  • They’re on buses. SkyTrain handles surges just fine.
  • UBC is a large university campus tucked at the edge of the built-up area.
  • UBC has modular courses, as is common at American universities, and coordinated class start and end times (on the hour three days a week, every 1.5 hours two days a week).

It is notable that Vancouver does not have any serious surges coming from school trips, even with trainsets that are shorter than those of Nuremberg (40 meters on the Canada Line and 68-80 meters on the Expo and Millennium lines, compared with 76 meters). Schools are usually sited to draw students from multiple directions, and are usually not large enough to drive much train crowding on their own. A list on Wikipedia has the number of students per Gymnasium, and they’re typically high three figures with one at 1,167, none of which is enough to overwhelm a driverless 76 meter long train. Notably, school trips do not overwhelm the New York City Subway; New York City Subway rolling stock ranges from 150 to 180 meters long rather than 76 as in Nuremberg, but then the specialized high schools go as far up as 5,800 students, and one has 3,000 and is awkwardly located in the North Bronx.

Indeed, neither Vancouver nor New York schedules its trains based on whether school is in session. Both run additional buses on school days to avoid school surges, but SkyTrain and the subway do not run additional vehicles, and in both formal planning and informal railfan lore about crowding, school trips are not considered important. So school surges are absolutely real on buses, and university surges are real everywhere, but not enough to overwhelm trains. Nuremberg should not consider itself special on this regard, and can plan its U-Bahn systems as if it does not have special surges and passengers do arrive continuously at stations.

The Hamburg-Hanover High-Speed Line

A new high-speed line (NBS) between Hamburg and Hanover has received the approval of the government, and will go up for a Bundestag vote shortly. The line has been proposed and planned in various forms since the 1990s, the older Y-Trasse plan including a branch to Bremen in a Y formation, but the current project omits Bremen. The idea of building this line is good and long overdue, but unfortunately everything about it, including the cost, the desired speed, and the main public concerns, betray incompetence, of the kind that gave up on building any infrastructure and is entirely reactive, much like in the United States.

The route, in some of the flattest land in Germany, is a largely straight new high-speed rail line. Going north from Hanover to Hamburg, it departs somewhat south of Celle, and rejoins the line just outside Hamburg’s city limits in Meckelfeld. The route appears to be 107 km of new mainline route, not including other connections adding a few kilometers, chiefly from Celle to the north. An interactive map can be found here; the map below is static, from Wikipedia, and the selected route is the pink one.

For about 110 km in easy topography, the projected cost is 6.7 billion € per a presentation from two weeks ago, which is about twice as high as the average cost of tunnel-free German NBSes so far. It is nearly as high as the cost of the Stuttgart-Ulm NBS, which is 51% in tunnel.

And despite the very high cost, the standards are rather low. The top speed is intended to be 250 km/h, not 300 km/h. The travel time savings is only 20 minutes: trip times are to be reduced from 79 minutes today to 59 minutes. Using a top speed of 250 km/h, the current capabilities of ICE 3/Velaro trains, and the existing top speeds of the approaches to Hamburg and Hanover, I’ve found that the nonstop trip time should be 46 minutes, which means the planned timetable padding is 28%. Timetable padding in Germany is so extensive that trains today could do Hamburg-Hanover in 63 minutes.

As a result, the project isn’t really sold as a Hamburg-Hanover high-speed line. Instead, the presentation above speaks of great trip time benefits to the intermediate towns with local stops, Soltau (population: 22,000) and Bergen (population: 17,000). More importantly, it talks about capacity, as the Hamburg-Hanover line is one of the busiest in Germany.

As a capacity reliever, a high-speed line is a sound decision, but then why is it scheduled with such lax timetabling? It’s not about fitting into a Takt with hourly trip times, first of all because if the top speed were 300 km/h and the padding were the 7% of Switzerland, the Netherlands, and Sweden then the trip time would be 45 minutes, and second of all because Hamburg is at the extremity of the country and therefore it’s not meaningfully an intercity knot that must be reached on the hour.

Worse, the line is built with the possibility of freight service. Normal service is designed to be passenger-only, but in case of disruptions on the classical line, the line is designed to be freight-ready. This is stupid: it’s much cheaper to invest in reliability than to build a dual-use high-speed passenger and freight line, and the one country in the world with both a solid high-speed rail network and high freight rail usage, China, doesn’t do this. (Italy builds its high-speed lines with freight-friendly standards and has high construction costs, even though its construction costs in general, e.g. for metro lines or electrification, are rather low.)

Cross-Border Rail and the EU’s Learned Helplessness

I’m sitting on a EuroCity train from Copenhagen back to Germany. It’s timetabled to take 4:45 to do 520 km, an average speed of 110 km/h, and the train departed 25 minutes late because the crew needed to arrive on another train and that train was late. One of the cars on this train is closed due to an air conditioner malfunction; Cid and I rode this same line to Copenhagen two years ago and this also happened in one direction then.

This is a line that touches, at both ends, two of the fastest conventional lines in Europe, Stockholm-Malmö taking 4:30 to do 614 km (136 km/h) and Berlin-Hamburg normally taking 1:45 to do 287 km (164 km/h) when it is on time. This contrast between good lines within European member states, despite real problems with the German and Swedish rail networks, and much worse ones between them, got me thinking about cross-border rail more. Now, this line in particular is getting upgraded – the route is about to be cut off when the Fehmarn Belt Line opens in four years, reducing the trip time to 2:30. But more in general, cross-border and near-border lines that slow down travel that’s otherwise decent on the core within-state city pairs are common, and so far there’s no EU action on this. Instead, EU action on cross-border rail shows learned helplessness of avoiding the only solution for rail construction: top-down state-directed infrastructure building.

The upshot is that there is good cross-border rail advocacy here, most notably by Jon Worth, but because EU integration on this matter is unthinkable, this advocacy is forced to treat the railroads as if they are private oligopolies rather than state-owned public services. Jon successfully pushed for the incoming EU Commission of last year to include passenger rights in its agenda, to deal with friction between different national railroads. The issue is that SNCF and DB have internal ways of handling passenger rights in case of delays, due to domestic pressure on the state not to let the state railroad exploit its users, and they are not compatible across borders: SNCF is on time enough not to strand passengers, DB has enough frequency and extreme late-night timetable padding (my connecting train to Berlin is padded from 1:45 to 2:30, getting me home well past midnight) not to strand passengers; but when passengers cross from Germany to France, these two internal methods both fail.

At no point in this discussion was any top-down EU-level coordination even on the table. The mentality is that construction of new lines doesn’t matter – it’s a megaproject and these only generate headaches and cost overruns, not results, so instead everything boils down to private companies competing on the same lines. That the companies are state-owned is immaterial at the EU level – SNCF has no social mission outside the borders of France and therefore in its international service it usually behaves as a predatory monopoly profiteering off of a deliberately throttled Eurostar/Thalys market.

If there’s no EU state action, then the relationship between the operator, which is not part of the state, and the passenger, is necessarily adversarial. This is where the preference for regulations that assume this relationship must be adversarial and aim to empower the individual consumer comes from. It’s logical, if one assumes that there will never be an EU-wide high-speed intercity rail network, just a bunch of national networks with one-off cross-border megaprojects compromised to the point of not running particularly quickly or frequently.

And that is, frankly, learned helplessness on the part of the EU institutions. They take it for granted that state-led development is impossible at higher level than member states, and try to cope by optimizing for a union of member states whose infrastructure systems don’t quite cohere. Meanwhile, at the other end of the Eurasian continent, a continental-scale state has built a high-speed rail network that at this point has higher ridership per capita than most European states and is not far behind France or Germany, designed around a single state-owned network optimized for very high average speeds.

This occurs at a time when support for the EU is high in the remaining member states. There’s broad understanding that scale is a core benefit of the union, hence the regulatory harmonization ensuring that products can be shipped union-wide without cross-border friction. But for personal travel by train, these principles go away, and friction is assumed to only comprise the least important elements, because the EU institutions have decided that solving the most important ones, that is speed and frequency, is unthinkable.

Meme Weeding: Embodied Carbon

The greenhouse gases emitted by the production of concrete, called embodied carbon, are occasionally used as a green-NIMBY argument against building new things. A Berlin Green spokesperson coauthored a study opposing U-Bahn construction on the grounds that the concrete used in construction would raise emissions. More recently, I’ve seen American opponents of transit-oriented development in Manhattan, of all places, talk about the high embodied carbon of new high-rise buildings. Katja Diehl calls for a moratorium on new buildings on anti-concrete grounds, and a petition for the EU to shift regulations to be against new buildings and in favor of reuse on embodied carbon grounds got written up favorably by Kate Wagner in the Nation. Against all of this, I’ve found some numbers on the actual emissions involved in concrete production for new buildings, and they are so low as to be insignificant, 1.5 orders of magnitude less than transportation emissions. A decarbonization strategy should largely ignore embodied carbon concerns and embrace pro-growth sentiments: big buildings, big subway systems, big cities.

What is embodied carbon?

Embodied (sometimes called embedded) carbon is the carbon content emitted by the production of materials. The production of concrete emits greenhouses gases, mainly through two mechanisms: the chemical process used to produce cement emits CO2 by itself, and the energy used for production adds to the emissions of the electric grid.

What are the embodied carbon emissions of new buildings?

The embodied carbon content of concrete depends heavily on the local electricity grid as well as on the required strength of the material, with stronger requirements leading to higher emissions. The Climate Group commissioned a report on this in the British context, finding a wide range, but the average is around 250 kg of CO2-equivalent per m^3 of concrete, the 75th percentile is about 300, and the upper bound is 450. This is a cradle-to-gate figure, taking into account the existing conditions of the carbon intensivity of where concrete is produced and of the logistics system for getting it to the construction site. This is already with some reductions from a previous baseline (EC100; the UK average is around EC60), and further reductions are possible, through decarbonizing the logistics and production; the goal of the report is not to bury the concept of embodied carbon as I do but to propose ways to reduce construction industry emissions.

The question is now how to convert cubic meters of concrete into square meters of built-up area. I have not seen European figures for this, but I did find a 2012 report by the Building and Construction Authority. In Singapore, the sustainability index used is the concrete usage index (CUI), measured in meters (cubic meters per square meter). The example projects given in the study, all around 15 years old, have a CUI of 0.4-0.5 m, and it was pointed out to me on social media that in Toronto the average is 0.55 m.

250 kg/m^3 times 0.4 m equals 0.1 t-CO2 per m^2 of built-up area. A 100 m^2 apartment thus has an embodied carbon content of around 10 t-CO2. This is relative to a baseline in which there is already some concern for reducing construction emissions, both the CUI and the carbon content of concrete per m^3, but this is largely without techniques like mass timber or infra-lightweight concrete (ILC). In Singapore the techniques highlighted in the BCA report are fully compatible with the city’s high-rise character, and the example building with gold but not platinum certification has 25 stories.

Should we worry about construction emissions?

No.

An aggressively YIMBY construction schedule, say with 10 dwellings built annually per 1,000 people, say averaging 100 m^2, emits around 0.1 t/capita annually: 0.1 t/m^2 * 100 m^2/unit * 0.01 unit/capita. All figures have ranges (and if anything, 100 is high for the places that build this much urban infill housing), but factor-of-1.5 ranges don’t erase an order of magnitude analysis. The emissions produced by construction, even if it were raised to some of the highest per capita rates found in the developed world – in fact higher rates than any national average I know of – would be about two orders of magnitude lower than present-day first-world emissions. They’d be 1.5 orders of magnitude lower than transportation emissions; in Germany, transport is 22% of national emissions and rising, as all other sources are in decline whereas transport is flat.

There’s a lot of confusion about this because some studies talk about buildings in general providing a high share of emissions. The Bloomberg-era PlaNYC spoke of buildings as the top source of emissions in New York, and likewise the Nation cites WeForum saying buildings are 37% of global emissions, citing a UN report that includes buildings’ operating emissions (its topline figure is 10 Gt in operating emissions, which is 27% of global emissions in 2022). But the construction emissions are insignificantly low. This means that aggressive replacement of older buildings by newer, more energy-efficient ones is an unmixed blessing, exactly the opposite of the conclusion of the green movement.

Instead of worrying about a source of emissions measured per capita in the tens of kilograms per year rather than in the tons, environmental advocates need to prioritize the most important source of greenhouse gases. The largest in developed countries is transportation, with electricity production usually coming second, always falling over the years while transport remains flat. In cold countries, heating is a significant source of emissions as well, to be reduced through building large, energy-efficient apartment buildings and through heat pump installation.

Regulations on new construction’s embodied carbon are likely a net negative for the environment. The most significant social policy concerning housing as far as environmental impact is concerned is to encourage people to live in urban apartment buildings near train stations. Any regulation that makes this harder – for example, making demolitions of small buildings to make room for big ones harder, or demanding that new buildings meet embodied carbon standards – makes this goal harder. This can be understandable occasionally if the goal of the regulation is not environmental, for example labor regulations for construction workers. It is not understandable if the goal is environmental, as the concern over embodied carbon is. People are entitled to their opinion that small is beautiful as a matter of aesthetic judgment, but they are not entitled to alternative facts that small is environmentally friendly.

Second Avenue Subway Phase 2 Station Design is Incompetent

A few hours ago, the MTA presented on the latest of Second Avenue Subway Phase 2. The presentation includes information about the engineering and construction of the three stations – 106th, 116th, and 125th Streets. The new designs are not good, and the design of 116th in particular betrays severe incompetence about how modern subway stations are built: the station is fairly shallow, but has a mezzanine under the tracks, with all access to or from the station requiring elevator-only access to the mezzanine.

What was in the presentation?

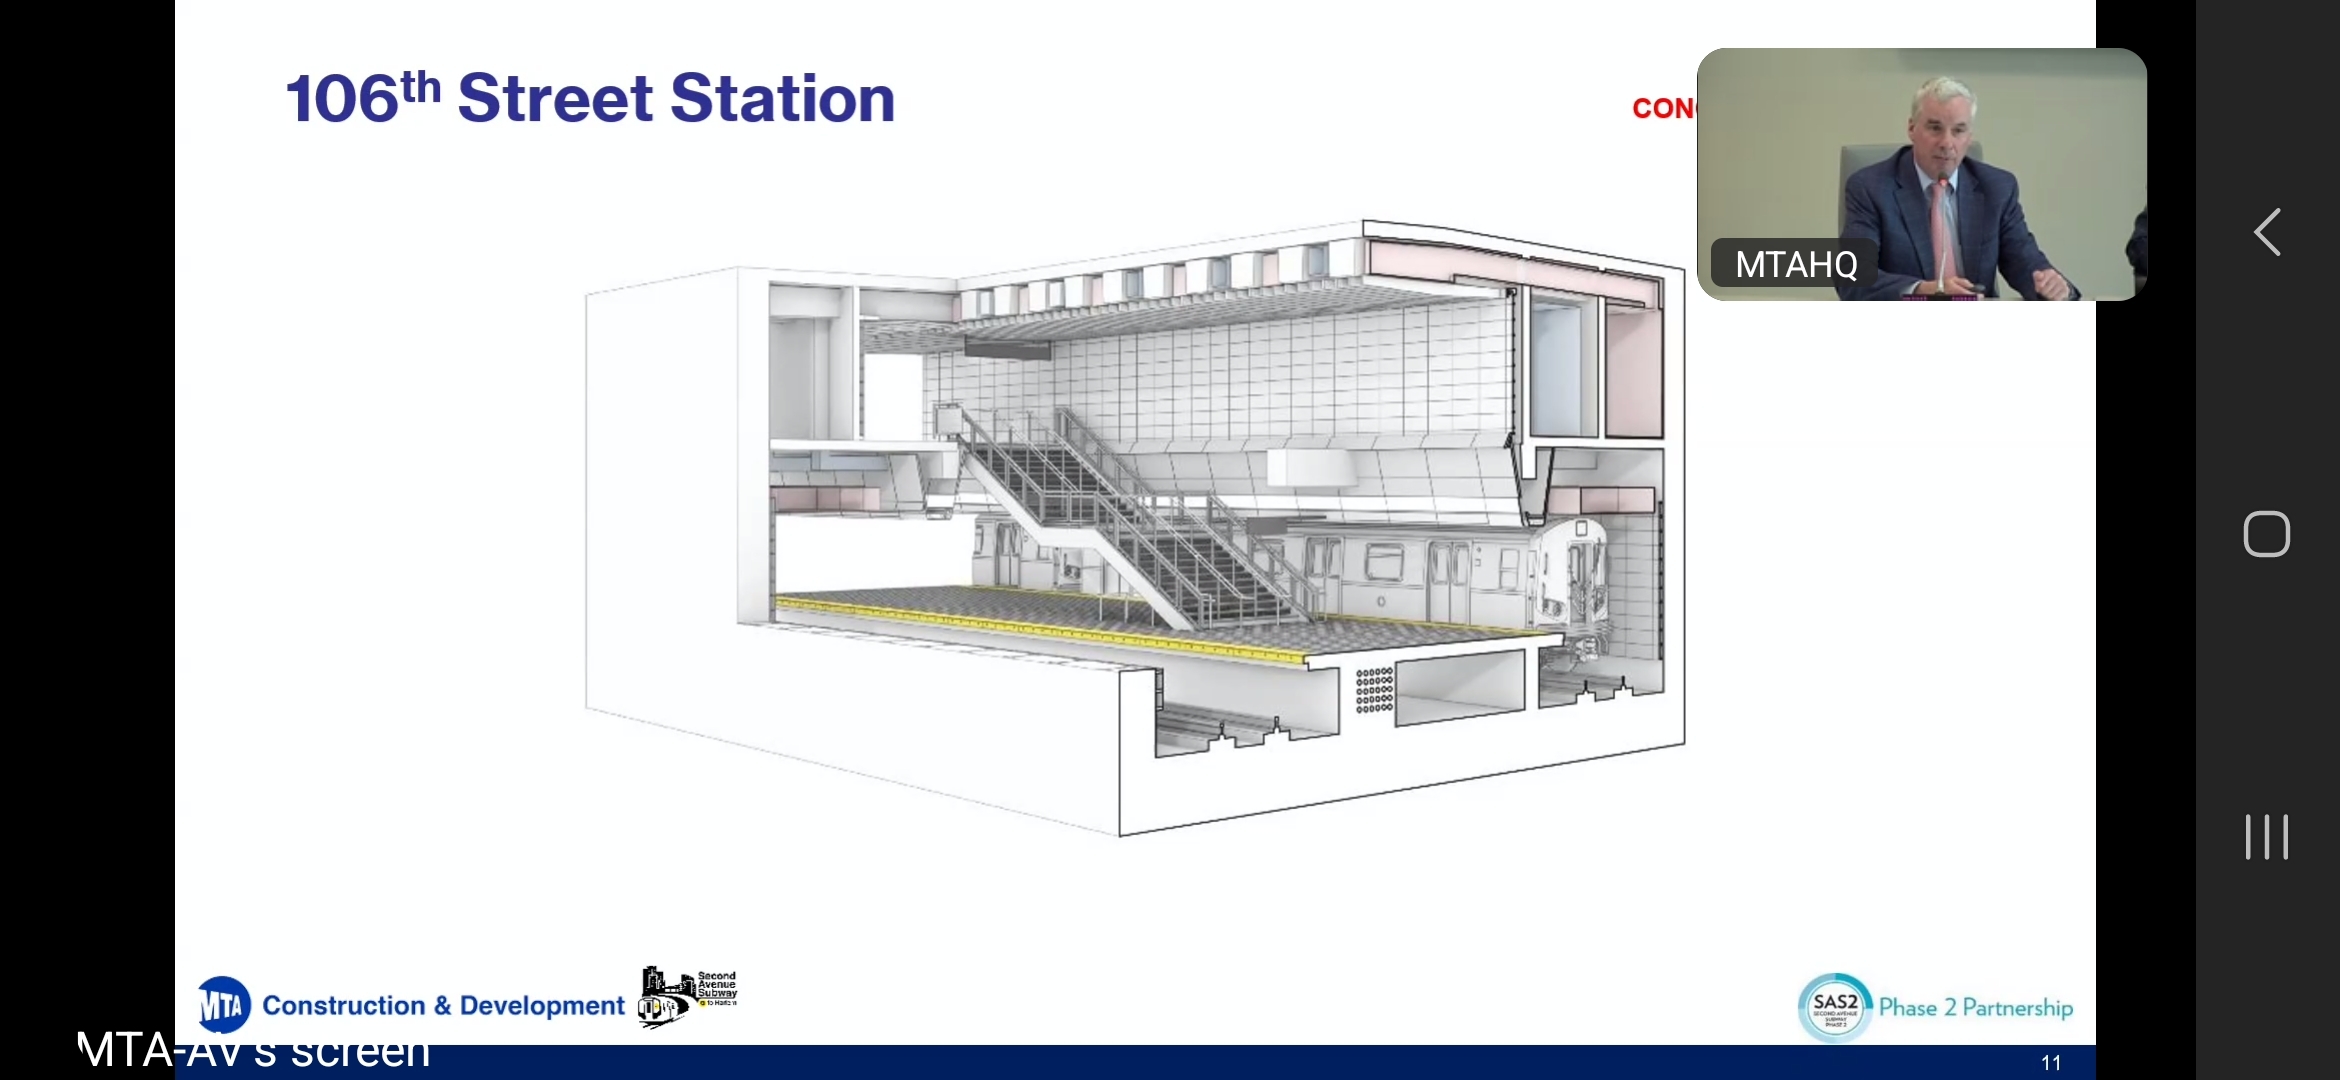
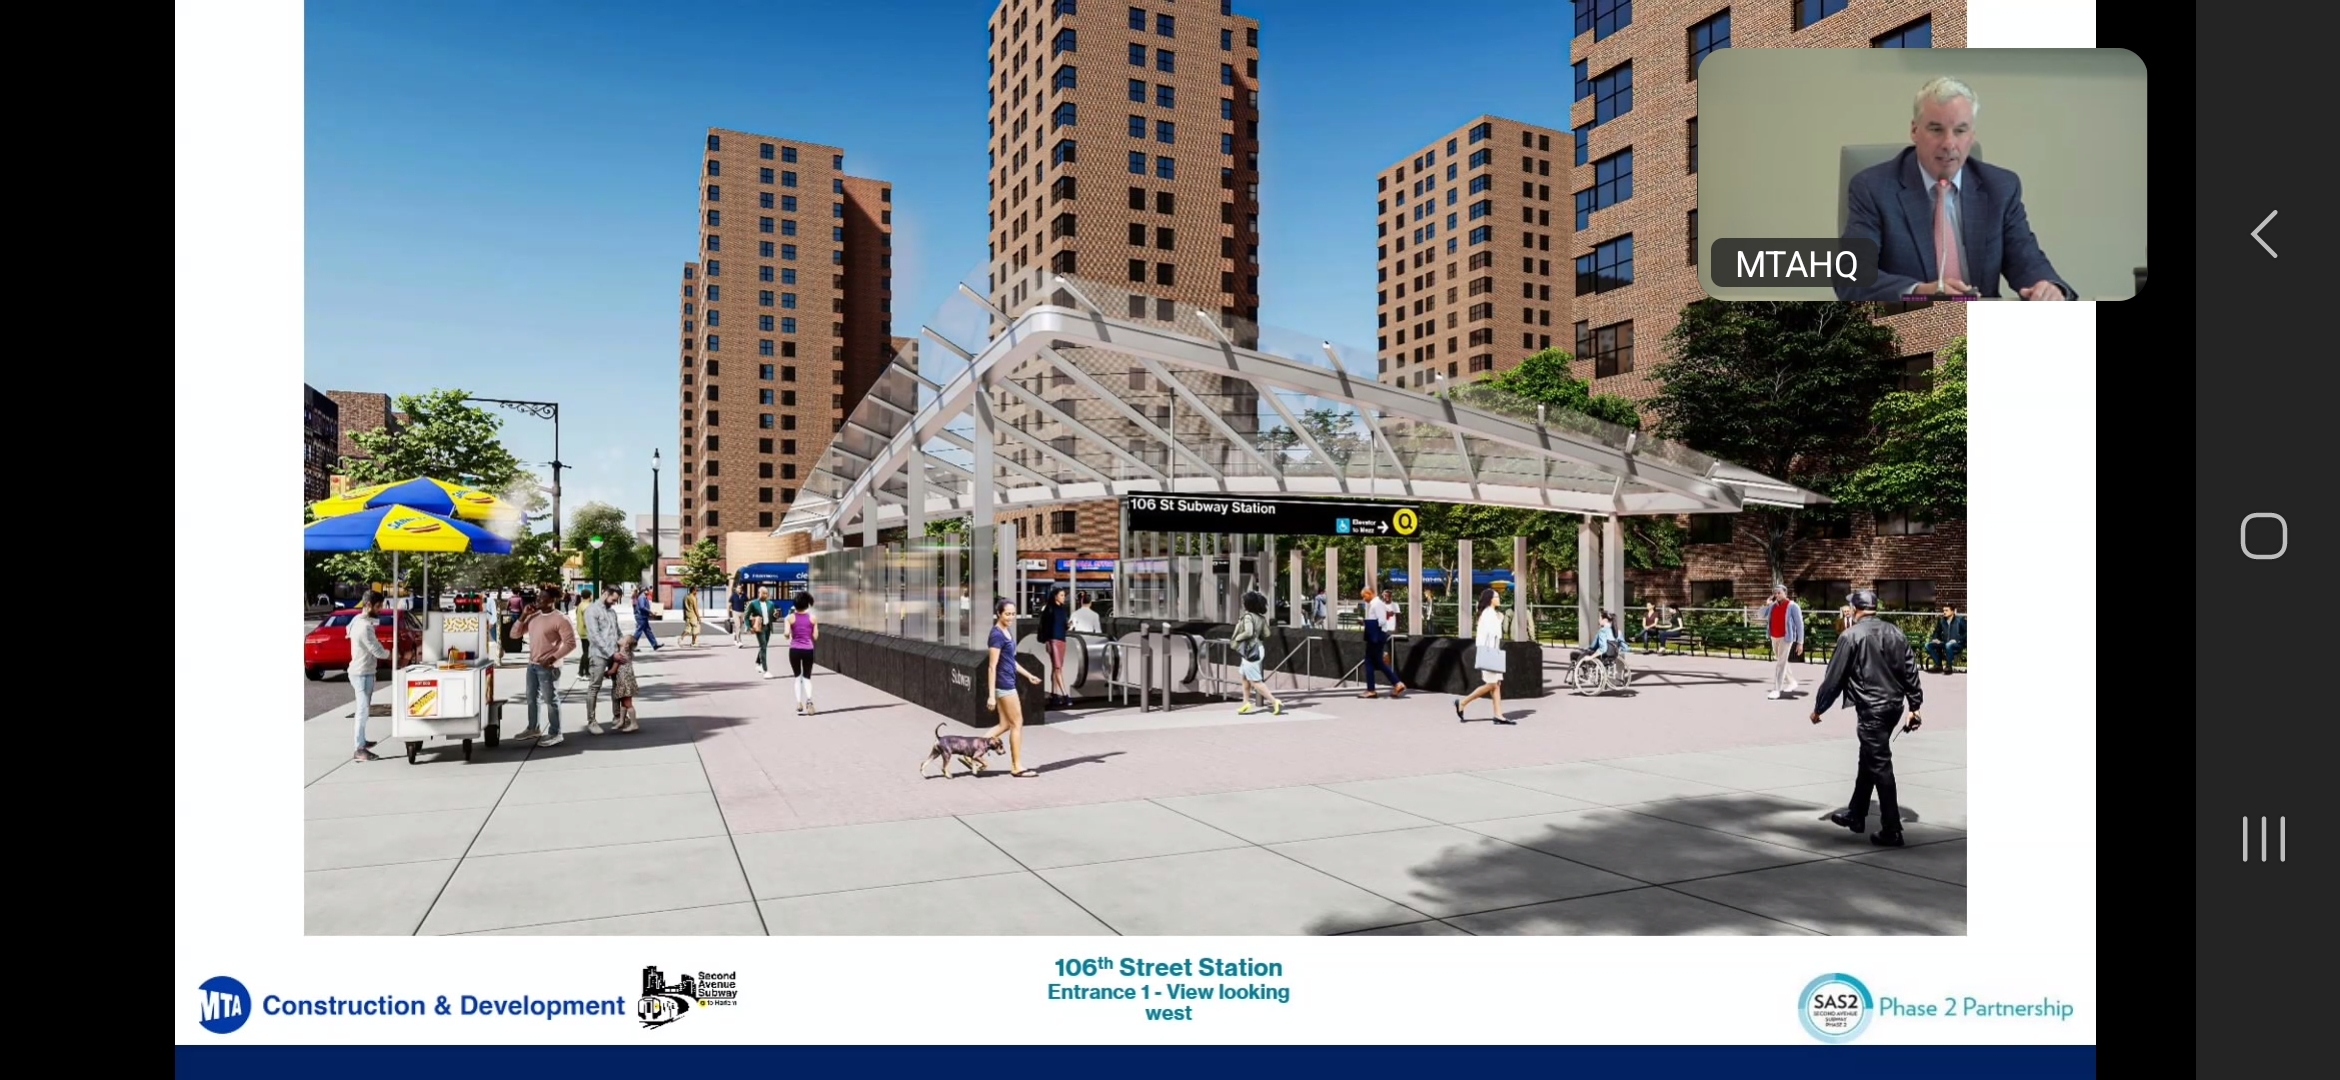
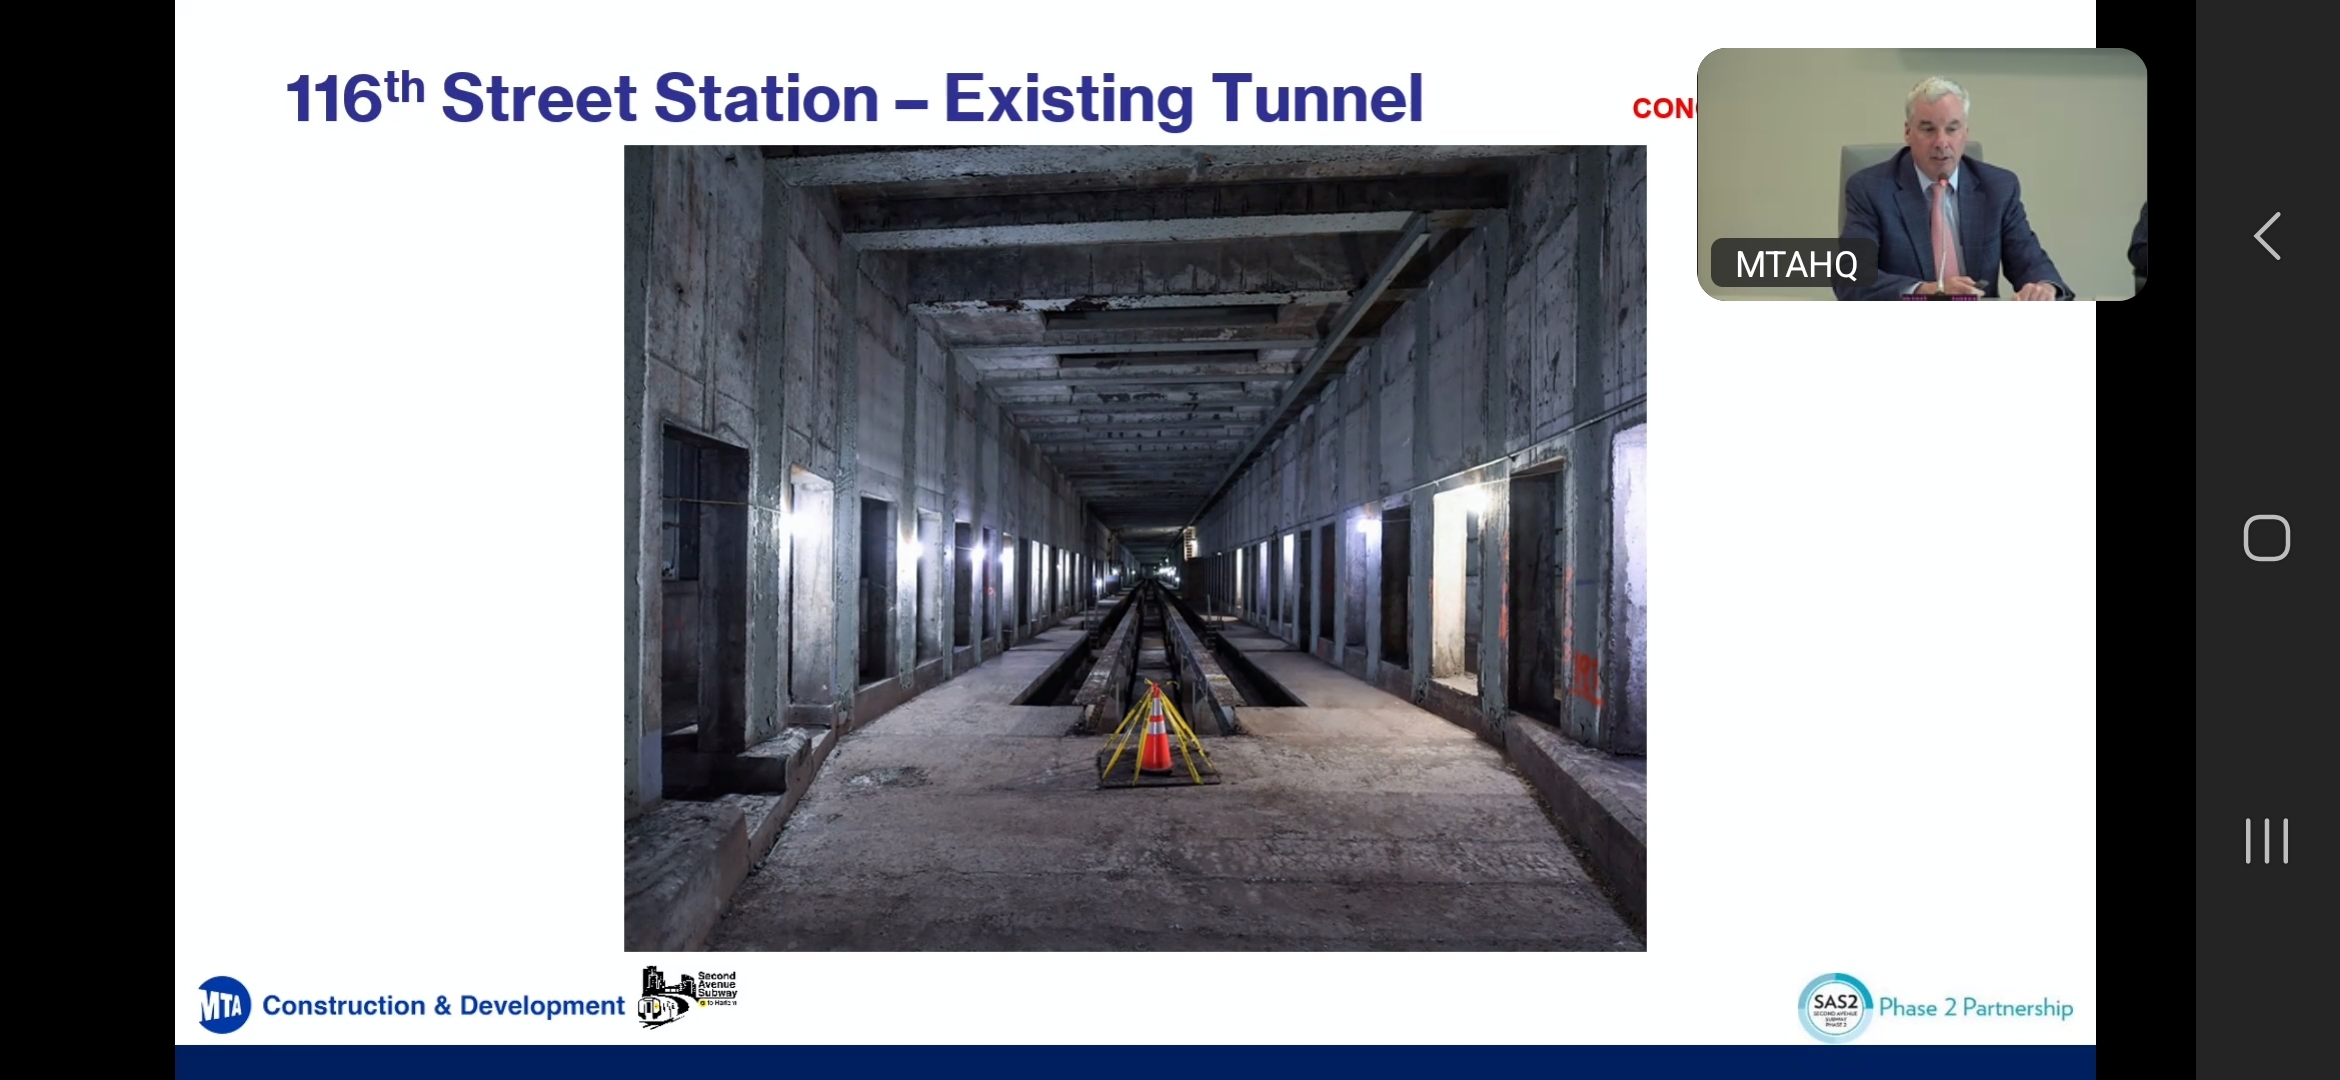
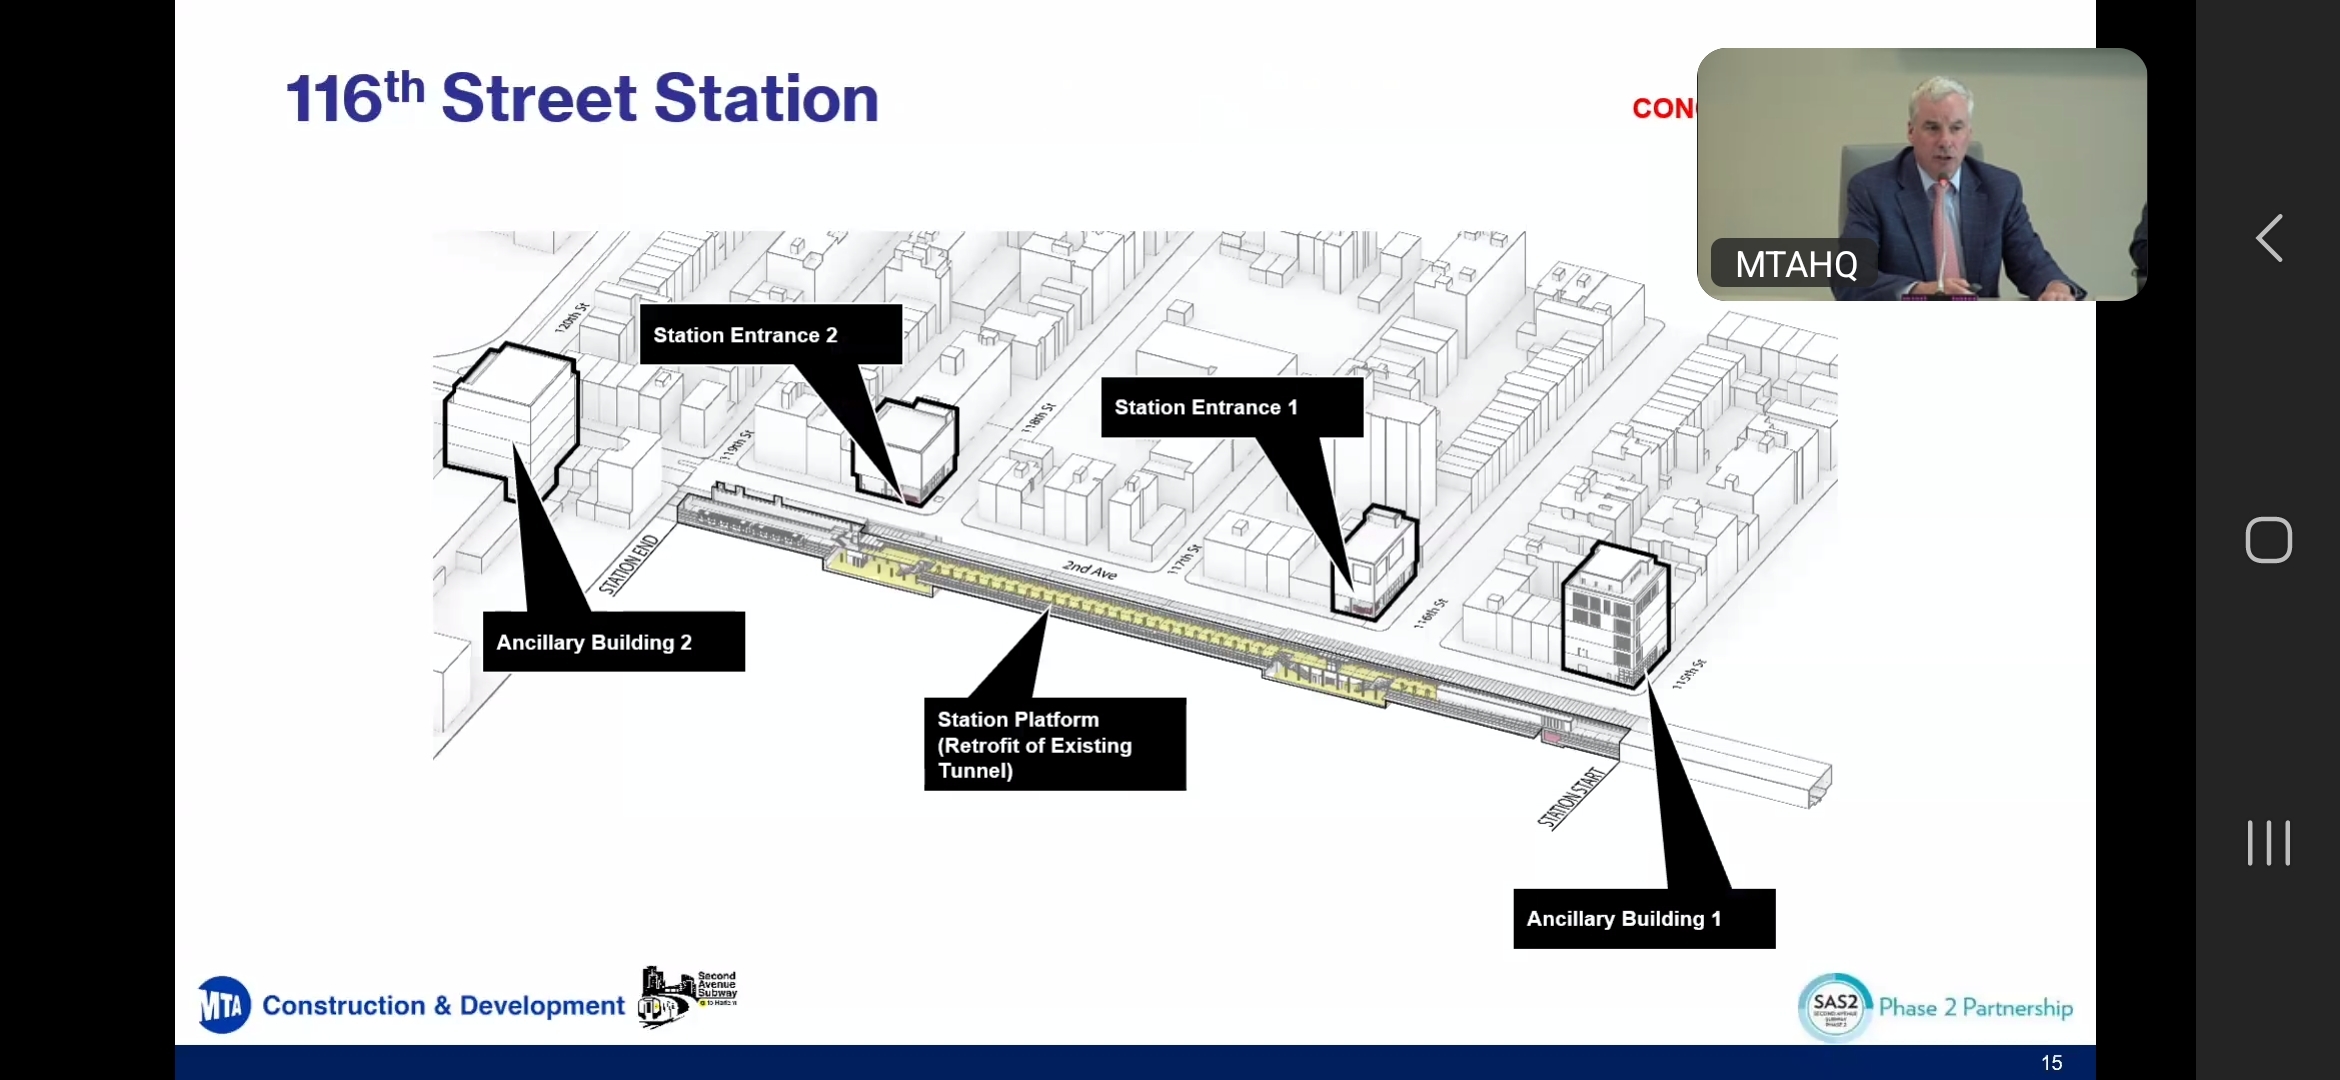
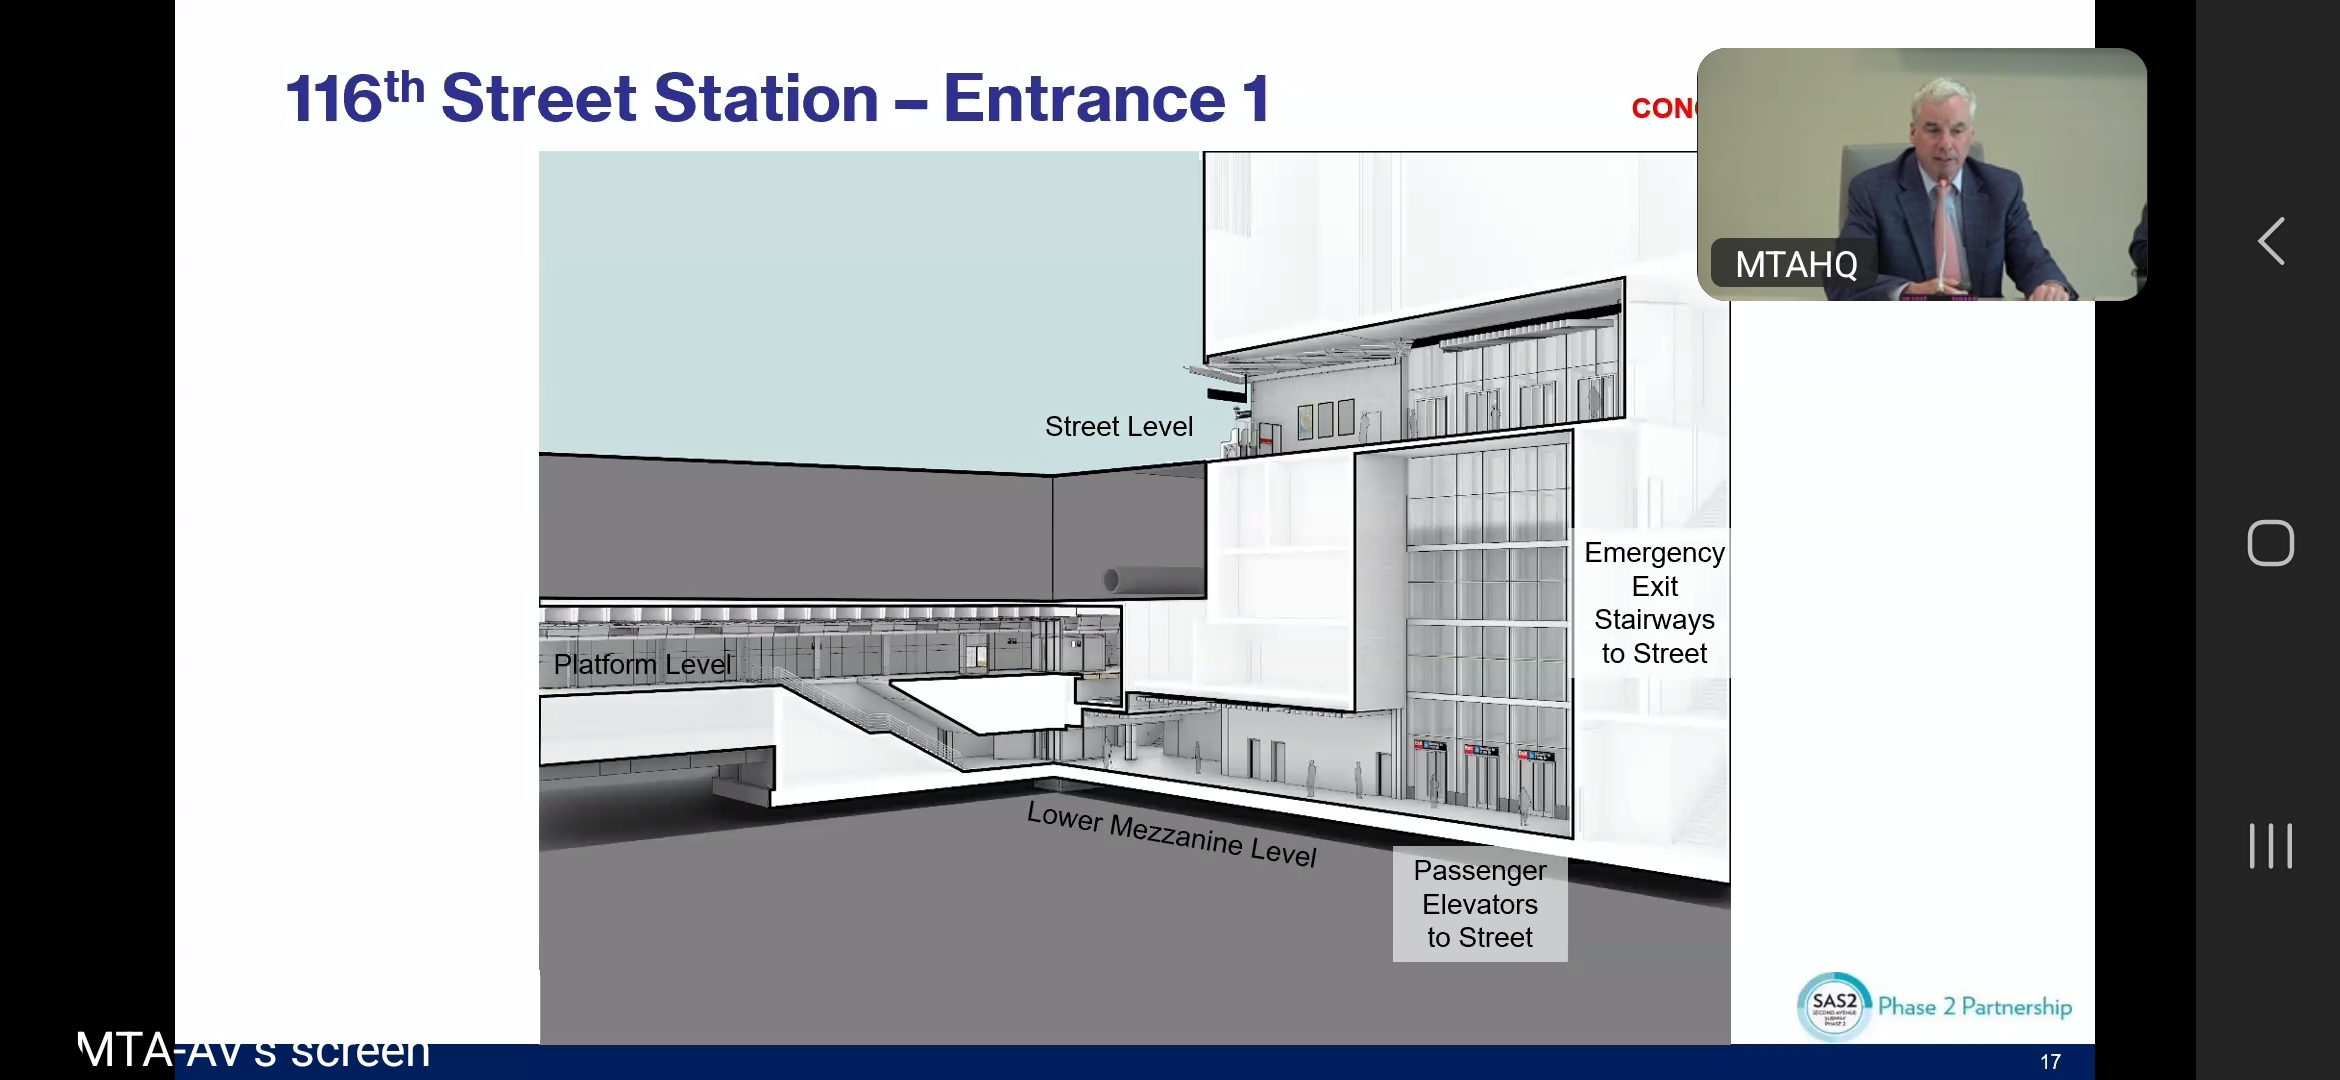
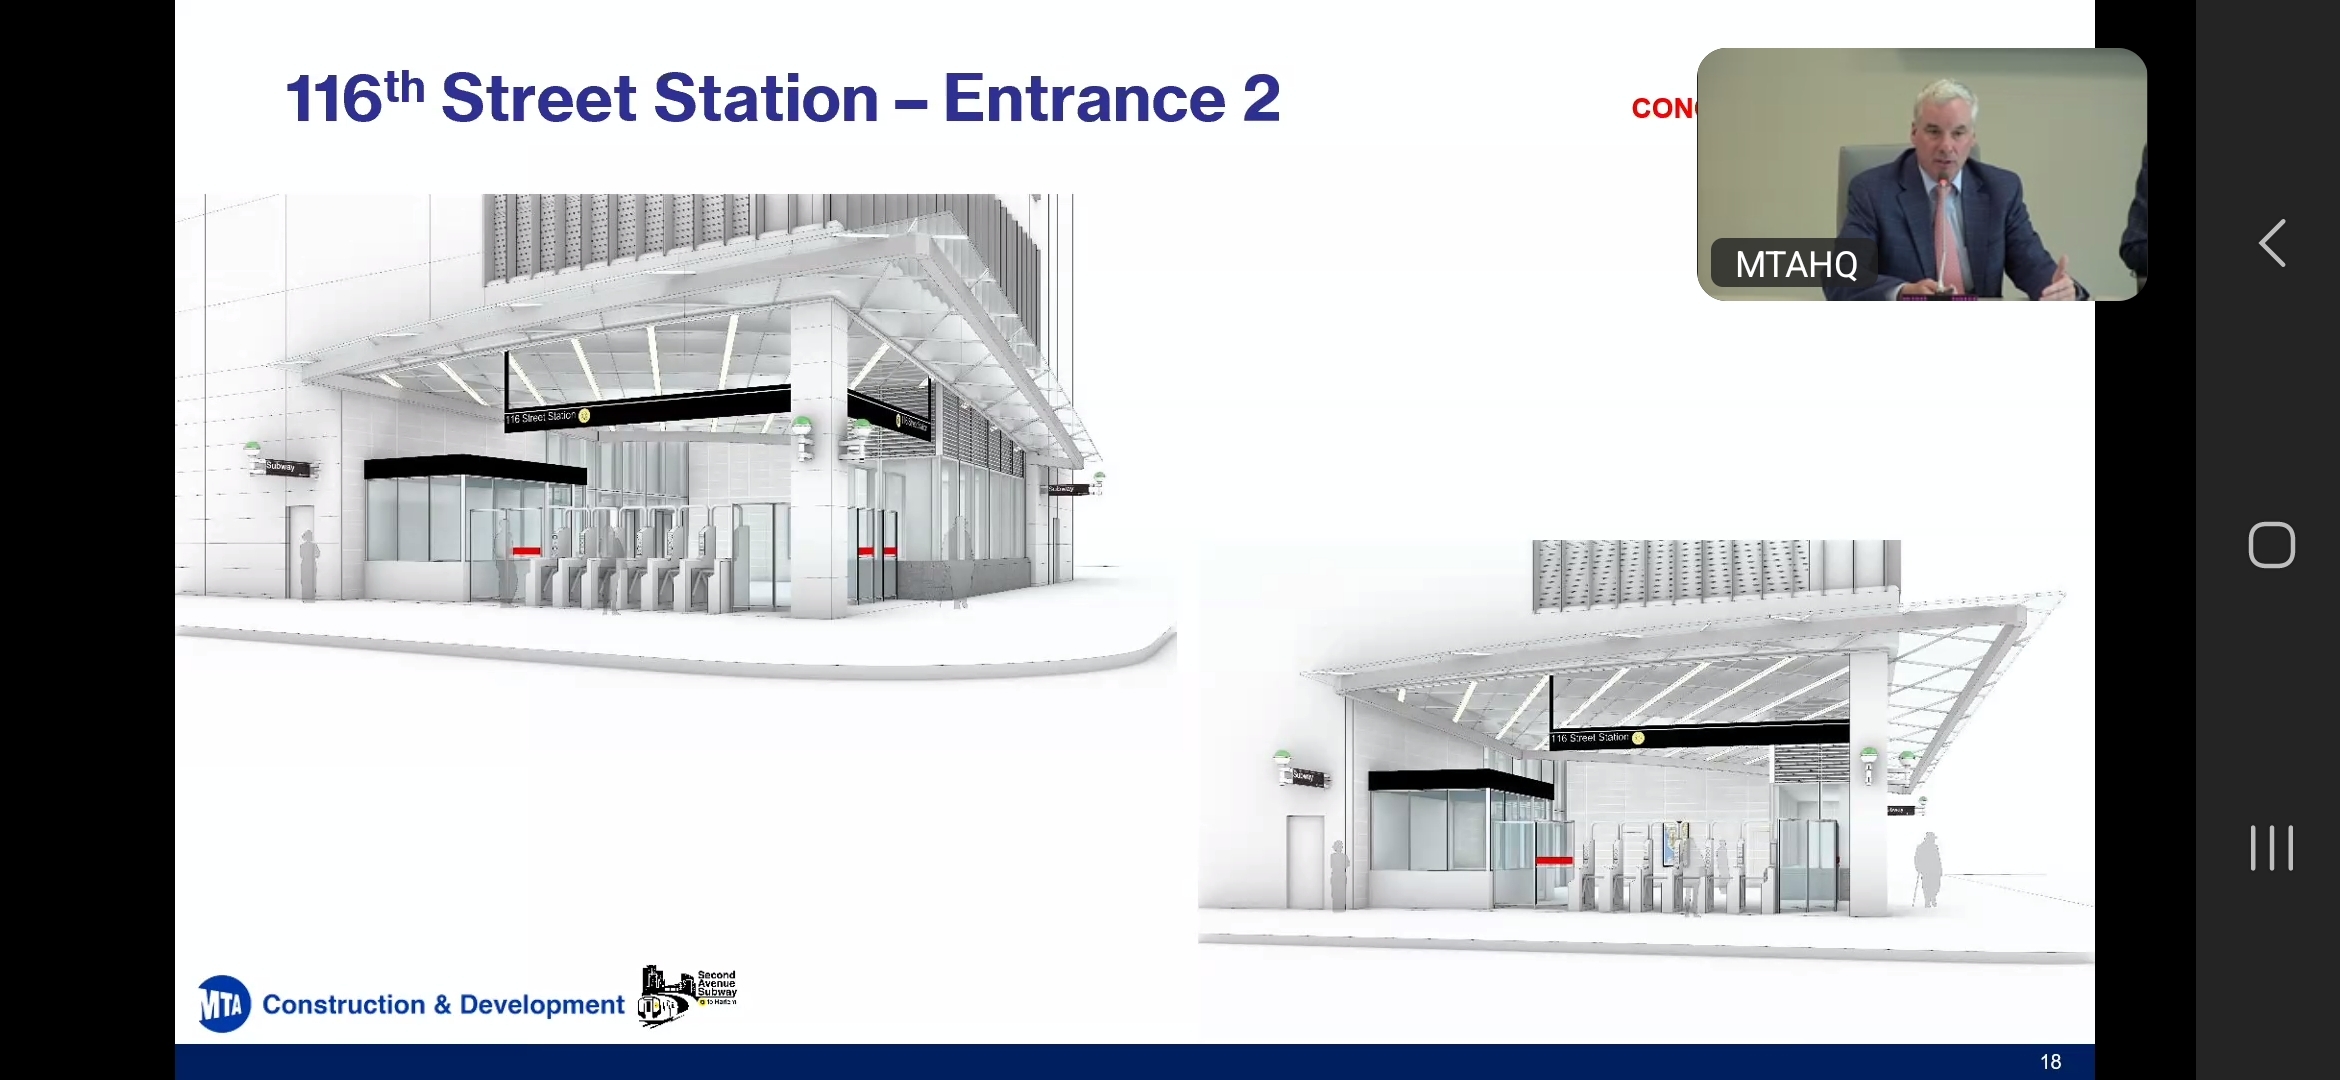
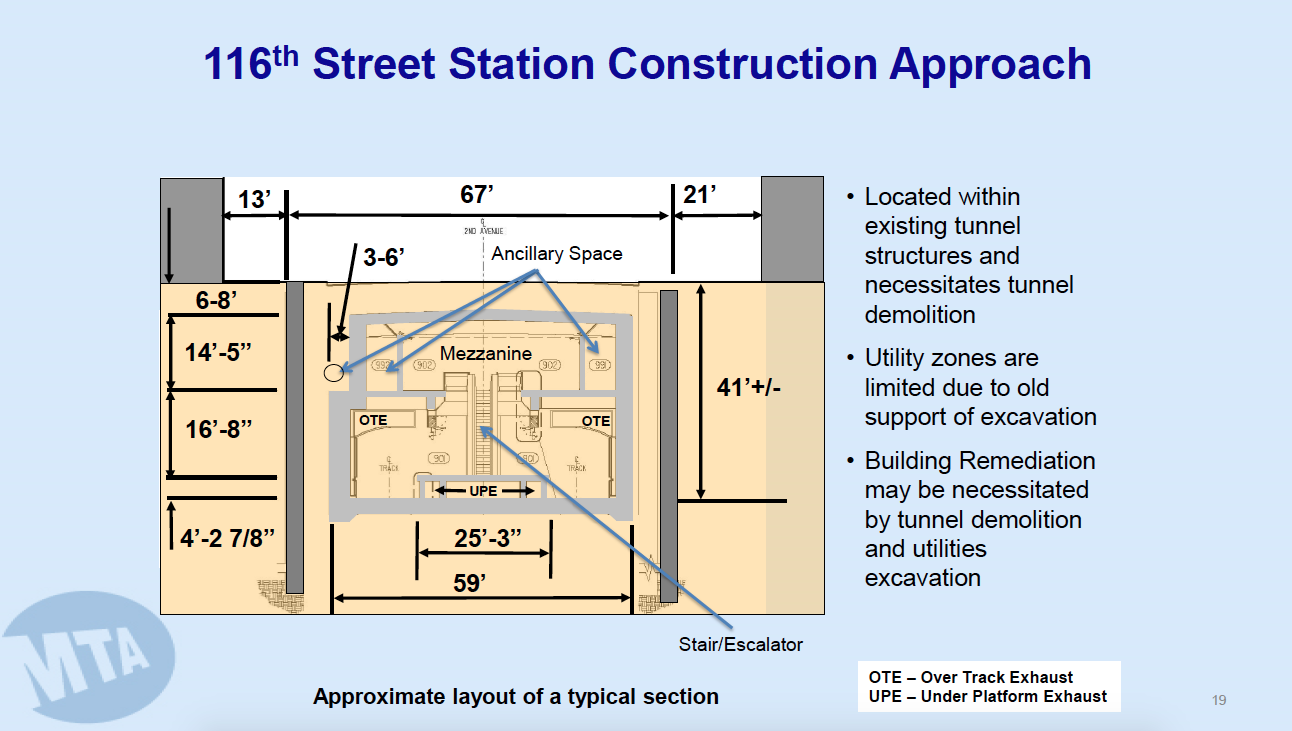
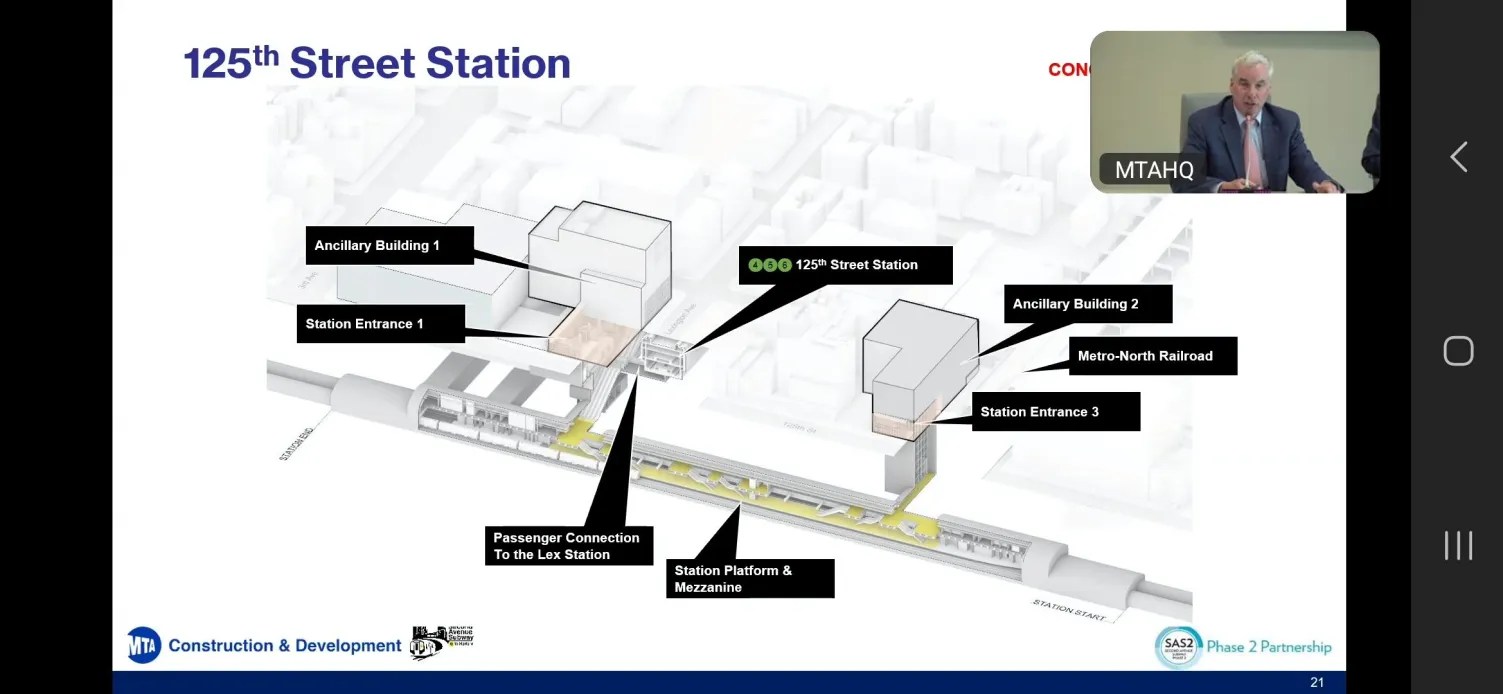
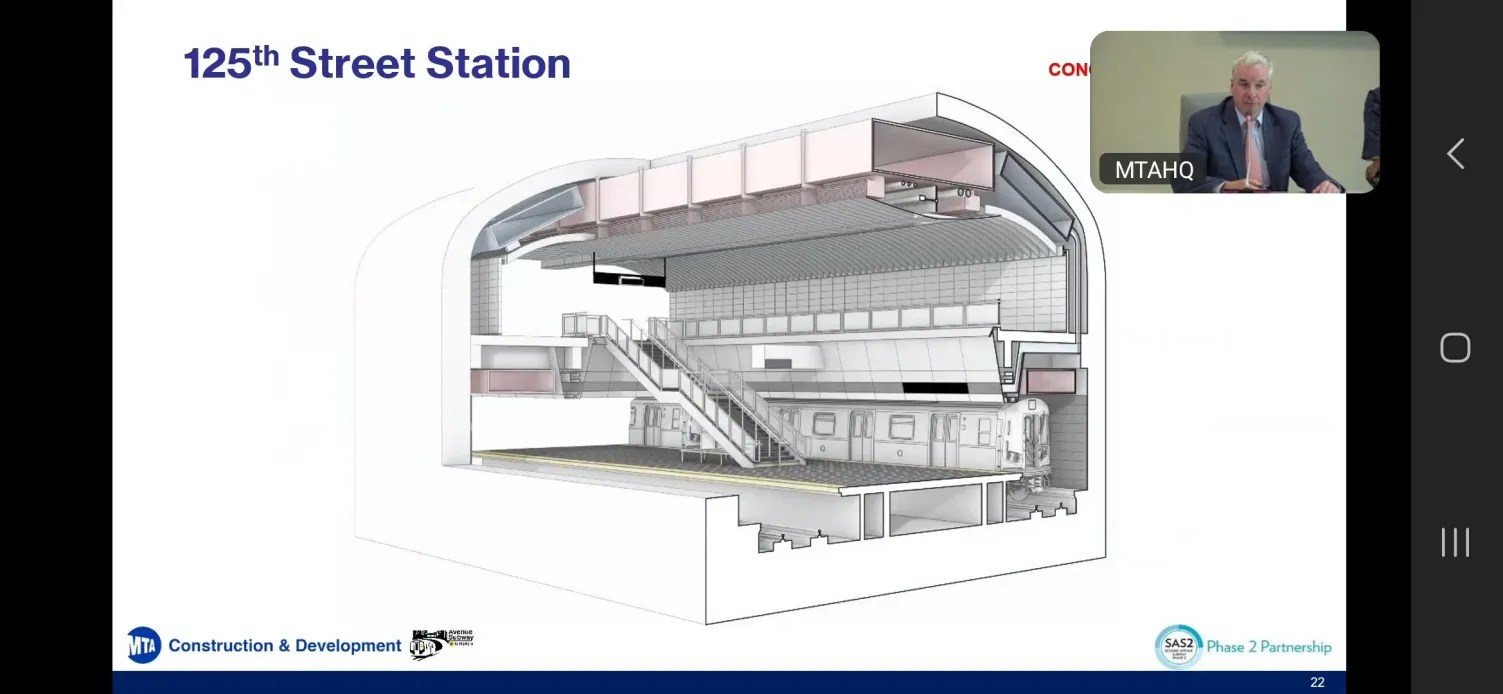
Here is a selection of slides, describing station construction. 106th Street is to be built cut-and-cover; 116th is to use preexisting construction but avoid cut-and-cover to reach them from the top and instead mine access from the bottom; 125th is to be built deep-level, with 125′ deep (38 m) platforms, underneath its namesake street between Lexington and Park Avenues.

The problems with 116th Street

Elevator-only access

Elevator-only access is usually stupid. It’s especially stupid when it’s at a shallow station; as the page 19 slide above shows, the platforms are about 11.5 meters below ground, which is an easy depth for both stair and escalator access.

Now, to be clear, there are elevator-only stations built in countries with reasonable subway construction programs. Sofia on Nya Tunnelbanan is elevator-only, because it is 100 meters below street level, due to the difficult topography of Södermalm and Central Stockholm, in which Sofia, 26 meters above sea level, is right next to Riddarfjärden, 23 meters deep. Emergency access is provided via ramps to the sea-level freeway hugging the north shore of Södermalm, used to construct the mined cavern in the first place. Likewise, the Barcelona L9 construction program, by far the most expensive in Spain and yet far cheaper than in any recent English-speaking country, has elevator-only access to the deep stations, in order to avoid any construction outside a horizontal or vertical tunnel boring machine.

The depth excuse does not exist in East Harlem. 11.5 meters is not an elevator-only access depth. It’s a stair access depth with elevators for wheelchair accessibility. Stairs are planned to be provided only for emergency access, without public usage. Under NFPA 130 the stairs are going to have to have enough capacity for full trains, much more than is going to be required in ordinary service, and they’d lead passengers to the same street as the elevators, nothing like the freeway egress of Sofia.

Below-platform mezzanines

To avoid any shallow construction, the mezzanines will be built below the platforms and not above them. As a result, access to the station means going down a level and then going back up to the platform level. In effect, the station is going to behave as a rather deep station as far as passenger access time to the platforms is concerned: the planned depth is 57′, or 17.4 meters, which means that the total vertical change from street level is around 23.5 meters, twice the actual depth of the platforms.

Dig volume

Even with the reuse of existing infrastructure, the station is planned to have too much space north and south of the platforms, as seen with the locations of the ancillary buildings.

I think that this is due to designs from the 2000s, when the plan was to build all stations with extensive back-of-the-house space on both sides of the platform. Phase 1 was built this way, as we cover in our New York case, and after we yelled at the MTA about it, it eventually shrank the footprint of the stations. 116th’s station start and end are four blocks apart, a total of about 300 meters, comparable to 86th Street; the platform is 186 m wide and the station overall has no reason to be longer than 190-200. But it’s possible the locations of the ancillary buildings were fixed from before the change, in which case the incompetence is not of the current leadership but of previous leadership.

Why?

On Bluesky, I’m seeing multiple activists I think well of assume that this is because the MTA is under pressure to either cut costs or avoid adverse community impact. Neither of these explanations makes much sense in context. 106th Street is planned to be built cut-and-cover, in the same neighborhood as 116th, with the same street width, which rules out the community opposition explanation. Cut-and-cover is cheaper than alternatives, which also rules out the cost explanation.

Rather, what’s going on is that MTA leadership does not know how a modern cut-and-cover subway station looks like. American construction prefers to avoid cut-and-cover even for stations, and over time such stations have been laden with things that American transit managers think are must-haves (like those back-of-the-house spaces) and that competent transit managers know they don’t need to build. They may want to build cut-and-cover, as at 106th, but as soon as there’s a snag, they revert to form and look for alternatives. They complain about utility relocation costs, which are clearly not blocking this method at 106th, and which did not prevent Phase 1’s 96th Street from costing about 2/3 as much as 86th and 72nd per cubic meter dug.

Under pressure to cut costs and shrink the station footprint, the MTA panicked and came up with the best solution the political appointees, that is to say Janno Lieber and Jamie Torres-Springer and their staff, and the permanent staff that they deign to listen to, could do. Unfortunately for New York, their best is not good enough. They don’t know how to build good stations – there are no longer any standardized designs for this that they trust, and the people who know how to do this speak English with an accent and don’t earn enough to command the respect of people on a senior American political appointee’s salary. So they improvise under pressure, and their instincts, both at doing things themselves and at supervising consultants, are not good. To Londoners, Andy Byford is a workhorse senior civil servant, with many like him, and the same is true in other large European cities with large subway systems. But to Americans, the such a civil servant is a unicorn to the point that people came to call him Train Daddy, because this is what he’s being compared with.

S-Bahn and RER Ridership is Urban

People in my comments and on social media are taking it for granted that investments into modernizing commuter rail predominantly benefit the suburbs. Against that, I’d like to point out how on the modern commuter rail systems I know best – the RER and the Berlin S-Bahn – ridership is predominantly urban. Whereas the typical American commuter rail use case is a suburban resident commuting to a central business district job at rush hour, the typical use case on the commuter trains here is an urban resident going to work or a social outing in or near city center. Suburban ridership is strong by American standards, benefiting from being able to piggyback on the high frequency and levels of physical investment produced by the urban ridership.

Here’s Berlin’s passenger traffic density on the U- and S-Bahn, as of 2016 (source, p. 6):

The busiest section of the S-Bahn is the Stadtbahn from Ostkreuz to Hauptbahnhof, with about 160,000 passengers per weekday through each interstation. The eastern sections of both the north and the south arms of the Ringbahn are close, with about 150,000 each, and the North-South Tunnel has 100,000. These traffic density levels extend into outer urban neighborhoods outside the ring – ridership on the Stadtbahn trunk remains high well into Lichtenberg – but by the time the trains cross city limits, ridership is rather low. All tails crossing city limits combined have 150,000 riders/day, so a little more than a quarter of the ridership density on the city center segments. Of those tails, the busiest, with a traffic density of 24,000/day, is to Potsdam, which is a suburb but is an independent job center rather than a pure commuter suburb like the rest of the towns in Brandenburg adjacent to Berlin.

I don’t have similar graphics for Paris, only a table of ridership on the SNCF-RER and Transilien by station and time of day and a separate table with annual ridership on the RATP-RER and Métro. But the results there are similar. Total boardings on the RATP-RER in 2019 was 399 million, of which 52 million originated in stations in the Grande Couronne, 186 million in the Petite Couronne, and 161 million in the city. If we double the Grande Couronne boardings, to account for the fact that just about all of those riders are going to the city or a Petite Couronne job center like La Défense, then we get just over a quarter of overall ridership, a similar result to the traffic density of Berlin. On the SNCF-RER, the share of the Grande Couronne is higher, around half.

The city stations include job centers and transfer points from mainline rail and the Métro – there aren’t 47 million people a year whose residential origin station is Gare du Nord – so it’s best to view the system as one used predominantly by Petite Couronne residents, with a handful using it as I did internally to the city and another handful commuting in from the Grand Couronne. This is technically suburban, but the Petite Couronne is best viewed as a ring of city neighborhoods that are not annexed to the city for sociopolitical reasons; the least dense of its three departments, Val-de-Marne, is denser than the densest German city, Munich.

The difference in this pattern with the United States is not hard to explain. Here and in Paris, commuter rail charges the same fares as the subway, runs every 5-10 minutes in urban neighborhoods (even less on the city center trunks), and makes stops at the rate of an express subway line. Of course urban residents use the trains, and we greatly outnumber suburbanites among people traveling to city center. It’s the United States that’s weird, with its suburb-only rail system stuck in the Mad Men era trying to stick with its market of Don Drapers and Pete Campbells.

Quick Note: RER and S-Bahn Line Length

An email correspondent asks me about whether cities should build subway or commuter rail lines, and Adirondacker in comments frequently compares the express lines in New York to the RER. So to showcase the difference, here are some lines with their lengths. The length is measured one-tailed, from a chosen central point.

LineCentral pointLength (km)
RER A to MLVLes Halles37
RER A to CergyLes Halles40.5
RER B to CDGLes Halles31
RER B to Saint-RémyLes Halles32.5
RER D to MalesherbesLes Halles79
Crossrail to ShenfieldFarringdon34
Crossrail to ReadingFarringdon62.5
Thameslink to BrightonFarringdon81
Thameslink to BedfordFarringdon82

Express subway lines in New York never go that far; the A train, the longest in the system, is 50 km two-tailed, and not much more than 30 km one-tailed to Far Rockaway. The Berlin S-Bahn is about comparable, in a metro area one quarter the size.

The Danbury Branch and Rail Modernization

I’ve been asked to talk about how rail modernization programs, like the high-speed rail plan we published at Marron this month, affect the Danbury Branch of the New Haven Line. The proposal barely talks about branch modernization beyond saying that the branches should be electrified; we didn’t have time to write precise branch timetables, which means that the timetable I’m going to post here is going to have more rounding artifacts. The good news is that modernization can be done cheaply, piggybacking on required work on the main of the New Haven Line.

Current conditions

The Danbury Branch is a 38 km single-track unelectrified line, connecting South Norwalk with Danbury making six additional intermediate stops. All stations have high platforms, but they are short, ranging between three and six cars.

Ridership is essentially unidirectional: toward Norwalk and New York in the morning, back north in the afternoon. There is little job concentration near the stations. Within 1 km of Danbury there are only 5,000 jobs per OnTheMap, rising to 10,000 if we include Danbury Hospital, which is barely outside the station’s 1 km radius (but is not easily walkable from it). Merritt 7 is in an office park, but there are only 6,000 jobs there, and nearly everyone drives. The other stations are parking lots, and Bethel is somewhat outside the town center for better parking.

The right-of-way is very curvy, much more so than the main line. Where most of the New Haven Line is built to a standard of 2° curves (radius 873 m), permitting 157 km/h with modern cant and cant deficiency, the Danbury Branch scarcely has a section straight enough with gentler curves than 3°, and much of it has such frequent 4° curves that trains cannot go faster than 100 km/h except for speedups of a few seconds at a time to recover delays.

A first pass on infrastructure and operations

It is effectively free to electrify a 38 km single-track line. The high-speed rail report estimates it at $75 million based on both European electrification costs (see report for sources) and the Southern Transcon proposal, which is $2 million/km on a busy double-track line. The junction between the branch and the main line is flat, but outbound trains can be timetabled to avoid conflict, and inbound trains have no at-grade conflict to begin with. If platform lengthening is desired, then it is a noticeable extra expense; figure $30 million for each eight-car platform, or perhaps half that on single track (but then some stops are double-track), maybe with some pro-rating for existing platforms if they can be easily reused.

The tracks should also be maintained to higher speed, which is a routine application of a track laying machine, with some weekend closures for construction followed by what should be an uninterrupted multidecade period of operations. The curves are already superelevated to a maximum of 5-6″; this is less than the 7″ maximum in US law (180 mm here), but the difference is not massive. The line has a 50 mph speed limit today for the most part, whereas it can be boosted to about 100-110 km/h depending on section, a smaller difference than taking the main line’s 70 mph and turning it into 150-160 km/h.

With a blanket speed limit of 110 km/h – in truth some sections need to dip down to 100 or even less whereas the Bethel-Danbury and Merritt 7-Wilton interstations can be done mostly at 130 – the trip time between South Norwalk and Danbury is, inclusive of 7% pad, 28.75 minutes. The Northeast Corridor report timetables have express New Haven Line commuter trains arriving South Norwalk southbound at :15.25 every 20 minutes and departing northbound at :14.75, so they’d be departing Danbury at :46.5 and arriving :43.5. Meets would occur at the :20, :30, and :40 points.

The :30 point, important as it is a meet even if service is reduced to every 30 minutes, is just south of Branchville, likely too far to use the existing meet at the station. Thus, at first pass, some additional double-tracking is needed, a total of 6 km if it covers the entire Cannondale-Branchville interstation, which would cost around $50 million at MBTA Franklin Line costs. MBTA Franklin Line costs are likely an underestimate, since the terrain on the Cannondale-Branchville interstation is hillier and some additional earthworks would be required on part of the section. A high-end estimate should be the cost of a high-speed rail line without elevated or tunneled segments, around $30 million/km or even less (cut-and-fill isn’t needed as much when the line curves with the topography), say $150 million.

The :20 point southbound is at or just south of Bethel. While this is in a built-up area, the right-of-way looks wide enough for two tracks and the topography is easier; if the station is the meet, then the cost is effectively zero, bundled into a platform lengthening project. Potentially, this could even be further bundled with moving the station slightly south to be closer to the town center. The :40 point southbound is at Merritt 7, which has room for a second track but not necessarily for a platform at it, and could instead get a second track on the opposite side of the platform if there’s enough of a rebuild to turn it into an island with additional vertical circulation; the cost of the second track itself would be a rounding error but the cost of station reconstruction would not be and would likely be in the mid-tens of millions.

How this fits into the broader system

The timetable in the report already assumes that New Haven Line service comprises 6 peak trains per hour (tph) that use the branches. The default assumption, reproduced in the service network graphic, is that New Canaan and Danbury get 3 tph each, and New Canaan gets a grade-separated junction but Danbury does not. Those trains all go to Grand Central with no through-running: only the local trains on the New Haven Line get to run through, since local trains are the highest priority for through-running. If a tunnel connecting the Gateway tunnel with Grand Central is opened, as in some long-term plans (here’s ETA’s, which isn’t very different from past blog posts’), then they can run through to it.

The establishment of this service is not going to, by itself, change the characteristic of ridership on the line. Electrification, better timetabling, and better rolling stock (in this order) can reduce the trip time from an hour today to 29 minutes, and the trip time to Grand Central from about 2:25 to 1:09, but the main effect would be to greatly improve the connectivity of existing users, who’d be driving to the parking lot stations more often, perhaps working from the office more and from home less, or taking the train to social events in the city. Some would opt to use the train to get to work at Stamford, as a secondary market. Over time, I expect that people would buy in the area to commute to work in New York (or at Stamford), but housing permit rates in Fairfield County are low and only limited TOD is likely. It would take concerted commercial TOD at the stations to produce reverse-peak ridership, likely starting with expanding the Merritt 7 office park and making it a bit less auto-oriented.

If the ridership isn’t there, then a train every 20 minutes is not warranted and only a train every 30 minutes should be provided. This reduces the double-track infrastructure requirement but only marginally, as the meets that are no longer needed are the easy ones and the one that still is is the hard one to build, south of Branchville. In effect, something like 80% of the cost provides two thirds of the capacity; this is common to rail projects, in that small cuts in an already optimized budget lead to much larger cuts in benefits, the opposite of what one hopes to achieve when optimizing cuts.

The Northeast Corridor Report is Out

Here is the link. If people have questions, please post them in comments and I’ll address; see also Bluesky thread (and Mastodon but there are no questions there yet).

Especial thanks go to everyone who helped with it – most of all Devin Wilkins for the tools, analysis, and coding work that produced the timetables, which, as the scheduling section says, are the final product as perceived by the passenger. Other than Devin, the other members of the TCP/TLU program at Marron gave invaluable feedback, and Elif has done extensive work with both typesetting and managing the still under-construction graphical narrative we’re about to do (expected delivery: mid-June). Members of ETA have looked over as well, and Madison and Khyber nitpicked the overhead electrification section in infrastructure investment until it was good. And finally, Cid was always helpful, whether with personal support, or with looking over the overview as a layperson.