I am writing this post riding trains between Brussels and Berlin. My connection in Cologne was canceled as the connecting train was moved to depart earlier than my first train’s arrival time, and somehow, it is faster to stay on the train until Frankfurt and connect there, the trains between Cologne and Berlin are so disturbed this summer. Cologne-Berlin, normally a direct hourly connection in 4-4.5 hours, is slowed to 5.5 hours every two hours this summer. It got me thinking about something Jon Worth said last month about the importance of public transport being there, including at night, because it reminded me of how there are always tradeoffs. Train service cannot literally run 24/7 without changes; maintenance windows are required. So it’s a question of tradeoffs – when service must run less reliably, or not at all. Deutsche Bahn has unfortunately chosen a grossly wrong side of the tradeoff, leading to summertime shutdowns and slowdowns that its French and Japanese peers simply do not have. Those shutdowns, in turn, are, these days, leading to catastrophic levels of popular mistrust in DB.
The tradeoffs
I wrote six weeks ago about the problems of summer maintenance in Germany. But, more generally, there is a tradeoff between span of service on a railway and how consistently service can be delivered. A railway that runs overnight will not have regular maintenance windows, and therefore have to pick some low-traffic period for a special disturbance. On the New York City Subway, this is the weekend: New York City Transit exploits its four-track mainlines and high levels of redundancy in most of the city to shut down individual sections of track on weekends and tell passengers to use alternatives. In Europe, it’s more common for this to be the summer period, when local travel is lower as people go on vacation; unfortunately, in Germany, this extends to intercity rail, during the high season of travel.
Jon says that, “That 5am train with a dozen building workers on it, or the last train home in the evening matter for the trust and reliability of the system, even if those individual trains make heavy losses and are largely empty.” But the point is that knowing that I can book a train in July and have it run as expected without being rerouted onto the slow line is, like the 5 am train, a matter of trust and reliability too. It’s just a matter of which matter of reliability is easier to compromise on.
Then there is a tradeoff of all of this against maintenance efficiency. It is more efficient from the perspective of minimum total gross hours of shutdown to have a long continuous period of shutdown, such as the four-month period planned for the Riedbahn. Nighttime shutdowns require an hour of preparation and disassembly at each end, so that a five-hour nighttime shutdown only yields three hours of maintenance work. Some systems don’t make that work even with regular nighttime shutdowns, such as the London Underground or American systems that are not New York; notably, the Berlin U-Bahn manages to avoid this even with overnight service on weekends.
The situation in Germany
DB’s response to the tradeoffs outlined above is to attempt to run all day, including occasionally at night. There are night trains between Hamburg and southern Germany on the Frankfurt-Cologne high-speed line, so even this line, without any nighttime freight (the grades are far too steep), does not have the regular maintenance windows that LGVs and Shinkansen lines have. As a result, last month, the line was shut for maintenance, and trains were diverted to the old line, taking an hour longer. Right now, the same diversions apply to Cologne-Berlin trains, slowing them by about an hour.
These are not peripheral connections. Frankfurt-Cologne is not quite the busiest intercity line in Germany – that would be the Riedbahn – but it’s a fairly close second, with the same planned traffic level in the Deutschlandtakt of six trains per hour in each direction. It’s the primary connection between the Rhine-Ruhr and not just Frankfurt but also all of southern Germany. Then, Berlin-Cologne connects the two largest metro areas in Germany; the Rhine-Ruhr is close in population to Ile-de-France, while Berlin and Brandenburg have more people than Rhône-Alpes or PACA, which has implications for how much traffic this connection would have if it were fast and reliable, which it is neither (government officials fly between Berlin and Bonn instead of relying on DB).
Is this unavoidable?
No. France has none of these daytime shutdowns on its main lines. Neither does Japan.
German rail advocates sneer at France and ignore Japan, finding all manners of reasons to avoid learning from countries that, on this point, are Germany’s superiors. A common line from within Germany is that its secondary lines are in better shape than France’s, so there is nothing to learn from France. But then, the reason there are routine hour-long delays (or longer) in the summer on the main lines is not that DB runs better service to a city like Siegen or Münster or Jena than SNCF does to their French peers.
The path forward has to be, at the technical level, to institute regular nighttime maintenance windows, and stop trying to make night trains happen. At infrastructure level, it must be to avoid building dual-use infrastructure, and build passenger-dedicated high-speed lines; if freight capacity is needed that the old lines with just slow regional trains can’t provide, then build a separate freight line, based on the needs of freight, at costs that are going to be lower than the long tunnels required for dual-use lines.
But the most important change has to be at the level of governance and culture. Germany believes itself to be at the top of the world. To borrow a joke about Japanese technological stagnation, there is an element here that visiting a German infrastructure system in 2005 had a futuristic vibe like visiting the year 2015, and visiting it today is still like visiting the year 2015. There’s a slew of problems in Germany for which the solution really is “be less German and more French,” and this is one of them, no matter what people who think all French people are unemployed rioters think.
The Regional Plan Association ran an event 2.5 days ago about New York commuter rail improvements and Penn Station, defending the $16.7 billion Penn Station Expansion proposal as necessary for capacity. The presentation is available online, mirrored here, and I recommend people look at the slides to understand the depth of the ignorance and incuriosity of area decisionmakers about best practices displayed in the first half of the presentation; the second half, by Foster Nichols, is more debatable. I hope to make this a series of two or perhaps three posts, focusing on different aspects of why this is so bad. But for now, I’d like to just talk about what the presentation gets wrong about the history of commuter rail improvement in Europe, on pages 17-19. Suffice is to say, the extent of error that can be crammed into a single slide with little text astounded me. With such incuriosity about best practices, it’s not surprising that regional power brokers are trying to will the unnecessary Penn Expansion project into being, never mind that it has no transportation benefits despite its extravagant cost.
The rub is that the presentation on pp. 18-19 says that commuter rail through-running is really hard. Here is page 18:
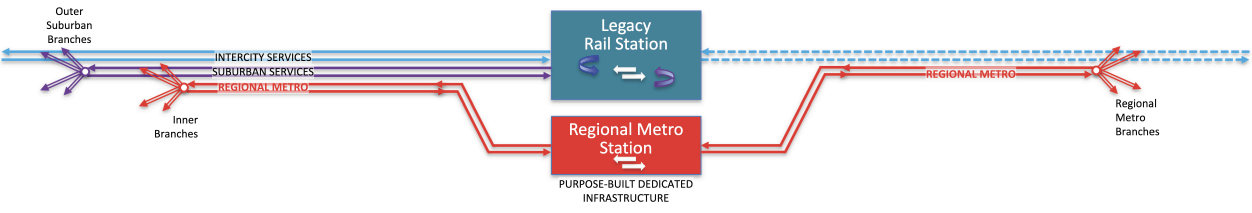
Regional metro systems comprise a targeted portion of regional rail networks centers of population, employment, business or major attractions like airports that support frequent, fast service
Regional metro systems typically do not operate within original historic train sheds
They operate in new tunnels, shoulder stations adjacent to existing major stations, and separate, simpler interlockings that facilitate frequent service
Then, page 19 shows maps of the RER, Munich S-Bahn, Elizabeth line, and Thameslink, quoting the length it took to build them as, respectively, “30 years,” “46 years,” “2001-2022,” and “1970s-80s, 2009-2020.” The conclusion is “Systems take decades to implement, usually in stages.”
And all of this is a pack of lies.
In fact, commuter rail through-running systems routinely reuse legacy stations, even fairly major ones: both Berlin and Munich Ostbahnhof were incorporated into their respective S-Bahns, and several Parisian train stations were reused for the RER, for example Gare d’Invalides or Luxembourg, with varying levels of modification. New stations are built from scratch underneath surface stub-end terminals like Gare du Nord and Gare de Lyon as depicted in the presentation, but if the station already has through-tracks then it can be used as-is, like Munich Ostbahnhof, and in some cases even stub-end stations are at such grade that their infrastructure can be used. If Boston chooses to build the North-South Rail Link, then, since North and South Stations are both large at-grade terminals, the link will have to include new underground platforms at both stations. But Penn Station is an existing through-station below grade; Amtrak already runs through, and so could commuter rail, without adding platforms.
And as for the lines about the systems having taken 30 and 46 years to build, this is so painfully wrong that it is perhaps best to go over their actual histories. The actual length of time it took depends on one’s definitions, especially for Paris, but the maximum one can support for Paris is 16 years; for Munich, it is seven years.
The history of the RER
The RER and Transilien are, together, the largest commuter rail network in Europe by ridership, with around 1.1 billion annual riders. Globally, only four systems surpass them: Tokyo, Seoul, Osaka, Mumbai; the first two are integrated metro-commuter rail networks to the point that it’s hard to distinguish which mode they are, Osaka is several competing companies none with the ridership of the combined Paris system, Mumbai runs with practically no metro accompanying it. The RER’s history, as I will shortly explain, also makes it a good prototype for modern commuter rail operations, of the same type that is called S-Bahn in Germany. New Yorkers would do especially well to understand this history, which has some parallels to the administrative situation in New York today.
The topline of this is that since the 1960s, Paris has connected its legacy commuter and intercity rail terminals with new through-tunnels, called the RER, or Réseau Express Régional. There are five lines, dubbed A through E. Métro operator RATP runs most of the RER A, and the RER B south of Gare du Nord; national railway SNCF runs the rest plus commuter train networks stub-ending at most of the historic terminals, called Transilien, signed with letters from H to R.
But the history of the RER goes back further – and none of it can be said to have taken 30 years. In short: the Métro was built, starting in the 1890s and opening in 1900, to be totally incompatible with mainline rail – for one, where mainline trains in France run on the left, the Métro runs on the right. This was on purpose: city residents in the Belle Epoque already looked down on the suburbs and worried that if the Métro were compatible with the mainlines, then it might be used to connect to the suburbs and bring suburbanites to their city. The stop spacing, separately, was very tight, even tighter than on New York local subway trains, let alone the London Underground. By the time the system reached the inner suburbs in the 1930s, it was clear that it could not by itself connect the growing suburbs to the city, it would be too slow.
Various proposals for investment in commuter rail go back to the 1920s, but little happened, with one exception: the Ligne de Sceaux, shown as the blue line on the first image entering the city from the south, was acquired by the forerunner of RATP, CMP, in 1938, as the rest of the French mainline network was nationalized. CMP was attracted to the line because of its atypically good penetration into the center of Paris – the other lines terminated farther from the historic center, for example at Gare du Nord or Gare de Lyon. The line was also not useful for SNCF as it was being formed, due to its isolation from the rest of the network. The line was electrified as it was acquired, and run as a regional line, still isolated from all others.
More serious plans for commuter rail through-running began in the 1950s, as postwar growth and suburbanization put more pressure on the system. Gare Saint-Lazare was especially under pressure, first because of growth in the western suburbs, and second because the Paris CBD had been creeping west, making its location more attractive for commuters. In 1956, Marc Langevin proposed an eight-line network; in 1959, RATP and SNCF began collaborating, planning east-west and north-south lines. As late as 1966, there were still plans for two separate north-south lines (for example, see here, p. 244), of which only one has been built and the other is no longer seriously proposed.
In the 1960s, the plans got more serious. Construction began in 1961, starting with the east-west axis, still with an uncertain alignment. Eventually, RATP would take over the Ligne de Vincennes (the eastern red line in the before map) in 1969 and the Ligne de Saint-Germain-en-Laye (the southernmost of the western red lines) in 1972, and connect them with a new tunnel, opening in 1977. Over the 1960s, the plans still had to be refined: it was only in 1963 that it was confirmed that the Ligne de Vincennes’ Paris terminal, Bastille, was too small to be used for this system, and therefore the new tunnels would have to begin farther east, to Nation, which opened in 1969 and is thus already depicted on the before map.
The Ligne de Vincennes was simultaneously modernized, starting in 1966. The entire systems had to be redone, including new platforms and electrification. Nation had to be built underground, starting 1965, complete in 1967 and opening with the rest of the line in 1969.
On the west, the cornerstone was laid in 1971, and construction began shortly later, starting with La Défense. Shuttle trains run by RATP opened between La Défense and Etoile in 1970, and extended to Auber in 1971. In 1972 the line was connected to the Ligne de Saint-Germain-en-Laye.
At the same time, deepening SNCF-RATP integration meant that the planned alignment within the city would need to change to connect to SNCF’s train stations better. Originally, the east-west axis was supposed to run as an express version of Métro Line 1, stopping at Etoile, Concorde, and Châtelet; this was modified to have it swerve north, replacing Concorde with Auber, which is connected to Saint-Lazare. East of Châtelet-Les Halles, the alignment swerves south to connect to Gare de Lyon instead of Bastille.
In 1977, the Nation-Auber section opened, finally offering through-service; the appellation RER A dates only from then. Simultaneously, the north-south axis that was actually built half-opened, connecting the Ligne de Sceaux onward to Les Halles, with cross-platform transfers from the south to the west. On the same date that the central section opened, RATP also inaugurated an entirely greenfield branch of the RER A to the east, initially to Noisy-le-Grand, eventually (by 1992) to the new Marne-la-Vallée development, where Eurodisney was built. Contemporary media reports called Les Halles the biggest metro station in the world, and President Valéry Giscard d’Estaing (center-right) spoke of public transport for everyone, not just the poor. The cost of this scheme was enormous: it cost 5 billion francs (update 8-9: see Alain Dumas’s comment below – it’s 5 billion FRF for the entire RER A, not just the Nation-Auber section), which would make it about $1 billion/km $350 million in 2023 prices, inflation since then more or less canceling out the franc:USD exchange rate. The RER B cost 400 million francs between Luxembourg and Les Halles, a distance of 2.3 km, and 1.6 billion to get to Gare du Nord and connect to the SNCF network to the north (opened 1981), a distance of 3.5 km.
The RER C then opened in 1979, as a second east-west line, on the Left Bank. Missing all of the main centers within Paris, it has always had far lower ridership than the RER A; it was also much easier and cheaper to build – all that was required was a short tunnel connecting Invalides on the west, previously a subsidiary commuter rail-only stop on the same lines to Montparnasse and Saint-Lazare, and Gare d’Orsay on the east, a commuter rail-only extension of the line to Austerlitz. This was built quickly – the decision was made in 1973, and the line opened within six years. This required a total rebuild of Gare d’Orsay with new underground platforms; Invalides required reconstruction as well, but could use the same station and track structures.
Subsequently, the system has added new lines and branches – the RER D opened from the north to new Gare de Nord platforms in 1982, was extended in 1987 along the same tracks used by the RER B to Les Halles but serving dedicated platforms at both stations, and was extended along a new tunnel to and beyond Gare de Lyon in 1995; the RER A acquired new western branches in 1988 to be operated by SNCF, requiring dual-voltage trains since those branches use 25 kV 50 Hz AC and not 1.5 kV DC like the RATP lines; the RER C acquired a new branch also in 1988 taking over part of the Petite Ceinture; the RER E was opened as a stub-end extension of lines from the Gare de l’Est network to a new underground station at Saint-Lazare in 1999, and was finally extended to the west with some through-service this year.
So in a sense, it’s taken 63 years to build the RER, starting 1961, and the work is not yet done. But the core through-running service opened in 1977, within 16 years, with some decisions made midway through the works. The total required work greatly exceeded anything New York needs to do – just what opened through 1977 includes 16 km of double-track central tunnel on the RER A, 3 km on the new branch to Noisy plus 6 km of new above-ground line, 2 km of tunnel on the RER B, and around one km of tunnel on the RER C, inaugurating eight new underground stations, all on the RER A. The RER A’s ridership reached 1.4 million per workday by 2019, and the RER B’s reached 983,000 – and a great majority of the work on both was done by 1981.
The history of the Munich S-Bahn
The Munich S-Bahn is not the oldest or busiest S-Bahn system in Germany; Berlin and Hamburg both have prewar systems, and Berlin’s ridership is considerably higher than Munich’s. Nonetheless, precisely because Berlin and Hamburg built so much of their infrastructure in the steam era, some lessons do not port well to cities today. In contrast, Munich’s entire system has been built after the war – in fact, the construction of the S-Bahn took place over just seven years, from the decision of 1965 to opening in 1972, timed with the Olympics.
As in Paris and many other cities, the history of proposals for rapid urban mainline rail in Munich stretches back decades before the decision was made. The first proposal was made in 1928, and there was more serious planning in Nazi Germany, as the Nazi Party had been founded in Munich and was interested in investing in the city due to that history; by 1941, there were plans for a three-line system, comprising a north-south, an east-west, and a circular tunnel. But little was built, and during the war, the resources of Germany toward rail were prioritized in a different direction.
After the war, Munich grew rapidly. It was not much of an industrial city in the early 20th century; early industrialization in Germany was mostly in the Ruhr and Saxony, while the professional services economy was centered on Berlin, whose metropolitan area in the 1930s was of comparable size to that of Paris. After the war, things changed, at least in the West: the Ruhr’s coal and steel economy stagnated, while southern Germany grew around new manufacturing of cars and chemicals; decentralization dispersed the professional services economy, and while most went to Frankfurt and Hamburg, a share went to Munich (for example, Siemens’ headquarters moved there from Berlin right after the war). The city’s wartime peak population was 835,000; it would surpass 1 million in 1957 and is 1.5 million today. The region, Oberbayern, comprising essentially the metro areas of Munich and Ingolstadt, would grow from 2 million at the beginning of the war to 2.8 million by 1960 and 4.8 million today, and is the richest region in the EU at this scale, with per capita income from work approaching that of New York.
This small size of Munich in 1900 means that it never had as extensive a rail network as Paris or Berlin. It had just two major urban stations: Hauptbahnhof, a terminal with a station throat leading to points west, and Ostbahnhof, a through-station with tracks leading east, south, and the west, the western tracks looping back south of city center to reach Hauptbahnhof. To this day, area railfans would like this loop to be incorporated into a regional S-Bahn system avoiding city center – but Munich is still a rather monocentric city. There was no U-Bahn, unlike in Berlin or Hamburg.
By 1961, the number of suburban commuters into Munich reached 114,000. The undersize rail network relative to the city’s current importance and the rapid growth in wealth meant that car ownership was high, leading to traffic congestion. The trams were slowed down by traffic, to the point of not running faster than walking in city center.
To resolve these problems, both an U-Bahn network and an S-Bahn network were planned. Early planning began in the 1950s, with the federal government taking over the wartime plans in 1956, but as in Paris, the extent of the system to be planned was up in the air: both an east-west axis and a north-south line were desired, and only in 1963 was the decision finalized that the north-south axis should be a municipal U-Bahn tunnel and not an S-Bahn. The study period began in 1961, with the plan approved in 1965 for the construction of a single east-west S-Bahn tunnel between Hauptbahnhof and Ostbahnhof, and a separate U-Bahn system with three branched trunk lines.
Construction was done on a tight timeline, since Munich was awarded the 1972 Olympics in 1966, and delays were not considered acceptable; the first U-Bahn line, U3/U6 running north-south, opened 1971, and the S-Bahn opened 1972, in what is described as a “record time.”
During the seven years of construction, other projects had to be done in parallel. Commuter rail lines had to be extensively upgraded: the project included 143 km of electrification, and 115 stations outfitted with new high platforms at a level of 760 mm mostly 210 meters long. Simultaneously, most of what has become the standard for good timetabling was invented, out of necessity on a network that had to share tracks and systems with other trains on its outer margin, most importantly the clockface schedule – the system was designed around a 20-minute Takt on each branch from the outset, with outer tails running every 40 minutes.
The central tunnel itself, the Stammstrecke, comprises six stations from Hauptbahnhof to Ostbahnhof of which all except Ostbahnhof are underground, and three have Spanish platforms. Ostbahnhof itself is used as a pinch point for some trains, reversing direction depending on branch. The Stammstrecke in total was built for 900 million DM, or $2.8 billion in 2023 PPPs; the overall line included 4.1 km of tunnel and about 7.3 more km of above-ground connections. (Update 8-9: cost fixed – I originally stated it to be 900 DM.)
There has been further investment adding new branches and upgrading the system. The new signal system LZB was installed in the central section experimentally when it opened in 1972, but it was not used on all trains, and was taken out of service in 1983, only returning in 2004 when its capacity was needed, boosting throughput from 24 trains per hour to 30. However, as in Paris, the core of the system’s high ridership, now about 900,000 per workday, comes from infrastructure that was there from the start, and thus it’s most correct to say that the system took not 46 years to build but seven.
Some lessons for New York
By the standards of Paris and Munich, New York has practically everything it needs to run through-service. The electrification systems on its three commuter railroads are not compatible, but multivoltage trains not only are routine, but also already present in New York; the current configurations all have one problem or another, but fundamentally, ordering multivoltage trains is a solved problem. Only a handful of outer branches need to be electrified, and all can be deferred, running with forced transfers until they are wired as is current practice on the Raritan Valley Line and for the most part also the outer Port Jefferson Branch. The LIRR and Metro-North are entirely high-platform and New Jersey Transit’s Manhattan-facing lines only have 68 low-platform stations of which 26 are already funded for high platform conversions.
By far the biggest missing element for New York by cost is the Gateway Program and its Hudson Tunnel Project, which is budgeted at $16 billion and is funded and beginning construction, with the New Jersey land tunnel contract just awarded. Even before the new tunnel opens, it can run some through-service after Penn Station Access opens from the Hell Gate Line, pairing it with some New Jersey Northeast Corridor trains.
On top of that, some surface improvements are prudent, such as some grade separations of rail junctions, the most expensive costing on the order of hundreds of millions (Hunter is $300 million on the budget, maybe $400 million by now); much of that is already getting funds from the Bipartisan Infrastructure Law or likely to get them in the near future, since the infrastructure is also used by Northeast Corridor intercity trains.
But it does not need to do anything that area railroaders have convinced themselves they need, especially not new tracks at Penn Station. Nor are decades of prep work needed – rapid installation of high platforms is completely feasible, as was done not just in Munich in the 1960s and 70s but also in suburban New York in the same period and in the 1980s and 90s, converting the LIRR and Metro-North to full high-platform operations and doing the same on the Northeast Corridor in New Jersey.
All that is needed is a modicum of curiosity about the world, curiosity that is not seen in the presentation with its whoppers about the timelines of the RER and Munich S-Bahn, or its belief that new underground tracks are always required as if Penn Station is the same as the surface Gare du Nord. I find myself having to explain to journalists who interview me that all of this can be done, but the people in charge of the railroads around New York cannot do it.
When I was visiting New York in June-July, I was stricken by how hard it was to figure out when the next train would come. Every subway station is equipped with countdown clocks, the A Division (numbered lines) and L trains having older installations than the rest of the B Division (lettered lines). However, the B Division stations that I used did not have many countdown clocks, and I found myself having to walk long distances along hot platforms to figure out which train to take. I counted the number of clocks at a few stations, and asked ETA members to do the same; now back in Berlin, I’ve done some counts here as well, confirming that it’s not just me – New York’s B Division platforms have fewer and harder to find countdown clocks than the standard on the Berlin U- and S-Bahn platforms, even though New York’s more complex subway network requires if anything more clocks as passengers have multiple options. Based on what I’ve seen in Berlin, I recommend that New York install a minimum of four overhead clocks per B Division platform, with the screen going in both directions.
The situation in Berlin
The U-Bahn platforms seem standardized to me. The traditional norm was that stations were built cut-and-cover, right underneath a major street, with an entrance at each end of the central island platform. Nowadays almost all stations have elevators and there are plans for retrofitting the rest, which BVG estimates will be completed in 2028, the date having been pushed later over the years I’ve lived in the city. The elevators always connect two levels, with opposite side doors for the two levels, so that wheelchair users don’t have to turn.
There are, at the stations I use, two overhead countdown clocks for each platform face. Nearly all platforms are islands, and each direction has separate countdown clocks. The clocks display the times on both sides, and are typically located at the quarter points of the station, so that passengers are never more than a quarter of the platform length from a clock, with good sight lines; the platforms are 100-110 meters long.
The S-Bahn is less standardized. A full-length eight-car train is 150 meters is long. The countdown clocks are double-sided and overhead as on the U-Bahn, and each platform face has a separate clock even when the tracks are in the same direction (as at Ostbahnhof), but the number is inconsistent; there are stations with just one, but Friedrichstraße on the North-South Tunnel has three.
The situation in New York
The A Division has overhead countdown clocks, connected to the train control system (automated train supervision, or ATS), installed in the early 2010s; the L has countdown clocks of the same provenance. The number of clocks per station is not fixed, but ranges between two and four per track. The B Division’s train control system let the control center know where trains were but not which train was which – that is, which train on the same track is an A, which is a D, and so on – and therefore the same system was not installed at the time. Years later, a different system was installed, with nicer graphics and a different connection to the control center, which is sometimes less accurate.
This newer system on the B Division has a combination of overhead clocks, often single- rather than double-sided, and floor-mounted clocks facing sideways, toward the tracks rather than toward the front and back of the platforms. The floor-mounted clocks are difficult to read unless I’m standing right there. The platforms are obstructed so it’s hard to tell from a distance where the clock is. Worse, many floor-mounted installations look identical from a distance to the clocks, but instead display advertisements or service changes but no information about the next train.
What’s more, there just aren’t a lot of these clocks. At 2nd Avenue on the F, heading downtown toward Marron, I counted a single clock, but six boards displaying system maps or ads. ETA’s Alex Sramek checked several stations in Lower Manhattan, including Chambers on the A/C/E and on the J/Z, Fulton Street, Cortlandt Street on the R/W, and Broad Street, and found one to three clocks, always a mix of overhead and floor-mounted – and the floor-mounted clocks sometimes would only show the next train and not the subsequent ones, even for platforms serving multiple routes.
There should be more clocks in New York than in Berlin. The platforms are much longer – the A Division platforms are 155 meters, the L and J/Z platforms are 145 meters, the other B Division platforms are 185 meters. The extensive branching means that even while waiting on the platform, regardless of what information is displayed outside the station, it is important to know when each service using the station will come, to plan out which line to take. I made mistakes on trips from Brooklyn to Queens just because I wasn’t sure what to do when transferring at West 4th, where, having just missed the E, I needed to make a decision on whether to wait for a delayed F or try to make the B/D and transfer to the E at 53rd, opted for the latter, and missed the E at 53rd.
If a Berlin U-Bahn station has two double-sided clocks, and a major S-Bahn station has three, then New York should have four per B Division platform. These should be overhead and double-sided – the floor-mounted screens are difficult to see from a distance along the direction relevant to most passengers, and easily confused with ads, ensuring that their utility is marginal.
I’ve written a lot about urban rail construction costs per kilometer, but from time to time, my colleagues and I have been asked about what happens if we compare costs, not per kilometer, but per rider. There’s an intuition among people in transportation advocacy (including anti-transit activists who prefer cars) that the construction costs of urban rail lines per rider are a meaningful measure of cost-effectiveness. This intuition is true, and yet, it must be interpreted delicately.
First, modes of transit with different operating cost structures should tolerate different levels of capital costs; in particular, the current practice in which subways are built at higher cost per rider than light rail, which in turn is built at higher cost than bus lanes, reflects real differences in operating costs and does not mean there is overinvestment in subways and underinvestment in buses. And second, costs per rider can be too low, in a sense – if a city’s construction costs per rider are very low, indicating a very high benefit-cost ratio, then it shouldn’t be lauded for its fiscal prudence but scolded for not having built these lines long ago and for not building more today. In truth, places with healthy decisionmaking about infrastructure expand their networks to the limit of cost-effectiveness, which means that costs per rider averaged over an entire region vary less than costs per kilometer, and this just reflects that cities build what they can, so low-cost cities can afford to build lines to lower-ridership areas, which higher-cost cities would reject as too expensive for the benefit. This way, costs per rider are not too different in New York and in cities that build for an order of magnitude lower cost per km than New York.
The meaning of cost per rider
In the remainder of this post, the meaning of “cost per rider” is “cost divided by the ridership on a working day.” In Europe, workers get around six weeks of paid vacation, and tend to take them in the summer, leading to depressed ridership around July or August, depending on the city; daily counts usually avoid this period, so for example Stockholm specifies that daily ridership figures are taken in winter. This, as I will explain shortly, does not unduly make European lines look more cost-effective than they actually are.
The cost per rider is best understood as a cost-benefit measurement. All benefits of public transportation scale with ridership, generally linearly: higher ridership indicates tighter economic and social ties if it comes from more travel, and better environmental outcomes if it is at the expense of car travel. What’s more, raw ridership measured in trips is better at capturing these benefits than passenger-km. The issue is that focusing on p-km overrates the success of extremely suburban systems, which have low environmental benefits for their p-km (the users are typically park-and-riders and therefore drive extensively, just not to their city center jobs) and usually also high net operating costs since they are peaky and tend to charge low per-p-km fares. Conversely, the short-hop trip is a net profit to the system – even subways with distance-based fares charge degressive rather than linear fares – and comes from dense networks that cut out car-based travel entirely. These effects roughly cancel out to the point that ridership is a good proxy for actual benefits.
That said, all outcomes need to be scaled to regional or even national incomes. Economic benefits are usually measured relative to worker wages anyway; in some business case analyses, such as that of the United Kingdom, the economic benefit is even scaled to rider income rather than regional or national income, which favors lines built to rich neighborhoods over lines built to poor ones, and isn’t really how cities need to think about their public transit networks. Social benefits are usually taken on a willingness-to-pay basis, and the same is true of health benefits including reduced air and noise pollution from cars and reduced car accidents.
The next step is then to compare the cost per rider with GDP per capita, which is not perfect but is good enough as a proxy for incomes. This also takes care of the issue of Europe’s synchronized summer troughs in local travel: those six weeks of paid vacation are visible in reduced GDP per capita, so the apparent bonus to the European system of using cost per daily trip where “day” means “workday outside the summer vacation season” rather than cost per annual trip cancels out with reduced annual GDP per capita.
The rough rule of thumb I use is that the absolute limit of cost-effectiveness for a subway or commuter rail line is when the cost per rider is equal to GDP per capita. This is a coincidence: a one-time cost has no reason to be equal to an annual income – this just follows from Börjesson-Jonsson-Lundberg’s estimate of the Stockholm Metro’s benefit-cost ratio compared with its cost per rider relative to the GDP per capita of 1960s’ Sweden. In practice, infrastructure is never built down to a benefit-cost ratio of 1, due to construction risks; in countries that make decisions based on benefit-cost analyses, the minimum is usually 1.2 or 1.3. In this schema, the United States can afford to build up to an envelope of $85,373/1.3 to $85,373, which is $65,000-70,000/rider in 2024 prices. The frontier lines, like the Interborough Express, are fairly close to this limit already; in practice, there’s a range, with some lines in the same city built well over the limit for political reasons (often airport connectors) and others built far below it.
Cost per rider by mode
The above analysis works for subways and commuter rail. It does not work for trams or buses. The reason is that surface transit never achieves the same low operating costs as metros, so in practice, the total cost to be truly comparable needs to be incremented by the additional operating costs.
To be clear, this is just a rule of thumb. There are different metro lines, even with the exact same technology in the same city, with different projected operating cost profiles; for example, in Vancouver, the Broadway extension of SkyTrain toward UBC was projected in the 2010s to reduce net operating costs as many buses would be replaced by fewer, larger trains, but the outward extension of the same system deeper into Surrey and Langley is projected to increase net operating costs. There are different ways to interpret this – for example, the Surrey extension is in a more auto-oriented area, with more likely car-to-train switchers (this is still much denser than an American park-and-ride); on net, though, I think the differences are not huge and could to an extent even be folded into the notion of cost per rider, which is substantially better on Broadway than in Surrey and Langley.
That said, metros consistently have much lower operating costs than light rail and buses in the same city; here are American cost profiles. As far as I can tell from CoMET data, most European and Asian metros cluster toward the bottom end of the American cost profile (such as the Chicago L; the New York City Subway is the top end among the big systems); bus operating costs are more or less proportional to driver wages times operating hours throughout the developed world. Here we need to briefly switch to cost per p-km, since mature urban rail networks use buses as short-hop feeders – the counterfactual to a bus-based network for New York isn’t people riding the same bus routes as today but at higher intensity, but people riding longer bus routes, so the cost would roughly scale to cost per p-km, not per passenger.
In rich Asia, metros are profitable. In Europe, it depends – the London Underground operationally broke even in the early 2010s, and the Berlin U-Bahn was said to do the same in the late 2010s. In healthy European systems, it’s never reported directly, since there’s fare integration across the region, so financial data are reported at metropolitan scale without much breakdown between the modes, but the farebox operating ratios in at least Germany and Scandinavia, and probably also Paris (which has much higher ridership density than London or Berlin, comparable costs per car-km, and higher fares than pre-2022 Berlin), suggest that metros and the inner sections of commuter rail systems can break even, and then the subsidies go to the buses and to suburban extensions.
Individual bus systems can be profitable, but never at metropolitan scale, not in the first-world cities I’m aware of. In New York, the buses between New Jersey and Manhattan are profitable and run by private companies, but that’s one specific section of the system, and on net the bus system in New Jersey, including not just these cross-tunnel buses but also internal buses within the state, loses money, covered by New Jersey Transit subsidies, and the financial performance of buses within New York is, frankly, terrible.
One potential complication is that BRT infrastructure is usually installed on the highest-performing individual routes, and those can have rather low operating costs. But then, the operating costs of the buses on Broadway in Vancouver are extraordinarily low, and still the projections are for the SkyTrain extension that would replace them to, on net, reduce systemwide operating subsidies. If your city has a bus corridor so strong that ordinary BRT would be profitable, the corridor has high enough ridership for a subway.
Light rail is essentially a via media between metros and buses: higher operating costs than metros, in theory lower ones than buses. I say in theory, because in the United States, light rail as a mode comprises different things, some behaving like lower-efficiency subways with shorter cars like the Boston Green Lines, and others running as mostly grade-separated urban rail in cities like the Los Angeles and Portland cities with extremely low ridership and high resulting operating costs. But a light rail system with serious ridership should comfortably obtain better operating outcomes than buses, if worse ones than metros.
Costs per rider can be too low
In New York, as mentioned above, the current urban rail extensions under construction (Second Avenue Subway Phase 2) or discussion (Interborough Express) have costs not far from the frontier relative to American incomes. In Berlin, the extensions instead are far cheaper; U8 to Märkisches Viertel was projected to cost 13,160€ per daily rider in 2021, which is a fraction of Germany’s GDP per capita.
This does not mean Berlin builds cost-effectively. It means Berlin builds too little. A line that costs less than one third the country’s GDP per capita should have been built when the GDP per capita was one third what it is now. If there are a lot of such possibilities in the city, it means there was a crisis it’s only now recovering from or there has been too much austerity, or both, in the case of Berlin.
Healthy construction environments – that is, not Germany, which has normal costs per kilometer and chooses to barely build intercity or urban rail – will instead build to the frontier of what’s cost-effective. In New York, it’s Second Avenue Subway; in Madrid, it’s extensions into deep suburbia making the system almost as long as that of New York, on one third the metro area population. Rational yes/no decisions on whether to build at all can coexist with good construction practices or with deeply irrational ones.
I’ve been looking at some intercity rail trips in Germany for later this summer, and was reminded of how nonfunctional the system is this season. I was asked specifically about Cologne-Frankfurt trips, and discovered that for later this month, they’re timetabled to take 2.5 hours. These cities are 180 km apart on the high-speed line, where trains normally take a little longer than an hour, but right now the trains don’t seem to be using the line – rather, they’re on the classical line, which follows the Rhine and is not at all fast. This is not the only line or the only summer that this is happening; since I moved to Germany, my summer travel plans have been constrained by these seasonal slowdowns, and between them and the mediocre average speed of most German intercity lines, I’ve forgone trips I would have made at French speeds and reliability. The rationale for these summer closures for maintenance is wholly without merit on intercity rail, and this practice holds back rail travel at the time when demand is highest. Deutsche Bahn should cease this practice and instead do like neighbors with year-round intercity rail travel.
Why?
Rail lines must have regular closures for maintenance. The norm is that this is done overnight, on both urban rail and mainline rail. However, overnight closures are sometimes supplemented by daytime closures, especially for longer-term renewal; daytime closures are especially common on lines that don’t close overnight at all. Readers from New York with its 24/7 service are all too familiar with weekend service changes, which may shut down entire line segments and direct riders to alternative routes. German U-Bahns don’t run 24/7, but do run overnight on weekends, so there are only five nights of maintenance windows and not seven. New York-style weekend closures are not common in Berlin, but occasionally some segments are shut, though in my experience it’s more common on the S-Bahn.
To be clear, there are good and bad reasons to engage in daytime shutdowns. Long maintenance windows allow higher productivity, so agencies prefer them when they can get away with them. The balance of when agencies and rail companies use daytime maintenance windows depends on all of the following factors:
Traffic: daytime shutdowns are used more often during less busy times – for example, RATP uses them in the summer, when everyone is on vacation and so Métro traffic is reduced.
Redundancy: systems on which passengers can bypass closed sections, such as the New York City Subway or the German national rail networks, can reroute passengers onto alternatives, which does not eliminate the cost to passengers of the closure but does reduce it. RATP also uses the redundancy of the Métro with the RER to do summertime shutdowns and tells passengers to transfer.
Single-tracking options: this is specific to weekend closures rather than longer-term ones, but, if the system is set up in a way that permits trains to single-track around obstacles, which is common in twin-bore tunnels, then weekend closures are rather easy. The Copenhagen Metro’s combination of twin-bore tunneling and driverless operations permits single-tracking even overnight, permitting 24/7 service without weekend service changes.
Agency culture: some agencies are just more accepting of disruptions than others. MBTA insiders insist to me that concrete curing requires weekend shutdowns, often of multiple lines at once, even though Boston has regular nighttime shutdowns; evidently, Japanese subways manage to run without this.
The situation of German intercity rail
Germany uses long-term shutdowns, measured in months, to do rail infrastructure renewal. These are usually in the summer, because, in Germany as in Paris, this is vacation season and therefore people are less likely to be going to work. The national network here is highly redundant, and intensive summertime shutdowns slow down passengers but do not make trips literally impossible: the Cologne-Frankfurt work is evidently adding about 1.5 hours to trips, and work previously done on the Frankfurt-Mannheim line slowed passengers by about 40 minutes (while still permitting some timed connections); in contrast, unscheduled breakdowns on the Northeast Corridor due to summer heat lead to trip cancellations.
The stupid thing about this is that while summer vacation travel reduces demand on urban rail, it has the opposite effect on intercity rail. The summer is consistently high season for intercity travel, precisely because it’s when people take vacations. In France, at least on domestic TGVs, fast trains are in plenty. But not here – instead, the trains are the least likely to be running, due to maintenance.
Much of the problem is that, unlike Shinkansen lines and LGVs, most German high-speed lines do not have regular nighttime closure windows. They run mixed traffic – passenger trains during the day, freight trains during the night. This feature allows for more flexibility of freight rail, but raises the construction and maintenance costs. Mixed lines must be built with freight-friendly features including gentler grades and lower superelevation (see explanation for superelevation here), the latter requiring wider curves to allow high speeds on passenger trains; both features require more tunneling, and as a result, German high-speed lines are much tunnel-heavier than French ones, raising costs. Maintenance is more difficult as well due to the lack of regular nighttime shutdowns.
That said, the Cologne-Frankfurt line is not a mixed line. It’s a passenger-only line, with a ruling grade of 4%, higher than any other high-speed line I know of (LGVs use 3.5%). It also has the tightest curves I know of on newly-built high-speed lines relative to speed, running at 300 km/h on 3.35 km radius curves, a lateral acceleration in the horizontal plane of 2.07 m/s^2; only the Shinkansen has faster lateral acceleration, and that’s on older lines running tilting trains. Consequently, it’s actually the least tunnel-heavy of the German high-speed lines. Nonetheless, it evidently does not run every day, every year, the way LGVs and Shinkansen lines do.
This is where I suspect agency culture comes into play. American cities other than New York and to some extent Chicago shut down their subway systems overnight, but still force passengers onto bus diversions on weekends for maintenance, where their foreign counterparts do no such thing; this has to be understood as a combination of managers not really caring about weekend service (leading to lower base frequency as well) and comparing themselves to New York even without 24/7 service. In Germany, the culture is that high-speed lines should be built to mixed standards, even if they are useless for freight, for political reasons, and renewal should consequently be done in long-term shutdowns with accelerated work, and this culture is evidently also affecting a line that is built to passenger-only standards. This may also be compounding with the European culture of summer vacations, leading to reduced urban rail service during summers – I am not sure, having seen explicit service reductions in Paris and Stockholm but not here.
Conclusion
Long-term closures have tradeoffs. In some cases they are legitimate, especially when the time cost to passengers is greatly reduced and when traffic is lower. However, neither of these two conditions applies in the case of intercity rail traffic in Germany. The closures are happening during the busiest time of intercity travel, and delaying passengers by an hour or even more. Worse, this practice is used not just on mixed lines like Hanover-Würzburg but also on passenger-dedicated Cologne-Frankfurt, which has regular nighttime work windows. When the reason for the closures is cultural, it ceases to be legitimate; it instead points out to an agency that refuses to think outside of its box, and will not assimilate better practices from elsewhere.
American journalists sometimes ask me to discuss high-speed rail fares. I’ve written from time to time about how Northeast Corridor fares are significantly higher than French, German, and Japanese high-speed rail fares, but the links to this information are never in the same place. The purpose of this post is to collect all the links together for easy retrieval, with updates to the 2020s whenever possible. Unfortunately, international high-speed rail fares connecting to France are also much higher than domestic ones, which contributes to the poor ridership of those trains relative to city size.
France
ARAFER releases statistics annually. The most recent year for which there is data is 2022; here’s the report in French, and here’s a summary in English. The relevant information is in sections 5-6. The TGV system including international trains averages fare revenue of 6,213M€ for 61 billion passenger-km; in English this is called “non-PSO,” since these are the profitable trains that SNCF runs outside the passenger service obligation system for money-losing slow trains. This works out to 0.102€/p-km. The PPP rate these days is about 1€ = $1.45, making this about $0.15/p-km.
The split between domestic and international trains is large, and the French report has the domestic trains as just 0.093€/p-km, taking a weighted average from pp. 23 and 31. Nominal fares per p-km on domestic TGVs were down 4% from 2019 to 2022, despite 7.5% cumulative inflation over this period.
The international trains, in contrast, are much more expensive: the report doesn’t give exact numbers, but from some weighted averaging and graph eyeballing it looks like it’s around 0.17€/p-km. The all-high-speed international trains – Eurostar and Thalys – are more expensive than the trains running partly at low speed in Germany and Switzerland, like Lyria; this big difference in fares helps explain their disappointing ridership. Domestic TGVs run from Paris to Lyon 28 times on the 5th of June this year, counting only trains to Lyon Part-Dieu or Perrache, which do not continue onward, and not counting trains that stop at Saint-Exupéry on their way to points south, and those trains are rather full 16-car bilevels. In contrast, on the same day I only see 16 Eurostars from London to Paris. This is despite the fact that London is a far larger city than Lyon, and the in-vehicle travel time is only moderately longer.
Germany
Germany lacks France’s neat separation of low- and high-speed trains. The intercity rail network here is treated as a single system, and increasingly all trains are ICEs even if they spend the majority of the trip on legacy lines at a top speed of 200 km/h.
Overall intercity rail passenger revenue here was 5.1 billion € in 2022; the expression to look for is “SPFV.” Ridership was 42.9 billion p-km per a DB report of 2022-3, PDF-p. 7, averaging 0.119€/p-km, which is $0.17/p-km in PPP US dollars. 2022 was still slightly below 2019 levels, when ridership was 44.7 billion p-km and fares averaged 0.112€/p-km; the three-year increase was less than the cumulative inflation over this period, which was 10.3%.
Japan
Japanese fares are higher than European fares on high-speed rail. JR East’s presentation from 2021, showing depressed ridership during the pandemic (p. 50), reports ¥189.6 billion in Shinkansen revenue on 7.95 billion p-km, or ¥23.8/p-km, and projects recovery to ¥428.9 billion/17.313 billion p-km by 2022, or ¥24.8/p-km. JR Central’s 2020 report says (p. 37) that its Shinkansen service got ¥1.2613 trillion in revenue in the year ending March 2020 on 54.009 billion p-km, or ¥23.4/p-km. JR West’s 2020 factsheets for revenue and ridership show ¥457 billion/21.338 billion p-km in 2019, or ¥21.4/p-km.
The PPP rate for 2020-1 was $1 = ¥100. Taking 9% dollar inflation from 2020 to 2022 into account, this is, in 2022 prices, around $0.25/p-km.
Northeast Corridor
Amtrak publishes monthly performance reports; the fiscal year is October-September, so the September reports, covering an entire fiscal year, are to be preferred. Here are 2022 and 2023; 2022 still shows a considerable corona depression, unlike in France and Germany. The 2023 report shows that Northeast Corridor revenue splits as $495.9 million/581.1 million p-miles Acela, or $0.53/p-km, and $768.2 million/1.6269 billion p-miles Regional, or $0.293/p-km Regional. Altogether, this is $0.356/p-km, which is nearly 50% higher than the Shinkansen, 2.1 times as expensive as the ICE, and 2.4 times as expensive as the TGV.
Discussion
High operating costs on Amtrak are the primary reason for the premium fares. The mainland JRs are all highly profitable; DB Fernverkehr is profitable, as is the TGV network (though SNCF writ large isn’t, the slow intercities falling under the PSO rubric). All five companies pay track access charges for the construction of high-speed rail infrastructure; the ARAFER report goes over these charges in France and a selection of other European countries, designed to prevent state subsidies to intercity rail operations through underpriced track access, since track construction is always done by the state but operations may be done by a private operator or a foreign state railway. The Northeast Corridor is profitable as well – Amtrak doesn’t have to pay track access charges, but the access charges for legacy 19th-century lines would not be significant. However, if Amtrak charged European fares or even Japanese ones, it wouldn’t be. Northeast Corridor rail operations in fiscal 2023 earned $1.266 billion in passenger revenue plus $28.5 million in non-ticket revenue but spent $1.0917 billion, or $0.307/p-km.
A portion of the Amtrak cost premium also comes from adversarial profit maximization, also seen on Thalys and Eurostar. The domestic TGVs and ICEs aim at making a base rate of profit while providing a service for the general public; SNCF doesn’t apply the same logic to Thalys and Eurostar and instead aims at serving only business trips to avoid the possibility of extracting less than maximum fares from international travelers. On Amtrak, the need to subsidize the rest of the system has increased Northeast Corridor fares, though to be clear, in fiscal 2023 the operating margin was small enough that this is at most a secondary factor. Performance reports from the 2000s and 10s showed a larger operating margin, but criticism from advocacy groups centering non-Northeast Corridor passengers alleging that Amtrak accounting was making the Northeast Corridor look better and the night trains look worse led to a recalculation, used in the most recent reports, in which Northeast Corridor operations still turn out to be profitable but not by a large margin.
I occasionally have exchanges on social media or even in comments here that remind me that too many people in the American middle class believe that Europe is much poorer than the US. The GDP gap between the US and Northern Europe is small and almost entirely reducible to hours worked, but the higher inequality in the US means that the top 10-20% of the US compare themselves with their peers here and conclude that Europe is poor. Usually, it’s just social media shitposting, for example about how store managers in the US earn the same as doctors in Europe. But it becomes relevant to public transit infrastructure construction in two ways. First, Americans in positions of authority are convinced that American wages are far higher than European ones and that’s why American construction costs are higher than European ones. And second, more broadly, the fact that people in positions of authority really do earn much more in the US than here inhibits learning.
The income gap
The United States is, by a slight amount, richer than Northern Europe, which for the purposes of this post comprises the German-speaking world, the Nordic countries, and Benelux. Among the three largest countries in this area, Germany is 16.5% poorer than the US, the Netherlands 8.3% poorer, Sweden 14.3%. This is more than anything an artifact of shorter working hours – Sweden has an ever so slightly larger GDP per hour worked, the other two are 6-7% poorer per hour worked. All three countries have a much higher 15-64 labor force participation rate than the US, but they’re also older, which in the case of Germany actually gets its 15+ rate to be a hair less than the US’s. But there’s much more part-time work here, especially among women, who face large motherhood penalties in German society (see figures 5-7 in Herzberg-Druker, and Kleven et al). Germany is currently in full employment, so it’s not about hidden part-time work; it’s a combination of German-specific sexism and Europe-wide norms in which workers get around six weeks of paid vacation per year.
One implication of the small gap in income per hour is that wages for the same job are likely to be similar, if the jobs pay close to the mean wage. This is the case for tunnel miners, who are called sandhogs in the United States: the project labor agreements in New York are open – the only case in which itemized costs are publicly available – and showcase fully-laden employment costs that, as we document in our construction costs reports, work out to around $185,000/year in 2010 prices; there is a lot of overstaffing in New York and it’s disproportionately in the lower-earning positions, and stripping those, it’s $202,000/year. I was told that miners in Stockholm earn 70,000 kronor/month, or about $100,000/year in PPP terms (as of 2020-1), and the fully-laden cost is about twice that; a union report from the 2000s reports lower wages, but only to about the same extent one would expect from Sweden’s overall rate of economic growth between then and 2021. The difference at this point is second-order, lower than my uncertainty coming from the “about” element out of Sweden.
While we’re at it, it’s also the case for teachers: the OECD’s Education at a Glance report‘s indicator D3 covers teacher salaries by OECD country, and most Northern European countries pay teachers better than the US in PPP terms, much better in the case of Germany. Teacher wage scales are available in New York and Germany; the PPP rate is at this point around 1€ = $1.45, which puts starting teachers in New York with a master’s about on a par with their counterparts in the lowest-paying German state (Rhineland-Pfalz). New York is a wealthy city, with per capita income somewhat higher than in the richest German state (Bavaria), but it’s not really seen in teacher pay. I don’t know the comparative benefit rates, but whenever we interview people about European wage rates for construction, we’re repeatedly told that benefits roughly double the overall cost of employment, which is also what we see in the American public sector.
The issue of inequality
American inequality is far higher than European inequality. So high is the gap that, on LIS numbers, nearly all Western European countries today have lower disposable income inequality than the lowest recorded level for the US, 0.31 in 1980. Germany’s latest number is 0.302 as of 2021, and Dutch and Nordic levels are lower, as low as 0.26-0.27; the US is at 0.391 as of 2022. If distributions are log-normal (they only kind of are), then from a normal distribution log table lookup, this looks like the mean-to-median income ratios should be, respectively, 1.16 for Germany and 1.297 for the US.
However, top management is not at the median, and that’s the problem for comparisons like this. The average teacher or miner makes a comparable amount of money in the US and Northern Europe. The average private consultant deciding on how many teachers or miners to hire makes more money in the US. A 90th-percentile earner is somewhat wealthier in the US than here, again on LIS number; the average top-1%er is, in relative terms, 50% richer in the US than in Germany (and in absolute terms 80% richer) and nearly three times as rich in the US as in Sweden or the Netherlands, on Our World in Numbers data.
On top of that, I strongly suspect that not all 90th percentile earners are created equal, and in particular, the sort of industries that employ the mass (upper) middle class in each country are atypically productive there and therefore pay better than their counterparts abroad. So the average 90th-percentile American is noticeably but not abnormally better off than the average 90th-percentile German or Swede, but is much better off than the average German or Swede who works in the same industries as the average 90th-percentile American. Here we barely have a tech industry by American standards, for example; we have comparable biotech to the US, but that’s not usually where the Americans who noisily assert that Europe is poor work in.
Looking for things to mock
While the US is not really richer than Northern Europe, the US’s rich are much richer than Northern Europe’s. But then the statistics don’t bear out a massive difference in averages – the GDP gap is small, the GDP gap per hour worked is especially small and sometimes goes the other way, the indicators of social development rarely favor the US, immigration into Western Europe has been comparable to immigration to the US for some time now (here’s net migration, and note that this measure undercounts the 2022 Ukrainians in Germany and overcounts them in Poland).
So middle-class Americans respond by looking for creative measures that show the level of US-Europe income gap that they as 90th-percentile earners in specific industries experience (or more), often dropping the PPP adjustment, or looking at extremely specific things that are common in the US but not here. I’ve routinely seen American pundits who should know better complain that European washing machines and driers are slow; I’m writing this post during a 4.5-hour wash-and-dry cycle. Because they fixate on proving the superiority of the United States to the only part of the world that’s rich enough not to look up to it, they never look at other measures that might show the opposite; this apartment is right next to an elevated train, but between the lower noise levels of the S-Bahn, good insulation, and thick tilt-and-turn windows, I need to concentrate to even hear the train, and am never disturbed by it, whereas American homes have poor sound insulation to the point that street noise disturbs the sleep.
Learning to build infrastructure
The topline conclusion of any American infrastructure reform should be “the United States should look more like Continental Europe, Turkey, non-Anglophone East Asia, and the better-off parts of Latin America.”
If it’s written in the language of specific engineering standards, this is at times acceptable, if the standards are justified wholly internally (“we can in fact do this, here’s a drawing”). Even then, people who associate Americanness with their own career success keep thinking safety, accessibility, and similar issues are worse here, and ask “what about fire code?” and then are floored to learn that fire safety here is actually better, as Stephen Smith of Market Urbanism and the Center for Building constantly points out.
But then anything that’s about management is resisted. It’s difficult to convince an American who’s earning more than $100,000 a year in their 20s and thinks it’s not even that much money because their boss is richer that infrastructure project management is better in countries where the CEO earns as much money as they do as an American junket assistant. Such people readily learn from rich, high-inequality places that like splurging, which are not generally the most productive ones when it comes to infrastructure. Even Americans who think a lot about state capacity struggle with the idea that Singapore has almost as high construction costs as the US; in Singapore, the CEO earns an American salary, so the country must be efficient, right? Well, the MRT is approaching $1 billion/km in construction costs for the Cross-Island Line, and Germany builds 3 km of subway (or decides not to build them) on the same budget and Spain builds 6 km, but Europe is supposedly poor and Americans can’t learn from that.
The upshot is that even as we’re seeing some movement on better engineering and design standards in the United States, resulting in significant cost savings, there’s no movement for better overall management. Consultant-driven projects remain the norm, and even proposals for improving state capacity are too driven by domestic analysis without any attempt at international learning or comparativism. Nor is there any effort at better labor efficiency – management in the US hates labor, but also thinks it’s entirely about overpaid workers or union safety rules, and doesn’t stoop to learn how to build more productively.
At the Transit Costs Project, we study the costs of urban rail lines per kilometer. This, with our usual controls, is a rough indicator of how efficient a city’s infrastructure construction program is. However, cost-effectiveness is different from efficiency, and is better measured not by just the cost but also the benefits, which are measured by ridership. Thus, cost-effectiveness is best measured by the cost of each project per rider. So what does it mean to compare different cities by their costs per rider, rather than per kilometer?
The answer is, “not much,” at least not as far as efficiency or good decisionmaking. In fact, while some projects persistently have costs per rider that are too high to be cost-effective (for example, it’s endemic to airport extensions), some cities have costs per rider that are too low, such as Berlin. The issue here is that if municipal or state decisionmaking is healthy, it will build cost-effective lines; if a line under discussion has a very high benefit-cost ratio, or equivalently a very low cost per rider, it means it should have been built long ago, and it speaks poorly to the local decisionmaking that it hasn’t been built already, as is unfortunately the case in Berlin.
Cost per rider and cost-effectiveness
As always, let’s start with Second Avenue Subway Phase 1, the project that launched my interest in construction costs and the Transit Costs Project writ large. The projected daily ridership is 202,000; the line came close to it in 2019, reaching about 163,000 (see data here; I’m taking boardings for the three new stations, adding the growth in ridership at Lexington/63rd, and multiplying by two to account for disembarkings), and would have likely reached projection by now but for the pandemic. The cost, in 2023 dollars, was $6.23 billion, or about $31,000 per projected weekday trip.
For another anchoring number, let’s use the Stockholm Metro’s entire construction from the 1940s to the 1970s. This is useful because in addition to costs per rider, there is a published ex post benefit-cost ratio, thanks to the work of Maria Börjesson. The cost of that system, in 2023 PPP dollars, was $3.7 billion, with a ridership of 1,265,900 per workday in 2019, or $2,900/rider, while the benefit-cost ratio is 6 without taking agglomeration into account, or 8.5 with. This does not mean that the value of a rider is only about $24,900; this was the value in the economic situation of postwar Sweden, a country that was substantially poorer than the Sweden of today. In 2023 PPP terms, Sweden’s GDP per capita in 1965, about midway through the opening of the original system, was about $19,400; today, Sweden is 3.5 times richer, and the US is 17% richer than Sweden.
The benefits of urban travel are largely proportional to GDP per capita. The economic benefits of agglomeration are proportional to the value of the economy writ large, and so are the benefits of reduced travel time, which in benefit-cost analyses are usually taken to be proportional to the average hourly wage. Conversely, the ability of a government to spend money on desired outcomes is proportional to its tax base, i.e. the size of its economy. All of this is approximate, but all we’re doing is first-order approximate analysis anyway, and so correcting for GDP per capita is valuable.
As it is, the difference between American and Swedish GDP per capita boils down entirely to working hours. Swedes work shorter hours than Americans, as they, like nearly everyone else in Europe, get much longer vacation time; as of 2022, Sweden’s GDP per hour worked was, by a rounding error, slightly higher than the US’s. However, at the same time, the daily ridership numbers for Sweden are specifically drawn from winter workday ridership, to avoid reporting figures from when ridership is lower during the summer vacation season, and the same is true for daily ridership counts in France. If we give Sweden and France credit by looking at ridership when people aren’t on vacation, we must compare the cost per rider with GDP per capita and not GDP per hour.
The upshot is that countries should be building metros up to a maximum capital cost per rider that’s about as large as their GDP per capita. The $24,900 computation for 1960s’ Sweden is ex post, and usually the ex ante benefit-cost ratio must be at least 1.2 or 1.3 for the project to go ahead due to risk. For light rail the allowable cost should be lower, and for bus projects it should be lower still, due to the higher lifetime operating costs; but for metros and metro-like urban rail projects (such as largely grade-separated light rail, or commuter rail tunnels like Citybanan), this analysis should hold. Second Avenue Subway Phase 1, which opened in a United States with a GDP of $73,300/capita in 2023 prices, is thus very cost-effective; Phase 2, budgeted at something like $70,000/rider in today’s prices, is marginal but makes it (in 2022, US GDP per capita in 2023 prices was $80,300).
Some more costs per rider
Our database of construction costs per km is largely complete, but we don’t have much ridership data. Worse, the costs per rider we do have have some biases. We have better information for the US and Canada than elsewhere, and for Europe than the rest of the non-North American world. Costs are also likeliest to be reported for megaprojects with notable delays or cost overruns and thus an incomplete database will be biased upward; large, international cities have better reporting in English than the rest and this introduces another upward bias in incomplete data (these are typically wealthy and therefore capable of affording a high cost per rider).
With that in mind, here are some (again, incomplete) examples:
Crossrail cost $24 billion in 2023 PPP terms; ridership in late 2023 was 4.3 million a week, which is usually about 700,000/weekday, said to be above projections, with long-term projections rising to a million/weekday; on current ridership it’s $34,000/rider, and on future projections it’s $24,000.
Paris Métro Line 14’s original section, opened by 2007, cost $2.44 billion in 2023 PPP terms; ridership in 2019, before more recent extensions and before corona, was 92 million, so around 320,000 per workday, which is $7,600/rider.
Grand Paris Express was projected in 2021 to cost (in 2023 PPP dollars) around $65 billion, with a ridership projection of 2 million/day from 2022, and 2.3-2.4 million/day from 2012, for around $32,000/rider, or $28,000 if the older ridership projection is used.
Milan Metro Line 4 cost $2.63 billion, and was expected to carry 235,000 riders per day when complete, which would be $11,000/rider; it will be completed this year, but ridership so far is for only the half of the line that has opened so far ans is also still somewhat suffering from corona.
The U-Bahn extensions in Berlin that are currently in development hell include U8 to Märkisches Viertel projected at 13,160€/rider (around $21,000 in 2023 PPP terms), a U6 extension to the former Tegel Airport projected at 27,200€/rider (around $43,000), and a U7 extension to the current BER airport projected at 23,000€/rider (around $36,000), among others brought up by the new coalition.
Willingness to build and Berlin’s problem
The above numbers should not be taken to mean that Italy and Germany are more cost-effective about metro construction. To the contrary, they indicate that they are leaving value on the table by not building.
Germany has a GDP per capita of $66,000 in PPP terms. The benefit-cost ratios of the U-Bahn extensions in Berlin that are being discussed but not actually brought forward and built are very high, and the U8 extension to Märkisches Viertel is scratching a ratio of 4. It is irresponsible that there isn’t a massive construction plan not just under discussion but in design and soon physical construction. This must include not just those lines but also others to be added until the benefit-cost ratio of the marginal line falls to slightly more than the minimum that deserves funding.
Italy has the same problem. No matter how pessimistic one’s view of the future of the economy of Italy is, the metro lines it is currently building, at least in Milan, are so cost-effective that there have to be more of them. In the 2010s, Italy was in a budget crunch and ended up using public-private partnerships to keep debt off-books, at very high implied interest rate based on the rate of payment to the concessionaire, about 8%. Today, fundamentally, even a stagnant economy with a GDP per capita of $55,000, which may finally overtake its 2007 peak this year, should be building more if the current extensive margin of Milan Metro construction is not even in the teens of thousands of dollars. Perhaps the benefit-cost ratios for Sweden rely not just on Sweden’s GDP per capita of the 1960s but on that of today, after 60 years of growth; but then even absent any of this growth, 55/3.5 > 12.
Paris showcases a healthier situation: the success of M14 endeared the region to driverless metros with longer interstations than the older metro lines but shorter ones than the RER, and with further growth in the region, the state decided to build the 200 km Grand Paris Express to improve circumferential rail service and add more fast radial connections from the suburbs to the city not along the RER. France’s GDP per capita is around $58,000 in PPP dollars; some elements of GPE may be marginal, but the project writ large has a solid benefit-cost-ratio starting with a 2.
Spain is like France in that when it can build, as it could before the Great Recession and as it can now after having recovered, it does. This is the right way to do it: low costs per km should translate to massive subway expansion. If you’re Madrid, you can build lines that would be completely ridiculous anywhere else in terms of land use, like MetroSur, because it’s cheap.
A Paris or Berlin cannot be so profligate as Madrid. Building a line like MetroSur here, which in the Spanish context looks silly but does pass cost-effectiveness muster, would be an economic albatross. But medium-cost cities can still cover most of the built-up area with subway and commuter rail lines; Paris is doing so but Berlin is not.
The problem for Berlin is not quite austerity, which afflicted Southern Europe last decade, producing negative economic growth. In the last coalition, it was the two most left-wing parties, the Greens and Die Linke, which opposed U-Bahn construction. In their view, trams are preferable; they complain about the high construction costs of subways, but don’t meaningfully engage with why they’re still necessary for fast urban transport beyond the range of the handful of inner neighborhoods where people vote for the Greens.
That said, in the current coalition, there’s no real political left. SPD is in it, but under an atypically conservative leader in Franziska Giffey, and the more left-wing faction in the party, including the youth league Jusos, is sidelined. Both parties in the coalition, CDU and SPD, are committed to building those U-Bahn extensions. But then nothing is happening; Giffey is not competent enough to do it, and CDU is too wrapped up in anti-environmental populism to do something that pisses off some environmentalists but makes others happy.
This way, the low costs per rider projected for Berlin U-Bahn expansion are not a testimony to cost-effectiveness. They’re a testimony to political unwillingness to build, for largely petty reasons. It is wasteful to build a subway line with a very high projected cost per rider relative to the country’s wealth, but it is equally wasteful not to build one with a low projected cost per rider, and the latter is what is happening in Berlin, unfortunately.
Jerusalem Demsas has been on a roll in the last two years, and her reporting on housing advocacy in Minneapolis (gift link) is a great example of how to combine original reporting with analysis coming from understanding of the issue at hand. In short, she talks to pro- and anti-development people in the area, both of which groups identify with environmentalism and environmental advocacy, and hears out their concerns. She has a long quote by Jake Anbinder, who wrote his thesis on postwar American left-NIMBYism and its origins, which are a lot more good-faith than mid-2010s YIMBYs assumed; he points out how they were reacting to postwar growth by embracing what today would be called degrowth ideology.
I bring this up because Germany is full of anti-growth left-NIMBYism, with similar ideology to what she describes from her reporting in Minneapolis, but it has different transportation politics, in ways that matter. The positioning of German left-NIMBYs is not pro-car; it has pro-car outcomes, but superficially they generally support transportation alternatives, and in some cases they do in substance as well.
In the US, the left-NIMBYs are drivers. Jerusalem cites them opposing bike lanes, complaining that bike lanes are only for young childless white gentrifiers, and saying that soon electric cars will solve all of the problems of decarbonizing transportation anyway. I saw some of this myself while advocating for rail improvements in certain quarters in New England: people who are every stereotype of traditional environmental left-NIMBYism were asking us about parking at train stations and were indifferent to any operating improvements, because they don’t even visit the city enough to think about train frequency and speed.
In Germany, many are drivers, especially outside the cities, but they don’t have pro-car politics. The Berlin Greens, a thoroughly NIMBY party, are best known in the city for supporting removal of parking and moving lanes to make room for bike lanes. This is not unique to Berlin or even to Germany – the same New Left urban mayors who do little to build more housing implement extensive road diets and dedicated lanes for buses, streetcars, and bikes.
These same European left-NIMBYs are not at all pro-public transportation in general. They generally oppose high-speed rail: the French greens, EELV, oppose the construction of new high-speed lines and call for reducing the speed on existing ones to 200 km/h, on the grounds that higher speeds require higher electricity consumption. In Germany, they usually also oppose the construction of new subway and S-Bahn tunnels. Their reasons include the embedded carbon emissions of tunneling, a belief that the public transport belongs on the street (where it also takes room away from cars) and not away from the street, and the undesirability (to them) of improving job access in city center in preference to the rest of the city. However, they usually consistently support more traditional forms of rail, especially the streetcar and improvements to regional rail outside major cities. For example, the NIMBYs in Munich who unsuccessfully fought the second S-Bahn trunk line, whence the expression Organisation vor Elektronic vor Beton (the Swiss original omits Organisation and also is very much “before” and not “instead of”), called for improvements in frequency on lines going around city center, in preference to more capacity toward city center.
I’m not sure why this difference works like this. I suspect it’s that American boomer middle-class environmental NIMBYism is rooted in people who suburbanized in the postwar era or grew up in postwar suburbs, and find the idea of driving natural. The same ideology in Europe centers urban neighborhood-scale activism more, perhaps because European cities retained the middle class much better than their American ones, perhaps because mass motorization came to Europe slightly later. It also centers small towns and cities, connected to one another by regional rail; the underlying quality of public transportation here is that environmentalists who can afford better do rely on it even when it’s not very good, which hourly regional trains are not, whereas in the United States it’s so far gone that public transportation ridership comprises New Yorkers, commuters bound for downtown jobs in various secondary cities, and paupers.
In Northern Europe right now, there’s a growing backlash to perceived injury to people’s prosperity inflicted by the green movement. In Germany this is seen in campaigning this year by the opposition and even by FDP not against the senior party in government but against the Greens. In the UK, the (partial) cancellation of High Speed 2 involved not just cost concerns but also rhetoric complaining about a war on cars and shifting of high-speed rail money to building new motorway interchanges.
I bring this up for a few reasons. First, to point out a trend. And second, because the Berlin instantiation of the trend is a nice example of what I talked about a month ago about conspiracism.
The trend is that the Green Party in Germany is viewed as Public Enemy #1 by much of the center-right and the entire extreme right, the latter using the slogan “Hang the Greens” at some hate marches from the summer. This is obvious in state-level political campaigning: where in North-Rhine-Westphalia and Schleswig-Holstein the unpopularity of the Scholz cabinet over its weak response to the Ukraine war led to CDU-Green coalitions last year (the Greens at the time enjoying high popularity over their pro-Ukraine stance), elections this year have produced CDU-SPD coalitions in Berlin and Hesse, in both cases CDU choosing SPD as a governing partner after having explicitly campaigned against the Greens.
This is not really out of any serious critique of the Green Party or its policy. American neoliberals routinely try to steelman this as having something to do with the party’s opposition to nuclear power, but this doesn’t feature into any of the negative media coverage and barely into any CDU rhetoric. It went into full swing with the heat pump law, debated in early summer.
In Berlin the situation has been especially perverse lately. One of the points made by CDU in the election campaign was that the red-red-green coalition failed to expand city infrastructure as promised. It ran on more room for cars rather than pedestrianization, but also U-Bahn construction; when the coalition agreement was announced, Green political operatives and environmental organizations on Twitter were the most aghast at the prospects of a massive U-Bahn expansion proposed by BVG and redevelopment of Tempelhofer Feld.
And then this month the Berlin government, having not made progress on U-Bahn expansion, announced that it would trial a maglev line. There hasn’t been very good coverage of this in formal English-language media, but here and here are writeups. The proposal is, of course, total vaporware, as is the projected cost of 80 million € for a test line of five to seven kilometers.
This has to be understood, I think, in the context of the concept of openness to new technology (“Technologieoffenheit”), which is usually an FDP slogan but seems to describe what’s going on here as well. In the name of openness to new tech, FDP loves raising doubts about proven technology and assert that perhaps something new will solve all problems better. Hydrogen train experiments are part of it (naturally, they failed). Normally this constant FUD is something I associate with people who are out of power or who are perpetually junior partners to power, like FDP, or until recently the Greens. People in power prefer to do things, and CDU thinks it’s the natural party of government.
And yet, there isn’t really any advance in government in Berlin. The U8 extension to Märkisches Viertel is in the coalition agreement but isn’t moving; everyfew months there’s a story in the media in which politicians say it’s time to do it, but so far there are no advances in the design, to the point that even the end point of the line is uncertain. And now the government, with all of its anti-green fervor – fervor that given Berlin politics includes support for subway construction – is not so much formally canceling it as just neglecting it, looking at shiny new technologies that are not at all appropriate for urban rail just because they’re not regular subways or regular commuter trains, which don’t have that identity politics load here.