Category: Sweden
Fare Practices
Here’s a table of urban public transport fares for various cities, covering the United States, Canada, parts of Europe, Turkey, and Japan. Included are single fares, multi-ride discounts, day passes, weeklies, and monthlies, with the last three shown with their ratios to single fares. As far as possible we’ve tried doing fares as of 2026, but it’s possible a few numbers are not updated and depict 2025 figures.
The thing to note is that in Continental Europe, there are steeply discounted monthlies – only two cities in the table charge for a monthly more than for 30 single-trips (Paris at 35.5, Bari at 35). Most Italian cities cluster around 20, and Barcelona, Lisbon, and especially Porto are even lower. Berlin used to have a multiplier of 32 before the 9€ monthly and the subsequent Deutschlandticket but the current multiplier is 15.75 within the city. Stockholm has a monthly multiplier of 24.7. Prague’s multiplier is 12.
Japanese monthly fares are strange by Western standards, in the sense that they are station-to-station, with subsegments allowed but no trips outside the segment; subject to this constraint the multiplier is 30-40, with small additional discount for buying 3-6 months in advance, but the unrestricted monthly fare is very high. London and Istanbul functionally do not have monthlies, in the sense that the multiplier is so high (78.5 Istanbul-wide, and it’s not truly unlimited but is capped at 180 trips/month) that except for trips within Central London it might as well not exist.
American and Canadian monthly fares are usually higher than in Continental Western Europe, with multipliers in the 30s. New York’s multiplier was especially high, about 46, and the MTA has just abolished the monthly fare entirely and phased out the MetroCard (as of the new year, starting in two hours), making people use the weekly cap with OMNY instead, which has a multiplier of 11.7 and, over a 30-day month, forces a monthly multiplier of 50. Toronto has a very high monthly multiplier as well, 46.6. This is bad practice: a high monthly discount functions as a technologically simple off-peak discount (indeed, London pairs its stingy monthly discount with a substantial off-peak discount), and OMNY itself is buggy to the point that fare inspectors on the buses can’t tell if someone has actually paid except by looking at debit card statements, which do not show one as having paid if one has a valid transfer or has reached the weekly cap (and not tapping in this case is still illegal fare dodging in New York law).
The practice of the cap, increasingly popular in the US under London influence, is rare as well. London’s fare cap originates in its complex zone system: the Underground has nine zones with zone 1 only covering Central London so that passengers taking multiple trips per day can expect to take trips across different zones that they may not be familiar with; there isn’t fare integration, but rather there’s a special surcharge on some commuter train trips and a discount on buses; peak and off-peak fares are different. Thus, the calculation for the passenger of whether to buy tickets one at a time or get a pass is difficult, so Oyster does this calculation automatically to give the most advantageous fare. In a Continental city where fares are either flat regionwide or have zones with limited granularity (often the entire metro is in the innermost zone) and monthly discounts are steep, the calculation is simple: an even semi-regular rider should always get a monthly.
American and Canadian cities typically have flat fares or a simple zone system, good fare integration between buses and the subway or light rail, and commuter rail that’s functionally unusable for urban trips rather than resembling the subway with a $2 surcharge. The use case of London does not apply to such cities. New York should not have a fare cap, but a heavily surcharged single trip, perhaps $5, and an attractive flat monthly fare, perhaps $130. This system ensures passengers are incentivized to pay and there is little opportunistic fare dodging as the user has already prepaid for the entire month, so it pairs well with proof-of-payment fare collection, common in many of the European examples (though metro systems outside Germany and its immediate vicinity do have faregates).
The overall level of the fare is determined by the willingness of the government at various levels to subsidize public transport; the table can be used to compare these at PPP rates as well. However, the distribution of fares across different products and distances is not a matter of subsidy but a matter of good and bad industry practices, and the best practice for simple fare collection is to offer a prepaid monthly at a heavy discount compared with the single ride.
The Invention of the Traditional System of Project Delivery
In the Sweden case, I contrasted the emerging UK-influenced norms of infrastructure project delivery, which I called the globalized system, with the way Nordic procurement was previously done, which I called the traditional system. This explained Nordic trends well, in which Stockholm went from having construction costs so low in the second half of the 20th century they were at times even lower than those of Spain to having rather average costs for Europe. But elsewhere, calling the set of good project delivery practices reliant on an active, expert, apolitical public sector traditional ended up obscuring too much. In the United States, for one, the traditional practices did not work like that at all. In Italy, the project delivery practices are thoroughly traditional in the Nordic sense, but go back to mani pulite in the 1990s.
That said, this procurement system represents an evolution of prior norms of state-led planning, and is less of a break from them than the globalized system is. It’s best viewed as a system based on transparency and good government insights from the second half of the 20th century, rather than on giving up on good government and privatizing to the private sector as the globalized system does. In either case, it has little to do with traditional or emerging American practices, the former based on the good government practices of the early 20th century and the latter an adaptation of the globalized system in an even worse context. Regardless, its benefits are extensive, with interviewees in New York and increasingly London finding various wastes in the process of their own project delivery that can double the cost or even worse.
Good procurement practices: a recap
Good infrastructure megaproject delivery – at least subways, but also likely road tunnels as far as we can tell from small data – requires an active public sector that can supervise consultants and contractors, learn within its own institutions, and assume risk.
In Southern Europe today, and in the Nordic countries until recently, this means the following:
- Technical scoring: infrastructure contracts must be awarded primarily on the technical score of the proposal (50-80% of the weight of the contract) and not on the cost (maximum 50%, ideally about 30%)
- Itemized costs: contracts must have a bill of items, priced based on transparent lists produced by the state, with change orders using the same itemized list to reduce conflict
- Separation of design and construction into two contracts (design-bid-build), rather than bundling into design-build contracts
- Public-sector planning, with the decisions on the type of project and technology made before any designers are contracted
- Flexibility for the builders to vary from the design, so that in practice the design only covers 60-80% of the design, as 100% design is impossible underground until one starts digging
- Moderate-size contracts (tens of millions of dollars or euros to very low hundreds), to allow more contractors to compete
- Limited use of consultants, or, if consultants are used, regular public-sector supervision
This is not entirely in pure contrast to the globalized system, which centers the needs of large multinationals. The large multinationals prefer large-size fixed-price design-build contracts with early contractor involvement and extensive reliance on consultants, but they also prefer technical scoring, which makes them feel like racing to the top rather than the bottom.
This is also not always traditional. In the United States, for example, there is no tradition of technical scoring, itemization of costs, or any flexibility for builders to vary from design. This is because American procurement laws and traditions go back to the Progressive Era, when lowest-bid contracts were thought to be a good government innovation; as it is, American law permits technical scoring as the law states lowest responsible bid, but it’s almost never used, and never to the full extent, so the tradition remains lowest-bid.
The evolution of project delivery in Scandinavia
Traditional Nordic subway infrastructure project delivery was largely in line with the above outline of good practices. However, two variations are notable, one small and one large.
The small variation is that Nordic governments have been happier to outsource operations and even some construction design to private contractors than governments in the rest of Europe; in Finland, project delivery was largely done by private consultants, but under public-sector supervision, with institutional knowledge retained in government agencies even in an environment of privatization.
The large variation is that the risk allocation did not, in practice, permit flexibility for the building contractors. The traditional implementation of design-bid-build assigned the risk to the build contractors if they made any change to the design and to the design contractors if the build contractors made no such changes. This led to defensive design: the build contractors never varied from the design, and the design contractors knew this and prescribed some overbuilding to account for risks that could be discovered later in the process, for example grouting tunnels that might not be necessary. It’s this conflict, driving up costs in Oslo, that contributed to the acceptance of design-build in Scandinavia.
But it wasn’t just the failure of one of the features of the otherwise good project delivery system. It was British soft power, and the perception that English-speaking multinational consultants with extensive experience in megaprojects that use consultants knew better than the Swedish or Danish or Finnish or Norwegian state. There was limited attention in the Nordic procurement strategy to largely traditional Germany, which does not exert this soft power on countries that are richer than Germany and speak English and not German, let alone Southern Europe, which Northern Europe constantly looks down on.
In this sense, Sweden has not been too different from France. France, too, began implementing globalized system features under the soft power of English-speaking multinationals; for all of their frothing at the mouth about France’s superiority to the UK and US, the top 1% of France wish they were the top 1% in a higher-inequality country like the US, and are happy with privatization. And in both France and Sweden, the process is being halted as its poor results are visible; Swedish public transport watchers are already noticing how the emerging system is based on the needs of large multinationals and not those of society, and in France, the delivery of Grand Paris Express in a UK/US-style single-purpose delivery vehicle (SPDV) turned into a permanent institution to build suburban rail extensions throughout France.
The invention of itemization in Italy
Italy is the only case I’m aware of in which there was a large systemic reduction in the cost of subway construction. This occurred in the environment of mani pulite, in which outrage over the endemic corruption of the Cold War-era Italian state led to massive, mediagenic investigations, forcing former Prime Minister Bettino Craxi into exile, putting half of parliament under indictment, and destroying all major political parties. The remnants of the communist party (PCI), the largest and most moderate in Europe, formed the new center-left, the present-day Democratic Party (PD); on the right, the dominant element in the coalition was previously nonpartisan media mogul Berlusconi and later the coalescence of fringe far right parties into more serious conservative blocs, currently Fratelli d’Italia (FdI).
In Italian historiography, mani pulite is rather bittersweet. Berlusconi himself was openly corrupt, and used his media influence to shut down the investigations before they could get to him as he entered politics, since he too had been involved in the corruption of the 1980s, including influence peddling with Craxi. I analogize it to civil rights in the United States, in which by the late 1960s, early-1960s optimism about ending racism was dashed, and the civil rights laws and court rulings led to a backlash symbolized by the election of Richard Nixon on a law-and-order platform. But just as the racial wage gaps in the United States markedly fell in the 1960s-70s, so did Italian infrastructure corruption levels markedly fall in the 1990s due to the legislation passed in the wake of mani pulite.
The history of itemization in Italy goes back to those post-mani pulite reforms. By the 1990s, it was clear that fighting corruption required extensive sunshine, as well as a proactive apolitical state willing to put people in prison; this was the same era of prosecutors and judges putting Cosa Nostra leaders in prison, with some being assassinated during trial and many of the others having to hide out for the duration. One can’t privatize the state in face of the mafia. The upshot is that instead of American-style rules and traditions aiming to solve the problems of the late 19th century, Italian public procurement law aims to solve those of the late 20th century.
Implementing good project delivery practices
If there’s a common theme to the various elements of Southern European (and largely also French and German) urban rail procurement norms, it’s that they require an expert civil service. Teams of engineers, planners, architects, procurement experts, and public-sector project managers are required to manage such a system, and they need to be empowered to make decisions.
This empowerment contrasts with American public-sector norms, in which to a small extent in law and to a very large extent in political culture, civil servants are constantly told that they are dregs and cannot make any decisions. Instead, they are bound by red tape requirements that can only be waived if a political appointee wants to take the risk. The United Kingdom is similar, except without the political appointees, so ministerial approval is required. Everything below that level is designed to avoid change and avoid any decisionmaking. The role of the public-sector engineer in these societies is to prostrate before the political advisor who went to the right elite universities and went through the right pipelines. The idea of listening to engineers and planners is denigrated as siloing, whereas generalist managers with little knowledge are elevated to near-godhood. Much of the growth of the globalized system in these environment comes from the fact that in privatizing planning to multibillion-dollar design-build contracts, the only public-sector decisions are made at the level of a top political leader, such as a governor, without having to deal with civil servants.
In contrast, it is less important how many civil servants are hired to supervise contracts than that they have the authority to make judgment calls and that they do not have to answer to an overclass of generalist managers. Italy and France use very large bureaucracies of planners and engineers at Metropolitana Milanese and RATP respectively, but Nordic planning always used smaller teams with more use of consultants under client supervision. In this sense, the fact that a Swedish procurement civil servant who didn’t know me was willing to tell me on the record that functional procurement doesn’t work speaks louder than any organization chart; in the United States, civil servants would never criticize their own organizations’ plans so openly.
Once the civil servants can make decisions and supervise contractors, they can look at bids and score them technically, or delve through itemized lists, or oversee changes and make quick yes-or-no decisions as the builders are forced to vary from the design. With such tight project management, they do with one dollar what 10 years ago New York procurement did with two, and what today New York does with more than two, making this the most significant single intervention in reducing infrastructure construction costs.
The Meaning of Construction Costs Per Rider
I’ve written a lot about urban rail construction costs per kilometer, but from time to time, my colleagues and I have been asked about what happens if we compare costs, not per kilometer, but per rider. There’s an intuition among people in transportation advocacy (including anti-transit activists who prefer cars) that the construction costs of urban rail lines per rider are a meaningful measure of cost-effectiveness. This intuition is true, and yet, it must be interpreted delicately.
First, modes of transit with different operating cost structures should tolerate different levels of capital costs; in particular, the current practice in which subways are built at higher cost per rider than light rail, which in turn is built at higher cost than bus lanes, reflects real differences in operating costs and does not mean there is overinvestment in subways and underinvestment in buses. And second, costs per rider can be too low, in a sense – if a city’s construction costs per rider are very low, indicating a very high benefit-cost ratio, then it shouldn’t be lauded for its fiscal prudence but scolded for not having built these lines long ago and for not building more today. In truth, places with healthy decisionmaking about infrastructure expand their networks to the limit of cost-effectiveness, which means that costs per rider averaged over an entire region vary less than costs per kilometer, and this just reflects that cities build what they can, so low-cost cities can afford to build lines to lower-ridership areas, which higher-cost cities would reject as too expensive for the benefit. This way, costs per rider are not too different in New York and in cities that build for an order of magnitude lower cost per km than New York.
The meaning of cost per rider
In the remainder of this post, the meaning of “cost per rider” is “cost divided by the ridership on a working day.” In Europe, workers get around six weeks of paid vacation, and tend to take them in the summer, leading to depressed ridership around July or August, depending on the city; daily counts usually avoid this period, so for example Stockholm specifies that daily ridership figures are taken in winter. This, as I will explain shortly, does not unduly make European lines look more cost-effective than they actually are.
The cost per rider is best understood as a cost-benefit measurement. All benefits of public transportation scale with ridership, generally linearly: higher ridership indicates tighter economic and social ties if it comes from more travel, and better environmental outcomes if it is at the expense of car travel. What’s more, raw ridership measured in trips is better at capturing these benefits than passenger-km. The issue is that focusing on p-km overrates the success of extremely suburban systems, which have low environmental benefits for their p-km (the users are typically park-and-riders and therefore drive extensively, just not to their city center jobs) and usually also high net operating costs since they are peaky and tend to charge low per-p-km fares. Conversely, the short-hop trip is a net profit to the system – even subways with distance-based fares charge degressive rather than linear fares – and comes from dense networks that cut out car-based travel entirely. These effects roughly cancel out to the point that ridership is a good proxy for actual benefits.
That said, all outcomes need to be scaled to regional or even national incomes. Economic benefits are usually measured relative to worker wages anyway; in some business case analyses, such as that of the United Kingdom, the economic benefit is even scaled to rider income rather than regional or national income, which favors lines built to rich neighborhoods over lines built to poor ones, and isn’t really how cities need to think about their public transit networks. Social benefits are usually taken on a willingness-to-pay basis, and the same is true of health benefits including reduced air and noise pollution from cars and reduced car accidents.
The next step is then to compare the cost per rider with GDP per capita, which is not perfect but is good enough as a proxy for incomes. This also takes care of the issue of Europe’s synchronized summer troughs in local travel: those six weeks of paid vacation are visible in reduced GDP per capita, so the apparent bonus to the European system of using cost per daily trip where “day” means “workday outside the summer vacation season” rather than cost per annual trip cancels out with reduced annual GDP per capita.
The rough rule of thumb I use is that the absolute limit of cost-effectiveness for a subway or commuter rail line is when the cost per rider is equal to GDP per capita. This is a coincidence: a one-time cost has no reason to be equal to an annual income – this just follows from Börjesson-Jonsson-Lundberg’s estimate of the Stockholm Metro’s benefit-cost ratio compared with its cost per rider relative to the GDP per capita of 1960s’ Sweden. In practice, infrastructure is never built down to a benefit-cost ratio of 1, due to construction risks; in countries that make decisions based on benefit-cost analyses, the minimum is usually 1.2 or 1.3. In this schema, the United States can afford to build up to an envelope of $85,373/1.3 to $85,373, which is $65,000-70,000/rider in 2024 prices. The frontier lines, like the Interborough Express, are fairly close to this limit already; in practice, there’s a range, with some lines in the same city built well over the limit for political reasons (often airport connectors) and others built far below it.
Cost per rider by mode
The above analysis works for subways and commuter rail. It does not work for trams or buses. The reason is that surface transit never achieves the same low operating costs as metros, so in practice, the total cost to be truly comparable needs to be incremented by the additional operating costs.
To be clear, this is just a rule of thumb. There are different metro lines, even with the exact same technology in the same city, with different projected operating cost profiles; for example, in Vancouver, the Broadway extension of SkyTrain toward UBC was projected in the 2010s to reduce net operating costs as many buses would be replaced by fewer, larger trains, but the outward extension of the same system deeper into Surrey and Langley is projected to increase net operating costs. There are different ways to interpret this – for example, the Surrey extension is in a more auto-oriented area, with more likely car-to-train switchers (this is still much denser than an American park-and-ride); on net, though, I think the differences are not huge and could to an extent even be folded into the notion of cost per rider, which is substantially better on Broadway than in Surrey and Langley.
That said, metros consistently have much lower operating costs than light rail and buses in the same city; here are American cost profiles. As far as I can tell from CoMET data, most European and Asian metros cluster toward the bottom end of the American cost profile (such as the Chicago L; the New York City Subway is the top end among the big systems); bus operating costs are more or less proportional to driver wages times operating hours throughout the developed world. Here we need to briefly switch to cost per p-km, since mature urban rail networks use buses as short-hop feeders – the counterfactual to a bus-based network for New York isn’t people riding the same bus routes as today but at higher intensity, but people riding longer bus routes, so the cost would roughly scale to cost per p-km, not per passenger.
In rich Asia, metros are profitable. In Europe, it depends – the London Underground operationally broke even in the early 2010s, and the Berlin U-Bahn was said to do the same in the late 2010s. In healthy European systems, it’s never reported directly, since there’s fare integration across the region, so financial data are reported at metropolitan scale without much breakdown between the modes, but the farebox operating ratios in at least Germany and Scandinavia, and probably also Paris (which has much higher ridership density than London or Berlin, comparable costs per car-km, and higher fares than pre-2022 Berlin), suggest that metros and the inner sections of commuter rail systems can break even, and then the subsidies go to the buses and to suburban extensions.
Individual bus systems can be profitable, but never at metropolitan scale, not in the first-world cities I’m aware of. In New York, the buses between New Jersey and Manhattan are profitable and run by private companies, but that’s one specific section of the system, and on net the bus system in New Jersey, including not just these cross-tunnel buses but also internal buses within the state, loses money, covered by New Jersey Transit subsidies, and the financial performance of buses within New York is, frankly, terrible.
One potential complication is that BRT infrastructure is usually installed on the highest-performing individual routes, and those can have rather low operating costs. But then, the operating costs of the buses on Broadway in Vancouver are extraordinarily low, and still the projections are for the SkyTrain extension that would replace them to, on net, reduce systemwide operating subsidies. If your city has a bus corridor so strong that ordinary BRT would be profitable, the corridor has high enough ridership for a subway.
Light rail is essentially a via media between metros and buses: higher operating costs than metros, in theory lower ones than buses. I say in theory, because in the United States, light rail as a mode comprises different things, some behaving like lower-efficiency subways with shorter cars like the Boston Green Lines, and others running as mostly grade-separated urban rail in cities like the Los Angeles and Portland cities with extremely low ridership and high resulting operating costs. But a light rail system with serious ridership should comfortably obtain better operating outcomes than buses, if worse ones than metros.
Costs per rider can be too low
In New York, as mentioned above, the current urban rail extensions under construction (Second Avenue Subway Phase 2) or discussion (Interborough Express) have costs not far from the frontier relative to American incomes. In Berlin, the extensions instead are far cheaper; U8 to Märkisches Viertel was projected to cost 13,160€ per daily rider in 2021, which is a fraction of Germany’s GDP per capita.
This does not mean Berlin builds cost-effectively. It means Berlin builds too little. A line that costs less than one third the country’s GDP per capita should have been built when the GDP per capita was one third what it is now. If there are a lot of such possibilities in the city, it means there was a crisis it’s only now recovering from or there has been too much austerity, or both, in the case of Berlin.
Healthy construction environments – that is, not Germany, which has normal costs per kilometer and chooses to barely build intercity or urban rail – will instead build to the frontier of what’s cost-effective. In New York, it’s Second Avenue Subway; in Madrid, it’s extensions into deep suburbia making the system almost as long as that of New York, on one third the metro area population. Rational yes/no decisions on whether to build at all can coexist with good construction practices or with deeply irrational ones.
American Myths of European Poverty
I occasionally have exchanges on social media or even in comments here that remind me that too many people in the American middle class believe that Europe is much poorer than the US. The GDP gap between the US and Northern Europe is small and almost entirely reducible to hours worked, but the higher inequality in the US means that the top 10-20% of the US compare themselves with their peers here and conclude that Europe is poor. Usually, it’s just social media shitposting, for example about how store managers in the US earn the same as doctors in Europe. But it becomes relevant to public transit infrastructure construction in two ways. First, Americans in positions of authority are convinced that American wages are far higher than European ones and that’s why American construction costs are higher than European ones. And second, more broadly, the fact that people in positions of authority really do earn much more in the US than here inhibits learning.
The income gap
The United States is, by a slight amount, richer than Northern Europe, which for the purposes of this post comprises the German-speaking world, the Nordic countries, and Benelux. Among the three largest countries in this area, Germany is 16.5% poorer than the US, the Netherlands 8.3% poorer, Sweden 14.3%. This is more than anything an artifact of shorter working hours – Sweden has an ever so slightly larger GDP per hour worked, the other two are 6-7% poorer per hour worked. All three countries have a much higher 15-64 labor force participation rate than the US, but they’re also older, which in the case of Germany actually gets its 15+ rate to be a hair less than the US’s. But there’s much more part-time work here, especially among women, who face large motherhood penalties in German society (see figures 5-7 in Herzberg-Druker, and Kleven et al). Germany is currently in full employment, so it’s not about hidden part-time work; it’s a combination of German-specific sexism and Europe-wide norms in which workers get around six weeks of paid vacation per year.
One implication of the small gap in income per hour is that wages for the same job are likely to be similar, if the jobs pay close to the mean wage. This is the case for tunnel miners, who are called sandhogs in the United States: the project labor agreements in New York are open – the only case in which itemized costs are publicly available – and showcase fully-laden employment costs that, as we document in our construction costs reports, work out to around $185,000/year in 2010 prices; there is a lot of overstaffing in New York and it’s disproportionately in the lower-earning positions, and stripping those, it’s $202,000/year. I was told that miners in Stockholm earn 70,000 kronor/month, or about $100,000/year in PPP terms (as of 2020-1), and the fully-laden cost is about twice that; a union report from the 2000s reports lower wages, but only to about the same extent one would expect from Sweden’s overall rate of economic growth between then and 2021. The difference at this point is second-order, lower than my uncertainty coming from the “about” element out of Sweden.
While we’re at it, it’s also the case for teachers: the OECD’s Education at a Glance report‘s indicator D3 covers teacher salaries by OECD country, and most Northern European countries pay teachers better than the US in PPP terms, much better in the case of Germany. Teacher wage scales are available in New York and Germany; the PPP rate is at this point around 1€ = $1.45, which puts starting teachers in New York with a master’s about on a par with their counterparts in the lowest-paying German state (Rhineland-Pfalz). New York is a wealthy city, with per capita income somewhat higher than in the richest German state (Bavaria), but it’s not really seen in teacher pay. I don’t know the comparative benefit rates, but whenever we interview people about European wage rates for construction, we’re repeatedly told that benefits roughly double the overall cost of employment, which is also what we see in the American public sector.
The issue of inequality
American inequality is far higher than European inequality. So high is the gap that, on LIS numbers, nearly all Western European countries today have lower disposable income inequality than the lowest recorded level for the US, 0.31 in 1980. Germany’s latest number is 0.302 as of 2021, and Dutch and Nordic levels are lower, as low as 0.26-0.27; the US is at 0.391 as of 2022. If distributions are log-normal (they only kind of are), then from a normal distribution log table lookup, this looks like the mean-to-median income ratios should be, respectively, 1.16 for Germany and 1.297 for the US.
However, top management is not at the median, and that’s the problem for comparisons like this. The average teacher or miner makes a comparable amount of money in the US and Northern Europe. The average private consultant deciding on how many teachers or miners to hire makes more money in the US. A 90th-percentile earner is somewhat wealthier in the US than here, again on LIS number; the average top-1%er is, in relative terms, 50% richer in the US than in Germany (and in absolute terms 80% richer) and nearly three times as rich in the US as in Sweden or the Netherlands, on Our World in Numbers data.
On top of that, I strongly suspect that not all 90th percentile earners are created equal, and in particular, the sort of industries that employ the mass (upper) middle class in each country are atypically productive there and therefore pay better than their counterparts abroad. So the average 90th-percentile American is noticeably but not abnormally better off than the average 90th-percentile German or Swede, but is much better off than the average German or Swede who works in the same industries as the average 90th-percentile American. Here we barely have a tech industry by American standards, for example; we have comparable biotech to the US, but that’s not usually where the Americans who noisily assert that Europe is poor work in.
Looking for things to mock
While the US is not really richer than Northern Europe, the US’s rich are much richer than Northern Europe’s. But then the statistics don’t bear out a massive difference in averages – the GDP gap is small, the GDP gap per hour worked is especially small and sometimes goes the other way, the indicators of social development rarely favor the US, immigration into Western Europe has been comparable to immigration to the US for some time now (here’s net migration, and note that this measure undercounts the 2022 Ukrainians in Germany and overcounts them in Poland).
So middle-class Americans respond by looking for creative measures that show the level of US-Europe income gap that they as 90th-percentile earners in specific industries experience (or more), often dropping the PPP adjustment, or looking at extremely specific things that are common in the US but not here. I’ve routinely seen American pundits who should know better complain that European washing machines and driers are slow; I’m writing this post during a 4.5-hour wash-and-dry cycle. Because they fixate on proving the superiority of the United States to the only part of the world that’s rich enough not to look up to it, they never look at other measures that might show the opposite; this apartment is right next to an elevated train, but between the lower noise levels of the S-Bahn, good insulation, and thick tilt-and-turn windows, I need to concentrate to even hear the train, and am never disturbed by it, whereas American homes have poor sound insulation to the point that street noise disturbs the sleep.
Learning to build infrastructure
The topline conclusion of any American infrastructure reform should be “the United States should look more like Continental Europe, Turkey, non-Anglophone East Asia, and the better-off parts of Latin America.”
If it’s written in the language of specific engineering standards, this is at times acceptable, if the standards are justified wholly internally (“we can in fact do this, here’s a drawing”). Even then, people who associate Americanness with their own career success keep thinking safety, accessibility, and similar issues are worse here, and ask “what about fire code?” and then are floored to learn that fire safety here is actually better, as Stephen Smith of Market Urbanism and the Center for Building constantly points out.
But then anything that’s about management is resisted. It’s difficult to convince an American who’s earning more than $100,000 a year in their 20s and thinks it’s not even that much money because their boss is richer that infrastructure project management is better in countries where the CEO earns as much money as they do as an American junket assistant. Such people readily learn from rich, high-inequality places that like splurging, which are not generally the most productive ones when it comes to infrastructure. Even Americans who think a lot about state capacity struggle with the idea that Singapore has almost as high construction costs as the US; in Singapore, the CEO earns an American salary, so the country must be efficient, right? Well, the MRT is approaching $1 billion/km in construction costs for the Cross-Island Line, and Germany builds 3 km of subway (or decides not to build them) on the same budget and Spain builds 6 km, but Europe is supposedly poor and Americans can’t learn from that.
The upshot is that even as we’re seeing some movement on better engineering and design standards in the United States, resulting in significant cost savings, there’s no movement for better overall management. Consultant-driven projects remain the norm, and even proposals for improving state capacity are too driven by domestic analysis without any attempt at international learning or comparativism. Nor is there any effort at better labor efficiency – management in the US hates labor, but also thinks it’s entirely about overpaid workers or union safety rules, and doesn’t stoop to learn how to build more productively.
Costs Per Rider and Willingness to Build
At the Transit Costs Project, we study the costs of urban rail lines per kilometer. This, with our usual controls, is a rough indicator of how efficient a city’s infrastructure construction program is. However, cost-effectiveness is different from efficiency, and is better measured not by just the cost but also the benefits, which are measured by ridership. Thus, cost-effectiveness is best measured by the cost of each project per rider. So what does it mean to compare different cities by their costs per rider, rather than per kilometer?
The answer is, “not much,” at least not as far as efficiency or good decisionmaking. In fact, while some projects persistently have costs per rider that are too high to be cost-effective (for example, it’s endemic to airport extensions), some cities have costs per rider that are too low, such as Berlin. The issue here is that if municipal or state decisionmaking is healthy, it will build cost-effective lines; if a line under discussion has a very high benefit-cost ratio, or equivalently a very low cost per rider, it means it should have been built long ago, and it speaks poorly to the local decisionmaking that it hasn’t been built already, as is unfortunately the case in Berlin.
Cost per rider and cost-effectiveness
As always, let’s start with Second Avenue Subway Phase 1, the project that launched my interest in construction costs and the Transit Costs Project writ large. The projected daily ridership is 202,000; the line came close to it in 2019, reaching about 163,000 (see data here; I’m taking boardings for the three new stations, adding the growth in ridership at Lexington/63rd, and multiplying by two to account for disembarkings), and would have likely reached projection by now but for the pandemic. The cost, in 2023 dollars, was $6.23 billion, or about $31,000 per projected weekday trip.
For another anchoring number, let’s use the Stockholm Metro’s entire construction from the 1940s to the 1970s. This is useful because in addition to costs per rider, there is a published ex post benefit-cost ratio, thanks to the work of Maria Börjesson. The cost of that system, in 2023 PPP dollars, was $3.7 billion, with a ridership of 1,265,900 per workday in 2019, or $2,900/rider, while the benefit-cost ratio is 6 without taking agglomeration into account, or 8.5 with. This does not mean that the value of a rider is only about $24,900; this was the value in the economic situation of postwar Sweden, a country that was substantially poorer than the Sweden of today. In 2023 PPP terms, Sweden’s GDP per capita in 1965, about midway through the opening of the original system, was about $19,400; today, Sweden is 3.5 times richer, and the US is 17% richer than Sweden.
The benefits of urban travel are largely proportional to GDP per capita. The economic benefits of agglomeration are proportional to the value of the economy writ large, and so are the benefits of reduced travel time, which in benefit-cost analyses are usually taken to be proportional to the average hourly wage. Conversely, the ability of a government to spend money on desired outcomes is proportional to its tax base, i.e. the size of its economy. All of this is approximate, but all we’re doing is first-order approximate analysis anyway, and so correcting for GDP per capita is valuable.
As it is, the difference between American and Swedish GDP per capita boils down entirely to working hours. Swedes work shorter hours than Americans, as they, like nearly everyone else in Europe, get much longer vacation time; as of 2022, Sweden’s GDP per hour worked was, by a rounding error, slightly higher than the US’s. However, at the same time, the daily ridership numbers for Sweden are specifically drawn from winter workday ridership, to avoid reporting figures from when ridership is lower during the summer vacation season, and the same is true for daily ridership counts in France. If we give Sweden and France credit by looking at ridership when people aren’t on vacation, we must compare the cost per rider with GDP per capita and not GDP per hour.
The upshot is that countries should be building metros up to a maximum capital cost per rider that’s about as large as their GDP per capita. The $24,900 computation for 1960s’ Sweden is ex post, and usually the ex ante benefit-cost ratio must be at least 1.2 or 1.3 for the project to go ahead due to risk. For light rail the allowable cost should be lower, and for bus projects it should be lower still, due to the higher lifetime operating costs; but for metros and metro-like urban rail projects (such as largely grade-separated light rail, or commuter rail tunnels like Citybanan), this analysis should hold. Second Avenue Subway Phase 1, which opened in a United States with a GDP of $73,300/capita in 2023 prices, is thus very cost-effective; Phase 2, budgeted at something like $70,000/rider in today’s prices, is marginal but makes it (in 2022, US GDP per capita in 2023 prices was $80,300).
Some more costs per rider
Our database of construction costs per km is largely complete, but we don’t have much ridership data. Worse, the costs per rider we do have have some biases. We have better information for the US and Canada than elsewhere, and for Europe than the rest of the non-North American world. Costs are also likeliest to be reported for megaprojects with notable delays or cost overruns and thus an incomplete database will be biased upward; large, international cities have better reporting in English than the rest and this introduces another upward bias in incomplete data (these are typically wealthy and therefore capable of affording a high cost per rider).
With that in mind, here are some (again, incomplete) examples:
- Crossrail cost $24 billion in 2023 PPP terms; ridership in late 2023 was 4.3 million a week, which is usually about 700,000/weekday, said to be above projections, with long-term projections rising to a million/weekday; on current ridership it’s $34,000/rider, and on future projections it’s $24,000.
- Paris Métro Line 14’s original section, opened by 2007, cost $2.44 billion in 2023 PPP terms; ridership in 2019, before more recent extensions and before corona, was 92 million, so around 320,000 per workday, which is $7,600/rider.
- Grand Paris Express was projected in 2021 to cost (in 2023 PPP dollars) around $65 billion, with a ridership projection of 2 million/day from 2022, and 2.3-2.4 million/day from 2012, for around $32,000/rider, or $28,000 if the older ridership projection is used.
- Milan Metro Line 5 cost $2.2 billion in 2023 PPP terms to date, and was said to carry 180,000 daily passengers in 2019, for $12,000/rider.
- Milan Metro Line 4 cost $2.63 billion, and was expected to carry 235,000 riders per day when complete, which would be $11,000/rider; it will be completed this year, but ridership so far is for only the half of the line that has opened so far ans is also still somewhat suffering from corona.
- The U-Bahn extensions in Berlin that are currently in development hell include U8 to Märkisches Viertel projected at 13,160€/rider (around $21,000 in 2023 PPP terms), a U6 extension to the former Tegel Airport projected at 27,200€/rider (around $43,000), and a U7 extension to the current BER airport projected at 23,000€/rider (around $36,000), among others brought up by the new coalition.
Willingness to build and Berlin’s problem
The above numbers should not be taken to mean that Italy and Germany are more cost-effective about metro construction. To the contrary, they indicate that they are leaving value on the table by not building.
Germany has a GDP per capita of $66,000 in PPP terms. The benefit-cost ratios of the U-Bahn extensions in Berlin that are being discussed but not actually brought forward and built are very high, and the U8 extension to Märkisches Viertel is scratching a ratio of 4. It is irresponsible that there isn’t a massive construction plan not just under discussion but in design and soon physical construction. This must include not just those lines but also others to be added until the benefit-cost ratio of the marginal line falls to slightly more than the minimum that deserves funding.
Italy has the same problem. No matter how pessimistic one’s view of the future of the economy of Italy is, the metro lines it is currently building, at least in Milan, are so cost-effective that there have to be more of them. In the 2010s, Italy was in a budget crunch and ended up using public-private partnerships to keep debt off-books, at very high implied interest rate based on the rate of payment to the concessionaire, about 8%. Today, fundamentally, even a stagnant economy with a GDP per capita of $55,000, which may finally overtake its 2007 peak this year, should be building more if the current extensive margin of Milan Metro construction is not even in the teens of thousands of dollars. Perhaps the benefit-cost ratios for Sweden rely not just on Sweden’s GDP per capita of the 1960s but on that of today, after 60 years of growth; but then even absent any of this growth, 55/3.5 > 12.
Paris showcases a healthier situation: the success of M14 endeared the region to driverless metros with longer interstations than the older metro lines but shorter ones than the RER, and with further growth in the region, the state decided to build the 200 km Grand Paris Express to improve circumferential rail service and add more fast radial connections from the suburbs to the city not along the RER. France’s GDP per capita is around $58,000 in PPP dollars; some elements of GPE may be marginal, but the project writ large has a solid benefit-cost-ratio starting with a 2.
Spain is like France in that when it can build, as it could before the Great Recession and as it can now after having recovered, it does. This is the right way to do it: low costs per km should translate to massive subway expansion. If you’re Madrid, you can build lines that would be completely ridiculous anywhere else in terms of land use, like MetroSur, because it’s cheap.
A Paris or Berlin cannot be so profligate as Madrid. Building a line like MetroSur here, which in the Spanish context looks silly but does pass cost-effectiveness muster, would be an economic albatross. But medium-cost cities can still cover most of the built-up area with subway and commuter rail lines; Paris is doing so but Berlin is not.
The problem for Berlin is not quite austerity, which afflicted Southern Europe last decade, producing negative economic growth. In the last coalition, it was the two most left-wing parties, the Greens and Die Linke, which opposed U-Bahn construction. In their view, trams are preferable; they complain about the high construction costs of subways, but don’t meaningfully engage with why they’re still necessary for fast urban transport beyond the range of the handful of inner neighborhoods where people vote for the Greens.
That said, in the current coalition, there’s no real political left. SPD is in it, but under an atypically conservative leader in Franziska Giffey, and the more left-wing faction in the party, including the youth league Jusos, is sidelined. Both parties in the coalition, CDU and SPD, are committed to building those U-Bahn extensions. But then nothing is happening; Giffey is not competent enough to do it, and CDU is too wrapped up in anti-environmental populism to do something that pisses off some environmentalists but makes others happy.
This way, the low costs per rider projected for Berlin U-Bahn expansion are not a testimony to cost-effectiveness. They’re a testimony to political unwillingness to build, for largely petty reasons. It is wasteful to build a subway line with a very high projected cost per rider relative to the country’s wealth, but it is equally wasteful not to build one with a low projected cost per rider, and the latter is what is happening in Berlin, unfortunately.
Quick Note: Heavy Touch and Control
There’s a distinction between light- and heavy-touch forms of management and control. Light-touch systems try to stay out of the details as far as they can; heavy-touch systems do the opposite. American business culture considers light touch to be superior, and I think this is especially prominent in the public sector, which has some ready-made examples of how the light touch approach works better – for example, in the military, it’s called mission command and is repeatedly shown to work better than more centralized command-and-control. Unfortunately, the same does not work for rail infrastructure. Why?
Heavy touch in infrastructure
In practice, a heavy-touch system in infrastructure construction, for example the way Germany, France, and Southern Europe work, has the following features:
- The state agency maintains control of designs, and even when it outsources something to consultants, it owns the product and may tweak it or assume that future contractors will tweak it. There is little privatization of planning.
- There is reluctance to devolve decisions to local governments; if SNCF or RENFE lets a regional government get involved in a rail plan, it’s because it’s an unprofitable regional line and the national railroad would rather not know it exists, and even DB happily unloads these same unprofitable regional lines on Land governments while focusing on intercity rail.
- Regulators are technical and make specific decisions.
This is not the only way to organize things, but it’s the only way that works. The Nordic countries have been moving away from this system in the last generation, influenced by British governing ideology; the sources I reference in the Stockholm case study repeatedly treat privatization as self-evidently good and exhort Nordic agencies to be more like the UK and less like Germany and Switzerland, and meanwhile, in the last 20 years Nordic costs have exploded while German ones have been fairly stable.
I’ve talked about the issue of privatization of the state to consultants many times, most recently a month ago. This post is about something different: it’s about how regulators work, an issue on which Sweden appears little different from Germany to me, and profoundly different from the United States and its can’t-do government.
American light touch elements
To understand how American regulations work, we need to look at the regulators and grant funders, that is, the Federal Transit Administration and Federal Railroad Administration, henceforth abbreviated FTA and FRA. How do they work?
- The chief regulators are never especially technical. The most sought after background, equivalent to a French grande école degree, is as far as I can tell a law degree from Yale. Engineers and planners always have to have a non-technical generalist watching over their shoulder, and this is the most prominent for the most politically sensitive projects.
- FTA/FRA reviewers are in some cases not even allowed to probe into the funding package they are to decide on. One of the biggest projects relevant to what we’ve studied at the Transit Costs Project and what I’ve written on this blog has a multi-billion dollar package, one that will almost certainly be only partially funded due to competing priorities, but the regulators are not allowed to see any itemized breakdown to see what partial funding would even do. Nor are regulators allowed to say which priorities to build first if there’s only partial funding.
- The higher regulators themselves believe that light-touch approaches are better and are reluctant to engage in any direct management – if they’d like to be more involved but are prohibited from doing so by the law or by constitutional interpretations, they have not said so.
- There is little churn between operations and regulations – in fact, this separation is treated as sacrosanct, even as in all other aspects the governing ideology calls for breaking down silos (and thereby disempowering specialists in favor of generalists). The contrast here is with Sweden, where state planners who worked on Citybanan, a state project, have since moved on to work for Stockholm County on the county-led Nya Tunnelbanan.
None of this works. The people who make the big decisions on funding in this system do not have the ability to make professional judgments, only political ones, and agencies know this and don’t bother with technical soundness.
Heavy touch and expertise
The connection between heavy touch and expertise is, you can’t manage things directly if you don’t have a lot of subject matter knowledge. In this sense, light touch may not necessarily be by itself bad, but rather, like design-build project delivery, it is in practice used to mask incompetence at the top level. The non-technical boss, who is in all but name a political commissar, can make vague proclamations, not get into details, and not feel like they’re out of their league and must defer to the engineer in the room.
Cost and Quality
From time to time, I see people assume that low-construction cost infrastructure must compromise on quality somehow. Perhaps it’s inaccessible: at a Manhattan Institute event from 2020, Philip Plotch even mentioned wheelchair accessibility as one factor leading to the increase in costs since the early 1900s; one of my long-term commenters on Twitter just repeated the same point. Perhaps the stations are cramped: I can’t count how many times I’ve heard the “transit riders deserve great stations” point from various Americans (there are several such examples in the thread in the last link alone), or for that matter from the people who built the Green Line Extension, and even Korean media got in on the action, falsely assuming that the spartan, brutalist stations of the Washington Metro were cheap (in fact, Washington is building an above-ground infill station for around an order of magnitude higher cost than Seoul’s cost for an underground infill station).
Please, stop.
If you want to know what very low-cost metro construction looks like, recall that the existing about 104 km (about 57 underground) Stockholm Metro was built in the middle of the 20th century for $3.6 billion in 2022 dollars. Here’s how the stations look:
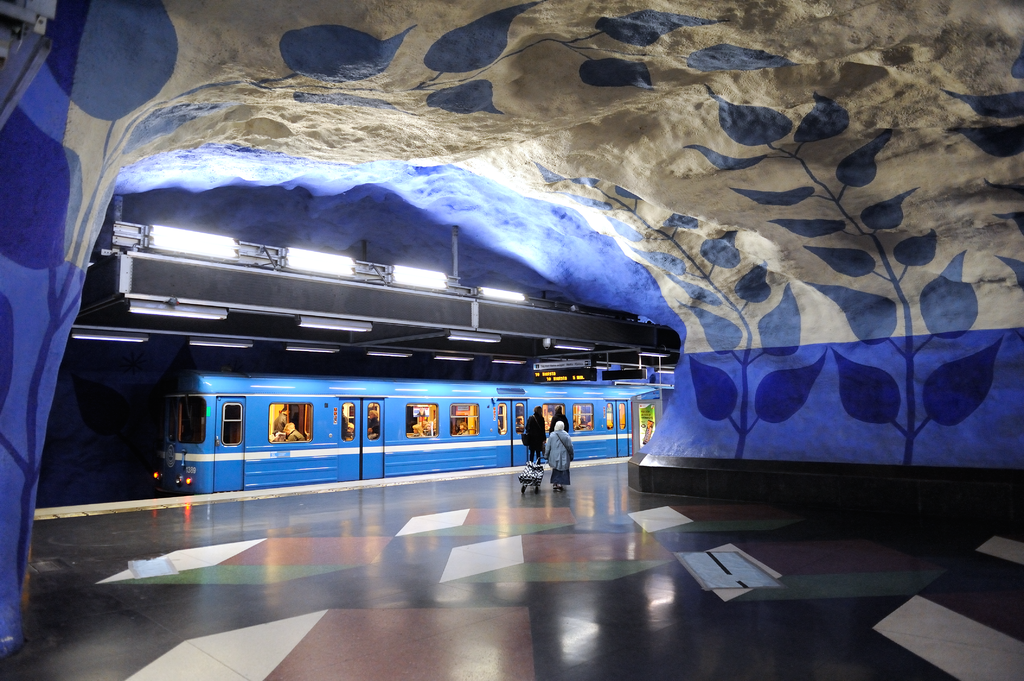
Stockholm is famous for its exposed rock: the hard gneiss forms natural arches, and the T-bana elected to paint it over from the inside, producing the bright blue-and-white contrast with dark blue leaf paintings depicted above at T-Centralen. The stations look drastically different from one another, with many examples available from UrbanRail.Net, Flickr user Dyorex, Flickr user Kotka Molokovich, and the travel site Walk Slow Run Wild.
Swedish construction costs today are several times higher, but remain below world average, and are nearly a full order of magnitude lower than in New York. The stations remain artistic, but this coexists with consistent, standardized engineering specs, modified based on local conditions only when necessary. Citybanan’s Odenplan is not at all spartan; the entire station, berthing 214 meter trains mined below the T-bana station by the same name, cost $250 million in 2022 dollars, which cost includes not just the station but also 2 km of mined tunnel. The data that I’ve seen while researching our Sweden case suggests that Nya Tunnelbanan station costs are dominated by civil infrastructure and not systems or finishes, which look like they’re about a quarter of overall station costs, rather than nearly half as in New York. Nice art is not expensive; for that matter, New York’s subway stations have pretty tiles, and this includes old stations predating the 1930s’ cost explosion.
Moreover, I doubt it was the case when the system was first built, but nowadays the entire T-bana is accessible to wheelchair users. In fact, a number of metro systems have made themselves fully accessible or are in the process of doing so, generally at low costs; I have some numbers from 2019, and the programs cited for Berlin and Madrid are behind schedule, but Berlin seems to be sticking to a budget of 2 million € for an ordinary station, and even taking into account inflation that Berlin needs one elevator per station and most cities need three, this isn’t quite $10 million per station, a cost similar to that of Madrid’s ongoing program. In New York, the cost cited for accessibility is $70 million per station.
What goes on here isn’t really a matter of high quality for high cost. In fact, when Eric, Elif, and I researched the New York case, we were stricken by how little of the problem concerned actual quality or safety regulations (for example, the fire code in New York in practice requires mezzanines at the depth of Second Avenue, but does not require them to be full-length). The oversize stations are neither grand public atria nor revenue-generating commercial spaces, but rather conventional stations flanked by excessive amounts of back office space. The lack of standardization concerns fittings, not art. The massive costs of New York elevator installation are barely about redundancy (a requirement driven by low but fixable reliability) and largely about utility conflicts, bad-and-worsening project delivery, and the soft costs crisis.
Making the user experience worse is an easy way to signal that one is cutting costs. It’s a combination of vice-signaling and prudence theater. It also has little to do with how actually low-cost infrastructure construction programs look like. They can be highly standardized even without the artistic component found in Sweden and Finland, and then people may complain that the system looks bland and corporate – but bland and corporate is not the same as spartan, it just means it looks like the 21st century and not the imagined 20th.
Good systems are certainly not willing to make compromises on human rights and build inaccessible infrastructure. In Seoul, there are massive protests by disabled people demanding that the Seoul subway go from 93% to 100% accessible and that the bus fleet immediately be transitioned to low-floor equipment, and meanwhile, New York and London both loiter around 25-30% accessibility. The conservative governments of the state and the city both dither, but past competence by Korea has led to high expectations by users, in the same manner that people in developed country protest inequality and poverty even fully knowing that it’s nowhere near as bad as in the third world. While I don’t know Seoul’s accessibility costs, I do know a deep-bored Line 9 extension with an undercrossing of Line 5 is budgeted at $180 million/km.
High Costs are not About Precarity
I’ve seen people who I think highly of argue that high construction costs in the United States are an artifact of precarity. The argument goes that the political support for public transportation there is so flimsy that agencies are forced to buy political support by spending more money than they need. This may include giving in to NIMBY pressure to use costlier but less impactful (or apparently less impactful) techniques, to spread money around with other government agencies and avoid fighting back, to build extravagant and fancier-looking but less standardized stations, and so on. The solution, per this theory, is to politically support public transportation construction more so that transit agencies will have more backing.
This argument also happens to be completely false, and the solution suggested is counterproductive. In fact, the worst cost blowouts are for the politically most certain projects; Second Avenue Subway enjoyed unanimous support in New York politics.
Cost-effectiveness under precarity
Three projects relevant to our work at the Transit Costs Project have been done exceptionally cost-effectively in an environment of political uncertainty: the T-bana, the LGV Sud-Est, and Bahn 2000.
T-bana
The original construction of the T-bana was done at exceptionally low cost. We go over this in the Sweden report to some extent, but, in short, between the 1950s and 70s, the total cost of the system’s construction was 5 billion kronor in 1975 prices, which built around 100 km, of which 57% are underground. In PPP 2022 dollars, this is $3.6 billion, or $35 million/km, not entirely but mostly underground. This was low for the time: for example, in London, the Victoria line was $122 million/km and the Jubilee line was $172 million/km (source, p. 78), and Italian costs in the 1960s and 70s were similar, averaging $129 million/km before 1970.
The era of Social Democrat dominance in Swedish politics on hindsight looks like one of consensus in favor of big public projects. But the T-bana itself was controversial. When the decision was made to build it in the 1940s, Stockholm County had about 1 million people; at the time, metros were present in much larger cities, like New York, London, Paris, Berlin, and Tokyo, and it was uncertain that a city the size of Stockholm would need such a system. Its closest analog, Copenhagen, did not build such a system until the 1990s, when it was a metro region of 2 million. It was uncertain that Stockholm should need rapid transit, and there were arguments for and against it in the city. Nor was there any transit-first policy in postwar Sweden: urban planning was the same modernist combination of urban renewal, automobile scale, and tower-in-a-park housing, and outside Stockholm County, the Million Program projects were thoroughly car-oriented.
Construction costs in Sweden are a lot higher now than they were in the 1950s, 60s, and 70s. Nya Tunnelbanan is $230 million/km, compared with a post-1990s Italian average of $220 million; British costs have exploded in tandem, so that now the Underground extensions clock at $600 million/km. Our best explanation is that the UK adopted what we call the globalized system of procurement, privatizing planning functions to consultants and privatizing risk to contractors, which creates more conflict; the UK also has an unusually high soft cost factor. From American data (and not just New York) and some British data, I believe that the roughly 2.5 cost premium of the UK over Italy is entirely reducible to such soft costs, procurement conflict, risk compensation, and excessive contingency. And yet, Sweden itself, with some elements of the same globalized system, maintains a roughly Italian cost level, albeit trending the wrong way.
And today, too, the politics of rail expansion in Sweden are uncertain. There was controversy over both Citybanan and Nya Tunnelbanan, neither of which passed a cost-benefit analysis (for reasons that I believe impugn the cost-benefit analysis more than those projects); it was uncertain that either would be funded. Controversy remained over plans to build high-speed rail connecting Stockholm with Gothenburg and Malmö, and the newly-elected right-wing government just canceled them in order to prioritize investment in roads. Swedish rail projects today remain precarious, and have to justify themselves on cost and efficiency grounds.
LGV Sud-Est
Like nearly all other rich countries, France was hit hard by the 1973 oil crisis; economic growth there and in the US, Japan, and most of the rest of Western Europe would never be as high as it was between the end of WW2 and the 1970s (“Trente Glorieuses“). On hindsight, France’s response to the crisis models can-go governance, with an energy saving ad declaring “in France we don’t have oil, but we have ideas.” The French state built nuclear power plants with gusto, peaking around 90% of national electricity use – and even today’s reduced share, around 70%, is by a large margin the highest in the world. At the same time, it built a high-speed rail network, connecting Paris with most other provincial cities at some of the highest average speeds outside China between major cities, reaching about 230 km/h between Paris and Marseille and 245 km/h between Paris and Bordeaux; usage per capita is one of the highest in Europe and, measured in passenger-km, not too bad by East Asian standards.
But in fact, the first LGV, the LGV Sud-Est, was deeply controversial. At the time, the only high-speed rail network in operation was the Shinkansen, and while France learned more from Japan than any other European country (for example, the RER was influenced by Tokyo rail operations), the circumstances for intercity were completely different. SNCF had benefited from having done many of its own experiments with high-speed technology, but the business case was murky. SNCF had to innovate in running an open system, with extensive through-running to cities off the line, which Japan would only introduce in the 1990s with the Mini-Shinkansen.
Within the French state, the project was controversial. Anthony Perl’s New Departures details how there were people within the government who wanted to cancel it entirely as it was unaffordable. At the end, the French state didn’t finance the line, and required SNCF to find private loans on the international market, though it did guarantee those loans. It also delayed the line’s opening: instead of opening the entire line from Paris to Lyon in one go, it opened two-thirds of it on the Lyon side in 1981 and the last third into Paris in 1983, requiring trains to run on the classical line at low speed between Paris and Saint-Florentin for two years; in that era, phased opening was uncommon, and lines generally opened to the end at once, such as between Tokyo and Shin-Osaka.
Construction was extraordinarily inexpensive. In PPP 2022 dollars, it cost $8.4 million/km. This is, by a margin, the lowest-cost high-speed rail line ever built that I know about. The Tokaido Shinkansen cost 380 billion yen, or in PPP 2022 dollars $40 million/km, representing a factor of two cost overrun that forced JNR’s head to resign. Spain has unusually low construction costs, and even there, Madrid-Seville was $15.7 million/km. SNCF innovated in every way possible to save money. Realizing that high-speed trains could climb steeper grades, it built the LGV Sud-Est with a ruling grade of 3.5%, which has since become a norm in and around Europe, compared with the Shinkansen’s 1.5-2%; the line has no tunnels, unlike the classical Paris-Lyon line. It built the line on the ground rather than on viaducts, and balanced cut and fill locally so that material cut to grade the line could be used for nearby fill. Thanks to the line’s low costs and high ridership, the financial return on investment for SNCF has been 15%, and social return on investment has been 30% (source, pp. 11-12).
This cost-effectiveness would never recur. The line’s success ensured that LGV construction would enjoy total political backing. The core features of LGV construction are still there – earthworks rather than viaducts, 3.5% grades, limited tunneling, overcompensation of landowners by about 30% with land swap deals to defuse the possibility of farmer riots. But the next few lines cost about $20 million/km or slightly less, and this cost has since crept up to about $30 million/km or even more. This remains low by international standards (but not by Spanish ones), but the trend is negative.
SNCF is coasting on its success from a generation ago, secure that funding for LGVs and state support in political contention is forthcoming, and the routing decisions have grown worse. In response to NIMBYism in Provence, the French state assented to a tunnel-heavy route, including a conversion of Marseille from an at-grade terminal to an underground through-station, akin to Stuttgart 21, which has not been done before in France, and the resulting high costs have led to delays on the project. Operations have grown ever more airline-style, experimenting with low-cost airline imitation to the point of reducing fare receipts without any increase in ridership. One of the French consultants we’ve spoken with said that their company’s third-party design costs are 7-8% of the hard costs, which figure is similar to what we’ve seen in Italy and to the in-house rate in Spain – but the same consultant told us that there is so much bloat at SNCF that when it designs its own projects, the costs are not 7% but 25%, a figure in line with American rates.
Bahn 2000
Switzerland has Europe’s strongest passenger rail network by all measures: highest traffic measured by passenger-km per capita, highest modal split for passenger-km, highest traffic density. Its success is well-known in surrounding countries, which are gradually either imitate its methods or, in the case of Germany, pretending to do so. It has achieved its success through continuous improvement over the generations, but the most notable element of this system was implemented in the 1990s as part of the Bahn 2000 project.
The current system is based on a national-scale clockface system (“Takt”) with trains repeating hourly, with the strongest links, like the Zurich-Bern-Basel triangle, running every half hour. Connections are timed in those three cities and several others, called knots, so that trains enter each station a few minutes before the connection time (usually the hour) and depart a few minutes after, permitting passengers to get between most pairs of Swiss cities with short transfers. Reliability is high, thanks to targeted investments designed to ensure that trains could make those connections in practice and not just in theory. Further planning centers adding more knots and expanding this system to the periphery of Switzerland.
Switzerland is famous for its consensus governance system – its plural executive is drawn from the four largest parties in proportion to their votes, with no coalition vs. opposition politics. But the process that led to the decision to adopt Bahn 2000 was not at all one of unanimity. There had been plans to build high-speed rail, as there were nearly everywhere else in Western Europe. But they were criticized for their high costs, and there was extensive center-right pressure to cut the budget. Bahn 2000 was thus conceived in an environment of austerity. Many of its features were explicitly about saving money:
- The knot system is connected with running trains as fast as necessary, not as fast as possible. Investments in speed are pursued only insofar as they permit trains to make their connections; higher speeds are considered gratuitous.
- Bilevel trains are an alternative to lengthening the platforms.
- Timed overtakes and meets are an alternative to more extensive multi-tracking of lines.
- Investment in better timetabling and systems (the electronics side of the electronics-before-concrete slogan) is cheaper than adding tunnels and viaducts.
Swiss megaprojects have to go to referendum, and sometimes the referendums return a no; this happened with the Zurich U-Bahn twice, leading to the construction of the S-Bahn instead. All Swiss planners know in a country this small and this fiscally conservative, any extravagance will lead to rejection. The result is that they’ve instead optimized construction at all levels, and even their unit costs of tunneling are low; thanks to such optimization, Switzerland has been able to build a fairly extensive medium-speed rail system, with more tunneling per capita than Germany (let alone France), and with two S-Bahn trunk tunnels in Zurich, where no German city today has more than one.
The American situation
The worst offenders in the United States are not at all politically precarious. There is practically unanimous consensus in New York about the necessity of Second Avenue Subway. At no point was the project under any threat. There is an ideological right in the city, rooted less in party politics and more in the New York Post and the Manhattan Institute, with a law-and-order agenda and hostility to unions and to large government programs, but at no point did they call for cancellation; the Manhattan Institute’s Nicole Gelinas has proposed pension cuts for workers and rule changes reducing certain benefits, but not canceling Second Avenue Subway.
At intercity scale, the same is true of Northeast Corridor investment. The libertarian and conservative pundits who say passenger rail is a waste of money tend to except the Northeast Corridor, or at least its southern half. When the Republicans won the 2010 midterm election, the new chair of the House of Representatives Transportation Committee, John Mica (R-FL), proposed a bill to seek private concessionaires to run intercity rail on the corridor. He did not propose canceling train service, even though in the wake of the same election, multiple conservative governors canceled intercity rail investments in their state, both high-speed (Florida) and low-speed (Wisconsin, Ohio).
In fact, both programs – New York subway expansion and the Northeast Corridor – are characterized by continuity across partisan shifts, as in more established consensus governance systems. The Northeast Corridor is especially notable for how little role ideological or partisan politics has played so far. New York has micromanagement by politicians – Andrew Cuomo had his pet projects in Penn Station Access and the backward-facing LaGuardia air train, and now Kathy Hochul has hers in the Interborough Express – but Second Avenue Subway was internal, and besides, political micromanagement is a different problem from political precarity.
And neither of these programs has engaged in any cost control. To the contrary, both are run as if money is infinite. The MTA would surrender to NIMBYs (“good neighbor policy”) and to city agencies looking to extract money from it. It built oversize stations. It spent money protecting buildings from excessive settlement that have been subsequently demolished for redevelopment at higher density.
The various agencies involved in the Northeast Corridor, likewise, are profligate, and not for lack of political support. Connecticut is full of NIMBYs; one of the consultants working on the plan a few years ago told me there was informal pressure not to ruffle feathers and not to touch anything in the wealthiest suburbs in the state, those of Fairfield County. In fact, high-speed rail construction would require significant house demolitions in the state’s second wealthiest town, Darien – but Darien is so infamously exclusive (“Darien rhymes with Aryan,” say other suburbanites in the area) that the rest of the region feels little solidarity with it.
NIMBYs aside, there has not been any effort at coordinating the different agencies in the Northeast along anything resembling the Swiss Takt system. This is not about precarity, because this is not a precarious project; this is about total ignorance and incuriosity about best practices, which emanate from a place that doesn’t natively speak English and doesn’t trade in American political references.
The Green Line Extension
Boston’s GLX is a fascinating example of cost blowouts without precarity. The history of the project is that its first iteration was pushed by Governor Deval Patrick (D), with the support of groups that sued the state for its delays in planning the project in the 1990s, as a court-mandated mitigation for the extra car traffic induced by the construction of the Big Dig. Patrick instituted a good neighbor policy, in which everything a community group wanted, it would get. Thus, stations were to become neighborhood signatures, and the project was laden with unrelated investments, called betterments, like a $100 million 3 km bike lane called the Somerville Community Path.
At no point in the eight years Patrick was in power was there a political threat to the project. It was court-mandated, and the extractive local groups that live off of suing the government favored it. The Obama administration was generous with federal stimulus funding, and the designs were rushed in order to use stimulus funding to pay for the project’s design, which would be done by consultants rather than with an expansion of in-house hiring. It’s in this atmosphere of profligacy that the project’s cost exploded to, in today’s money, around $3.5 billion, for 7 km of light rail in existing rights-of-way (albeit ones requiring overpass reconstruction).
The project did fall under political threat, after Charlie Baker (R) won the 2014 election. Baker’s impact on Massachusetts governance is fascinating, in that he unambiguously cut its budget significantly in the short run, but also had both before (as budget director in the 1990s) and during (through his actions as governor) wrecked the state’s long-term ability to execute infrastructure, setting up a machine intended to privatize the state and avoiding any in-house hiring. Nonetheless, the direct impact of precarity on GLX was to reduce scope: the betterments were removed and the stations were changed from too big to too small. The final cost was $2.3 billion, or around $2.8 billion in 2022 dollars, and half of that was sunk cot from the previous iteration.
There was no expectation that the project would be canceled – indeed, it was not. A Republican victory was unexpected in a state this left-wing. Then, as Baker was taking office, past governors from both parties expressed optimism that he would get not just GLX done but also the much more complex North-South Rail Link tunnel. Nor did contractors have their contracts yanked unexpectedly, which would get them to bid higher for risk compensation. Baker cold-shouldered not jut NSRL but also much smaller investments in commuter rail, but at no point was anyone stiffed in the process. No: the Patrick-era project was just poorly managed.
Project selection
As one caveat, I want to point out a place where precarity does lead to poor project cost-effectiveness: the project selection stage, in the context of tax referendums, especially in Southern California. None of this leads to high per-kilometer costs – Los Angeles’s are exactly as bad as in the rest of the United States – but it does lead to poor project selection, as an unintended consequence of anti-tax New Right politics.
The California-specific issue is that raising taxes requires a referendum, with a two-thirds vote. Swiss referendums are by simple majority, or at most double majority – but in practice most referendums that have a popular vote majority, even a small one, also have a double majority when needed, and in the last 15 years I believe the only two times they didn’t had the double majority veto overturning a 1.5% margin and a 9% margin.
California’s requirement of a two-thirds majority was intended to stop wasteful spending and taxation, but has had the opposite effect. In and around San Francisco, the voters are sufficiently left-wing that two-thirds majorities for social policy are not hard to obtain. But in Southern California, they are not; to build public transportation infrastructure, Los Angeles and San Diego County governments cannot rely on ideology, but instead cut deals with local, non-ideological actors through promising them a piece of the package. Los Angeles measures for transit expansion are, by share of money committed, largely not about transit expansion but operations, new buses, or leakage to roads and bridges; then, what does go to transit expansion is divvied by region, with each region getting something, no matter how cost-ineffective, while core improvements are neglected and so are cross-regional connections (since the local extractive actors aren’t going to ride the trains and can’t tell a circumferential project is useful for them).
This is not a US-wide phenomenon. It’s not even California-wide: this problem is absent from the Bay Area, where BART decided against an expansion to Livermore that was unpopular among technically-oriented advocates, and would like to build more core capacity if it could do so for much less than a billion dollars per km. New York does not have it at all (for one, it doesn’t require two-thirds majorities for budgeting).
At intercity scale, this precarity does cause Amtrak to maximize how many states and congressional districts it runs money-losing daily trains in. But wasting money on night trains and on peripheral regions is hardly a US-only problem – Japan National Railways did that until well past privatization, when its successors spun off money-losing branch lines to prefecture-subsidized third sector railways. This is not at all why there is no plan for Northeastern intercity rail that is worth its weight in dirt: Northeastern rail improvements have been amply funded relative to objective need (if not relative to American costs), and solid investments in the core coexist with wastes of money on the periphery of the network in many countries.
The issue of politicization
The precarious, low-cost examples all had to cut costs because of fiscal pressure. However, in all three, the pressure did not include any politicization of engineering questions. Sweden was setting up a civil service modeled on the American Bureau of Public Roads, currently the Federal Highway Administration, which in the middle of the 20th century was a model of depoliticized governance. France and Switzerland have strong civil service bureaucracies – if anything SNCF is too self-contained and needs reorganization, just not if it’s led by the usual French elites or by people from the airline industry.
Importantly, low-cost countries with more clientelism and politicization of the state tend to be more deferential to the expertise of engineers. Greece has a far worse problem of overreliance on political appointees than the United States, let alone the other European democracies; but engineering is somewhat of an exception. Hispanic and Portuguese-speaking cultures put great prestige on engineering, reducing the extent of political micromanagement, even in countries without strong apolitical civil service bureaucracies. Even in Turkey, the politicization of public transportation is entirely at macro level: AKP promises to prioritize investment in areas that vote for it and has denied financing to the Istanbul Metro since the city flipped to the opposition (the city instead borrows money from the European Investment Bank), but below that level there is no micromanagement.
The American examples, in contrast, show much more political micromanagement. This is part of the same package as the privatization of state planning in the globalized system; in the United States often there was never the depoliticization that most of the rest of the developed and middle-income world had, but on top of that, the tendency has been to shut down in-house planning departments or radically shrink them and replace them with consultants. The consultants are then supervised by political appointees with no real qualifications to head capital programs, and the remaining civil servants are browbeaten not to disagree with the political appointees’ proclamations.
Those political appointees rarely measure themselves by any criteria of infrastructure utility. Even in New York they and the managers don’t consistently use the system; in Los Angeles, they use it about as often as the executive director of a well-endowed charity eats at a soup kitchen. To them, the cost is itself a measure of success – and this is true of other agencies, which treat obtaining other people’s money as a mark of achievement and as testament to their power. This behavior then cascades to local advocacy groups, which try to push solutions that maximize outside funding and are at bet indifferent and at worst actively hostile to any attempt at efficiency.
Just giving more support to agencies in their current configuration is not going to help. To the contrary, it only confirms that profligacy gets rewarded. A program of depoliticization of the state is required in tandem with expanding in-house hiring and reversing the globalized system, and the political appointees and the managers and political advocates who are used to dealing with them don’t belong in this program.
Who Learns from Who?
My interactions with Americans in the transit industry, especially mainline rail, repeatedly involve their telling me personally or in their reports that certain solutions are impossible when they in fact happen every day abroad, usually in countries that don’t speak English. When they do reference foreign examples, it’s often shallow or even wrong; the number of times I’ve heard American leftists attribute cost differences to universal health care abroad (in most of these countries, employers still have to pay health benefits) is too high to count. Within the US, New York stands head and shoulders above the rest in its incuriosity. This is part of a general pattern of who learns from who, in which the US’s central location in the global economy and culture makes it collectively stupid.
Symmetric learning
Some learning is symmetric. The Nordic countries learn from one another extensively. The Transit Costs Project’s Sweden case study has various references in the literature to such comparisons:
- Eliasson-Börjesson-Odeck-Welde compare Sweden and Norway in the use of benefit-cost analyses for road projects.
- Smith-Sochor-Sarasini compare Sweden and Finland in Mobility as a Service.
- The Finnish transport ministry compares Finland’s public transport system with those of the other Nordic countries and a selection of other Northern European countries.
- The Nordic Council of Ministers has long worked on pan-Nordic horizontal ties; here is its report on investment in transport infrastructure.
- Södrström-Schulman-Ristimäki compare Stockholm and Helsinki’s urban forms.
- Nilsson-Nyström benchmark Sweden’s privatization of maintenance to Finland, the Netherlands, and Britain.
- LO’s report on labor rights and repression in Swedish tunnel projects compares the situation to that of Norway (where immigrant workers readily join unions) and Denmark (where they do at much lower rates, albeit higher than Sweden’s).
This goes beyond transportation. People in the four mainland Nordic states constantly benchmark their own national performance to that of the other three on matters like immigration, education, energy, corona, and labor. This appears in the academic literature to some extent and is unavoidable in popular culture, including media and even casual interactions that I had in two years of living in Sweden. Swedes who criticize their country’s poor handling of the corona crisis don’t compare it with Taiwan or South Korea but with Norway. Likewise, Swedes who think of a country with open hostility to immigration think of Denmark rather than, say, the United States, Italy, or Lithuania.
Other macro regions exist, too, with similar levels of symmetric learning. The German-speaking world features some of this as well: the advocacy group ProBahn has long championed learning from Switzerland and Austria, and the current Deutschlandtakt plan for intercity rail is heavily based on both Swiss practice and the advocacy of ProBahn and other technically adept activists. Switzerland, in turn, developed its intercity rail planning tradition in the 1980s and 1990s by adopting and refining German techniques, taking the two-hour clockface developed in 1970s Germany under the brand InterCity and turning it into a national investment strategy integrating infrastructure construction with the hourly timetable.
This, as in the Nordic countries, goes beyond transport. Where Swedes’ prototype for hostility to immigrants is Denmark, Germans’ is Austria with its much more socially acceptable extreme right.
Asymmetric learning
Most of the learning from others that we see is not symmetric but asymmetric: one place learns from another but not vice versa, in a core-periphery pattern. Countries and cities prefer to learn from countries that are bigger, wealthier, and culturally more dominant than they are. In our Istanbul case, we detail how the Turks built up internal expertise by bringing in consultants from Italy, Germany, and France and using those experiences to shape new internal practices.
In Europe, the biggest asymmetry is between Southern and Northern Europe. Few Spaniards, Italians, and Turks believe that their respective countries build higher-quality infrastructure than Germans – some readily believe that the costs are lower but assume it must be lower quality rather than higher efficiency. The experts know costs are low, but anything better from Northern Europe or France penetrates into Southern European planning with relative ease. It didn’t make it to the infrastructure-focused Italian case, but Marco Chitti documents how the German clockface schedule is now influencing Italian operations planning, for example here and here on Twitter. Spain’s high-speed rail infrastructure provides another example: it was deeply influenced by France in the 1990s, including the idea of building it, the technical standards and the (unfortunate) operating practices, but the signaling system is more influenced by Germany.
In contrast, in the other direction, there is little willingness to learn. Nordic capital planners and procurement experts cite other Northern European examples (in and out of Scandinavia) as cases to learn from but never Southern European or French ones. The same technically literate German rail activists who speak favorably of Swiss planning look down on French high-speed rail, and one American ESG investor even assumed Italy is falsifying its data. In the European core-periphery model, the North is the core and the South and East are the periphery, and the core will not learn from the periphery even where the periphery produces measurably better results.
Domestically, it’s often the case that smaller cities learn from larger ones in the same country. Former Istanbul Metropolitan staff members were hired by the state, and many staff and contractors went on to build urban rail projects in Bursa, İzmir, and Mersin. In France, RATP acts as consultant to smaller cities, which do not have in-house capacity for metro construction, and overall there is obvious Parisian influence on how such cities build their urban rail. In Italy, Metropolitana Milano has acted as consultant to other cities. This is the primary mechanism that makes construction costs so uniform within countries and within macro regions like Scandinavia.
In this core-periphery model, the Anglosphere is the global core, the United States views itself as its core (Britain disagrees but only to some extent), and New York is the core of the core. New Yorkers respond to any invocation of another city or country with “we are not [that country],” and expect that their audience will believe that New York is superior; occasionally they engage in negative exceptionalism, but as with positive exceptionalism, it exists to deflect from the possibility of learning.
This asymmetry may not be apparent in transportation – after all, Europe and Asia (correctly) feel like they have little to learn from the United States. But on matters where the United States is ahead, Europeans and Asians notice. For example, the US military is far stronger than European militaries, even taking different levels of spending into account – and Europeans backing an EU army constantly reference how the US is more successful due to scale (for examples, here, here, and here). Likewise, in rich Asia, corporations at least in theory are trying to make their salaryman systems more flexible on the Western model, while so little learning happens in the other direction that at no point did Europe or the US seriously attempt to imitate Taiwan’s corona fortress success or the partial successes of South Korea and Japan.
In this schema, it is not surprising that New York (and the United States more generally) has the highest construction costs in the world, and that London has among the highest outside the United States. Were New York and London more institutionally efficient than Italian cities, Italian elites would notice and adapt their practices, just as they have begun to adapt German practices for timetabling and intermodal integration.
Superficial learning
On the surface, Americans do learn from the periphery. There are immigrant planners at American transit agencies. There’s some peer learning, even in New York – for example, New York City Transit used RATP consultants to help develop the countdown clocks, which required some changes to how train control works. And yet, most of this is too shallow to matter.
What I mean by “shallow” is that the learning is more often at the level of a quip comment, with no followup: “[the solution we want] is being used in [a foreign case],” with little investigation into whether it worked or is viewed positively where it is used. Often, it’s part of a junket trip by executives who hoard (the appearance of) knowledge an refuse to let their underlings work. Two notable examples are ongoing in Boston and the Bay Area.
In Boston, the state is making a collective decision not to wire the commuter rail network. Instead, there are plans to electrify the network in small patches, using battery trains with partial wiring; see here and follow links for more background. Battery-electric trains (BEMUs) exist and are procured in European examples that the entire Boston region agrees are models for rail modernization, so in that sense, this represents learning. But it’s purely superficial, because nowhere with the urban area size of Boston or the intensity of its peak commuter rail traffic are BEMUs used. BEMUs trade off higher equipment cost and lower performance for lower infrastructure costs; they’re used in Germany on lines that run an hourly three-car train or so, whereas Massachusetts wants to foist this solution on lines where peak traffic is an eight-car train every 15 minutes.
And in San Jose, the plan for the subway is to use a large-diameter bore, wide enough for two tracks side-by-side as well as a platform in between, to avoid having to either mine station cavern or build cut-and-cover stations. This is an import from Barcelona Metro Lines 9 and 10, and agency planners and consultants did visit Barcelona to see how the method works. Unfortunately, what was missing in that idea is that L9 is by a large margin Spain’s most expensive subway per kilometer, and locally it is viewed as a failure. In Rome, the same method was studied and rejected as too risky to millennia-old monuments, so the most sensitive parts of Metro Line C use mined stations at very high costs by Italian standards. Barcelona’s use case – a subway built beneath a complex underground layer of older metro lines – does not apply to San Jose, which is building its first line and should build its stations cut-and-cover as is more usual.
No such superficiality is apparent in the core examples of both symmetric and asymmetric learning. Swedes, Danes, Finns, and Norwegians are acutely aware of the social problems of one another, and will not propose to adopt a system that is locally viewed as a failure. At most, they will propose an import that is locally controversial, with the same ideological load as at its home. In other words, if a Swede (or more generally a Western European) proposes to import a solution from another European country that is in its home strongly identified with a political party or movement, it’s because the Swede supports the movement at home. This can include privatization, cancellation of privatization, changes to environmental policy, changes to immigration policy, or tax shifts.
This includes more delicate cases. In general the US and UK are viewed as inegalitarian Thatcherite states in Sweden, so in most cases it’s the right that wants to Anglicize government practice. But when it comes to monetary policy, it was Stefan Löfven who tried to shift Riksbank policy toward a US-style dual mandate from the current single mandate for price stability, which the left views as too austerian and harsh toward workers; globally the dual mandate is viewed as more left-wing and so it was the Swedish left that tried to adopt it.
In contrast, in superficial learning, the political load may be the opposite of what it is in its origin country, because the person or movement who purport to want to import it are ignorant of and incurious about its local context. Thus, I’ve seen left-wing Americans proposing education reforms reinvent the German Gymnasium system in which the children of the working class are sent to vocational schools, a system that within Germany relies on the support of the middle-class right and is unpopular on the left.
Individual versus collective knowledge
Finally, I want to emphasize that the issue is less about individual knowledge and learning than about collective knowledge. Individual Americans are not stupid. Many are worldly, visit other countries regularly and know how things work there, and speak other languages as heritage learners or otherwise. But their knowledge is not transmitted collectively. Their peers view it at best as a really cool hobby rather than a key skill, at worst as a kind of weirdness.
For example, an American planner who speaks Spanish because they are a first- or second-generation Hispanic immigrant is not going to get a grant to visit Madrid, or for that matter Santo Domingo, and form horizontal ties with planners and engineers there to figure out how to build at low Spanish or Dominican costs. Their peers are not going to nudge them to tell them more about Hispanic engineering traditions and encourage them to develop their interests. American culture writ large does not treat them as benefiting from bicultural ties but instead treats them as deficient Americans who must forget the Spanish language to assimilate; it’s the less educated immigrants’ children who maintain the Spanish language. In this way, it’s not too different from how Germany treats Turks as a social problem rather than as valuable bicultural ambassadors to a country with four times Germany’s housing production and one third its metro construction costs.
Nor is experience abroad valued in planning or engineering, let alone in politics. A gap year is a fun experience. Five years of work abroad are the mark of a Luftmensch rather than valued experience on a CV, whereas an immigrant who comes with foreign work experience will almost universally find this experience devalued.
Even among the native-born, the standard pipelines through which one expresses interest in foreign ideas are not designed for this kind of learning. The United States most likely has the strongest academic programs in the world for Japanese studies, outside Japan itself. Those programs are designed to critique Japanese society, and Israeli military historian of Japanese imperialism Danny Orbach has complained that from reading much of the critical theory work on the country one is left to wonder how it could have ever developed. It goes without saying such programs do not prepare anyone to adapt the successes of the big Japanese cities in transportation and housing.
This, as usual, goes beyond transportation. I saw minimal curiosity among Americans in the late 2000s about universal health care abroad, while a debate about health care raged and “every rich country except the US has public universal health care” was a common and wrong line among liberals. Individual Americans and immigrants to the US might be able to talk about the French or Japanese or Israeli or Ghanaian health care system, but nobody would be interested to hear except their close friends; political groups they were involved with would shrug that off even while going off about the superiority of those countries’ health care (well, not Ghana’s, but all of the other three for sure, in ignorance of Israel’s deep problem with nosocomial infections, responsible for 9-14% of the national death rate).
The result is that while individual Americans can be smart, diligent, and curious, collectively the United States is stupid, lazy, and ignorant on every matter that other parts of the world do better. This is bad in public transportation and lethal in those aspects of it that use mainline rail, where the US is generations behind and doesn’t even know where to start learning, let alone how to learn. It’s part of a global core-periphery model in which Europe hardly shines when it comes to learning from poorer parts of Europe or from non-Western countries, but the US adds even more to that incuriosity. Within the US, the worst is New York, where even Chicago is too suspect to learn from. No wonder New York’s institutions drifted to the point that construction costs in the city are 10 times higher than they can be, and nearly 20 times as high as absolute best practice.
Eno’s Project Delivery Webinar
Eno has a new report out about mass transit project delivery, which I encourage everyone to read. It compares the American situation with 10 other countries: Canada, Mexico, Chile, Norway, Germany, Italy, South Africa, Japan, South Korea, and Australia. Project head Paul Lewis just gave a webinar about this, alongside Phil Plotch. Eno looks at high-level governance issues, trying to figure out if there’s some correlation with factors like federalism, the electoral system, and the legal system; there aren’t any. Instead of those, they try teasing out project delivery questions like the role of consultants, the contracting structure, and the concept of learning from other people.
This is an insightful report, especially on the matter of contract sizing, which they’ve learned from Chile. But it has a few other gems worth noting, regarding in-house planning capacity and, at meta level, learning from other people.
How Eno differs from us
The Transit Costs Project is a deep dive into five case studies: Boston, New York, Stockholm (and to a lesser extent other Nordic examples), Istanbul (and to a lesser extent other Turkish examples), and the cities of Italy. This does not mean we know everything there is to know about these cases; for example, I can’t speak to the issues of environmental review in the Nordic countries, since they never came up in interviews or in correspondence with people discussing the issue of the cost escalation of Nya Tunnelbanan. But it does mean knowing a lot about the particular history of particular projects.
Eno instead studies more cases in less detail. This leads to insights about places that we’ve overlooked – see below about Chile and South Korea. But it also leads to some misinterpretations of the data.
The most significant is the situation in Germany. Eno notes that Germany has very high subway construction costs but fairly low light rail costs. The explanation for the latter is that German light rail is at-grade trams, the easiest form of what counts as light rail in their database to build. American light rail construction costs are much higher partly because American costs are generally very high but also partly because US light rail tends to be more metro-like, for example the Green Line Extension in Boston.
However, in the video they were asked about why German subway costs were high and couldn’t answer. This is something that I can answer: it’s an artifact of which subway projects Germany builds. Germany tunnels so little, due to a combination of austerity (money here goes to gas subsidies, not metro investments) and urbanist preference for trams over metros, that the tunnels that are built are disproportionately the most difficult ones, where the capacity issues are the worst. The subways under discussion mostly include the U5 extension in Berlin, U4 in Hamburg, the Kombilösung in Karlsruhe, and the slow expansion of the tunneled part of the Cologne Stadtbahn. These are all city center subways, and even some of the outer extensions, like the ongoing extension of U3 in Nuremberg, are relatively close-in. The cost estimates for proposed outer extensions like U7 at both ends in Berlin or the perennially delayed U8 to Märkisches Viertel are lower, and not too different per kilometer from French levels.
This sounds like a criticism, because it mostly is. But as we’ll see below, even if they missed the ongoing changes in Nordic project delivery, what they’ve found from elsewhere points to the exact same conclusions regarding the problems of what our Sweden report calls the globalized system, and it’s interesting to see it from another perspective; it deepens our understanding of what good cost-effective practices for infrastructure are.
The issue of contract sizing in the Transit Costs Project
Part of what we call the globalized system is a preference for fewer, larger contracts over more, smaller ones. Trafikverket’s procurement strategy backs this as a way of attracting international bidders, and thus the Västlänken in Gothenburg, budgeted at 20,000 kronor in 2009 prices or around $2.8 billion in 2022 prices, comprises just six contracts. A planner in Manila, which extensively uses international contractors from all over Asia to build its metro system (which has reasonable elevated and extremely high underground costs), likewise told us that the preference for larger contracts is good, and suggested that Singapore may have high costs because it uses smaller contracts.
While our work on Sweden suggests that the globalized system is not good, the worst of it appeared to us to be about risk allocation. The aspects of the globalized system that center private-sector innovation and offload the risk to the contractor are where we see defensive design and high costs, while the state reacts by making up new regulations that raise costs and achieve little. But nothing that we saw suggested contract sizing was a problem.
And in comes Eno and brings up why smaller contracts are preferable. In Chile, where Eno appears to have done the most fieldwork, metro projects are chopped into many small contracts, and no contractor is allowed to get two adjacent segments. The economic logic for this is the opposite of Sweden’s: Santiago wishes to make its procurement open to smaller domestic firms, which are not capable of handling contracts as large as those of Västlänken.
And with this system, Santiago has lower costs than any Nordic capital. Project 63, building Metro Lines 3 and 6 at the same time, cost in 2022 PPP dollars $170 million/km; Nya Tunnelbanan is $230 million/km if costs don’t run over further, and the other Nordic subways are somewhat more expensive.
Other issues of state capacity
Eno doesn’t use the broader political term state capacity, but constantly alludes to it. The report stresses that project delivery must maintain large in-house planning capacity. Even if consultants are used, there must be in-house capacity to supervise them and make reasonable requests; clients that lack the ability to do anything themselves end up mismanaging consultants and making ridiculous demands, which point comes out repeatedly and spontaneously for our sources as well as those of Eno. While Trafikverket aims to privatize the state on the British model, it tries to retain some in-house capacity, for example picking some rail segments to maintain in-house to benchmark private contractors against; at least so far, construction costs in Stockholm are around two-fifths those of the Battersea extension in London, and one tenth those of Second Avenue Subway Phase 1.
With their broader outlook, Eno constantly stresses the need to devolve planning decisions to expert civil servants; Santiago Metro is run by a career engineer, in line with the norms in the Spanish- and Portuguese-language world that engineering is a difficult and prestigious career. American- and Canadian-style politicization of planning turns infrastructure into a black hole of money – once the purpose of a project is spending money, it’s easy to waste any budget.
Finally, Eno stresses the need to learn from others. The example it gives is from Korea, which learned the Japanese way of building subways, and has perfected it; this is something that I’ve noticed for years in my long-delayed series on how various countries build, but just at the level of a diachronic metro map it’s possible to see how Tokyo influenced Seoul. They don’t say so, but Ecuador, another low-cost Latin American country, used Madrid Metro as consultant for the Quito Metro.
