Category: Construction Costs
Quick Note: Commuter Rail Rolling Stock Costs
ETA just published a report on New York rolling stock costs for commuter rail. In the report, we talk about the need to electrify the entire system, and, if there are unelectrified tails (which there shouldn’t be), the solution for them is not more diesel locomotives. For the purposes of this post, I’d instead like to talk about the difficulties of getting some of this information; the rolling stock database that we have at the Transit Costs Project is growing, but is far from complete, and has gaps, with some information including cost missing for critical orders. What I think from the available data is that alternatives to electrification are far more expensive – the one with the most reliable cost data, battery-electric trains (BEMUs), costs close to 2.5 times as much, while dual-mode diesel-electric multiple units (DEMUs) cost less than BEMUs and more than regular electric multiple units (EMUs). But this is based on imperfect data and I’d like to discuss this issue more.
To the point on EMU costs: something is seriously screwed up with some of the orders. There’s that diva effect for large cities that I’ve talked about for years, in which large cities with old systems prefer to buy custom designs, for example the X’Trapolis in Paris, or the Berlin U- and S-Bahn orders. These are the largest orders, so the average cost Europe-wide is pulled up by these cases. In contrast, standard regional EMU orders are more routine and cheaper; two recent FLIRT orders, for Hanover and Bremen, were respectively $110,000/meter of length and $104,000/meter. But even then, there are variations, and Coradia Stream orders vary by a factor of about 2, for reasons that I don’t quite get.
Then BEMUs are not ordered in a large quantity, but when they are, the costs appear high – the database has a $249,000/m order by ÖBB; there’s an even more expensive order for NAH.SH, both FLIRT Akkus. Another fairly large order, for Pfalznetz, does not have cost data anywhere that I can see; Stadler is putting up a technical sheet for it, but not for ÖBB, but then whenever I look up costs for the Pfalznetz Akku I only get the NAH.SH one and I don’t know why.
There’s a Metra Akku order, whose costs are murky, depending on how one counts them. The procurement order lists the cost as $12.635 million for a two-car BEMU set, which is about $250,000/m, but then the option order includes trailer cars at about $2.5 million apiece. A four-car train so formed would only be around $176,000/m, but would also be severely underpowered. The Stadler technical sheet for the Metra Akku lists its power rating as 1 MWh, which is the wrong unit, but could plausibly be a typo for 1 MW; no weight is listed, but the two-car NAH.SH Akku is 96 t – but then the Metra Akku uses a power pack, which may yield somewhat different results, so the exact numbers are unclear, even if the general result that the Metra Akkus are likely to have a power-to-weight ratio in the vicinity of 6 is close enough, and damning enough. In general, American orders sometimes do that, using multiple-unit trains as locomotives with seats and diluting them with unpowered cars, just because their acquisition costs are so high that they can’t run trains with good performance specs (and, given how conservative the schedules are, they don’t think it’s important anyway).
Low Spanish Costs are not About Decentralization
An article by Ben Hopkinson at Works in Progress is talking about what Madrid has been doing right to build subways at such low costs, and is being widely cited. It sounds correct, attributing the success to four different factors, all contrasted with the high-cost UK. The first of these factors, decentralization in Spain compared with its opposite in England, is unfortunately completely wrong (the other three – fast construction, standardized designs, iterative in-house designs – are largely right, with quibbles). Even more unfortunately, it is this mistake that is being cited the most widely in the discussion that I’m following on social media. The mentality, emanating from the UK but also mirrored elsewhere in Europe and in much of the American discourse, is that decentralization is obviously good, so it must be paired with other good things like low Spanish costs. In truth, the UK shares high costs with more decentralized countries, and Spain shares low ones with more centralized ones. The emphasis on decentralization is a distraction, and people should not share such articles without extensive caveats.
The UK and centralization
The UK is simultaneously expensive to build infrastructure in and atypically centralized. There is extensive devolution in Scotland, Wales, and Northern Ireland, but it’s asymmetric, as 84% of the population lives in England. Attempts to create symmetric devolution to the Regions of England in the Blair era failed, as there is little identity attached to them, unlike Scotland, Wales, or Northern Ireland. Regional identities do exist in England, but are not neatly slotted at that level of the official regions – Cornwall has a rather strong one but is only a county, the North has a strong one but comprises three official regions, and the Home Counties stretch over parts of multiple regions. Much of this is historic – England was atypically centralized even in the High Middle Ages, with its noble magnates holding discontinuous lands; identities that could form the basis of later decentralization as in France and Spain were weaker.
People in the UK understand that their government isn’t working very well, and focus on this centralization as a culprit; they’re aware of the general discourse from the 1960s onward, associating decentralization with transparency and accountability. After the failure of Blair-era devolution, the Cameron cabinet floated the idea of doing devolution but at lower level, to the metropolitan counties, comprising the main provincial cities, like Greater Manchester or the West Midlands (the county surrounding Birmingham, not the larger official region). Such devolution would probably be good, but is not really the relevant reform, not when London, with its extreme construction costs, already has extensive devolved powers.
But in truth, the extreme construction costs of the UK are mirrored in the other English-speaking countries. In such countries, other than the US, even the cost history of similar, rising sharply in the 1990s and 2000s with the adoption of the more privatized, contractor-centric globalized system of procurement. The English story of devolution is of little importance there – Singapore and Hong Kong are city-states, New Zealand is small enough there is little reason to decentralize there, and Canada and Australia are both highly decentralized to the provinces and states respectively. The OECD fiscal decentralization database has the UK as one of the more centralized governments, with, as of 2022, subnational spending accounting for 9.21% of GDP and 19.7% of overall spending, compared with Spain’s 20.7% and 43.6% respectively – but in Australia the numbers are 17.22% and 46.2%, and in Canada they are 27.8% and 66.5%.
American construction costs have a different history from British ones. For one, London built for the same costs as German and Italian cities in the 1960s and 70s, whereas New York was already spending about four times as much per km at the time. But this, too, is an environment of decentralization of spending; the OECD database doesn’t mention local spending, but if what it includes in state spending is also local spending, then that is 19.07% of American GDP and 48.7% of American government spending.
In contrast, low-cost environments vary in centralization considerably. Spain is one of the most decentralized states in Europe, having implemented a more or less symmetric system in response to Catalan demands for autonomy, but Italy is fairly centralized (13.9% of GDP and 24.8% of government spending are subnational), and Greece and Portugal are very centralized and Chile even more so (2.77%/8.1%). The OECD doesn’t include numbers for Turkey and South Korea so we can merely speculate, but South Korea is centralized, and in Istanbul there are separate municipal and state projects, both cheap.
Centralization and decisionmaking
Centralization of spending is not the same thing as centralization of decisionmaking. This is important context for Nordic decentralization, which features high decentralization of the management of welfare spending and related programs, but more centralized decisionmaking on capital city megaprojects. In Stockholm, both Citybanan and Nya Tunnelbanan were decided by the state. Congestion pricing, in London and New York a purely subnational project, involved state decisions in Stockholm and a Riksdag vote; the Alliance victory in 2006 meant that the revenue would be spent on road construction rather than on public transport.
In a sense, the norm in unitary European states like the Nordic ones, or for that matter France, is that the dominant capital has less autonomy than the provinces, because the state can manage its affairs directly; thus, RATP is a state agency, and until 2021 all police in Paris was part of the state (and the municipal police today has fewer than 10% of the total strength of the force). In fact, on matters of big infrastructure projects, the state has to do so, since the budgets are so large they fall within state purview. Hopkinson’s article complaining that Crossrail and Underground extensions are state projects needs to be understood in that context: Grand Paris Express is a state project, debated nationally with the two main pre-Macron political parties both supporting it but having different ideas of what to do with it, not too different from Crossrail; the smaller capitals of the Nordic states have smaller absolute budgets, but those budgets are comparable relative to population or GDP, and there, again, state decisionmaking is as unavoidable as in London and Paris.
The purest example of local decisionmaking in spending is not Spain but the United States. Subway projects in American cities are driven by cities or occasionally state politicians (the latter especially in New York); the federal government isn’t involved, and FTA and FRA grants are competitive and decided by people who do not build but merely regulate and nudge. This does not create flexibility – to the contrary, the separation between builders and regulators means that the regulators are not informed about the biggest issues facing the builders and come up with ideas that make sense in their heads but not on the ground, while the builders are too timid to try to innovate because of the risk that the regulators won’t approve. With this system, the United States has not seen public-sector innovation in a long while, even before it became ideologically popular to run against the government.
In finding high American costs in the disconnect between those who do and those who oversee, at multiple levels – the agencies are run by an overclass of political appointees and directly-reporting staff rather than by engineers, states have a measure of disconnect from agencies, and the FTA and FRA practice government-by-nudge – we cannot endorse any explanation of high British costs that comes from centralization.
If the policy implications of such an explanation are to devolve further powers to London or a Southeast England agency, then they are likely to backfire, by removing the vestiges of expertise of doers from the British state; the budgets involves in London expansion are too high to be handled at subnational level. Moreover, reduction in costs – the article’s promise of a Crossrail 2, 3, and 4 if costs fall – has no chance of reducing the overall budget; the same budget would just be spent on further tunnels, in the same manner the lower French costs lead to a larger Grand Paris Express program. Germany and Italy in the same schema have less state-centric decisionmaking in their subway expansion, for the simple reason that both countries underbuild, which can be seen in the very low costs per rider – a Berlin with the willingness to build infrastructure of London or Paris would have extended U8 to Märkisches Viertel in the 1990s at the latest.
One possible way this can be done better is if it’s understood in England that decentralization only really works in the sense of metropolitanization in secondary cities, where the projects in question are generally below the pay grade of state ministers or high-level civil servants. In the case of England, this would mean devolution to the metropolitan counties, giving them the powers that Margaret Thatcher instead devolved to the municipalities. But that, by itself, is not going to reduce costs; those devolved governments would still need outside expertise, for which public-sector consultants, in the British case TfL, are necessary, using the unitariness of the state to ensure that the incentives of such public-sector consultants are to do good work and push back against bad ideas rather than to just profit off of the management fees.
The first-line effect
The article tries to argue for decentralization so much it ends up defending an American failure, using the following language:
But the American projects that are self-initiated, self-directed, self-funded, self-approved, and in politically competitive jurisdictions do better. For example, Portland, Oregon’s streetcar was very successful at regenerating the Pearl District’s abandoned warehouses while being cutting-edge in reducing costs. Its first section was built for only £39 million per mile (inflation adjusted), half as much as the global average for tram projects.
To be clear, everything in the above paragraph is wrong. The Portland Streetcar was built for $57 million/4 km in 1995-2001, which is $105.5 million/4 km in 2023 dollars, actually somewhat less than the article says. But $26.5 million/km was, in the 1990s, an unimpressive cost – certainly not half as much as the global average for tram projects. The average for tram projects in France and Germany is around 20 million euros/km right now; in 2000, it was lower. So Portland managed to build one very small line for fairly reasonable costs, but they were not cutting edge; this is a common pattern to Western US cities, in that the first line has reasonable costs and then things explode, even while staying self-funded and self-directed. Often this is a result of overall project size – a small pilot project can be overseen in-house, and then when it is perceived to succeed, the followup is too large for the agency’s scale and then things fall apart. Seattle was building the underground U-Link for $457 million/km in 2023 dollars; the West Seattle extension, with almost no tunneling, is budgeted at $6.7-7.1 billion/6.6 km, which would be a top 10 cost for an undeground line, let alone a mostly elevated one. What has changed in 15 years since the beginning of U-Link isn’t federal involvement, but rather the scope of the program, funded by regional referendum.
The truth is that there’s nothing that can be learned from American projects within living memory except what not to do. There’s always an impulse to look for the ones that aren’t so bad and then imitate them, but they are rare and come from a specific set of circumstances – again, first light rail lines used to be like this and then were invariably followed by cost increases. But the same first-line effect also exists in the reasonable-cost world: the three lowest-cost high-speed rail lines in our database built to full standards (double track, 300+ km/h) are all first lines, namely the Ankara-Konya HST ($8.1 million/km in 2023 PPPs), the LGV Sud-Est ($8.9 million/km), and the Madrid-Seville LAV ($15.4 million/km); Turkey, Spain, and France have subsequently built more high-speed lines at reasonable costs, but not replicated the low costs of their first respective lines.
On learning from everyone
I’ve grown weary of the single case study, in this case Madrid. A single case study can lead to overlearning from the peculiarities of one place, where the right thing to do is look at a number of successes and look at what is common to all of them. Spain is atypically decentralized for a European state and so the article overlearns from it, never mind that similarly cheap countries are much more centralized.
The same overall mistake also permeates the rest of the article. The other three lessons – time is money, trade-offs matter and need to be explicitly considered, and a pipeline of projects enables investment in state capacity, are not bad; much of what is said in them, for example the lack of NIMBY veto power, is also seen in other low-cost environments, and is variable in medium-cost ones like France and Germany. However, the details leave much to be desired.
In particular, one the tradeoffs mentioned is that of standardization of systems, which is then conflated with modernization of systems. The lack of CBTC in Madrid is cited as one way it kept construction costs down, unlike extravagant London; the standardized station designs are said to contrast with more opulent American and British ones. In fact, neither of these stories is correct. Manuel Melis Maynar spoke of Madrid’s lack of automation as one way to keep systems standard, but that was in 2003, and more recently, Madrid has begun automating Line 6, its busiest; for that matter, Northern Europe’s lowest-construction cost city, Nuremberg, has automated trains as well. And standardized stations are not at all spartan; the lack of standardization driving up costs is not about nice architecture, which can be retrofitted rather cheaply like the sculptures and murals that the article mentions positively, but behind-the-scenes designs for individual system components, placement of escalators and elevators, and so on.
The frustrating thing about the article, then, is that it is doing two things, each of which is suspect, the combination of which is just plain bad. The first is that it tries to overlearn from a single famous case. The second is that it isn’t deeply aware of this case; reading the article, I was stricken by how nearly everything it said about Madrid I already knew, whereas quite a lot of what it said about the UK I did not, as if the author was cribbing off the same few reports that everyone in this community has already read and then added original research not about the case study but about Britain.
And then the discourse, unfortunately, is not about the things in the article that are right – the introduction in lessons 2-4 into how the civil service in Madrid drives projects forward – but about the addition of the point about centralization, which is not right. Going forward, reformers in the UK need far better knowledge of how the low- and medium-construction cost world looks, both deeper and broader than is on display here.
Commuter Rail to Staten Island
A debate in my Discord channel about trains between Manhattan and Staten Island clarified to me why it’s so important that, in the event there is ever rail service there, it should use large commuter trains rather than smaller subway stations. The tradeoff is always that the longer trains used on commuter services lead to higher station construction costs than the smaller trains used on captive subway lines. However, the more difficult the tunnel construction is, and the fewer stations there are, the smaller the cost of bigger trains is. This argues in favor of commuter trains across the New York Harbor, and generally on other difficult water or mountain crossings.
When costing how much expansive commuter rail crayon is, like my Assume Normal Costs map, I have not had a hard time figuring out the station costs. The reason is that the station costs on commuter rail, done right, are fairly close to subway station costs, done wrong. As we find in the New York construction cost report, Second Avenue Subway’s 72nd and 86th Street stations were built about twice as large as necessary, and with deep-mined caverns. If you’re building a subway with 180 m long trains under Second Avenue, then mining 300-400 m long stations is an extravagance. If you’re building a regional rail tunnel under city center, and the surface stations are largely capable of 300 m long trains or can be so upgraded, then it’s normal. Thus, a cost figure of about $700 million per station is not a bad first-order estimate in city center, or even $1 billion in the CBD; outside the center, even large tunneled stations should cost less.
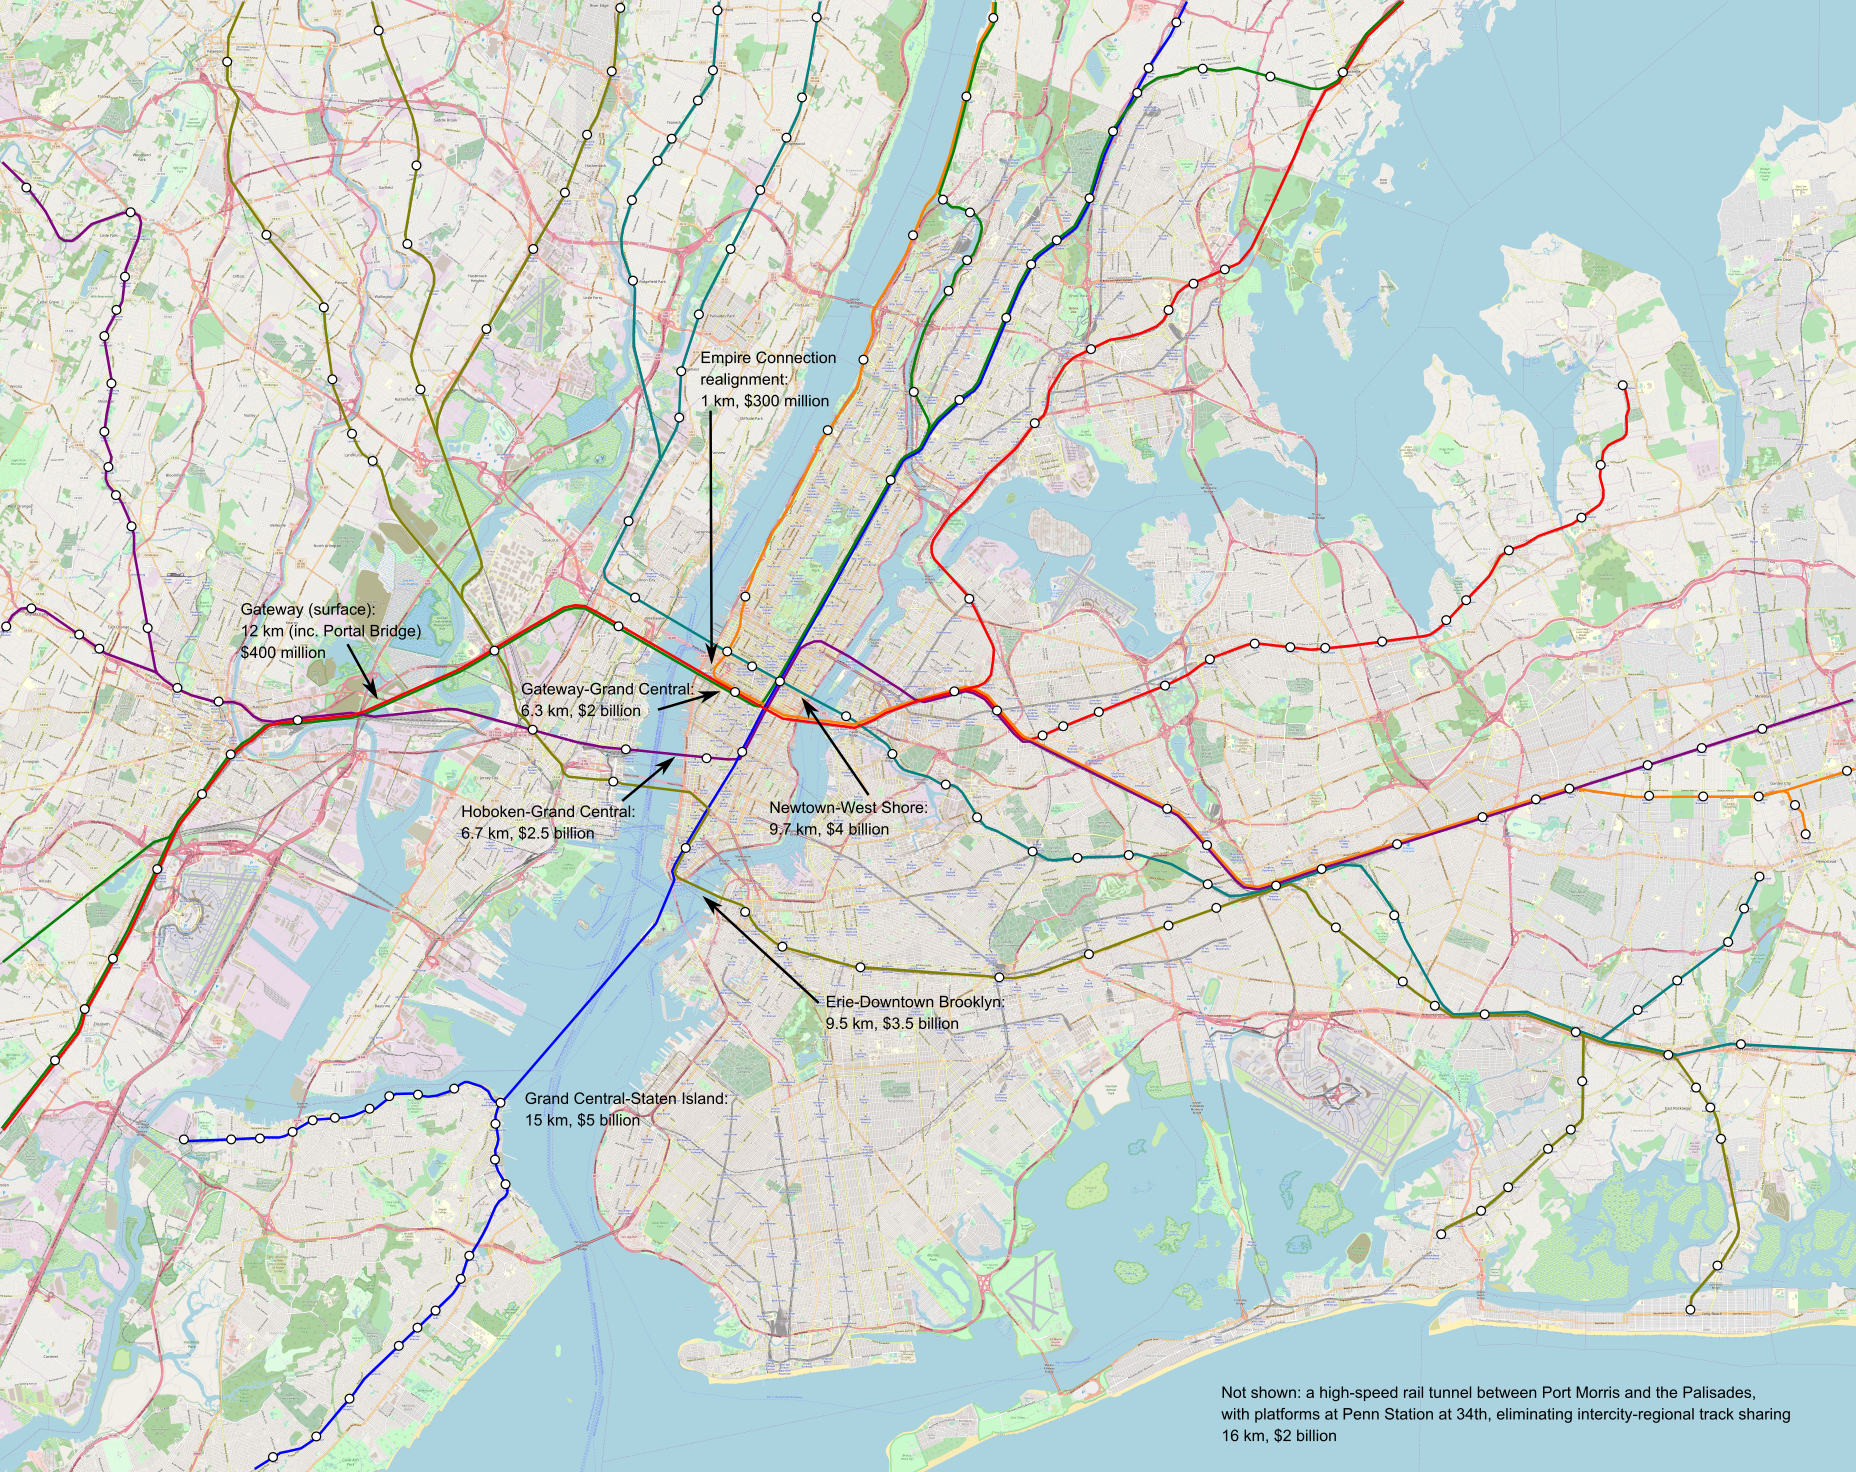
The cost above can be produced, for example, by setting the Union Square and Fulton Street stations at a bit less than $1 billion each (let’s say, $1.5 billion each, with each colored line contributing half), and a deep station under St. George at $500 million, totaling $2 billion. The 15 km of tunnel are then doable for $3 billion at costs not far below current New York tunneling costs. Don’t get me wrong, it still requires cost control policies on procurement and systems, but relative to what this includes, it’s not outlandish.
This, in turn, also helps explain the concept of regional rail tunnels. These are, in our database, consistently more expensive than metros in the same city; compare for example RER with Métro construction costs, or London Underground extensions with Crossrail, or especially the Munich U- and S-Bahn. The reason is that the concept of regional rail tunneling is to only build the hard parts, under city center, and then use existing surface lines farther out. For the same reason, the stations can be made big – there are fewer of them, for example six on the original Munich S-Bahn and three on the second trunk line under construction whereas the Munich U-Bahn lines have between 13 and 27, which means that the cost of bigger stations is reduced compared with the benefit of higher capacity.
This mode is then appropriate whenever there is good reason to build a critical line with relatively few stations. This can be because it’s a short connection between terminals, the usual case of most RER and S-Bahn lines; in the United States, the Center City Commuter Connection is such an example, and so is the North-South Rail Link if it is built. This can also be because it’s an express line parallel to slower lines, like the RER A. But it can also be because it doesn’t need as many stations because it crosses water, like any route serving Staten Island.
The flip side is that whenever many stations are required on an urban rail tunnel, it becomes more important to keep costs down by, potentially, shrinking the station footprint through using shorter trains. In small enough cities, as is the case in some of the Italian examples discussed in that case, like Brescia and Turin, it’s even possible to build very short station platforms and compensate by running driverless trains very frequently, producing an intermediate-capacity system. In larger cities, this trick is less viable, but sometimes there are corridors where there is no alternative to a frequent-stop urban tunnel, such as Utica in New York, and then, regional rail loses value. But in the case of Staten Island, to the contrary, commuter rail is the most valuable option.
Quick Note: Kathy Hochul and Eric Adams Want New York to Be Worse at Building Infrastructure
Progressive design-build just passed. This project delivery system brings New York in full into the globalized system of procurement, which has led to extreme cost increases in the United Kingdom, Canada, and other English-speaking countries, making them unable to build any urban transit megaprojects. Previously, New York had most of the misfeatures of this system, largely through convergent evolution, but due to slowness in adapting outside ideas, the state took until now, with extensive push from Adams’ orbit, for which Adams is now taking credit, to align. Any progress in cost control through controlling project scope will now be wasted on the procurement problems caused by this delivery method.
What is progressive design-build?
Progressive design-build is a variant on design-build. There is some divergence between New York terminology and rest-of-world terminology; for people who know the latter, progressive design-build is approximately what the rest of the world calls design-build.
To give more detail, designing and constructing a piece of infrastructure, say a single subway station, are two different tasks. In the traditional system of procurement, the public client contracts the design with one firm, and then bids it out to a different firm for construction; this is called design-bid-build. All low-construction cost subway systems that we are aware of use a variant of design-bid-build, but two key features are required to make it work: sufficient in-house supervision capacity since the agency needs to oversee both the design and the build contracts, and flexibility to permit the build contractors to make small changes to the design based on spot prices of materials and labor or meter-scale geological discoveries. The exact details of both in-house capacity and flexibility differ by country; for example, Turkey codifies the latter by having the design contract only cover 60% design, and bundling going from 60% to 100% design with the build contract. Despite the success of the system in low-construction cost environments, it is unpopular among the global, especially English-speaking, firms, because it is essentially client-centric, relying on high competence levels in the public sector to work.
To deal with the facts that large global firms think they are better than the public sector, and that the English-speaking world prefers its public sector to be drowned in a bathtub, there are alternative, contractor-centric systems of project delivery. The standard one in the globalized system is called design-build or design-and-build, and simply means that the same contractor does both. This means less public-facing friction between designers and builders, and more friction that’s hidden from public view. Less in-house capacity is required, and the contracts grow larger, an independent feature of the globalized system. As the Swedish case explains in the section on the traditional and globalized systems, globalized Swedish contracts go up to $300-500 million per contract (and Swedish costs, once extremely low, are these days only medium-low); in New York, contracts for Second Avenue Subway Phase 2 are already in the $1-2 billion range.
In New York, the system is somewhat complicated by the text of legacy rules on competitive bidding, which outright forbid a company from portraying itself as doing both design and construction. It took recent changes to legalize the Turkish system of bundling the two contracts differently; this changed system is what is called design-build in New York and is used for Second Avenue Subway Phase 2, even though there are still separate design and construction contracts, and is even called design-build in Turkey.
Unfortunately, New York did not stop at this, let’s call it, des-bid-ign-build system. Adams and Hochul want to be sure to wreck state capacity. Thus, they’ve pushed for progressive design-build, which is close to what the rest of the world calls design-build. More precisely, the design contractor makes a build bid at the end of the design phase, and is presumed to become the build contractor, but if the price is too high, there’s an escape clause and then it becomes essentially design-bid-build.
The globalized system that led to a cost explosion in the UK and Canada in the 1990s and 2000s from reasonable to strong candidates for second worst in the world (after the US) is now coming to New York, which already has a head start in high construction costs due to other problems. It’s a win-win for political appointees and cronies, and they clearly matter more than the people of the city and state of New York.
Our Rolling Stock Database Draft is Out
As mentioned in the writeup, this database is still incomplete, in systemic ways that matter to the analysis. In particular, European metros show a diva effect in which Paris and Berlin have higher costs than the rest, and the database has more trainsets from them and fewer from cities where costs are lower, like Madrid, due to data availability. (For the same reason, I would not trust the database on European tramways until we add more items.)
Help Us Write More Construction Cost Cases
At the Transit Costs Project, we’re planning to return to writing more infrastructure construction costs cases, and we need help to improve our coverage to new places – potentially, your help. See job ad here.
How many positions are you hiring for?
This number depends on the applications we get, but there will be multiple hires.
What kind of cases are you interested in?
Cases studying construction costs for urban rail in a specific city or group of cities; so far we’ve done rapid transit projects (commuter rail counts), but we will look at proposals that look at adjacent issues, for example mass expansion of light rail if it is at sufficient scale to qualify as a megaproject. We’re not going to be interested in highway-only or highway-focused studies, but a public transport-focused report could still talk about a contemporary highway megaproject in the same place to give more context – for example, at the same time that it built more than 100 km of new metro in a decade, Madrid also built motorway tunnels, and this may be relevant to understanding its decisionmaking, engineering practices, and contracting practices.
As we say in the job ad, you should be familiar with our existing cases, which can be read here. This doesn’t mean you need to memorize them (I have not memorized the one I wrote myself, let alone the others). But they should give some guidance about what issues we’re interested in seeing in each case: a sketch of the history of urban rail in the city, an explanation of the decisionmaking that led to the project, a description of the ongoing discourse about it informed by local opinions on how things should be done, engineering drawings, and similar issues leading to a synthesis of what works and what doesn’t.
Do the cases need to agree with the program focusing on decisionmaking, project delivery, and so on?
They need to be on-topic but absolutely do not need to agree with us. I’m fairly hardline against certain procurement elements that we call the globalized system in the cases, such as large contracts and design-build delivery, but also if you think I’m wrong and set out to find a case showing that design-build has actually worked and improved things, that’s entirely on-topic. Marco Chitti came to my attention after he vociferously disagreed with me on Twitter about private competition in intercity rail in Italy.
Which places are you interested in seeing reports for?
We’d like to have a wide variety of examples. So far we’ve done two American cases (Boston and New York), plus Italy, Stockholm, and Istanbul. Potentially, any example of urban rail megaproject elsewhere qualifies; that said, all other things being equal, we would prefer environments that are different from all of those, such as medium-cost places (like France or Germany), Asian examples of any kind, Latin American examples (cheap like Santo Domingo or Santiago, or more expensive like Brazilian cities), the United Kingdom with its relatively recent cost explosion, and so on.
This also, frustratingly to applicants, means that we’re going to hire based on who else we’re going to hire. What this means is that if we decide to hire three people, and then we narrow the shortlist to five good applicants with good proposals for a Paris case and then two more with good proposals for Tokyo and Santo Domingo cases, we’re not going to do two Paris cases.
What connections do I need for the interviews?
Any. You don’t need to have a list of 20 names of people to talk to in advance, but we would like to see evidence that you can get to this many interviews. This can come from connections with local advocates, politicians, civil servants, academics, contractors, union organizers, journalists, agency heads, engineers, or policy experts. Interviewees often naturally suggest other people to interview or documents to read, whose authors are then natural interview subjects; this in our experience has included both disgruntled planners eager to publicize the failures of the projects they’ve been involved in and planners who think their superiors are doing good work and would like to publicize their agencies’ successes.
I think I have enough knowledge and connections in multiple countries and can do two cases. What do I do?
Talk to us; it’s likely we’ll only be able to make you an offer for a single case, but you never know.
(Update) Where is the job?
We work fully remotely. I met Elif in person two years into the Transit Costs Project and Marco even later.
Why Texas High-Speed Rail is Stuck
I’ve been asked on social media why the US can’t build a Shinkansen-style network, with a specific emphasis on Texas. There is an ongoing project, called Texas Central, connecting Dallas with Houston, using Shinkansen technology; the planning is fairly advanced but the project is unfunded and predicted to cost $33.6 billion for a little less than 400 km of route in easy terrain. Amtrak is interested, but it doesn’t seem to be a top priority for it. I gave the skeet-length answer centering costs, blaming, “Farm politics, prior commitments, right-wing populism, and Japanese history.” These all help explain why the project is stuck, despite using technology that in its home country was a success.
How Texas Central is to be constructed
The line is planned to run between Dallas and Houston, but the Houston station is not in Downtown Houston, in order to avoid construction in the built-up area. There are rail corridors into city center, but Texas Central does not want to use them; the concept, based on the Shinkansen, does not permit sharing tracks with legacy railways, and as it developed in the 2010s, it did not want to modify the system for that. Sharing the right-of-way without sharing tracks is possible, but requires new construction within the built-up area. To avoid spending this money, the Texas Central plan is for the Houston station to be built at the intersection of I-610 and US 290, 9 km from city center. Between the cities, the line is not going into intermediate urban areas; a Brazos Valley stop is planned as a beet field station 40 km east of College Station.
Despite all this cost cutting, the line is also planned to run on viaducts. This is in line with construction norms on the newer Shinkansen lines as well as in the rest of Asia; in Europe, high-speed rail outside tunnels runs at-grade or on earthworks, and viaducts are only used for river crossings. As a result, on lines with few tunnels, construction is usually more expensive in Asia than in Europe, with some notable exceptions like High Speed 2 or HSL Zuid. Heavily-tunneled lines sometimes exhibit the opposite, since Japanese standards permit narrower tunnels (more precisely, a slightly wider tunnel accommodates two tracks whereas elsewhere the norm is that each track goes in a separate bore); this works because the Shinkansen trainsets are more strongly pressurized than TGVs or ICEs and also have specially designed noses to reduce tunnel boom.
But in an environment like Texas’s, the recent norm of all-elevated construction drives up costs. This is how, in an easy construction environment, costs have blown to around $87 million/km. For one, recently-opened Shinkansen extensions have cost less than this even while being maybe half or even more in tunnel (that said, the Tsuruga extension that opened earlier this year cost much more). But it’s not the only reason; the construction method interacts poorly with the state’s politics and with implicit and explicit promises made too early.
Japanese history and turnkey projects
The Shinkansen is successful within Japan, and has spawned imitators and attempts at importing the technology wholesale. The imitators have often succeeded on their own terms, like the TGV and the KTX. The attempts at importing the technology wholesale, less so.
The issue here is twofold. First, state railways that behave responsibly at home can be unreasonable abroad. SNCF is a great example, running the TGV at a consistent but low profit to keep ticket fares affordable domestically but then extracting maximum surplus as a monopolist charging premium fares on Eurostar and Thalys. Japan National Railways, now the JR group, is much the same. Domestically, it is constrained by not just implicit expectations of providing a social service (albeit profitably) but also local institutions that push back against some of management’s thinking about how things ought to be. With SNCF, it’s most visible in how management wants to run the railway like an airline, but is circumscribed by expectations such as open platforms, whereas on Eurostar it is freer to force passengers to wait until the equivalent of an airline gate opens. With JR, it’s a matter of rigidity: the Shinkansen does run through to classical lines on the Mini-Shinkansen, but it’s considered a compromise, which is not to be tolerated in the idealized export product.
And second, the history of Taiwan High-Speed Rail left everyone feeling a little dirty, and led Japan to react by insisting on total turnkey products. THSR, unlike the contemporary KTX or the later CRH network, was not run on the basis of dirigistic tech transfers but on that of buying imported products. To ensure competition, Taiwan insisted on designing the infrastructure to accommodate both Japanese and European trains; for example, the tunnels were built to the larger European standard. There were two bidders, the Japanese one (JRs do not compete with one another for export orders) and a Franco-German one called the Eurotrain, coupling lighter TGV coaches to the stronger motor of the ICE 2.
The choice between the two bids was mired in the corruption typical of 1990s Taiwan. The Taiwanese government relied on external financing, and Japan offered financing just to get the built-operate-transfer consortium allied with the Eurotrain to switch to the Shinkansen. Meetings with European and Japanese politicians hinged on other scandals, such as the one for the frigate purchase. Taiwan eventually chose the Shinkansen, using a variant of the 700 Series called the 700T, but the Eurotrain consortium sued alleging the choice was improperly made, and was awarded a small amount of damages including covering the development cost of the train.
The upshot is that in the last 20 years, a foreign country buying Shinkansen tech has had to buy the entire package. This includes not just the trainsets, which are genuinely better than their European and Chinese counterparts, but also construction standards (at this point all-elevated) and signaling (DS-ATC rather than the more standard ETCS or its Chinese derivative CTCS). It includes the exact specifications of the train, unmodified for the local loading gauge; in India, this means that the turnkey Shinkansen used on the Mumbai-Ahmedabad line is not only on standard gauge rather than broad gauge, but also uses the dimensions of the Shinkansen, 3.36 m wide trains with five-abreast seating, rather than those of Indian commuter lines, 3.66 m with six-abreast seating. It’s unreasonably rigid and yet Japan finds buyers who think that this lets them have a system as successful as the Shinkansen, rather than one component of it, not making the adjustments for local needs that Japan itself made from French and German technology in the 1950s and 60s when it developed the Shinkansen in the first place.
Prior commitments
Texas Central began as a private consortium; JR Central saw it as a way of selling an internationalized eight-car version of the N700 Series, called the N700-I. It developed over the 2010s, as Republican governors were canceling intercity rail projects that they associated with the Obama administration, including one high-speed one (Florida) and two low-speed ones (Ohio, Wisconsin). As a result, it made commitments to remain a private-sector firm, to entice conservative politicians in Texas.
One of the commitments was to minimize farmland takings. This was never a formal commitment, but one of the selling points of the all-elevated setup is that farmers can drive tractors underneath the viaducts, and only the land directly beneath the structures needs to be purchased. At-grade construction splits plots; in France, this is resolved through land swap agreements and overcompensation of farmers by 30%, but this has not yet been done in the United States or in Japan.
Regular readers of this blog, as well as people familiar with the literature on cost overruns, will recognize the problem as one of early commitment and lock-in. The system was defined early as one with features including very limited land takings and no need for land swaps, no interface with existing railroads to the point that the Houston terminal is not central, and promises of external funding and guidance by JR Central. This circumscribed the project and made it difficult to switch gears as the funding situation changed and Amtrak got more interested, for one.
Farm politics and right-wing populism
Despite the promises of private-sector action and limited takings, not everyone was happy. Texas Central is still a train; in a state with the politics of Texas, enough people are against that on principle. The issue of takings looms large, and features heavily in the communications of Texans Against High-Speed Rail.
The combination of this politics and prior commitments made by Texas Central has been especially toxic to the project. Under American law, private railroads are allowed to expropriate land for construction, and only the federal government, not the states, is allowed to expropriate railroads. Texas Central intended to use this provision to assemble land for its right-of-way, leading to lawsuits about whether it can legally be defined as a railroad, since it doesn’t yet operate as one.
Throughout the 2010s, Governor Greg Abbott supported the project, on the grounds that he’s in favor of private-sector involvement in infrastructure and Texas Central is private-sector. But his ability to support it has always been circumscribed by this political opposition from the right. The judicial system ruled in favor of Texas Central, but state legislative sessions trying to pass laws in support of the project were delayed, and relying on Abbott meant not seeking federal funds.
This also means that there is no chance of redesigning the project to reduce its cost by running at-grade. There is too little political capital to do so, due to the premature commitments made nearly 15 years ago. California has been able to resile from its initial promises to Central Valley farmers to use legacy rail corridors rather than carve a new right-of-way, but even then the last-minute route redesign toward the latter, in order to avoid running at 350 km/h on viaducts through unserved towns, are route compromises. But California has only been able to do so because it’s a one-party state and the Central Valley farmers are Republicans; it has not been able to modify early commitments in case of conflict with Democrats or nonpartisan interest groups. In Texas, the state is likewise run by a single party, but the farmers and the opponents in general are members of the party. Thus, right-wing populism and farmer politics, while claiming opposition to government waste, are forcing the project to be more wasteful with money, in order to marginally reduce the obtrusiveness of the state in managing eminent domain; they would not accept land swaps except in a situation of extreme political weakness.
Abbott is not a popularist (in the sense of European Christian democracy, not the unrelated American term). Popularist leaders like the string of corrupt Democrazia Cristiana leaders of the First Italian Republic, or the more moderate CDU leaders here including Angela Merkel, have sometimes enacted policy that had more support on the center-left than on the right, if they thought it was necessary to maintain their own power and enact the popular will. This way, Angela Merkel, personally opposed to gay marriage, finally permitted a vote on it in 2017, knowing it would pass, because if she didn’t, then SPD would use it in the election campaign and could win on it. Republican governors in the United States do not do that, except in very blue states, like Maryland or Massachusetts. If they moderate too much, they face a risk of losing primary elections, and this is even truer of state legislators; moderation is still not going to get them Democratic support for anything. The result is what’s called majority-of-the-majority: in practice, a majority party will not take action unless it has the support of a majority of the caucus, rather than just a handful of moderate members allying with the other party. This is not the milieu for experimenting with land swaps, which are a far more visible instantiation of state power than populist farmers are ever comfortable with.
Is Texas High-Speed Rail doomed?
I don’t know. I think it’s notable that the funding the project is receiving this year is perfunctory, for planning but not construction. The promised private funding seems dead, and Pete Buttigieg’s promise of funding one project to showcase that there can be high-speed rail in the United States seems focused on funding 25% of Brightline West (which needs 50%), connecting Las Vegas with Rancho Cucamonga, 60 km east of Downtown Los Angeles.
That said, planning is still continuing, as if to keep this project fresh for when more funding materializes. This is not the era of perfunctory $8 billion bills like that of the Obama stimulus; Seth Moulton is proposing $205 billion, and presumably this would include Texas Central, depending on the political environment of 2025 and the spending priorities then.
But I’m still pessimistic. High-speed rail could work between Dallas and Houston. It’s a reasonably strong corridor, and is growing over time, even if it is not as superlative as Tokyo-Osaka or Boston-New York-Washington. But I’m not sure it’s worth it at $33.6 billion, and I don’t think anyone with the power to fund it thinks it is either. Those costs are not just what high-speed rail is supposed to cost; this is a premium of a factor of at least 2, and likely 3, over what can be done with efficient at-grade construction, of the kind that the project unfortunately ruled out over the 2010s.
Costing Northeast Corridor High-Speed Rail
As our high-speed rail project draws to a close, we need to not just write down what is needed for running the trains but also how much it costs. This post should be viewed as a work in progress, and it will not surprise me if I’m missing things that will make it to the report later this year.
The rule for this post is that costs only matter going forward, not backward. If it’s already committed, it’s not part of the budget; in particular, the $6 billion Frederick Douglass Tunnel, already fully funded and in the design and engineering phase, is not part of the budget. In addition, only infrastructure is costed, not rolling stock (new rolling stock may well have negative cost relative to current plans, through buying standard EMUs and not esoteric trainsets like Massachusetts’ battery train idea or nonstandard LIRR/Metro-North-style EMUs).
Bypasses
All bypasses can be seen on this map, but not all bypasses are part of the plan – in particular, nothing between Stamford and New Haven seems worth it for now.
The main bypass we’re proposing, between New Haven and Kingston, is 120 km in relatively easy terrain, including two constrained river bridges (Quinnipiac and Thames; the Connecticut is easier), but no tunnels. The cost should be in line with non-tunneled high-speed lines in Europe, which in 2024 dollars would be around $5 billion.
The secondary bypass, around Port Chester and Greenwich, is 7 km of complex els crossing I-95 multiple times, and should be costed at the upper end of els, which is high hundreds of millions. Call it $1 billion together with a new bridge across the Mianus. The current projected cost for the Cos Cob Bridge replacement is higher, but it should be easier to rebuild the bridge a bit upstream to straighten the approach curves than to do it in situ; with a short section of 4% grades on each side, it should be possible to clear I-95 west of the river and keep the Riverside station east of the river while also having around 23 meters of clearance below the bridge. (4% grades are routine for EMUs; freight trains are so long that they can ascend these grades just fine, since what matters is the grade averaged over the length of the train.)
Frankford Junction is about 2 km of complex urban el, including a rail-on-rail grade separation; the per km cost is likely high, in the very low three-figure millions, but it’s 2 km and so $300 million should cover it.
The other bypasses are very short and in easy environments, for example easing the curve at Kingston (also discussed here), with costs dominated by the track connections rather than the physical construction of 1-2 km of at-grade track outside urban areas. Call this entire portion $6.5 billion total.
Grade separations
The starting point is that NJ Transit thinks that Hunter Flyover should be $300 million in 2022 prices (source, PDF-p. 151). This is as close as can be to a nonnegotiable element of the program.
At the other end of the New York metro area, there’s Shell Interlocking/CP 216, which must be grade-separated as well, and is even more nonnegotiable. I have not seen recent cost figures; it should be comparable to Hunter or somewhat more expensive given the right-of-way constraints. A $500 million placeholder is probably right.
Further north, the junction with the New Canaan Branch is flat and needs to be grade-separated, at a cost likely similar to Hunter, in a similarly built-up area. The Danbury and Waterbury Branches have flat junctions too, but traffic is low enough that they may be kept so (especially Waterbury), but if not, Danbury seems comparable in difficulty to Hunter and New Canaan.
In Philadelphia, the Chestnut Hill West Line (former R8) has a flat junction with the Northeast Corridor, and there are a variety of proposals for what to do with it; for decades, an advocate wish was the Swampoodle Connection, to have it transition to a closely parallel line letting it enter the city via the Reading side rather than the former Pennsylvania Railroad side that it’s on. It’s largely dropped off the wishlist, and instead a grade separation could be done for a cost comparable to that of Hunter, or maybe less (potentially much less) if it’s possible to abuse the line’s low ridership and close proximity to the Chestnut Hill East Line to have shutdowns to speed up the work.
On the other side of Philadelphia, the junction between the intercity and commuter rail approaches to 30th Street is flat as well, which also incorporates the branch to Media/Elwyn (former R3); this should be grade-separated as well.
In Boston, there are two flat junctions on the Providence Line. Canton Junction separates it from the Stoughton Line, and looks routine to either grade-separate (it’s a low-density area) or, potentially, even turned into a shuttle with timed connections to the Providence Line if absolutely necessary, given the demand mismatch between the two branches. The Franklin Line, farther north, has a similar flat junction around Readville, technically within Boston but in an area with plenty of space, but can be sent over to the Fairmount Line if there are difficulties, and may even preferentially go to Fairmount regardless (the main argument against it is service to Back Bay). The answer to “how much should this cost?” is “no more than around $150 million each or else it’s better not to do it at all.”
In total, these should be around $1.8 billion, with New Canaan and Canton but not Danbury or Readville.
Note that rail-on-rail grade separations for bypasses are already priced in, especially New Haven-Kingston, which is of comparable length to European high-speed lines that have been built, with grade-separated connections to legacy lines.
Portal Bridge
The Hudson Tunnel Project within the Gateway Program is funded, but some tie-ins are not. Most (such as Penn Expansion) are useless, but one is essential: a second Portal Bridge, to ensure four tracks of capacity from New York to Newark. The current favored alternative is a lift bridge, budgeted at $800 million; it is a movable and not fixed bridge, but it is not a causeway and has some clearance below, and would only need to open when a sludge barge comes from upriver, which can be scheduled overnight.
High platforms
Everything that touches the Northeast Corridor needs high platforms at all stations. The definition of “touches the Northeast Corridor” is complicated; for example, in New Jersey, there are 68 low-platform stations on the lines that go through Newark Penn or Newark Broad Street, of which 26 are funded for high-platform conversions for around $23 million each ($683 million/30 stations; the other four are on the Erie lines), but of the 68, only 10 are on the lines that would be using the North River Tunnels after the Hudson Tunnel Project opens (see map in ETA’s report). Even taking all 42 as required, it’s around $1 billion at NJ Transit costs, with nearly all benefits accruing to commuter lines.
In Massachusetts, the definition is easier – everything on the Providence and Stoughton Lines needs to be raised; the TransitMatters report explains that there are eight stations, plus two potential infills, with the eight costing around $200 million in 2020 prices, which should be closer to $250 million in 2024 prices. If Franklin Line work is also desired then it should be another $200 million, split across more stations but with shorter platforms. Note that the second phase of South Coast Rail, if it is built, would extend the Stoughton Line, but as the stations are all new construction, they will already have high platforms.
In Pennsylvania, nearly total separation of intercity traffic from SEPTA is possible from the get-go – the only track sharing is peripheral, in and around Wilmington, at low frequency on SEPTA. If the entire Wilmington/Newark Line is to be upgraded, it’s a total of 12 stations, all in four-track territory; SEPTA’s construction costs for high platforms are lower than those of the MBTA and NJ Transit, but much of its construction has been single-platform stations with shorter trains, and my guess is that those 12 stations are around $200 million total. The seven inaccessible stations on the Trenton Line, which, to be clear, does not need to share tracks with intercity trains at all, should be another $100-150 million (it’s a busier line, so, longer trains, and North Philadelphia is more complex).
In Maryland, two stations on the Penn Line are inaccessible, West Baltimore and Martin State Airport. West Baltimore is being upgraded as part of the Douglass Tunnel program, while Martin State Airport has a separate program, which appears funded.
In total, all of this is around $1.8 billion, with the benefits going to commuters at such rate that state matches would be expected; in Massachusetts at least, there are talks about doing it as part of the Regional Rail program, but no firm commitment.
Electrification
The variable-tension catenary south of New York, as users of the Northeast Corridor were reminded two months ago, is substandard. It’s long been a wish to replace it with constant-tension catenary, to both improve reliability and permit unrestricted speeds, up from today’s 135 mph (217 km/h).
Unfortunately, precisely because it’s a longstanding Amtrak project, the project definitions have been written in a way that is not compatible with any cost-effective construction. For example, Amtrak is under the impression that the catenary poles have to be redone because higher speeds require denser pole spacing; in fact, catenary systems sold routinely by European vendors allow high speeds at spacing that exists already on the legacy Northeast Corridor system.
This makes costing this more difficult; Amtrak’s official figures are of little relevance to a project that has even cursory levels of interest in adopting European practices. With the poles and substations already usable, the wire tensioning should cost less than installing new wires; around half of the cost of new-build electrification is the substations and transformers and the other half is the wires, so take the cost of new-build systems outside the US and Canada, cut in half, and then double back to take into account that it’s a four-track corridor. This is around $3 million/km, so around $1 billion corridor-wide.
Commuter rail lines that touch the Northeast Corridor need to be wired as well, and then it’s a matter of which ones count as touching, as with the high platform item. This includes 25 km of the North Jersey Coast Line, 72 km of the Raritan Valley Line, 31 km of the Morristown Line, 30 km of the Montclair-Boonton Line, 38 km of the Danbury Branch, a few hundred meters of Providence Line siding tracks, 6 km of the Stoughton Line, 34 km of the Franklin Line, and 15 km of the Fairmount Line. Much of the unwired territory is single-track, so lower per-km costs can be expected, on the order of $600 million total.
Together, this is about $1.6 billion.
Total
The sum of all of the above lines is $12.5 billion. It’s possible to go lower than this: the high platform and electrification costs are partly modernizing commuter rail that may not quite use the Northeast Corridor, and the Greenwich bypass may be dropped at the cost of 80 seconds (more, if Cos Cob Bridge speed limits have to be lower than what right-of-way geometry allows). A numerological $10 billion limit can still be met this way.
The Meaning of Construction Costs Per Rider
I’ve written a lot about urban rail construction costs per kilometer, but from time to time, my colleagues and I have been asked about what happens if we compare costs, not per kilometer, but per rider. There’s an intuition among people in transportation advocacy (including anti-transit activists who prefer cars) that the construction costs of urban rail lines per rider are a meaningful measure of cost-effectiveness. This intuition is true, and yet, it must be interpreted delicately.
First, modes of transit with different operating cost structures should tolerate different levels of capital costs; in particular, the current practice in which subways are built at higher cost per rider than light rail, which in turn is built at higher cost than bus lanes, reflects real differences in operating costs and does not mean there is overinvestment in subways and underinvestment in buses. And second, costs per rider can be too low, in a sense – if a city’s construction costs per rider are very low, indicating a very high benefit-cost ratio, then it shouldn’t be lauded for its fiscal prudence but scolded for not having built these lines long ago and for not building more today. In truth, places with healthy decisionmaking about infrastructure expand their networks to the limit of cost-effectiveness, which means that costs per rider averaged over an entire region vary less than costs per kilometer, and this just reflects that cities build what they can, so low-cost cities can afford to build lines to lower-ridership areas, which higher-cost cities would reject as too expensive for the benefit. This way, costs per rider are not too different in New York and in cities that build for an order of magnitude lower cost per km than New York.
The meaning of cost per rider
In the remainder of this post, the meaning of “cost per rider” is “cost divided by the ridership on a working day.” In Europe, workers get around six weeks of paid vacation, and tend to take them in the summer, leading to depressed ridership around July or August, depending on the city; daily counts usually avoid this period, so for example Stockholm specifies that daily ridership figures are taken in winter. This, as I will explain shortly, does not unduly make European lines look more cost-effective than they actually are.
The cost per rider is best understood as a cost-benefit measurement. All benefits of public transportation scale with ridership, generally linearly: higher ridership indicates tighter economic and social ties if it comes from more travel, and better environmental outcomes if it is at the expense of car travel. What’s more, raw ridership measured in trips is better at capturing these benefits than passenger-km. The issue is that focusing on p-km overrates the success of extremely suburban systems, which have low environmental benefits for their p-km (the users are typically park-and-riders and therefore drive extensively, just not to their city center jobs) and usually also high net operating costs since they are peaky and tend to charge low per-p-km fares. Conversely, the short-hop trip is a net profit to the system – even subways with distance-based fares charge degressive rather than linear fares – and comes from dense networks that cut out car-based travel entirely. These effects roughly cancel out to the point that ridership is a good proxy for actual benefits.
That said, all outcomes need to be scaled to regional or even national incomes. Economic benefits are usually measured relative to worker wages anyway; in some business case analyses, such as that of the United Kingdom, the economic benefit is even scaled to rider income rather than regional or national income, which favors lines built to rich neighborhoods over lines built to poor ones, and isn’t really how cities need to think about their public transit networks. Social benefits are usually taken on a willingness-to-pay basis, and the same is true of health benefits including reduced air and noise pollution from cars and reduced car accidents.
The next step is then to compare the cost per rider with GDP per capita, which is not perfect but is good enough as a proxy for incomes. This also takes care of the issue of Europe’s synchronized summer troughs in local travel: those six weeks of paid vacation are visible in reduced GDP per capita, so the apparent bonus to the European system of using cost per daily trip where “day” means “workday outside the summer vacation season” rather than cost per annual trip cancels out with reduced annual GDP per capita.
The rough rule of thumb I use is that the absolute limit of cost-effectiveness for a subway or commuter rail line is when the cost per rider is equal to GDP per capita. This is a coincidence: a one-time cost has no reason to be equal to an annual income – this just follows from Börjesson-Jonsson-Lundberg’s estimate of the Stockholm Metro’s benefit-cost ratio compared with its cost per rider relative to the GDP per capita of 1960s’ Sweden. In practice, infrastructure is never built down to a benefit-cost ratio of 1, due to construction risks; in countries that make decisions based on benefit-cost analyses, the minimum is usually 1.2 or 1.3. In this schema, the United States can afford to build up to an envelope of $85,373/1.3 to $85,373, which is $65,000-70,000/rider in 2024 prices. The frontier lines, like the Interborough Express, are fairly close to this limit already; in practice, there’s a range, with some lines in the same city built well over the limit for political reasons (often airport connectors) and others built far below it.
Cost per rider by mode
The above analysis works for subways and commuter rail. It does not work for trams or buses. The reason is that surface transit never achieves the same low operating costs as metros, so in practice, the total cost to be truly comparable needs to be incremented by the additional operating costs.
To be clear, this is just a rule of thumb. There are different metro lines, even with the exact same technology in the same city, with different projected operating cost profiles; for example, in Vancouver, the Broadway extension of SkyTrain toward UBC was projected in the 2010s to reduce net operating costs as many buses would be replaced by fewer, larger trains, but the outward extension of the same system deeper into Surrey and Langley is projected to increase net operating costs. There are different ways to interpret this – for example, the Surrey extension is in a more auto-oriented area, with more likely car-to-train switchers (this is still much denser than an American park-and-ride); on net, though, I think the differences are not huge and could to an extent even be folded into the notion of cost per rider, which is substantially better on Broadway than in Surrey and Langley.
That said, metros consistently have much lower operating costs than light rail and buses in the same city; here are American cost profiles. As far as I can tell from CoMET data, most European and Asian metros cluster toward the bottom end of the American cost profile (such as the Chicago L; the New York City Subway is the top end among the big systems); bus operating costs are more or less proportional to driver wages times operating hours throughout the developed world. Here we need to briefly switch to cost per p-km, since mature urban rail networks use buses as short-hop feeders – the counterfactual to a bus-based network for New York isn’t people riding the same bus routes as today but at higher intensity, but people riding longer bus routes, so the cost would roughly scale to cost per p-km, not per passenger.
In rich Asia, metros are profitable. In Europe, it depends – the London Underground operationally broke even in the early 2010s, and the Berlin U-Bahn was said to do the same in the late 2010s. In healthy European systems, it’s never reported directly, since there’s fare integration across the region, so financial data are reported at metropolitan scale without much breakdown between the modes, but the farebox operating ratios in at least Germany and Scandinavia, and probably also Paris (which has much higher ridership density than London or Berlin, comparable costs per car-km, and higher fares than pre-2022 Berlin), suggest that metros and the inner sections of commuter rail systems can break even, and then the subsidies go to the buses and to suburban extensions.
Individual bus systems can be profitable, but never at metropolitan scale, not in the first-world cities I’m aware of. In New York, the buses between New Jersey and Manhattan are profitable and run by private companies, but that’s one specific section of the system, and on net the bus system in New Jersey, including not just these cross-tunnel buses but also internal buses within the state, loses money, covered by New Jersey Transit subsidies, and the financial performance of buses within New York is, frankly, terrible.
One potential complication is that BRT infrastructure is usually installed on the highest-performing individual routes, and those can have rather low operating costs. But then, the operating costs of the buses on Broadway in Vancouver are extraordinarily low, and still the projections are for the SkyTrain extension that would replace them to, on net, reduce systemwide operating subsidies. If your city has a bus corridor so strong that ordinary BRT would be profitable, the corridor has high enough ridership for a subway.
Light rail is essentially a via media between metros and buses: higher operating costs than metros, in theory lower ones than buses. I say in theory, because in the United States, light rail as a mode comprises different things, some behaving like lower-efficiency subways with shorter cars like the Boston Green Lines, and others running as mostly grade-separated urban rail in cities like the Los Angeles and Portland cities with extremely low ridership and high resulting operating costs. But a light rail system with serious ridership should comfortably obtain better operating outcomes than buses, if worse ones than metros.
Costs per rider can be too low
In New York, as mentioned above, the current urban rail extensions under construction (Second Avenue Subway Phase 2) or discussion (Interborough Express) have costs not far from the frontier relative to American incomes. In Berlin, the extensions instead are far cheaper; U8 to Märkisches Viertel was projected to cost 13,160€ per daily rider in 2021, which is a fraction of Germany’s GDP per capita.
This does not mean Berlin builds cost-effectively. It means Berlin builds too little. A line that costs less than one third the country’s GDP per capita should have been built when the GDP per capita was one third what it is now. If there are a lot of such possibilities in the city, it means there was a crisis it’s only now recovering from or there has been too much austerity, or both, in the case of Berlin.
Healthy construction environments – that is, not Germany, which has normal costs per kilometer and chooses to barely build intercity or urban rail – will instead build to the frontier of what’s cost-effective. In New York, it’s Second Avenue Subway; in Madrid, it’s extensions into deep suburbia making the system almost as long as that of New York, on one third the metro area population. Rational yes/no decisions on whether to build at all can coexist with good construction practices or with deeply irrational ones.
More American Station Construction Extravaganza
Los Angeles has plans to extend its urban rail network. They’re taking forever, because construction costs are extremely high – and Nick Andert just pointed out one reason: the station caverns are huge. The overage on the proposed northern extension of the K Line, also known as the Crenshaw/LAX Line, is a good deal larger than on Second Avenue Subway, making it the most wasteful station construction that I am aware of. This is driving up the construction cost estimate to, depending on which alignment the K Line is to take as it goes north into West Hollywood, around $1 billion per kilometer.
Nick provides some station footprint diagrams. The K Line’s stations are designed for a maximum train length of three cars, or about 81 meters in total. The stations on the proposed extension, however, start at 124 meters when there is no crossover, or 50% overage, and most are 300 meters with crossovers. In other words, an underground light rail extension with trains less than half the length of New York City Subway trains is proposed to have stations about as long as those on Second Avenue Subway, which are already about twice as long as they need to be by New York standards. (In the low- and medium-cost countries for which I have this information, the overage is not 50%, but ranges between 3% and 17%.)
The 50% overage without crossovers is completely unjustifiable. But the crossovers, which turn the 50% into nearly 300% overage, are equally unjustifiable. It is not normal to build bored tunnel subways with so many crossovers, precisely because it’s expensive to blast caverns for them. Marco gives the example of Milan M4, which, counting the soon-to-open extension, has four crossovers in 15.5 km and 21 stations.
To this I can add that the Copenhagen Metro, built with bored tunnel with blasted caverns for crossover, has on the original line just two underground crossovers; the City Circle Line has only two as well, plus two on the M4 branch. There are more crossovers above ground, where it’s not so expensive to build them, but still less than one per station. This is a system designed for 24/7 operation; crossovers are required to allow trains to run on a single bidirectional track at night to permit maintenance, one track at a time. Without this constraint, even fewer crossovers are needed – only at the ends of the line, which includes the end of each operating segment if the line opens in stages.
If the K Line extension’s split between station and tunnel costs is similar to that of Second Avenue Subway Phase 1, 3:1, then shrinking the stations to the normal overage of a few percent would slash their cost by a factor of close to four, which would cut the line’s cost by more than half. This is what the extravaganza of crossovers is doing to Los Angeles and its ability to build mass transit infrastructure.
