Category: High-Speed Rail

Curves in Fast Zones
I wrote nearly five years ago that the lowest-hanging fruit for speeding up trains are in the slowest sections. This remains true, but as I (and Devin Wilkins) turn crayon into a real proposal, it’s clear what the second-lowest hanging fruit is: curves in otherwise fast sections. Fixing such curves sometimes saves more than a minute each, for costs that are not usually onerous.
The reason for this is that curves in fast zones tend to occur on a particular kind of legacy line. The line was built to high standards in mostly flat terrain, and therefore has long straight sections, or sections with atypically gentle curves. Between these sections the curves were fast for the time; in the United States, high standards for the 19th century meant curves of radius 1,746 meters, at which point each 100′ (30.48 meters) of track distance correspond to one degree of change in azimuth; 30.48*180/pi = 1,746.38. For much more information about speed zones, read this post from four weeks ago first; I’m going to mention some terminology from there without further definitions.
These curves are never good enough for high-speed rail. The Tokaido Shinkansen was built with 2,500 meter curves, and requires exceptional superelevation and a moderate degree of tilting (called active suspension) to reach 285 km/h. This lateral acceleration, 2.5 m/s^2, can’t really be achieved on ordinary high-speed rolling stock, and the options for it always incur higher acquisition and operating costs, or buying sole-sourced Japanese technology at much higher prices than are available to Japan Railways. In practice, the highest number that can be acheived with multi-vendor technology is around 2.07 m/s^2, or at lower speed around 2.2; 1,746*2.07 = 3,614.22, which corresponds to 60.12 m/s, or 216 km/h.
If a single such curve appears between two long, straight sections, then the slowdown penalty for it is 23.6 seconds from a top speed of 300 km/h, 35.5 from a top speed of 320 km/h, or 67 seconds from a top speed of 360 km/h. The curve itself is not instantaneous but has a few seconds of cruising at the lower speed, and this adds a few seconds of penalty as well.
Case in point: the curve between Kingston and Wickford Junction in South County, Rhode Island is such a curve. The red line below denotes a 4 km radius curve, good for a little more than 320 km/h (360 with tilt), deviating from the black line of the existing curve.

The length of the existing curve is about 1.3 km, so to the above penalties, add 6 seconds if the top speed is 300 km/h, 7 if it’s 320, or 8.7 if it’s 360 (in which case the curve needs to be a bit wider unless tilting is used). If it’s not possible to build a wider curve than this, then from a top speed of 360 km/h, the 320 km/h slowdown adds 10 seconds of travel time, including a small penalty for the 1.3 km of the curve and a larger one for acceleration and deceleration; thus, widening the curve from the existing one to 4 km radius actually has a larger effect if the top speed on both sides is intended to be 360 and not 320 km/h.
The inside of this curve is not very developed. This is just about the lowest-density part of the Northeast Corridor. I-95 has four rather than six lanes here. Land acquisition for curve easement is considerably easier than in higher-density sprawl in New Jersey or Connecticut west of New Haven.
The same situation occurs north of Providence, on the Providence Line. There’s a succession of these 1,746 meter curves, sometimes slightly tighter, between Mansfield and Canton. The Canton Viaduct curve is unfixable, but the curves farther to the south are at-grade, with little in the way; there are five or six such curves (the sixth is just south of the viaduct and therefore less relevant) and fixing all of them together would save intercity trains around 1:15.
For context, 1.3 km of at-grade construction in South County with minimal land acquisition should not cost more than $50 million, even with the need to stage construction so that the new alignment can be rapidly connected to the old one during the switchover. Saving more than a minute for $50 million, or even saving 42 seconds for $50 million, is around 1.5 orders of magnitude more cost-effective than the Frederick Douglass Tunnel in Baltimore ($6 billion for 2.5 minutes); there aren’t a lot of places where it’s possible to save so much time at this little cost.
It creates a weird situation in which while the best place to invest in physical infrastructure is near urban stations to allow trains to approach at 50-80 km/h and not 15-25, the next best is to relieve 210 km/h speed zones that should be 300 km/h or more. It’s the curvy sections with long stretches of 120-160 km/h that are usually more difficult to fix.
The Northeast Corridor Rail Grants
The US government has just announced a large slate of grants to rail from the Bipartisan Infrastructure Law. Amtrak has a breakdown of projects both for itself and partners, totaling $16.4 billion. There are a few good things there, like Delco Lead, or more significantly more money for the Hudson Tunnel Project (already funded separately, but this covers money the states would otherwise be expected to fund). There are also conspicuously missing items that should stay missing – But by overall budget, most of the grant is pretty bad, covering projects that are in principle good but far too expensive per minute saved.
This has implications to the future of the Northeast Corridor, because the total amount of money for it is $30 billion; I believe this includes Amtrak plus commuter rail agencies. Half of the money is gone already, and some key elements remain unfunded, some of which are still on agency wishlists like Hunter Flyover but others of which are still not, like Shell Interlocking. It’s still possible to cobble together the remaining $13.6 billion to produce something good, but there have to be some compromises – and, more importantly, the process that produced the grant so far doesn’t fill me with confidence about the rest of the money.
The Baltimore tunnel
The biggest single item in the grant is the replacement tunnel for the Baltimore and Potomac Tunnel. The B&P was built compromised from the start, with atypically tight curves and steep grades for the era. An FRA report on its replacement from 2011 goes over the history of the project, originally dubbed the Great Circle Passenger Tunnel when first proposed in the 1970s; the 2011 report estimates the cost at $773 million in 2010 prices (PDF-p. 229), and the benefits at a two-minute time saving (PDF-p. 123) plus easier long-term maintenance, as the B&P has water leakage in addition to its geometric problems. At the time, the consensus of Northeastern railfans treated it as a beneficial and even necessary component of Northeast Corridor modernization, and the agencies kept working on it.
Since then, the project’s scope crept from two passenger tracks to four tracks with enough space for double-stacked freight and mechanical ventilation for diesel locomotives. The cost jumped to $4 billion, then $6 billion. The extra scope was removed to save money, said to be $1 billion, but the headline cost remained $6 billion (possibly due to inflation, as American government budgeting is done in current dollars, never constant dollars, creating a lot of fictional cost overruns). The FRA grant is for $4.7 billion out of $6 billion. Meanwhile, the environmental impact statements upped the trip time benefit of the tunnel for Amtrak from two to 2.5 minutes; this is understandable in light of either higher-speed (and higher-cost) redesign or an assumption of better rolling stock than in the 2011 report, higher-acceleration trains losing more time to speed restrictions near stations than lower-acceleration ones.
That this tunnel would be funded was telegraphed well in advance. The tunnel was named after abolitionist hero Frederick Douglass; I’m not aware of any intercity or commuter rail tunnel elsewhere in the developed world that gets such a name, and the choice to name it so about a year ago was a commitment. It’s not a bad project: the maintenance cost savings are real, as is the 2.5 minute improvement in trip time. But 2.5 minutes are not worth $6 billion, or even $6 billion net of maintenance. In 2023 dollars, the estimate from 2011 is $1.1 billion, which I think is fine on the margin – there are lower-hanging fruit out there, but the tunnel doesn’t compete with the lowest-hanging fruit but with the $29 billion-hanging fruit and it should be very competitive there. But when costs explode this much, there are other things that could be done better.
Bridge replacements
The Northeast Corridor is full of movable bridges, which are wishlisted for replacement with high fixed spans. The benefits of those replacements are there, mainly in maintenance costs (but see below on the Connecticut River), but that does not justify the multi-billion dollar budgets of many of them. The Susquehanna River Rail Bridge, the biggest grant in this section, is $2.08 billion in federal funding; the environmental impact study said that in 2015 dollars it was $930 million. The benefits in the EIS include lower maintenance costs, but those are not quantified, even in places where other elements (like the area’s demographics) are.
Like all state of good repair projects, this is spending for its own sake. There are no clear promises the way there are with the Douglass Tunnel, which promises to have a new tunnel with trip time benefits, small as they are. Nobody can know if these bridge replacement projects achieved any of their goals; there are no clear claims about maintenance costs with or without this, nor is there any concerted plan to improve maintenance productivity in general.
The East River Tunnel project, while not a bridge nor a visible replacement, has the same problem. The benefits are not made clear anywhere. There are some documents we found in the ETA commuter rail report saying that high-density signaling would allow increasing peak capacity on one of the two tunnel pairs from 20 to 24 trains per hour, but that’s a small minority of the overall project and in the description it’s an item within an item.
The one exception in this section is the Connecticut River. This bridge replacement has a much clearer benefit – but also is a down payment on the wrong choice. The issue is that pleasure boat traffic has priority over the railroad on the “who came first” principle; by agreement with the Coast Guard, there is a limited number of daily windows for Amtrak to run its trains, which work out to about an Acela and a Regional every hour in each direction. Replacing this bridge, unlike the others, would have a visible benefit: more trains could run (once new rolling stock comes in, but that’s already in production).
Unfortunately, the trains would be running on the curviest and also most easily bypassable section of the Northeast Corridor. The average speed on the New Haven-Kingston section of the Northeast Corridor is low, if not so low on the less curvy but commuter rail-primary New Haven Line farther west. The curves already have high superelevation and the Acelas tilt through them fully; there’s not much more that can be done to increase speed, save to bypass this entire section. Fortunately, a bypass parallel to I-95 is feasible here – there isn’t as much suburban development as west of New Haven, where there are many commuters to New York. Partial bypasses have been studied before, bypassing both the worst curves on this section and all movable bridges, including that on the Connecticut. To replace this bridge in place is a down payment on, in effect, not building genuine high-speed rail where it is most useful.
Other items
Some other items on the list are not so bad. The second largest item in the grant, $3.79 billion, is increasing the federal contribution to the Hudson Tunnel Project from about 50% to about 70%. I have questions about why it’s necessary – it looks like it’s covering a cost overrun – but it’s not terrible, and by cost it’s by far the biggest reasonable item in this grant.
Beyond that, there are some small projects that are fine, like Delco Lead, part of a program by New Jersey Transit to invest around New Brunswick and Jersey Avenue to create more yard space where it belongs, at the end of where local trains run (and not near city center, where land is expensive).
What’s not (yet) funded
Overall, around 25% of this grant is fine. But there are serious gaps – not only are the bridge replacements and the Douglass Tunnel not the best use of money, but also some important projects providing both reliability and speed are missing. The two most complex flat junctions of the Northeast Corridor near New York, Hunter in New Jersey and Shell in New Rochelle, are missing (and Hunter is on the New Jersey Transit wishlist); Hunter is estimated at $300 million and would make it much more straightforward to timetable Northeast Corridor commuter and intercity trains together, and Shell would likely cost the same and also facilitate the same for Penn Station Access. The Hartford Line is getting investment into double track, but no electrification, which American railroads keep underrating.
Setting Speed Zones
At the Boston meetup two days ago, I was asked about what tools I use to generate timetables, for example for my New York commuter rail posts. The answer is that I use speed zones and then run this code on them – but then the question is how to figure out speed zones. I hope that this sequence of steps will help advocates who are interested in rail modernization.
Generating curve radii
The most difficult element to fix on mainline rail is the right-of-way geometry. Most other things that can restrict a train’s speed can be fixed with more modern maintenance, but right-of-way geometry doesn’t change without physical construction, often in constrained areas – if they weren’t constrained, the curves would have been built wider in the first place.
The best case scenario is that there exist track maps with exact curve radii. I have these for large chunks of the Northeast Corridor, but not all. For example, here is Metro-North (with thanks to The Korot). Curves on such maps are denoted as circles or bumps deviating from a line, with the direction of the circle indicating the direction of the curve’s curvature. On this and other American maps, the radius is listed in degrees, and the cant (see the section below) in inches.
To convert the radius from degrees to more usual units, set one degree to be 1,746 meters, and note that degrees measure curvature and not radius, so a two degree curve has half the radius of a one degree curve. More precisely, the formula is that degrees measure the change in azimuth over 100 feet; 100 feet are 30.48 meters, and converting 30.48 from degrees to radians gives 1,746.37536… meters.
For example, on the Metro-North chart, let’s look at Harrison, New York. It’s on PDF-p. 24 of the chart; Harrison is sandwiched between two curves with opposite orientations, with the platforms on tangent (uncurved) track. The curve just west of Harrison has radius 1° 58′ 30″, which is 884.24069… meters; the curve just east has radius 2° 2′ 15″, which is 857.11674… meters.
Converting curve radii to speeds
The formula for the speed of a train, in SI units, is

I wrote about lateral acceleration, cant, and cant deficiency two and a half years ago. In short, lateral acceleration, in m/s^2, is the centrifugal force coming from the action of the train rounding the curve at speed. For the purposes of the formula, it is measured in the horizontal plane. To reduce the centrifugal force felt by the passengers (for comfort and safety) as well as that felt by the train body (for safety and maintenance costs), the tracks will typically be banked so that the inner rail is lower than the outer rail, which is called cant or superelevation, and is written in units of distance, such as mm or inches.
The speed of a train on canted track is typically higher than the perfect balancing speed, where the force of gravity counteracts that of centrifugal force; thus, on a fast train there is a residual force pointing to the outside of the train, which can be written down as lateral acceleration in the plane of the tracks (in m/s^2), but is more typically written down in the same units as superelevation, representing the additional superelevation required for the speed to perfectly balance, which is called cant deficiency or underbalance.
The conversion rate between cant (or cant deficiency) is the track gauge measured between the middle of the two rails, divided by the gravitational constant (9.8 m/s^2). Track gauge is typically given as inner rail to inner rail; standard gauge is 1,435 mm inner rail to inner rail. The relevant quantity to superelevation calculations is a few cm more; on standard gauge, it’s taken to be about 1,470-1,500 mm, so the conversion rate is 1 m/s^2 = 150 mm of cant or cant deficiency. The two quantities, cant and cant deficiency, are additive.
The American track charts that I have specify the actual cant. However, the values tend to be too conservative. Again with the example of Harrison, the slightly wider western curve has 5″ cant and the slightly tighter eastern curve has 4.125″ cant. Regulations for maximum cant depend on the country and maintenance standards. The absolute maximum cant I am aware of on any standard-gauge railway is 200 mm on the Tokaido and Tohoku Shinkansen. The reasons not to raise cant further include maintenance difficulties and the risk of a train running at lower speed or even stopping on the track. On lines that are not captive to just high-speed trains, the highest cant I am aware of is 180 mm, in Germany, and this is rare; 160 mm is more common. The American limit is 7″, but frequent inspections are required at that point to ensure that the tracks don’t get bent out of shape to produce higher cant; 8″ is a do-not-exceed level, and in practice track irregularities may lead to exceeding it if there isn’t regular track maintenance.
In practice, raising the cant is usually easy – it can be done with a track geometry machine automatically. However, in one case, it is not: that of S-curves, which have exactly the shape implied by the letter S. Our example of Harrison has two reverse curves in close proximity, but is not an S-curve, as there are hundreds of meters of tangent track between the two curves. Other places do have S-curves, and there, the maximum cant must be lowered somewhat; regulations vary on this, but in Europe, the maximum change in cant is 30-55 mm per second depending on the country (there’s a secondary regulation on mm per meter, but on the Northeast Corridor, the binding rule is mm/s, not mm/m). For example, if we take 45 mm/s, and 180 mm of cant, then it takes four seconds to reverse a curve; note that it is four and not eight, because half of the increase in cant, called a superelevation spiral, is within the curve. Harrison’s current curves impose a hard limit of about 150 km/h, at which point the hundreds of meters of tangent track make it trivially easy to have full superelevation. However, other places, most infamously among Northeastern railfans Elizabeth, there is an actual S-curve, forcing lower cant and lower speeds.
Finally, the maximum cant deficiency depends on the track, the train, and the regulations. Traditionally, American regulations limited most passenger trains to 3″ of cant deficiency, which is ridiculously conservative; in the 2000s, a waiver allowing 5″ in some cases was derided as the “magic high-speed rail waiver” because it applied not just to higher-speed tracks but also to lower-speed lines that had through-service to higher-speed tracks. Since then, FRA regulations have changed, and now the practical limit in the US, with extensive testing, is 6″, or 150 mm cant deficiency, at most speeds. European limits tend to be around 130-150 mm; high-speed trains are at the lower end of this range unless they are tilting trains, which nearly all trains are not. Cant deficiency, like cant, requires its own superelevation spiral on S-curves, but the limits are in practice looser than for cant, and in some cases trains can change superelevation abruptly, with no spiral, for example on switches.
The upshot is that in the typical case, the most aggressive assumption should be 180 mm cant, 150 mm cant deficiency, for a lateral acceleration in the horizontal plane of 2.2 m/s^2. Most lines will not have this pair of aggressive assumptions: 180 mm is only viable when it’s guaranteed that trains will not stop on a canted curve, which is a reasonable assumption on a reliable high-speed line and even on a German high-speed line. Moreover, if there is any freight on the line, superelevation must fall drastically: slower trains would be at cant excess, and freight trains have high center of mass (diesel locomotives and double-stacked containers both have higher center of mass than electric passenger trains) and therefore have tight cant excess limits. Aggressive assumptions are viable on the Northeast Corridor and on controllable commuter lines with no or almost no freight, such as the LIRR, but not everywhere else.
Finding curve radii
In some cases, curve radii are spelled out in a chart. In others, they are not, and must be figured out. Our program’s schedule writer, Devin Wilkins, tells me she has just found a track chart for SEPTA, but otherwise, I have no such charts south of New York. There, the dirty, imperfect method of estimating curve radii must be used.
For that, I use Google Earth. Nowadays, Google Earth Pro is free, and comes with a circle tool. In theory, I can fidget with the radius of a circle until I find that it approximates the arc of a curve well. This requires paying special attention to how the drawn curve compares with not just the broad outline of the curve but also the exact arc of each track or even each rail: the drawn curve should be at the same relative position to the rails, such as following one rail of one track, or right in the center of one track, or right between the track centers, and so on.
In cases of uncertainty, it’s also possible to use Google Earth line tools, which state the azimuth of each line. If I can find the exact start and end points of each curve, and the azimuths of the tangents on both side, then I can draw the chord with a line tool, verifying that its azimuth is the exact arithmetic mean of the azimuths of the two tangents; if it is not the mean, then either I made an error (more likely) or the curve is not a perfect circle (possible but less likely). The radius of the curve is approximately the length of the chord times 180/pi divided by change in azimuth; more precisely, the radius is

This method is error-prone, especially for short, sharp curves. Computing the start and end points of the curve will always have errors, and if the change in azimuth is small, then these will lead to large errors. The circle tool method suffers from the same drawback: it’s easier to use it to estimate the radius of a curve with 60 degree change in azimuth than that of one with 10 degree change.
Over time I’ve gotten this method down to the point that my errors from what I later find with track charts such as that of Metro-North are fairly small, and not very biased in the larger-radius direction. But it takes time and practice and ideally you should avoid it for short, sharp curves.
Update 10-28: Ari Ofsevit has a third method, using chord lines.
Other speed limits
Speed limits on intercity trains mostly come from curves. But there are other things to keep in mind, not all of which are fixable:
- Tunnels increase air resistance to the point that unless the tunnels are constructed with large enough radius to have a lot of free air (modern tunnels are, legacy ones aren’t), or unless the trains are pressurized, the speed limit has to be lower just to avoid popping passengers’ ears at entry and exit.
- Switches generally have low speed limits – they have tight curves and no superelevation – making all complex junctions and major stations slow.
- Terminal stations have another set of speed limits coming from the bumper tracks. American limits are very conservative – 10 mph where a ramp down from 40 or 50 km/h is more normal in Europe – but even 50 km/h is not 200 km/h.
- Some pieces of infrastructure are so shoddy that they limit the dynamical axle load of the train, which is derived from both static axle load, which is a function of train mass, and speed. As usual, American limits on this are conservative, assuming high static axle load and fixing a low speed on some very old bridges, instead of permitting lighter trains to run faster. But it is sometimes a real problem.
High Speed 2 is (Partly) Canceled Due to High Costs
It’s not yet officially confirmed, but Prime Minister Rishi Sunak will formally announce that High Speed 2 will be paused north of Birmingham. All media reporting on this issue – BBC, Reuters, Sky, Telegraph – centers the issue of costs; the Telegraph just ran an op-ed supporting the curtailment on grounds of fiscal prudence.
I can’t tell you how the costs compare with the benefits, but the costs, as compared with other costs, really are extremely high. The Telegraph op-ed has a graph with how real costs have risen over time (other media reporting conflates cost overruns with inflation), which pegs current costs, with the leg to Manchester still in there, as ranging from about £85 billion to £112 billion in 2022 prices, for a full network of (I believe) 530 km. In PPP terms, this is $230-310 million/km, which is typical of subways in low-to-medium-cost countries (and somewhat less than half as much as a London Undeground extension). The total cost in 2022 terms of all high-speed lines opened to date in France and Germany combined is about the same as the low end of the range for High Speed 2.
I bring this up not to complain about high costs – I’ve done this in Britain many times – but to point out that costs matter. The ability of a country or city to build useful infrastructure really does depend on cost, and allowing costs to explode in order to buy off specific constituencies, out of poor engineering, or out of indifference to good project delivery practices means less stuff can be built.
Britain, unfortunately, has done all three. High Speed 2 is full of scope creep designed to buy off groups – namely, there is a lot of gratuious tunneling in the London-Birmingham first phase, the one that isn’t being scrapped. The terrain is flat by French or German standards, but the people living in the rural areas northwest of London are wealthy and NIMBY and complained and so they got their tunnels, which at this point are so advanced in construction that it’s not possible to descope them.
Then there are questionable engineering decisions, like the truly massive urban stations. The line was planned with a massive addition to Euston Station, which has since been descoped (I blogged it when it was still uncertain, but it was later confirmed); the current plan seems to be to dump passengers at Old Oak Common, at an Elizabeth line station somewhat outside Central London. It’s possible to connect to Euston with some very good operational discipline, but that requires imitating some specific Shinkansen operations that aren’t used anywhere in Europe, because the surplus of tracks at the Parisian terminals is so great it’s not needed there, and nowhere else in Europe is there such high single-city ridership.
And then there is poor project delivery, and here, the Tories themselves are partly to blame. They love the privatization of the state to massive consultancies. As I keep saying about the history of London Underground construction costs, the history doesn’t prove in any way that it’s Margaret Thatcher’s fault, but it sure is consistent with that hypothesis – costs were rising even before she came to power, but the real explosion happened between the 1970s (with the opening of the Jubilee line at 2022 PPP $172 million/km) and the 1990s (with the opening of the Jubilee line extension at $570 million/km).
The Importance of Tangibles
I’m writing this post on a train to Copenhagen. So many things about this trip are just wrong: the air conditioning in the car where we reserved seats is broken so we had to find somewhere else to sit, the train is delayed, there was a 10-minute stop at the border for Danish cops to check the IDs of some riders (with racial profiling). Even the booking was a bit jank: the Deutsche Bahn website easily sells one-ways and roundtrips, but this is a multi-city trip and we had to book it as two nested roundtrips. Those are the sort of intangibles that people who ride intercity trains a lot more than I do constantly complain about, usually when they travel to France and find that the TGV system does really poorly on all the metrics that the economic analysis papers looking at speed do not look at. And yet, those intangibles at the end of the day really are either just a matter of speed (like the 10-minute delay at the border) or not that important. But to get why it’s easy for rail users to overlook them, it’s important to understand the distinction between voice and exit.
Voice and exit strategies
The disgruntled customer, employee, or resident can respond in one of two ways. The traditional way as understood within economics is exit: switch to a competing product (or stop buying), quit, or emigrate. Voice means communicating one’s unhappiness to authority, which may include exercising political power if one has any; organizing a union is a voice strategy.
These two strategies are not at all mutually exclusive. Exit threat can enhance voice: Wikipedia in the link above gives the example of East Germany, where the constant emigration threat of the common citizenry amplified the protests of the late 1980s, but two more examples include union organizing and the history of Sweden. With unions, the use of voice (through organizing and engaging in industrial action) is stronger when there is an exit threat (through better employment opportunities elsewhere); it’s well-known that unions have an easier time negotiating better wages, benefits, and work conditions during times of low unemployment than during times of high unemployment. And with Sweden, the turn-of-the-century union movement used the threat of emigration to the United States to extract concessions from employers, to the point of holding English classes for workers.
Conversely, voice can amplify exit. To keep going with the example of unions, unions sometimes engage in coordinated boycotts to show strength – and they request that allies engage in boycotts when, and only when, the union publicly calls for them; wildcat boycotts, in which consumers stop using a product when there is a labor dispute without any union coordination, do not enhance the union’s negotiating position, and may even make management panic thinking the company is having an unrelated slump and propose layoffs.
The upshot is that constantly complaining about poor service is a voice strategy. It’s precise, and clearly communicates what the problem is. However, the sort of people who engage in such public complaints are usually still going to ride the trains. I’m not going to drive if the train is bad; I’d have to learn how to drive, for one. In my case, poor rail service means I’m going to take fewer trips – I probably would have done multiple weekend trips to each of Munich and Cologne this summer if the trains took 2.5 hours each way and not 4-4.5. In the case of more frequent travelers than me, especially railfans, it may not even mean that.
The trip not taken
On this very trip, we were trying to meet up in Hamburg with a friend who lives in Bonn, and who, like us, wants to see Hamburg. And then the friend tried booking the trip and realized that it was 4.5 hours Hbf-to-Hbf, and more than five hours door-to-door; we had both guessed it would be three hours; a high-speed rail network would do the trip in 2:15. The friend is not a railfan or much of a user of social media; to Deutsche Bahn, the revenue loss is noticeable, but not the voice.
And that’s where actually measuring passenger usage becomes so important. People who complain are not a representative cross-section of society: they use the system intensively, to the point that they’re unlikely to be the marginal users the railroad needs to attract away from driving or to induce to make the trip; they are familiar with navigating the red tape, to the point of being used to jank that turns away less experienced users; they tend to be more politically powerful (whereas my friend is an immigrant with about A2 German) and therefore already have a disproportionate impact on what the railroad does. Complaints can be a useful pilot, but they’re never a substitute for counting trips and revenue.
The issue is that the main threat to Deutsche Bahn, as to any other public railroad, is loss of passengers and the consequent loss of revenue. If the loss of revenue comes from a deliberate decision to subsidize service, then that’s a testament to its political power, as is the case for various regional and local public transport subsidy scheme like the Deutschlandticket and many more like it at the regional level in other countries. But if it comes from loss of passenger revenue, or even stagnation while other modes such as flying surge, then it means the opposite.
This is, if anything, more true of a public-sector rail operator than a private-sector one. A private-sector firm can shrink but maintain a healthy margin and survive as a small player, like so many Class II and III freight rail operators in the United States. But a national railway is, in a capitalist democracy, under constant threat of privatization. The threat is always larger when ridership is poor and when the mode is in decline; thus, British Rail was privatized near its nadir, and Japan National Railways was privatized while, Shinkansen or no Shinkansen, it was losing large amounts of money, in a country where the expectation was that rail should be profitable. Germany threatened to do the same to Deutsche Bahn in the 1990s and 2000s, leading to deferred maintenance, but the process was so slow that by the time it could happen, during the 12 years of CSU control of the Ministry of Transport, ridership was healthy enough there were no longer any demands for such privatization. The stagnant SNCF of the 2010s has had to accept outside reforms (“Société Anonyme”), stopping short of privatization and yet making it easier to do so in the future should a more right-wing government than that of Macron choose to proceed.
The path forward
Rail activists should recognize that the most important determinant of ridership is not the intangibles that irk people who plan complex multi-legged regional rail trips, but the basics: speed, reliability, fares, some degree of frequency (but the odd three-hour wait on a peripheral intercity connection, while bad, is not the end of the world).
On the train I’m on, the most important investment is already under construction: the Fehmarn Belt tunnel is already under construction, and is supposed to open in six years. The construction cost, 10 billion € for 18 km, is rather high, setting records in both countries. The project is said to stand to shorten the Hamburg-Copenhagen trip time, currently 4:40 on paper with an average delay of 21 minutes and a 0% on-time performance in the last month, to 2.5 hours. If Germany bothers to build high-speed approaches, and Denmark bothers to complete its own high-speed approaches and rate them at 300 km/h and not 200-250, the trip could be done in 1.5 hours.
Domestically, and across borders that involve regular overland high-speed rail rather than undersea tunnels, construction of fast trains proceeds at a sluggish pace. German rail advocates, unfortunately, want to see less high-speed rail rather than more, due to a combination of NIMBYism, the good-enough phenomenon, and constant sneering at France and Southern Europe.
But it’s important to keep focusing on a network of fast rail links between major cities. That’s the source of intercity rail ridership at scale. People love complaining about the lack of good rail for niche town pairs involving regional connections at both ends, but those town pairs are never going to get rail service that can beat the car for the great majority of potential riders who own a car and aren’t environmental martyrs. In contrast, the 2.5- and three-hour connection at long intercity distances reliably gets the sort of riders who are more marginal to the system and respond to seeing a five-hour trip with exit rather than voice.
Deutsche Bahn’s Europabahn Study
Deutsche Bahn released a study three days ago proposing to build a Europe-wide network of high-speed trains. There aren’t too many details – the fully study PDF is corrupted (update: this direct link works) – but we can already learn a lot from the proposed map, which is available. I’m glad that proposals like this are out, but this one reminds me of the recent proposal for a massive expansion of the Berlin U-Bahn, which leaves a lot to be desired, comprising both necessary priorities and questionable lines; this time, there are some priorities that should be included but aren’t.

The map is clearly intended as a Europe-wide network. For reasons I don’t quite get, Britain and its under-construction High Speed 2 system is not included – it’s not an EU or Schengen member but neither are Serbia and North Macedonia, and meanwhile, Northern Ireland is included.
In some places, the proposed lines are taken straight out of current proposals. This is the case in Spain, Portugal, Italy, and France: on the French map, lines that are in active planning like Bordeaux-Dax and Toulouse-Montpellier/Perpignan are visible and so are lines that are stalled like Marseille-Nice or the Paris-Orléans-Lyon relief line.
There’s little to comment on in these places, save that some of the international connections are underbuilt under current plans. It’s frustrating that the current plans include a connection from Bordeaux to Basque Country and thence Madrid, and a more direct connection from Madrid to Pamplona, but not the short connection from Pamplona to the French border for faster Paris-Madrid service; French and Spanish trains are fast and these two cities, the two largest single-core regions in the EU, should be no more than 4.5 hours apart via the most direct routing. Italy is also, equally frustratingly, missing a fast connection from Milan into Switzerland, hooking into the new tunnels across the Alps with additional under-construction fast lines on the Swiss side; this way, the route from Zurich to Milan has an orphaned-looking fast section in the middle.
In Eastern Europe and Scandinavia, the map looks taken from existing proposals as well. Finland’s system is based on existing proposals. Their benefit-cost ratios were assessed to be underwater earlier this year (using atypically low estimates of the travel time elasticity – Helsinki-Tampere looks like they’re estimating -0.17, which is ridiculous; try -2), but this doesn’t mean they won’t happen. Sweden recently decided against a domestic high-speed rail system, but this again may be revived. Czechia is planning its own system, with international connections. But farther east, the lines get more fanciful – the Romanian and Hungarian networks look pretty overbuilt relative to the sizes of the cities in those countries, which aren’t growing.
And then there’s the German core. The domestic and international lines here mostly look like a very extensive proposal. Practically every city is on the map, to the point that there’s a 300 km/h line from Leipzig to Chemnitz. Some of those yellow lines on the map are already in planning, like Augsburg-Ulm, Hanover-Hamm, and Erfurt-Fulda.
But then there are the missing ones. Fulda-Hanau, currently on the planning board, is for some reason omitted. Berlin is getting two new high-speed rail lines to the south, one to Dresden and a separate one to Görlitz (district population 248,000), but nothing to Halle and Leipzig, even though that would also speed up the trains to Munich. This can’t be about the false belief that a four-hour trip time is good enough and there’s no point in speeding it up further, because then why would they include a spur to Chemnitz? It’s a three-hour trip today with a 40-minute transfer at Leipzig; the time saved from speeding up Leipzig-Chemnitz is less than what could be saved just by timing the connection better, let alone by doing that and also speeding up Berlin-Leipzig.
The international connections are pretty good. There’s finally a fast line to Zurich, plus two to Prague, plus an all-fast connection from Munich south across the Alps. Paris-Frankfurt is on the map, via Mannheim. The slow section to the Belgian border is fixed; the Netherlands gets four distinct connections, of which two I do not get (the three southern ones can be consolidated to one without taking a huge hit to trip times).
But then those international connections mostly just feed existing or planned lines. Thus, the fast line from Munich to the Austrian border is not accompanied by speeding up the Westbahn; Salzburg, per DB, should get fast trains to Munich and the rest of Germany, and Linz should get fast trains via two different lines, but then Vienna should stay connected by a medium-speed link.
And yet, at least in and around Germany, it looks like DB is proposing too much, not too little: cities like Szczecin, Bremerhaven, Kiel, Rostock, Chemnitz, and Görlitz are too small to be worth building a dedicated line to. Either send an ICE at lower speed from the nearest large node or run slow trains and try to time some connections. It’s proposing a 6,000 km network for Germany; I did a fair amount of crayoning in 2021, and got to somewhat more than 4,000, including international connections. The current network, including lines that shouldn’t be changed like Berlin-Hamburg or that are under construction like Karlsruhe-Basel, is around 1,700. So as with the Berlin U-Bahn map, it’s best to think of the current proposal as about half good lines, and half things that most likely shouldn’t see the light of day (Chemnitz, again).
I suspect the reason small cities like Kiel are included is that high-speed rail plans in Germany face constant criticism by technical railfans who think that small cities generate more traffic than they actually do. Part of it is that railfans and Green voters take the train at far higher modal split than does the general public, and thus use the train to get to places where everyone else not only drives but will keep driving even with better frequencies and connections. The same group also doesn’t mind sitting two hours longer on a train than at TGV speeds. Thus, rail advocacy in Germany kneecaps itself by insisting on the least cost-effective treatments. DB may be responding to such advocacy by proposing high-speed lines even to cities that are far too small to justify such connections, to preempt any criticism that cities like Görlitz are left out.
And this is sad, because most of the cross-border connections on the map out of or near Germany are really solid, and unfortunately underrated in current planning. I hope DB takes them seriously enough to commit to partnering with the other-country railway (SNCF, ÖBB, etc.) and building them, rather than shoving them below the priority level of a high-speed line from Berlin to Rostock.
Build Paris-Frankfurt High-Speed Rail
European high-speed rail networks end at national borders. There’s a good TGV network internal to France, and a good ICE network internal to Germany, but crossing borders is always onerous. Thalys trains between France and Belgium are atypically expensive, and the other cross-border lines always have slow zones such that average speeds are never high. For example, Paris-Frankfurt, the topic of this post, is fast on the French side but not on the German side, so that trains take 3:49 on most connections to do 584 kilometers. Against the poor service offered across borders in Europe, the Green advocate Jon Worth has called for improvements in service on existing lines, favoring regional and interregional connections. But now there’s a petition circulating around the EU calling for a Union-wide high-speed rail program connecting all capitals (I presume excluding island ones like Valletta). The petition is atypical for EU-level policy, in that it is written in plain language and talks about the benefits of high-speed rail rather than about obscure EU institutions that nobody outsides the Brussels bubble knows or cares about; I urge EU citizens to sign, to force the EU to take this infrastructure issue more seriously.
Infrastructure problems and operating problems
Not a single cross-border connection in Europe has both infrastructure and service that are as good as what is provided on the strongest domestic networks. I wrote about how the TGV provides good domestic service, overperforming models trained on foreign networks like the Shinkansen (as does, to a lesser extent, Germany). Most provincial cities are connected to Paris at an average speed higher than 200 km/h – Bordeaux is 2:06 and 538 km from Paris, averaging 256 km/h, and the trains run mostly hourly, with one 1.5-hour midday gap.
German trains never run this fast. The fastest connections between major cities are Berlin-Hamburg, currently 289 km in 1:43, and Cologne-Frankfurt, 177 km that is currently 1:17 but that I have seen done in about 1:05. But the frequency is hourly with additional slightly slower trains in between, and the connections to regional lines are much better than anything offered in France. German high-speed rail infrastructure is far behind what France has and advocates refuse to learn from France’s success, but operations here are better.
And then between countries, nothing is as good as what’s available domestically in either country. The only pair of major European cities connected at high speed across borders is Paris-Brussels, 314 km in 1:22 or 230 km/h, with trains having two 1.5-hour gaps but otherwise running a mix of hourly and twice hourly. But the fares are considerably higher: looking at trains on the 12th of July, I’m seeing mostly 82-109€ fares with a few 70€ tickets and one 57€ itinerary, while the longer Paris-Lyon connection offers many tickets in the 60s and several, run by Trenitalia rather than SNCF, for 35-39€. Where the TGV averages about 0.10€/passenger-km in fare receipts, Thalys averages 0.21€ if 2019 turnover and 2017 p-km can be compared.
Elsewhere, average speeds are nowhere near what Thalys achieves. Paris-Frankfurt, as mentioned in the lede, is 3:49 over about 585 km, for an average of 153 km/h; it’s a respectable speed for an ICE train, but ICEs run hourly whereas Paris-Frankfurt runs every two hours with a four-hour gap. Moreover, Paris-Frankfurt as far as I can tell has the best operations of any cross-border line in Western Europe, in the sense that the headway between trains is (other than the one four-hour gap) much less than the one-way trip time, and the fares look mostly the same as those of domestic TGVs and ICEs over the same length.
It is imperative to build a system of cross-border trains in Europe with both good operations – frequent, reliable, well-connected to other lines, and charging 0.10€/km for the privilege and not twice that. So why is Paris-Frankfurt the best way to do it?
The issue of SNCF
To rail watchers outside France, and even sometimes within it, SNCF is public enemy #1. My above-linked previous post goes over some of the ways SNCF degrades service just to spite any possible competitor (though, of note, Paris-Lyon has Trenitalia service). It gets to the point that Jon and other people interested in EU-wide policy keep talking about operations and about how it’s possible, usually through private competition, to coerce SNCF to be more accommodating.
The problem with this mentality is that SNCF’s service, fundamentally, works where it needs to. Domestic rail ridership is no longer the highest in Europe, DB having overtaken it in the 2010s, but remains about on a par with Germany per capita and higher than other large countries. Passenger-km performance, of more relevance to intercity rail, is very good: on pre-corona numbers, France is about on a par per capita with Austria and better than any other EU state except possibly the Netherlands, which doesn’t report those numbers. From SNCF’s perspective, privatizing eurocrats are trying to mess with its perfectly working system. No wonder they’re resistant. With the EU run by people who mostly think in terms of obscure EU institutions and don’t really know the technical details of trains well, any coercion sufficiently strong to get past SNCF resistance is likely to destroy the system rather than reform it to provide better service.
Now, people in France are aware that French economic performance is not great. France is nowhere near having the cultural cringe toward Northern Europe that Italy and Spain have. But on the ground and in politics, people are aware of Northern Europe’s superior economic performance in the last 15 years. However, so long as the TGV is the premier rail system in Europe, there is no pressure to change anything: France, unlike Spain, is sufficiently proud of itself that it is aware of its strengths, and therefore has little interest in Germanizing on matters where Germany is not clearly well ahead.
Ironically, this means that the best way to get SNCF to behave better is to improve German and perhaps British trains to the point that French people can look up to them rather than denigrate their insufficient speed. A domestic German train network that offers present-day or better levels of connectivity but also French or near-French speeds would get a large boost to ridership, eclipsing ridership on the TGV with its difficulties with expanding beyond its core Paris-province market, and showcasing good service to French travelers that they’d agitate for better. Even on the matter of improving SNCF operations, the best way forward is to improve the quality of physical infrastructure for high-speed rail in Germany and show that Germany can build things too rather than take decades to do anything.
Why Paris-Frankfurt
The Shinkansen began with Tokyo-Osaka, and the TGV with Paris-Lyon. Even less flashy programs began with strong lines – the Zurich S-Bahn began with fast commuter rail service on the Goldcoast, a rich region where suburbanization out of Zurich began early, creating much demand for regional service. The first line showcasing a program cannot be a small pilot; pilot programs are replete in the visionless United States, and there people have learned, correctly, to mistrust anything politicians and agency heads say about bringing the future.
Thalys and Eurostar, in a way, created a strong initial system, for the benefit of rich travelers. Paris, Brussels, and London are connected by fast trains, with the connections to London in practice slower due to the extra time required for security theater, passport checks, and airline-style boarding. The business traveler for whom spending 80€ for a 1.5-hour trip is no big deal loves taking the train between Paris and Brussels; Diego Beghin has mentioned how coworkers take the train to Paris but drive or fly to Germany, since Belgium-Germany trains are too slow to bother with (Brussels-Aachen is 175 km in 1:12). With enough of a volume of high-end travelers, SNCF, which owns the majority of Thalys, sees little reason to change its way for a social mission beyond French borders; thus, the first line showcasing cross-border rail for the entire population must be elsewhere.
This is where Paris-Frankfurt comes in. The connection is 584 km today, 379 km from Paris to Saarbrüucken (322 fast, 57 slow) in 1:50 and another 205 on the German side in about two hours. An entirely high-speed connection would be a few kilometers shorter if it went via Mannheim as trains do today; if it skipped Mannheim to avoid overloading the Frankfurt-Mannheim link, and went via Mainz instead, it would be around 170 km instead. Cutting about 15 minutes from the French side and then cutting the German side to a one-way trip of 45 minutes should be viable, with some tunneling but less than most German lines; this would create a one-way trip time of around 2:20 between the two cities.
The cost should be around 6 billion €. This is for about 160 km on the German side (the other 10 km are legacy approaches to Frankfurt and Saarbrücken) plus 40 km on the French side; German high-speed rail costs are generally considered to be 30 million € per kilometer with average German levels of tunneling.
The population served would be large. German metro area definitions are always iffy, but Frankfurt’s region, Hesse-Darmstadt, has 4 million people. Then, the former region of Rheinhessen-Pfalz, home to both Mainz and Kaiserslautern as well as some smaller cities with decent regional connections to them, has another 2.1 million people, of whom some must be assigned to the Rhine-Neckar Region but the rest can be deemed to be in the Mainz or Kaiserslautern sheds. The state of Saarland has a million people, and the binational functional urban area straddling it and France has 800,000. Moreover, the business and general connections between Paris and Frankfurt are healthy for an international connection; the size of the cities connected potentially makes this an even stronger link than Paris-Brussels if both infrastructure and operations are good.
The usual Shinkansen-trained model I use for predicting high-speed rail ridership has the combination of Paris-Frankfurt, Paris-Rheinhessen-Pfalz, and Paris-Saarbrücken at 12.8 million passengers a year, which should fill two trains per hour; if ridership overperforms as domestic TGVs do, multiply that by 1.5. The current offer is a train every two hours, but Paris-Frankfurt really is weakened by the mediocre trip time. The elasticity of ridership with respect to trip time is about -2, which means going from 3:49 to 2:20 is a factor of 2.7 increase in ridership. This, in turn, should permit running more frequency, which shouldn’t have much impact on end-to-end traffic (it’s already incorporated into the model) but should strongly buoy the intermediate points; today, the Paris-Saarbrücken frequency is a brutal four trains per day, since some trains run express to Frankfurt. In addition to 12.8 million international passengers, the model predicts a good deal of intra-German traffic, depending on how fast the other German connections are – Frankfurt-Saarbrücken is not by itself strong, but it would speed up connections from Saarbrücken to Cologne, the entire Ruhr, Stuttgart, Munich, and eventually Berlin.
A strong first line, like Paris-Lyon or Tokyo-Osaka, is likely to stimulate popular demand for more. It would not be a niche – broad sections of society in France and Germany would be familiar and only lament that the same quality of service, offered domestically and on this line, is not available on links like Paris-Amsterdam, Amsterdam-Cologne, or Brussels-Cologne, and eventually on other cross-border European links, covering the entire Union through accretion of more city pairs.
Why Does TGV Ridership Overperform Models?
I’ve found some TGV ridership data with which I can check the model I use for high-speed rail ridership projection. The model is trained on Japanese data and has flaws in Japan too, but I’ve wanted to see how well it ports to Europe, where I don’t have as complete a dataset of ridership between pairs of metropolitan areas. Thankfully, I have just found a short Omnil report from 2015 about intercity rail ridership at the Parisian terminals, from which we can extract some information. The TGV overperforms the model substantially; this can be explained with fudge factors, but those fudge factors only work if we assume that the aspects of the TGV that seasoned rail advocates hate don’t matter much.
The model
As a reminder, the model posits that the annual ridership in millions between two metropolitan areas with populations 


The model is very accurate for ridership between Tokyo and other cities on Honshu; it overpredicts inter-island ridership, but becomes correct if we replace the Japanese air/rail modal splits with European ones, where taking the train over five hours is more normal than in Japan. I would expect that in isolation, European ridership should overperform it, because fares here are much lower, about 0.10-0.11€/kilometer compared with about $0.23/kilometer on the Shinkansen. French ridership significantly overperforms, beyond what the fares alone can explain, as we will see.
We will need to modify the model as written above for the French case anyway. TGV ridership relies on direct through-service from Paris to every city in France, including many that are not on the network of dedicated high-speed lines (called LGVs); trains serve those by diverting from the LGVs to classical lines, on which they travel more slowly. Therefore, while we can apply the model as above for connections that entirely use LGVs, like Paris-Lyon or Paris-Marseille, we need to consider the slower speeds for connections that use classical lines. For those, we assume that trains average 220-225 km/h; this is the rough average speed of the express Shinkansen trains as well as that of the TGVs to Lyon and Marseille. Thus, the model, at travel time t, is,

The floor of 500 km, or in this case a trip time of 
TGV ridership
I have never been able to find city-to-city or station-to-station ridership figures in France. The Omnil report is no exception: it reports ridership at the Paris stations and breaks down where people are going by region of France in the geography of 2015, before the merger of some regions.
The total ridership at the Paris stations, including TGVs, low-speed intercity trains, and other regions’ regional trains (TERs) but not Paris-area regional trains (Transilien), is 443,000/day; of those, the TGVs comprise 239,000 and the slow trains 204,000. The four Parisian terminals with TGVs – Gare de Lyon, Gare du Nord, Gare Montparnasse, Gare de l’Est – have 92% of the TGV ridership in the region, while the other 8% are at suburban stations on bypasses around the city, like CDG Airport. Ridership is asymmetric: two-thirds of those 443,000 daily riders don’t live in Ile-de-France, which is what we should expect of a commuter-heavy ridership profile. Within Ile-de-France, 63% of passengers originate or are destined to Paris itself and another 21% for the Petite Couronne suburbs, showcasing destination centralization – Paris is only 17% of regional population and about 33% of regional employment, but 63% of those interregional and intercity trips go there and not to the suburbs.
There is also a breakdown of where passengers are connecting, by region of France or country. Picardie is increasingly an exurb of Paris, to the point that as France was debating the merger of regions in the early 2010s, one proposal was to detach its southernmost department, Oise, and attach it to Ile-de-France; 19% of the non-Francilien passengers originate there and 10% of Franciliens go there, for a ratio of nearly 4:1. More relevantly to high-speed rail, Rhône-Alpes is 9% of both non-Francilien and Francilien ridership, for a ratio of about 2:1, and a total of about 40,000/day, or around 13 million/year. PACA is 5% of non-Francilien and 7% of Francilien ridership, for a ratio of about 1.4:1 and a total of 25,000/day or around 8 million/year.
So we need to evaluate our model against an observed ridership of 13 million between Paris and Rhône-Alpes, and 8 million between Paris and PACA. Both sets of numbers involve multiple city pairs, with fairly long tails: France is a country of small metro areas, the median person living in a metro area of 330,000, whereas half of Japan lives in the metro areas of Tokyo (37 million), Osaka (18 million), and Nagoya (9 million).
French metro areas and the model
France recently changed its definition of metro areas. The old one, the aire urbaine, was similar in definition to the American metropolitan statistical area; the new one, the EU-wide functional area, generally spits out slightly larger numbers, though it still seems tighter than the Japanese definition. The functional area of Paris, comprising Ile-de-France, about half of Oise, and surrounding communes, has 13.2 million people. The new definition splits Nice and Cannes apart, which is good, since both have TGV service to France.
| Metro city | Population | Trip time | Prediction |
| Lyon | 2.29 | 1:58 | 4.586 |
| Grenoble | 0.72 | 3:01 | 0.999 |
| Saint-Etienne | 0.5 | 2:58 | 0.771 |
| Geneva (French part)* | 0.44 | 3:13 | 0.485 |
| Annecy | 0.3 | 3:45 | 0.321 |
| Chambéry | 0.26 | 2:52 | 0.49 |
| Valence | 0.26 | 2:12 | 0.805 |
| Bourg-en-Bresse | 0.14 | 1:50 | 0.49 |
| Marseille | 1.88 | 3:07 | 2.02 |
| Nice | 0.62 | 5:48 | 0.24 |
| Toulon | 0.58 | 4:02 | 0.47 |
| Cannes | 0.39 | 5:18 | 0.199 |
| Avignon | 0.34 | 2:40 | 0.701 |
The Rhône-Alpes metro regions combine to a predicted ridership of 8.95 million; actual ridership is higher by about 50%. The PACA metro regions combine to a prediction of 3.63 million; actual ridership is higher by a factor of maybe 2.2.
Note that the prediction is already based on some optimistic assumptions. The trip time is the best that can be sustained multiple times a day; the issue of frequency is ignored, so the effective trip time on connections from Paris to cities like Annecy with a train every three hours gets no malus, even though the Japanese city pairs that the model is trained on get multiple express trains per hour. This is relevant, because as we examine fudge factors below to rescue the model, we need to keep ignoring or at best minimizing the malus due to poor frequency and lack of trip spontaneity in the ticketing system.
Fudge factors explaining the overperformance
We need to explain why Rhône-Alpes overperforms by 50%, and PACA by more than 100%.
Fares
The average JR East Shinkansen fare revenue in 2020-1 was ¥23.8/passenger-km (source, PDF-p. 50), and has risen little in the last 10 years. The average TGV fare revenue in 2019 was 0.10€/passenger-km (source, pp. 16 and 20) and has likewise little changed in nominal terms. These differ by a factor of 1.6. The elasticity of high-speed ridership with respect to price varies widely by study; the Italian study linked above says -0.37, one Spanish study says -0.59, and Börjesson’s lit review says -0.59 for non-business trips and -0.72 for business trips. A value of -0.5 explains a factor of 1.27 overperformance by itself; a value of -0.6 explains a factor of 1.33.
In fact, Germany, charging similar average intercity rail fares to France, seems to overperform the Shinkansen model too. I have little data here, only line-wide Berlin-Hamburg and Berlin-Munich, both of which look like they overperform by about 20%. This can result from a 30% overperformance mitigated by the issue of lower speed: the modeled prediction is based on trip times, but when trips are shorter than about 2:15, the model stops seeing the impact of slowdowns – Berlin-Hamburg is 1:44 and Berlin-Leipzig is 1:13, where at Shinkansen or TGV speeds they’d be 1:17 and 0:45 respectively.
Metro area size
French metro area definitions, even with the new functional areas, are somewhat tighter than Japanese ones. The functional area of Berlin has 5 million people, but reckoned the Japanese way (1.5% of the age 15+ population commuting to the central city), practically all of Brandenburg would count, a population of 5.7 million in total. This is likely more significant in PACA, where the above-listed metro area are 80% of the total population, than in Rhône-Alpes, where they are 90%. It’s possible even Paris is a bit bigger than 13.2 million – but only a bit, since Ile-de-France and Oise together only have 13.1 million. This factor can scrounge some extra ridership, but probably no more than 10%, maybe a bit more in PACA.
Leisure travel
Provence is renowned for its tourism, which generates extra trips out of Paris beyond what we should expect from population alone. This should disproportionately affect Nice and Cannes; for what it’s worth, I’m seeing seven weekday trains from those cities and Toulon to Paris, I believe all skipping Marseille, and 14 trains from Marseille; if we take ridership as proportional to the offer, this does show some Riviera overperformance relative to Marseille, though not by much.
Of course, the majority of Paris-PACA ridership comprises Provençals, not Franciliens. But perhaps the 1.4:1 ratio of Provençals to Franciliens is atypically low, and the 2:1 ratio in Rhône-Alpes is more normal of capital-province relations; I have no Japanese numbers on this, and would overall expect to see similar asymmetries in both countries, given their similar level of economic capital-centricity. If 2:1 is typical, then the extra leisure ridership from the capital to make it 1.4:1 adds a total of 14%, which is far less than PACA’s overperformance relative to Rhône-Alpes.
Metro area coverage
The PACA cities have multiple stops. The population distribution in the Riviera is linear, and multiple cities with extensive leisure (like Saint-Tropez) are served by the TGV. Marseille likwise has a second stop at Aix-en-Provence, close by car to its northern suburbs to the point that I’ve heard it called Marseille-bis. If we split metro Marseille’s population 2:1 between Marseille and Aix, then the 0.8 exponent in the model produces a 14% increase in ridership. 14% and another 14% from leisure combine to 31%, which explains the majority of the PACA overperformance relative to Rhône-Alpes.
Competition with air in small cities
The TGV competes with cars and planes; domestic buses are almost a non-factor, and were entirely a non-factor in 2015 (they’re called Macron buses because it was Macron, as minister of economics in 2014-6, who passed the reform that allowed them). In Rhône-Alpes, competition is entirely with the car: Lyon is just close enough to Paris that air travel can’t compete; in PACA, competition is mostly with the plane, especially beyond Marseille.
The population distribution in both Rhône-Alpes and PACA may favor the train. The issue is that the secondary cities of Rhône-Alpes are around three hours from Paris, at which point the train is strongly favored but planes normally still exist, as in Marseille. However, those cities are scattered all over the region, and so there is no single airport that could serve them, except Lyon – and if the choice is to take the train for three hour or to drive an hour to Lyon-Saint-Exupéry, then the train can just demolish air competition.
In PACA, the same is true for the secondary cities. Nice has a strong airport with many flights to Paris, buoyed by the leisure market, but Toulon and Avignon don’t; on the eve of corona, Toulon-Hyères had 500,000 passengers a year, most not bound for Paris.
I believe this effect on air-rail competition is more significant in Rhône-Alpes than PACA. However, air competition is overall more significant in PACA than in Rhône-Alpes, and thus it likely effects a similar boost to TGV ridership in both regions, or perhaps is more significant in PACA, explaining the remainder of its overperformance.
Some conclusions
I don’t think the TGV’s overperformance of the model invalidates the model. Most of the overperformance in Rhône-Alpes can be explained by fares alone, and I think the rest can be explained by the modal split versus air being more favorable than in Japan given the small size of Annecy, Saint-Etienne, and so on. Most of the overperformance in PACA relative to Rhône-Alpes can then be explained by leisure travel and the good metro area coverage of the TGV thanks to Aix and the linear population distribution of the Riviera. However, these fudge factors have implications for rail planning in France, Europe, and beyond.
Connections to smaller cities
The modeled prediction is that Lyon and Marseille comprise little more than half the ridership to Paris from their respective regions. Moreover, the overperformance of TGV riderhip relative to the hinkanssen model likely comes disproportionately from smaller cities, due to their lack of good air connections. This underscores the importance of good service not just to million-plus metro areas but also to the tail of metro areas of half a million, give or take. Those metro areas are less important in rich Asia or the US, but are important throughout Europe.
This service to smaller cities can take the characteritic of TGV-style direct connections to Paris on classical lines. In Switzerland, the Netherlands, Austria, and increasingly Germany, service to smaller cities is provided through timed connections at carefully-chosen nodes; the Swiss network particularly excels at this. But the French system’s ridership is such that it not obviously inferior, and is unlikely to be inferior to the German system at all. Thus, a country like Poland or Britain can safely choose between the French and German system, or even mix them.
The issue of frequency
The low frequency of TGV services to smaller cities – trains run every two to three hours, often timed to just miss regional trains – should be visible as a serious malus to ridership. But it isn’t. Perhaps it exists and countermands the effect of lack of air competition to cities the size and distance class of Grenoble – but Grenoble is not Nice, and air competition there even under more favorable scenarios to planes would be second-order.
At the same time, there are markets where the TGV is visibly much weaker. The TGV’s modal split between provincial regions is not good. Because trains from Paris to Marseille don’t stop at Lyon, and trains from Paris to Lyon don’t continue onward to Marseille, the Lyon-Marseille city pair cannot piggyback on strong connections to the capital the way same-side pairs of provincial Japanese cities can. The dedicated Marseille-Lyon trains have an inexplicable six-hour gap, with frequent service on both sides of it, and the Toulon-Lyon trains are even worse. The modal split is evidently weaker – in 2009, nearly everyone drove betwen Lyon and Toulon (the 2023 number in the link are speculation for what if an LGV is built to Nice), even over a rail-friendly distance of about 390 km, averaging around 130-150 km/h.
So while the system that centers direct trains to Paris is not suspect, the lack of frequency on shorter connections between secondary cities is. This could be resolved with buying rolling stock that makes boarding and alighting faster, with two door pairs per car rather than just one; TGV connections not including Paris run local, and since the trains are not optimized for many stops, those connections have low average speed, which in turn discourages SNCF from providing more frequent local connections.
Liberalization
The EU is increasingly forcing national railways to allow on-rail competition. This is an idea imported from the UK, where John Major’s privatization of British Rail split up operations and infratructure, the latter eventually renationlized; in Japan, privatization broke up JNR into regional JR companies, each responsible for both infrastructure and operations as in the pre-nationalization era of rail, and in the US, the breakup of Conrail likewise restored the pre-nationalization status quo. SNCF resists the mandate for competition in increaingly spiteful ways: it makes up excuses why RENFE can’t operate on its network, and where it does operate, it won’t even let its crew use break rooms at French stations. Eurocrats, even more progressive ones, treat SNCF as public enemy #1.
And SNCF’s anti-competitive monopoly on domestic rail travel generates high rail ridership. Italy and Spain have both seen sharp increases in ridership from the competition mandate. But Madrid-Barcelona, offering worse frequency and a more broken market than the domstic TGVs (domestic TGVs are split just between lower-price OuiGo and higher-price InOui brands; Spanish high-speed trains have more classes of train on thinner markets), don’t perform nearly so well. Madrid-Barcelona riderhip in 2019 was 4.4 million; the modeled prediction is 4.1 million for this city pair alone, and 6 million including intermediate trip to Zaragoza. Riderhip ha risen since the introduction of competition in 2020, and media coverage has been laudatory, and at times depreating of France for failing to liberalize – but the 50% growth in ridership cited in most articles still leave the line barely overperforming the high-fare Shinkansen and strongly unerperforming the TGV.
European media should be less credulous of promises of private-sector efficieny and recognize that the TGV’s model of public-sector monopoly, with integration between infraatructure and service (even if this means shoving direct trains to Paris on trunk line rather than building a Swiss integrated timed transfer system), produces better outcomes than competition. Germany has the same model too and, relative to how slow its trains are, has good outcomes too; Switzerland, the undisputed leader of European rail ridership, resists privatization entirely. Private competition did not invent high-speed rail, and where it has been introduced it has so far failed to produce outcomes on a par with what the TGV has with entirely public operations.
How Fast is Necessary?
Swiss intercity rail planning follows the maxim “run as fast as necessary, not as fast as possible.” This is usually uttered in opposition to high-speed rail in the sense of the French TGV network. But what does this slogan really mean? And how does it inform good planning?
The issue of timed connections
The origin of the Swiss planning system is in the 1970s and 80s, as it was refining intercity rail, taking what West Germany was doing with its InterCity brand and going further. Two key elements were present from the start: timed connections, and regular clockface timetables (initially every two hours in West Germany). The clockface timetabling facilitated the timed connections, since it’s easier to figure out how to schedule a timed transfer at (say) Frankfurt if the same train moves happen at the same intervals.
With these elements in place, Swiss Federal Railways (SBB) set up a schedule in which trains would be timed to arrive in Zurich all at the same time, currently just before the hour, and depart all at the same time, currently on or just after the hour.
The issue is what to do at stations other than Zurich. Optimizing for timed connections at Zurich means compromising on the question of what to do at other cities. If trains arrive and depart Zurich roughly on the hour, then the terminal at the other end may have ugly arrival and departure times – for example, a 1:40 trip time, with Zurich arrival :56 and departure :04, would mean that the other end has an arrival time of :44 and a departure time of :16. If it’s an hourly train, it means it’s not possible to time connections there – an arriving bus or regional train would have a transfer time of perhaps 20 minutes, which in a country the size of Switzerland is a large share of the overall trip.
And then there is the looming issue of intercity connections. Zurich is located fairly centrally in Switzerland, but there are some key connections that don’t go anywhere near it, led by Bern-Basel via Olten. Bern’s central location makes it a great node for timed connections as well. However, the Zurich-Bern trips took 1:09, making it impossible to have timed everywhere-to-everywhere connections in both cities.
Speeding up trains to make connections
In the 1980s, the Zurich-Bern trips took 1:09, so connections could only be timed in Zurich, not Bern. At the time, there were plans for a French-style high-speed rail network connecting Zurich, Bern, and Geneva, but those plans were canceled due to high costs relative to Switzerland’s size.
Instead of running as fast as possible, enough to connect Zurich and Geneva in perhaps 1:30, trains would run as fast as necessary, just enough to make connections. The centerpiece of this plan, dubbed Rail 2000, was to speed up Olten-Bern by just enough to shorten Zurich-Bern and Basel-Bern to 0:56 and 0:55 respectively. This way, trains could arrive in all three cities just before the hour and depart just after, facilitating more timed connections.
This system was a resounding success. Swiss rail ridership has been sharply rising in the last 20 years, from an already fairly high level; by all metrics I am aware of, such as modal split, ridership per capita, and passenger-km per capita, it is Europe’s strongest rail network. More speedups are planned, all aiming to add more points where trains can be timed to connect, called knots, till the network looks like this:
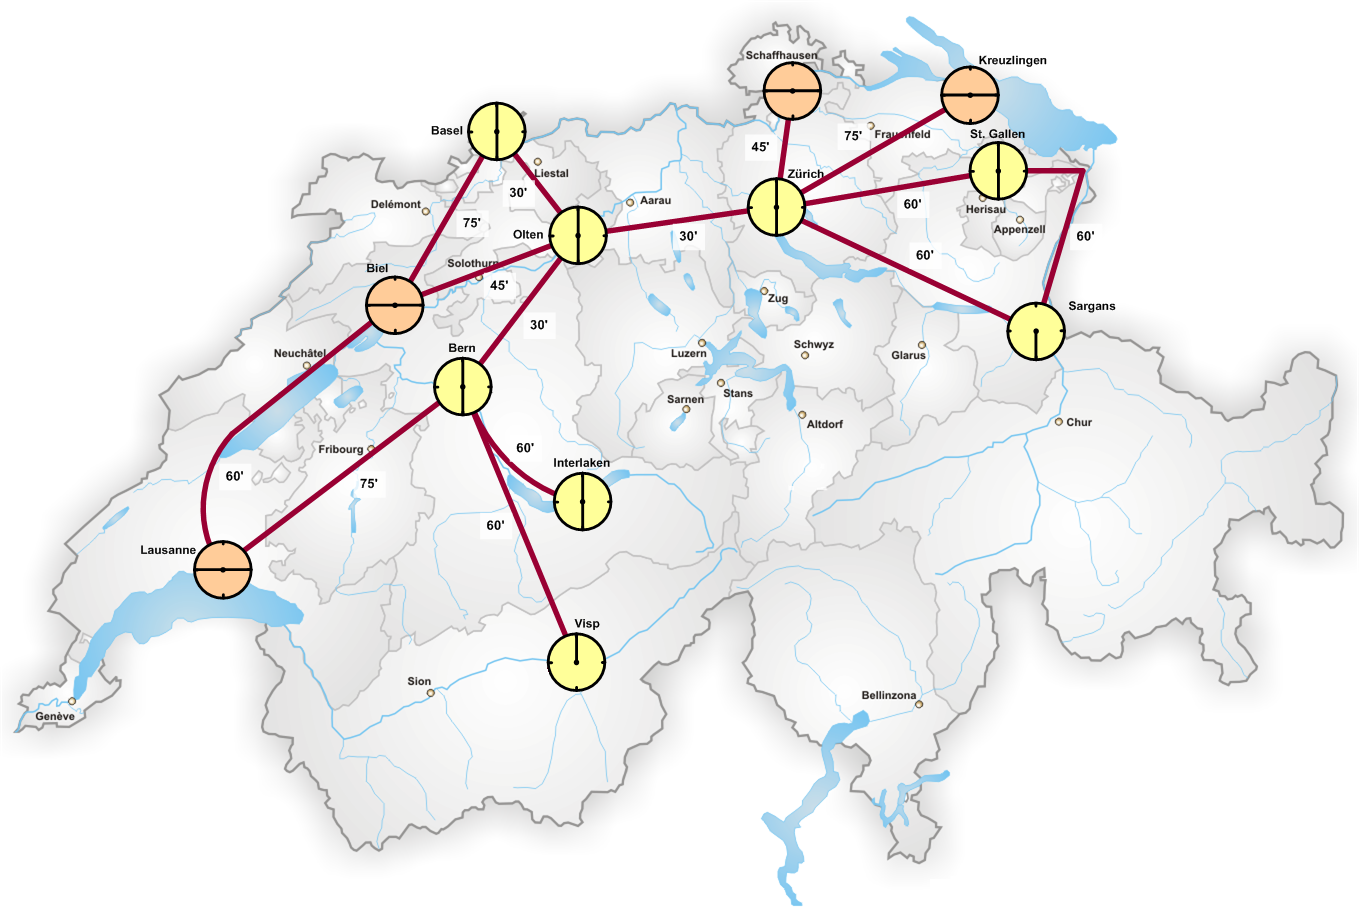
The shape of Switzerland
The notion of running trains as fast as necessary is in one sense a global principle. But its surface manifestation of a system designed as an alternative to high-speed rail is a product of Swiss geography; in Japan, the current speed of the Shinkansen is also as fast as necessary. Switzerland’s current knot diagram has to be understood in the context of the following geographical features:
- Switzerland is small enough that the strongest trunk corridors, like Zurich-Bern, can support just a train every half hour.
- Switzerland is also physically small enough that the Zurich-Bern-Basel triangle has legs of about 110 km, which an upgraded rail system can connect in an hour minus transfer time, and which it is very hard to speed up to 30 minutes minus transfer time.
- Switzerland is two-dimensional: there is no central trunk through which all service must pass – the diagram above depicts Zurich-Olten as a key link, but Luzern, though not yet a knot, connects separately to both Zurich and Bern.
- Swiss train stations have a surplus of tracks, while still functioning as central stations, without the separation into different stations for different directions that Paris and London have.
Switzerland is not unique in having these features. The Netherlands is the same: it’s a small two-dimensional country with demand for many connections to be timed. The Netherlands built a 300 km/h high-speed rail line between Amsterdam, Rotterdam, and the border with Belgium toward Antwerp, Brussels, and Paris, but this line is not important to its intercity rail planning, which instead lives on Swiss-style knots.
However, not even all small countries are like Switzerland and the Netherlands. Israel is one- rather than two-dimensional: all trains pass through Tel Aviv and the Ayalon Railway, and there is no real need for timed connections, as the most important city pair not involving Tel Aviv, Haifa-Jerusalem, passes through Tel Aviv, with through-service to begin as soon as electrification is completed. Taiwan is so linear that a single high-speed rail line connects all of its cities, with higher ridership per capita than in any other country I have data for except maybe Japan; even before high-speed rail, the shape of its mainline network was a single line on the west coast connecting the cities and another on the east coast connecting smaller settlements.
And then in large countries, running as fast as necessary requires choosing a speed. Germany is two-dimensional like Switzerland, but has a string of city pairs 90-100 km apart – Hanover-Bielefeld-Dortmund, or Mannheim-Stuttgart, or the Fulda-Frankfurt-Würzburg triangle, or Würzburg-Nuremberg – for which running a fast as necessary entails a choice between connections in 60, 45, or 30 minutes. Longer-distance city pairs, like Nuremberg-Munich, Berlin-Leipzig, and the Hamburg-Hanover-Bremen triangle, are even less constrained.
Capacity
The Swiss network is based on the idea that near major stations like Zurich, trains should arrive and depart on pulses every 30 minutes. This way, the Olten-Bern line runs eight intercity trains per hour, but they are not equally spaced: they are timetabled in two platoons over a period of seven minutes each, with the off time used for regional trains not participating in the knot system.
Even in the Netherlands, this isn’t quite tenable. Amsterdam-Eindhoven trains come at regular 10-minute interval, each third train requiring a connection at Utrecht and the other two trains in three running directly. In Israel, Tel Aviv-Haifa trains run at 30-minute intervals midday, but for two four-hour peak periods each day this is boosted to four trains per hour – and this is even before electrification has been completed.
The situation in Germany deserves especial mention. Germany is investing in it intercity rail network in a way that sometimes tries to be Switzerland except bigger (such as the Deutschlandtakt and other measures supported by technical advocates) and sometimes tries to build high-speed rail lines and through-stations like Stuttgart 21. The technical advocates dislike Stuttgart 21 and argue that it’s un-Swiss to timetable intercity trains throughout the hour rather than in two pulses with inactivity between them. But Germany has large enough cities that it can’t afford to keep intercity lines out for so much time. Already, with mediocre speeds, the Deutschlandtakt plan for 2030 prescribes 4.5 trains an hour between Frankfurt and Mannheim and between Frankfurt and Cologne. As more high-speed lines come online, demand will grow; Deutsche Bahn projects to double ridership between 2019 and the 2030s, which will force the busiest links to operate a train every five to 10 minutes.
Is Swiss planning useful outside Switzerland and the Netherlands?
Unambiguously, yes. However, it would look different.
The best place to see how different it should be is, naturally, the Northeastern United States, my area of research. None of the features that made Rail 2000 work is present there: the region is large and has huge cities, is one- rather than two-dimensional, and has capacity-constrained stations forcing round-the-hour use of every approach track.
What this means is that there is little optimization from running slower than as fast as possible on the Northeast Corridor trunk line. However, running a fast as necessary remains a solid planning maxim on all the branches that connect to it, with their own timed connections to one another and to local buses in secondary cities like Worcester and Springfield. Most trains between Boston and Washington should run as express as practical based on station track speeds, and the local trains may plausibly only run every half hour, making them ideal for a system of timed half-hourly connections.
Can Intercity Trains into Boston Enter from Springfield?
From time to time, I see plans for intercity rail service into Boston going via Springfield. These include in-state rail plans to run trains between the two cities, but also grander plans to have train go between Boston and New Haven via Springfield, branded as the Inland Route, as an alternative to the present-day Northeast Corridor. In-state service is fine, and timed connections to New Haven are also fine for the benefit of interregional travel like Worcester-Hartford, but as an intercity connection, the Inland Route is a terrible choice, and no accommodation should be made for it in any plans. This post goes over why.
What is the Inland Route?
Via Wikipedia, here’s a map of the Northeast Corridor and connecting passenger rail lines:
Red denotes Amtrak ownership, and thus some non-Northeast Corridor sections owned by Amtrak are included, whereas the New Rochelle-New Haven section, while part of the corridor, is not in red because it is owned by state commuter rail authorities. Blue denotes commuter rail lines that use the corridor.
The Inland Route is the rail route in red and black from New Haven to Boston via Springfield. Historically, it was the first all-rail route between New York and Boston: the current route, called the Shore Line, was difficult to build with the technology of the 1840s because it required many river crossings, and only in 1889 was the last river bridged, the Thames just east of New London. However, as soon as the all-rail Shore Line route opened, mainline traffic shifted to it. Further investment in the Shore Line relegated the Inland Route to a secondary role, and today, the only passenger rail at all between Boston and Springfield comprises a daily night train to Chicago, the Lake Shore Limited. More recently, there has been investment in New Haven-Springfield trains, dubbed the Hartford Line, which runs every 1-2 hours with a few additional peak trips.
What rail service should run to Springfield?
Springfield is a secondary urban center, acting as the most significant city in the Pioneer Valley region, which has 700,000 people. It’s close to Hartford, with a metro population of 1.3 million, enough that the metro areas are in the process of merging; this is enough population that some rail service to both New York and Boston is merited.
In both cases, it’s important to follow best practices, which the current Hartford Line does not. I enumerated them for urban commuter rail yesterday, and in the case of intercity or interregional rail, the points about electrification and frequency remain apt. The frequency section on commuter rail talks about suburbs within 30 km of the city, and Springfield is much farther away, so the minimum viable frequency is lower than for suburban rail – hourly service is fine, and half-hourly service is at the limit beyond which further increases in frequency no longer generate much convenience benefit for passengers.
It’s also crucial to timetable the trains right. Not only should they be running on a clockface hourly (ideally half-hourly) schedule, but also everything should be timed to connect. This includes all of the following services:
- Intercity trains to Hartford, New Haven, and New York
- Intercity trains to Boston
- Regional trains upriver to smaller Pioneer Valley cities like Northampton and Greenfield (those must be at least half-hourly as they cover a shorter distance)
- Springfield buses serving Union Station, which acts as a combined bus-rail hub (PVTA service is infrequent, so the transfers can and should be timed)
The timed connections override all other considerations: if the demand to Boston and New York is asymmetric, and it almost certainly is, then the trains to New York should be longer than those to Boston. Through-running here is useful but not essential – there are at least three directions with viable service (New York, Boston, Greenfield) so some people have to transfer anyway, and the frequency is such that transfers have to be timed anyway.
What are the Inland Route plans?
There are perennial plans to add a few intercity trains on the New Haven-Springfield-Boston route. Some such trains ran in my lifetime – Amtrak only canceled the last ones in the 2000s, as improvements in the Shore Line for the Acela, including electrification of the New Haven-Boston section, made the Inland Route too slow to be viable.
Nonetheless, plans for restoration remain. These to some extent extend the plans for in-state Boston-Springfield rail, locally called East-West Rail: if trains run from Boston to Springfield and from Springfield to New Haven, then they might as well through-run. But some plans go further and posit that this should be a competitive end-to-end service, charging lower fares than the faster Northeast Corridor. Those plans, sitting on a shelf somewhere, are enough that Massachusetts is taking them into account when designing South Station.
Of note, no modernization is included in these plans. The trains are to be towed by diesel locomotives, and run on the existing line. Both the Inland Route and East-West plans assume frequency is measured in trains per day, designed by people who look backward to a mythologized golden age of American rail and not forward to foreign timetabling practices that have only been figured out in the last 50 years.
Is the Inland Route viable as an intercity route into Boston?
No. This is not even a slag on the existing plans; I’m happy assuming best practices in other cases, hence my talk of timed half-hourly connections between trains and buses above. The point is that even with best practices, there is no way to competitively run a New Haven-Springfield-Boston route.
The graphic above is suggestive of the first problem: the route is curvy. The Shore Line is very curvy as well, but less so; it has a bad reputation because its curves slow trains that in theory can run at 240 km/h down to about 150-180 km/h, but the Boston-Springfield Line has tighter curves over a longer stretch, they’re just less relevant now because the trains on the line don’t run fast anyway. In contrast, the existing Northeast Corridor route is fast in Massachusetts and Rhode Island.
The Inland Route is also curvy on the Boston-Worcester stretch, where consideration for slow trains is a must. The main way to squeeze extra speed out of a curvy line is to cant it, but this is less viable if there is a mix of fast and slow trains, since slow trains would be overcanted. This, in fact, is the reason Amtrak trains outside the Northeast are slower than they were in the middle of the 20th century – long-distance passenger trains have less priority for infrastructure design than slow freight trains, and so cant is limited, especially when there are hills. Normally, it’s not a problem if the slower trains are commuter trains, which run fast enough that they can just take the curve, but some curves are adjacent to passenger train stations, where passengers would definitely notice the train sitting still on canted track, leaning to the inside of the curve.
Then, there is the issue of how one gets into Boston. The Providence Line is straight and fast and can be upgraded to provide extra capacity so that fast intercity trains can overtake slow ones if need be. The Worcester Line has a two-track narrows in Newton, hemmed by I-90 with no possibility of expansion, with three stations on this stretch and a good location for a fourth one at Newton Corner. Overtakes are possible elsewhere (one is being designed just to the west, in Wellesley – see my sample timetable here), but they still constrain capacity. It’s comparably difficult from the point of view of infrastructure design to run a 360 km/h intercity train every 15 minutes via Providence and to run a 160 km/h intercity train every 30 minutes via Springfield and Worcester. Both options require small overtake facilities; higher frequency requires much more in both cases.
The Worcester Line is difficult enough that Boston-Springfield trains should be viewed as Boston-Worcester trains that go farther west. If there’s room in the timetable to include more express trains then these can be the trains to Springfield, but if there’s any difficulty, or if the plan doesn’t have more than a train every half hour to Worcester, then trains to Springfield should be making the same stops as Boston-Worcester trains.
Incentives for passengers
The worst argument I’ve seen for Inland Route service is that it could offer a lower-priced alternative to the Northeast Corridor. This, frankly, is nuts.
The operating costs of slower trains are higher than those of faster trains; this is especially true if, as in current plans, the slow trains are not even electrified. Crew, train maintenance, and train acquisition costs all scale with trip time rather than trip distance. Energy costs are dominated by acceleration and deceleration cycles rather than by cruise speed at all speeds up to about 300 km/h. High-speed trains sometimes still manage lower energy consumption per seat-km than slow trains, since slow trains have many acceleration cycles as track speeds change between segments whereas high-speed lines are built for consistent cruise speed.
The only reason to charge less for the trains that are more expensive to operate is to break the market into slow trains for poor people and fast trains for rich people. But this doesn’t generate any value for the customer – it just grabs profits through price discrimination that are then wasted on the higher operating costs of the inferior service. It’s the intercity equivalent of charging more for trains than for buses within a city, which practice is both common in the United States and a big negative to public transit ridership.
If, in contrast, the goal is to provide passengers with good service, then intercity trains to Boston must go via Providence, not Springfield. It’s wise to keep investing in the Shore Line (including bypasses where necessary) to keep providing faster and more convenient service. Creating a class system doesn’t make for good transit at any scale.
