Category: Transportation
Quick Note: The Importance of Penn Station Access West to Through-Running
A video by the Joint Transit Association talks at length about through-running in New York – which lines are easier and which are harder, what some of the tradeoffs are, what sequencing works best with ongoing infrastructure plans starting with the Gateway tunnel. It’s a good video and I recommend watching – and not just because it gets a lot of its ideas from ETA reports but also because of its own analysis and own points (about, for example, Mott Haven Junction) – but it has one miss that I’d like to highlight: it neglects Penn Station Access West, the proposal to connect the Hudson Line to Penn Station via the Empire Connection.
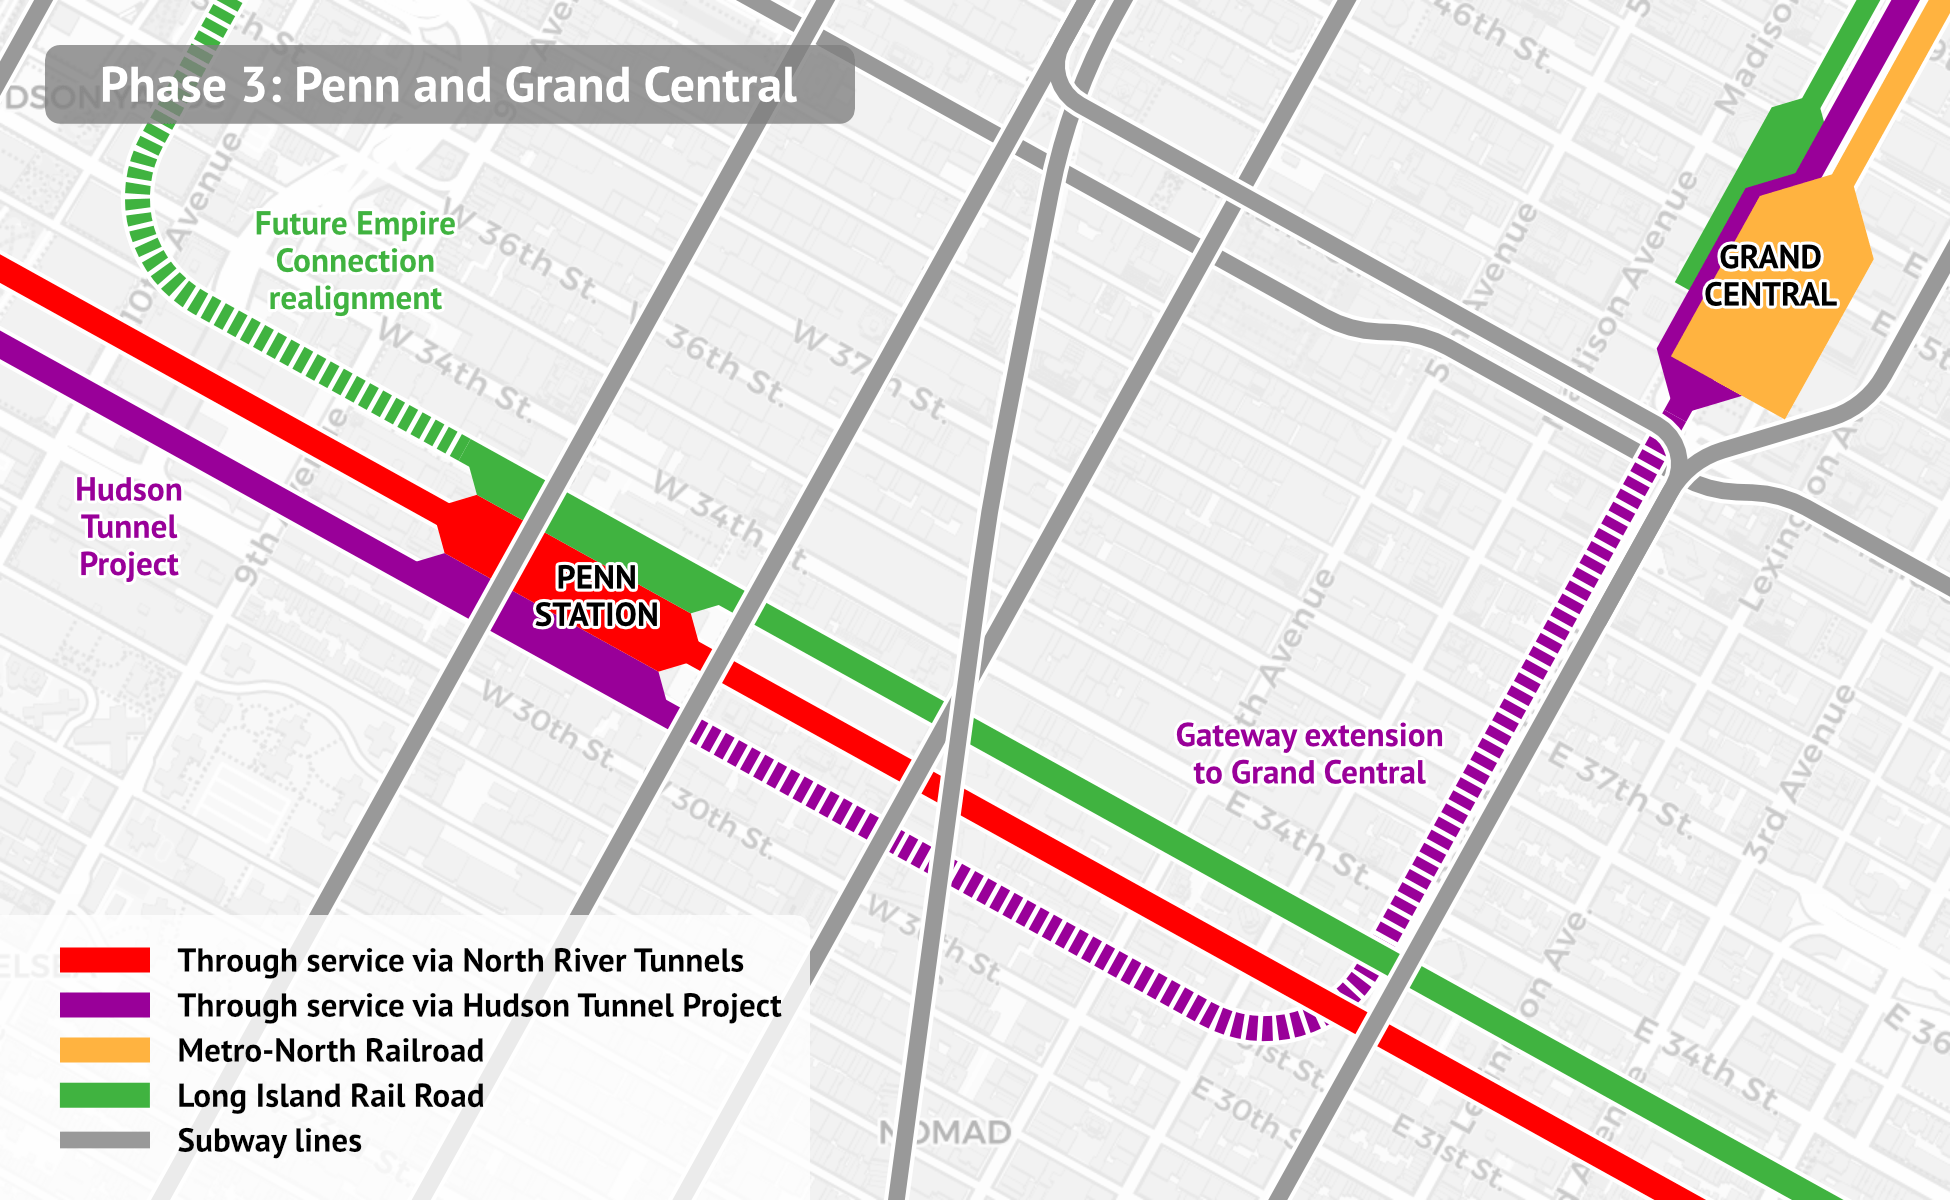
The issue is that without the realignment, too many trains would be going into Grand Central – all preexisting Metro-North service minus trains diverted to Penn Station Access. We expect all this through-running infrastructure to add to peak demand substantially. Today it fills about 50 peak trains per hour, which a four-track trunk line would struggle with (Metro-North runs trains three-and-one at the peak). Even with diversion of 6-10 trains to Penn Station Access, the extra demand would saturate the line. Penn Station Access West is important in reducing this capacity crunch.
The realignment is both important and cheap. The Empire Connection exists and the tunnel has room for two tracks; it needs a short realignment to reach the right part of Penn Station – the high-numbered northern tracks as in the image, where today there is a single-track link from the Connection proper to the low-numbered tracks – but that realignment is much cheaper than a full through-tunnel such as between Penn Station and Grand Central or the various lines to Lower Manhattan mooted for longer-term plans.
The total capacity produced should be every train that doesn’t have to go to Grand Central. It’s hard to exactly say what the split should be – there should be a minimum of a train every 10 minutes to each destination, if only to serve the inner stations that are (or would be infill) on the lower Hudson Line or the Empire Connection before the two routes meet at Spuyten Duyvil. Beyond that it’s a matter of measuring demand and seeing what the limit of timed connections are; ideally there should be 12 peak trains per hour on Penn Station Access West and only 6 on the preexisting route, up from 14 total on the Hudson Line today due to service improvements brought by through-running and related upgrades. This is necessary to create the capacity to run more service on the other lines – today the Harlem Line peaks at 16 trains per hour and the New Haven Line at 20, but these upgrades would create a lot more demand and my assumption in sketching through-running tunnels is that the Harlem Line would need 24 and the New Haven Line would need 18 to Grand Central and 6 on Penn Station Access.
It’s not the Baumol Effect
The Baumol effect is an observation that wages in an economy rise based on its average productivity, and therefore the wages also rise in sectors with low or no productivity growth, increasing their real costs. The classical example is that it takes the same number of people to play an opera today as in the 19th century, but wages have to be competitive with the 21st-century economy, and therefore opera tickets cost in real terms more than they did in the 19th century. People from time to time invoke this effect to explain rising infrastructure construction costs in the United States, relating it to a broader cost disease affecting health care and education. But it’s not really a correct explanation for what’s going on at global scale. High American construction costs are not downstream of high incomes, but rather of poor governance leading to low labor efficiency, poor procurement practices, nonstandard systems, and overbuilding.
At global scale, there is no significant correlation between GDP per capita and tunneling construction costs. There’s a significant but weak correlation between GDP per capita and metro construction costs, but it comes from the fact that developing countries like India build mostly elevated systems. Adjusted for the ratio between subway and elevated cost, which is about 2 in both India and China, the correlation is reduced to insignificance.
There is extensive temporal correlation between GDP per capita and costs, in the sense that the US, UK, and France were all capable of tunneling for around $40 million/km in today’s prices in the early 1900s, and aren’t capable of doing so today. But then countries with the GDP per capita of early-1900s America, like India, build subways for maybe $400 million/km. The techniques used in the early 1900s were labor-intensive, with workers digging up streets by hand. These techniques are not used today in low-income countries, which instead use capital-intensive techniques learned from Western countries, Japan, or increasingly China, and which rarely have the mass industrial working class that characterized rich cities around 1900. That is not Baumol; that is a transition to capital-intensive techniques that are then applied where it’s inappropriate.
Nor has there been an explosion of costs since the 1970s globally. The US has gone from high to very high costs, and the UK from medium to very high ones. But German construction costs are barely higher now than then. Italian ones have if anything fallen a bit, due to anti-corruption laws in the 1990s. If anything, Germany is seeing an increase in construction costs now, with rather high NBS construction costs even without tunneling, at a time in which economic growth is weak. The weak economic growth here – Germany’s GDP per capita has been essentially constant since 2019 – combined with fast economic growth in the United States means that German elites are starting to imitate American procurement practices, with Deutsche Bahn starting to use previously unheard of design-build contracts and public-private partnerships, with the attendant costs.
In the UK, similarly, high costs interact with weak growth, in that weak growth leads to cancellation of infrastructure projects like High Speed 2 north of Birmingham, which cancellation then leads to orphaned designs. There’s been growing discourse in the UK about the problem of feast-or-famine projects, with rail electrification proceeding in waves rather than at a constant rate as at Continental European comparanda like Italy. Italy is hardly posting Polish economic growth rates, but in the UK the origin of the feast-or-famine problem is in the cycle of top-down infrastructure plans and cancellations.
In truth, while the US has had higher economic growth than nearly all of Western Europe since 2019, GDP per hour remains barely above the weighted average of the Germanic-majority Continental countries and France. This is not why the US is expensive; poor project delivery is.
New York Isn’t Special
A week ago, we published a short note on driver-only metro trains, known in New York as one-person train operation or OPTO. New York is nearly unique globally in running metro trains with both a driver and a conductor, and from time to time reformers have suggested switching to OPTO, so far only succeeding in edge cases such as a few short off-peak trains. A bill passed the state legislature banning OPTO nearly unanimously, but the governor has so far neither signed nor vetoed it. The New York Times covered our report rather favorably, and the usual suspects, in this case union leadership, are pissed. Transportation Workers Union head John Samuelsen made the usual argument, but highlighted how special New York is.
“Academics think working people are stupid,” [Samuelsen] said. “They can make data lie for them. They conducted a study of subway systems worldwide. But there’s no subway system in the world like the NYC subway system.”
Our report was short and didn’t go into all the ways New York isn’t special, so let me elaborate here:
- On pre-corona numbers, New York’s urban rail network ranked 12th in the world in ridership, and that’s with a lot of London commuter rail ridership excluded, including which would likely put London ahead and New York 13th.
- New York was among the first cities in the world to open its subway – but London, Budapest, Chicago (dating from the electrification and opening of the Loop in 1897), Boston, Paris, and Berlin all opened earlier.
- New York has some tight curves on its tracks, but the minimum curve radius on Paris Métro Line 1, 40 meters, is comparable to the New York City Subway’s.
- The trains on the New York City Subway are atypically long for a metro system, at 151 meters on most of the A division and 183 on most of the B division, but trains on some metro systems are even longer (Tokyo has some 200 m trains, Shanghai 180 m trains) and so are trains on commuter rail systems like the RER (204 m on the B, 220 m on the A), Munich S-Bahn (201 m), and Elizabeth line (205 m, extendable to 240).
- New York has crowded trains at rush hour, with pre-Second Avenue Subway trains peaking at 4 standees per square meter, but London peaks at 5/m^2 and trains in Tokyo and the bigger Chinese cities at more than that. Overall ridership, irrespective of crowding, peaked around 30,000 passengers per direction per hour on the 4 and 5 trains in New York, compared with 55,000 on the RER A.
New York is not special, not in 2025, when it’s one of many megacities with large subway systems. It’s just solipsistic, run by managers and labor leaders who are used to denigrating cities that are superior to New York in every way they run their metro systems as mere villages unworthy of their attention. Both groups are overpaid: management is hired from pipelines that expect master-of-the-universe pay and think Sweden is a lower-wage society, and labor faces such hurdles with the seniority system that new hires get bad shifts and to get enough workers New York City Transit has had to pay $85,000 at start, compared with, in PPP terms, around $63,000 in Munich after recent negotiations. The incentive in New York should be to automate aggressively, and look for ways to increase worker churn and not to turn people who earn 2050s wages for 1950s productivity be a veto point to anything.
High Speed Rail-Airport Links
As somewhat of a followup to my last post on how successful high-speed rail isn’t really made for tourists, I’d like to talk about the issue of air-rail links. Those are beloved by both foreign tourists and domestic residents using them to travel abroad, and American high-speed rail planning has on occasion tried focusing on them. This has always been awkward for both environmental and ridership goals. Such links are not inherently bad, but they are often overrated in planning, especially at the level of public advocacy and shadow planning agencies, which reproduce the biases of frequent fliers.
Skipping the airports in rich Asia
The Shinkansen does not serve Narita. There were plans for it to do so but they have not been implemented. Such service would require a dedicated line, since the Shinkansen is on a different gauge from the classical JR network and the standard-gauge link between the city and the airport is owned by private railway Keisei, and Narita itself is not important enough to drive such a line, not at the urban tunneling construction costs of Japan.
But the same lack of service to airports is seen in the two most Shinkansen-like systems outside Japan, Korea and especially Taiwan. The airport is not in Taipei but in Taoyuan, and is connected to the city by an express commuter train, the Taoyuan Airport MRT, but the Taiwan High-Speed Rail system does not serve it, instead having a different Taoyuan station on the Airport MRT. Even in Korea, which uses standard gauge and runs KTX trains through on classical lines in the French style, there is no KTX service to Incheon or to Gimpo.
The issue in all three countries is that the role of the capital’s international airport is to connect passengers between the capital region and the rest of the world. Tourists visiting the capital don’t need a train to secondary cities; in South Korea, last year, 66% of tourism by spending was in Seoul, and in Taiwan, 53% of tourism by occupied hotel nights was in Taipei, New Taipei, and Taoyuan (PDF-pp. 20-21 of the 2024 annual report). Domestic residents using the airport to travel abroad are a more serious use case, but far more residents of Busan or Kaohsiung are going to their respective country’s capital than abroad, and so the airport link is not a high priority for planning.
Serving the airports in Europe if they’re on the way
Three of the four busiest airports in the EU – CDG, Schiphol, and Frankfurt (the fourth is Barajas) – have high-speed rail links. However, in all cases, it’s because they’re on the way somewhere. CDG and Frankfurt are both on valuable bypass routes around the primary city with its terminal-only train stations, so they might as well be served. Schiphol is between Rotterdam and Amsterdam, but serving it involved high-cost tunneling, on a high-speed line, HSL Zuid, that has in retrospect been more a case of imitating the TGV than responding to Dutch intercity rail needs.
In all cases, the airport link is decidedly secondary to the network, and is not a major planning goal. There are intercity trains routed into Berlin-Brandenburg, but these are intended for long-distance regional use: the extensive rail tunneling to the new airport is for various regional express trains, with a 15-minute Takt to Berlin Hauptbahnhof and four hourly Takt trains to regional destinations starting next month and only one intercity train on a two-hour Takt between Berlin and Dresden. Munich has no ICE connection, and a proposal for one never got beyond the conceptual stage because the airport-city center connection was deemed a higher priority. It’s notable that even high-cost, high-prestige air-rail links here prioritize connections to city center, and not to the national network.
The awkward environmental politics of air-rail links
High-speed rail is justified on both economic and environmental grounds. But sometimes these different justifications end up conflicting. It’s noteworthy that in the United States, a common argument for high-speed rail in California and the Northeast has been that the airports are too clogged with short-haul regional flights and if high-speed trains replaced them then the gates and runway slots would be usable by long-haul flights. This argument is made at the same time as arguments about reducing greenhouse gas emissions – but long-haul flights contribute far more emissions than short-haul ones per unit of airport capacity consumed, airport capacity not particularly caring if you’re flying 700 km or 7,000.
It’s possible to ignore the environmental effects and just focus on the economic benefits; in Europe, the broad environmental movement is neutral or even hostile to high-speed rail, viewing it as inferior to running more night trains and regional trains. But then in Europe the economic-only planning for high-speed rail does not prioritize the air links, because they are fundamentally secondary. In a country like France, the demand for high-fare rail links to CDG is to the center of Paris, not Marseille.
High-Speed Rail is not for Tourists
Foreigners to a country often get a warped idea of what its infrastructure is like. Most infrastructure is used for day-to-day domestic travel, for commuting to work or school, for visits to family and friends, for social gatherings, for business travel within the national internal market. Foreign travelers make use of this infrastructure when they visit, but they use it differently, and can make erroneous assumptions about how locals use it and what it means for transportation in general. This has two policy implications: one concerns American misconceptions about European rail travel; the other concerns pan-European misconceptions about European rail travel, which is almost entirely domestic, based on domestic networks, and planned and debated in the local language and not in English.
The Europe of the tourists
To estimate how foreign tourists may view Europe, we need some information on tourist travel within the bloc. The best I have is lists of the most visited cities in the world, and unfortunately, the only lists I have that go beyond the global top 10 are from before corona. But 2019 should not be too different to first order from the present. Here are international arrivals, from the global top 50:
| City | Millions of arrivals (2019) |
| London | 19.55 |
| Paris | 19.08 |
| Istanbul | 14.71 |
| Rome | 10.31 |
| Prague | 9.15 |
| Amsterdam | 8.83 |
| Barcelona | 7.01 |
| Vienna | 6.63 |
| Milan | 6.6 |
| Athens | 6.3 |
| Berlin | 6.19 |
| Moscow | 5.96 |
| Venice | 5.59 |
| Madrid | 5.59 |
| Dublin | 5.46 |
Notably, there’s almost no intersection with any of the busiest intercity rail links in Europe. The top two are the trunk from Paris on the LGV Sud-Est to the bifurcation between Dijon and Lyon, and the Frankfurt-Mannheim trunk line. Paris is a huge international tourist draw, but nothing on the LGV Sud-Est and its extensions is; the top department outside Ile-de-France in tourism overnight stays is Alpes-Maritimes, a 5.5-6 hour trip from Paris by TGV. Germany has little tourism for its size, especially not in Mannheim – foreigners come to Berlin or Munich, or maybe Frankfurt for business trips. Only two city pairs in Europe with solid high-speed rail links appear in the table above, Milan-Rome and Madrid-Barcelona.
The upshot is that the American tourist who comes here and marvels at the fact that even in Germany the trains are faster and more reliable than in the United States isn’t really experiencing the system as most users do. If they take the TGV, it’s much likelier that they’re taking Eurostar and dealing with its premium prices and probably also with its security theater if they’re going to London rather than Brussels or Amsterdam. They have nothing to do in Lyon or Bordeaux or Strasbourg or Lille, so it’s unlikely they see the workhorse domestic lines. It’s even more unlikely they take the train to the smaller cities with direct TGVs, such as Saint-Etienne, Chambéry, and others that beef up the ridership of the LGV Sud-Est without serving Lyon itself; there were considerable errors made by American analysts in the Obama era about high-speed rail coming from looking only at the million-plus metro areas and not at these secondary ones.
By the same token, the American tourist in question is much likelier to be riding Spanish trains with their brand and price differentiation by speed than to be riding the workhorse regional and intercity trains anywhere in Northern Europe. ICEs charitably average 160 km/h on a handful of lines when they’re on time, which isn’t often, and on key corridors like Berlin-Cologne or Berlin-Frankfurt are closer to 120 km/h. The reason Germany is close to even with France on ridership per capita and well ahead of Italy and Spain is that these trains have decent connections with one another and with slower regional trains, so that people can connect to those secondary cities better. Trips from Berlin to Augsburg with a connection in Munich are not hard to plan, or trips to city cores in the Rhine-Ruhr and other polycentric regions. These are largely invisible to the foreign tourist, who doesn’t have anything to do in a city like Münster.
This also applies to the European tourist, not just the American or Asian or Middle Eastern one. A German who visits France is interested in trains from Germany to Paris, and those are not that good, but will probably not be taking TGVs between Paris and Rennes or Lille. From that, they’ll conclude the TGVs aren’t that useful in general.
The Europe of the typical intercity rail traveler
In contrast with the tourists’ picture of the countries of Europe, the typical intercity rail traveler uses the system in a way that the table above doesn’t really capture. All of the following characteristics are likely:
- They are traveling domestically since cross-border rail within Europe is practically never good.
- They are traveling based on domestic business, leisure, and social networks: if French, they can be going between Paris and anywhere else in France, and very occasionally even between two places outside Ile-de-France; if German, they are likely going between two major cities or maybe between a major and a midsize city.
- They are a regular traveler, which implies good knowledge of the system and its quirks, experience with large complex stations allowing getting between the train and the street within minutes, and probably also some kind of discounted fare card such as the BahnCard 25 in Germany or the half-fare card of Switzerland.
- They have the disposable income to drive, and choose to take the train because of a combination of speed, fares, and convenience rather than because they truly can’t afford a car or because they are ideologically opposed to travel modes with high greenhouse gas emissions.
The upshot is that finicky systems like the TGV and ICE are useful to their current travelers, even if foreigners and people who move in pan-European networks find them unreliable for various reasons. Any kind of EU-wide policy on rail has to acknowledge that SNCF and DB may have problems but are the main providers of solid intercity rail within Europe and are not the enemy, they just focus on city pairs that reflect their domestic travel needs.
And any attempt to learn from Europe and adapt our intercity rail successes has to look beyond what a tourist visiting for a few days would notice. It’s not just the wow effect of speed; Eurostar has that too and its ridership is an embarrassment, with fewer London-Paris trips per day than Paris-Lyon even though metro London is around six times the size of metro Lyon. It’s other details of the network, including how far it reaches into the longer tail of secondary markets.
The secondary markets require especial concern, first because they form a large fraction (likely a majority) of European high-speed rail travel, second because they’re invisible to tourists, and third because they require careful optimization.
One issue is that secondary markets are great for cars, decent for trains, and awful for planes. The TGV owns them at distances where cars take too many hours longer than the train, which helps extend the trains well past the three- to four-hour limit that rail executives quote as the upper bound for competitive train trip time. At shorter range, high-speed rail competes with cars more than with planes, and so the secondary markets lose value.
Another issue is that it’s easy to overdo secondary markets at the expense of compromising speed on the primary ones. This is usually not because of tourists, who almost never ride them, but rather because of domestic travelers who are atypically familiar with and dependent on the system and will use it not just on city pairs like Berlin-Augsburg or Berlin-Münster but also things like Wismar-Jena, on which most people will just drive. In the United States, groups of users of Amtrak trains outside the Northeast Corridor like the Rail Passengers’ Association (RPA, distinct from the New York-area planning organization) routinely make this mistake and overrate the viability of slow night trains. I bring this up here because it is possible to overcorrect from the principle of “don’t rely on tourist reports too much, and do pay attention to the secondary markets” and instead pay too much attention to the secondary markets.
Why is Janno Lieber Constantly Blaming Other People for Problems?
The Editorial Board posted an interview with MTA head Janno Lieber about sundry public transit-related issues. His answers for the most part aren’t bad until he gets to construction costs (and misgenders me), but alongside other recent news about Penn Station Access, they reveal a pattern: Lieber loves blaming other people for problems – nothing is ever the MTA’s fault, everything is someone else’s fault. Nor is he curious about acquiring expertise, to the point that everything is defensive, and everything is about reducing transparency and accountability. Someone like this should not be heading a public transit agency.
Penn Station Access
Penn Station Access, the project to run Metro-North trains from New Rochelle to Penn Station via the Hell Gate Line currently used only by Amtrak, was announced earlier this month to be delayed by a further two years, from 2028 to 2030. The MTA blames Amtrak, which owns most of the line, for not giving it enough work windows.
And, excuse me, but this is bullshit for two separate reasons. The first is that the opening date was said to be 2027 until this year and then 2028. Other people made plans based on MTA announcements; quite a lot of behind-the-scenes advocacy was designed specifically around this date. The state was among those other people: in March, it decided to buy new battery-powered locomotives, each costing $23.45 million (about the same as an eight-car EMU set), on the grounds that it would take too long to acquire new EMUs that were compatible with the different electrification systems used on the line. It’s not at all hard to get new EMUs compatible with both the 12 kV 60 Hz electrification used on most of the line and the 12 kV 25 Hz system used in the last few km into Penn Station based on current New York lead times if the project opens in 2030. But the state made a decision based on the assumption it would need this well before 2030.
In other words, the MTA only discovered that there would be Amtrak-induced delays around two and a half years before planned opening for a project that had been going on for three years and approved for six – and now it’s blaming it on Amtrak instead of on its own poor project management and lack of transparency.
The second reason it’s bullshit is that the relationship between Amtrak and the MTA is mutually abusive. Amtrak is not giving the MTA enough work windows on the Hell Gate Line; the MTA is slowing down Amtrak trains on the New Haven Line between New Rochelle and New Haven, where it owns the tracks, the only part of the Northeast Corridor that is both owned and dispatched by a commuter railroad and not Amtrak (in Massachusetts the MBTA owns the tracks but Amtrak controls dispatching). The maximum allowed cant deficiency on Metro-North territory is based on unmodernized Metro-North values and not based on the modern values that Amtrak rolling stock has been tested for, and there is no attempt to keep Amtrak and Metro-North trains separate east of Stamford, where there are four tracks and light enough traffic that it’s possible, that the top speeds can have a mismatch.
In other words, the MTA complains about being abused by Amtrak, and is likely correct, but refuses to stop abusing Amtrak where it does have control. It could manage this relationship better, but it doesn’t and Lieber isn’t competent enough to know how to do it better.
Fares
The conversation in The Editorial Board heavily features talking about fares, in context of fare evasion and mayoral frontrunner Zohran Mamdani’s proposal for free buses. Lieber is suggesting that instead of free buses, buses can have all-door boarding without free fares, unlocking the speed benefits without forgoing the revenue. He’s right and I want to sympathize with his critique of free buses. But it was Lieber who scuttled plans by Andy Byford to install back-door OMNY card readers and enable all-door boarding without free fares. He calls for all-door boarding as an alternative to free buses now, but when all-door boarding was available as an internally developed plan, he killed it.
He speaks about Europe this and Europe that in the interview, but he’s too ignorant and incurious to understand how things go here and how we make all-door boarding work with proof-of-payment. And the best way to see that is his abominable line, “had a kid who did a semester abroad in Stockholm, and you see them all over in Europe.” That’s his only reference – his kid did a semester abroad. He didn’t ring up any transit agency to ask how to do it. It’s all superficial, almost tourist-level understanding of better-run systems.
This is especially bad in context of what he says about construction costs at the end. He says,
I don’t accept the Alon Levy theory, which, you know, you’re articulating — that somehow, if we just had like this massive in-house force, we would be building everything way, way cheaper. That’s like, hiring— you cannot compete with private-sector engineering. And we don’t have one project after another, like he loves, like Madrid, which built all these subways in a row.
Setting aside the fact that calling me “he” in New York, a city with better access to gender-neutral bathrooms than my own, is obnoxious, we didn’t do a report on Madrid, but did do one on Stockholm. He’s aware of the report (and of the points it makes about ridership per station, the excuse he uses farther down the line for bigger stations). And he still reduces Stockholm to where his kid did a one-semester study abroad to give a little anecdote on fare evasion, which boils down to Americans being so detached from internal national discourses in Europe (except maybe the UK) that they don’t know that we’ve had to deal with the same questions they did, we just have public agencies run by competent people who sometimes make the right decisions and not by people like Janno Lieber.
Reverse-Branching on Commuter Rail
Koji asked me 3.5 days ago about why my proposal for New York commuter rail through-tunnels has so much reverse-branching. I promised I’d post in some more detail, because in truth, reverse-branching is practically inevitable on every commuter rail system with multiple trunk lines, even systems that are rather metro-like like the RER or the S-Bahns here and in Hamburg.

This doesn’t mean that reverse-branches, in this case the split from the Görlitzer Bahn trunk toward the Stadtbahn via S9 and the Ring in two different directions via S45/46/47 and S8/85, are good. It would be better if Berlin invested in turning this trunk into a single trunk into city center, provided it were ready to build a third through-city line (in fact, it is, but this project, S21, essentially twins the North-South Tunnel). However, given the infrastructure or small changes to it, the current situation is unavoidable.
Moreover, the current situation is not the end of the world. The reasons such reverse-branches are not good for the health of the system are as follows:
- They often end up creating more frequency outside city center than toward it.
- If there is too much interlining, then delays on one branch cascade to the others, making the system more fragile.
- If there is too much interlining, then it’s harder to write timetables that satisfy every constraint of a merge point, even before we take delays into account.
All of these issues are more pressing on a metro system than on a commuter rail system. The extent of branching on commuter rail is such that running each line as a separate system is unrealistic; tight timetabling is required no matter what, and in that case, the lines could reverse-branch if there’s no alternative without much loss of capacity. The S-Bahn here is notoriously unreliable, but that’s the case even without cascading delays on reverse-branches – the system just assumes more weekend shutdowns, less reliable systems (28,000 annual elevator outages compared with 1,800 on the similar-size U-Bahn), and worse maintenance practices.
So, on the one hand, the loss from reverse-branching is reduced. On the other hand, it’s harder to avoid reverse-branching on commuter rail. The reason is that, unlike a metro (including a suburban metro), the point of the system is to use old commuter lines and connect them to form a usable urban and suburban service. Because the system relies on old lines more, it’s less likely that they’re at the right places for good connections. In the case of Berlin, it’s that there’s an east-west imbalance that forces some east-center-east lines via S8, which was reinforced by the context of the Cold War and the Wall.
In the case of New York, consider this map:
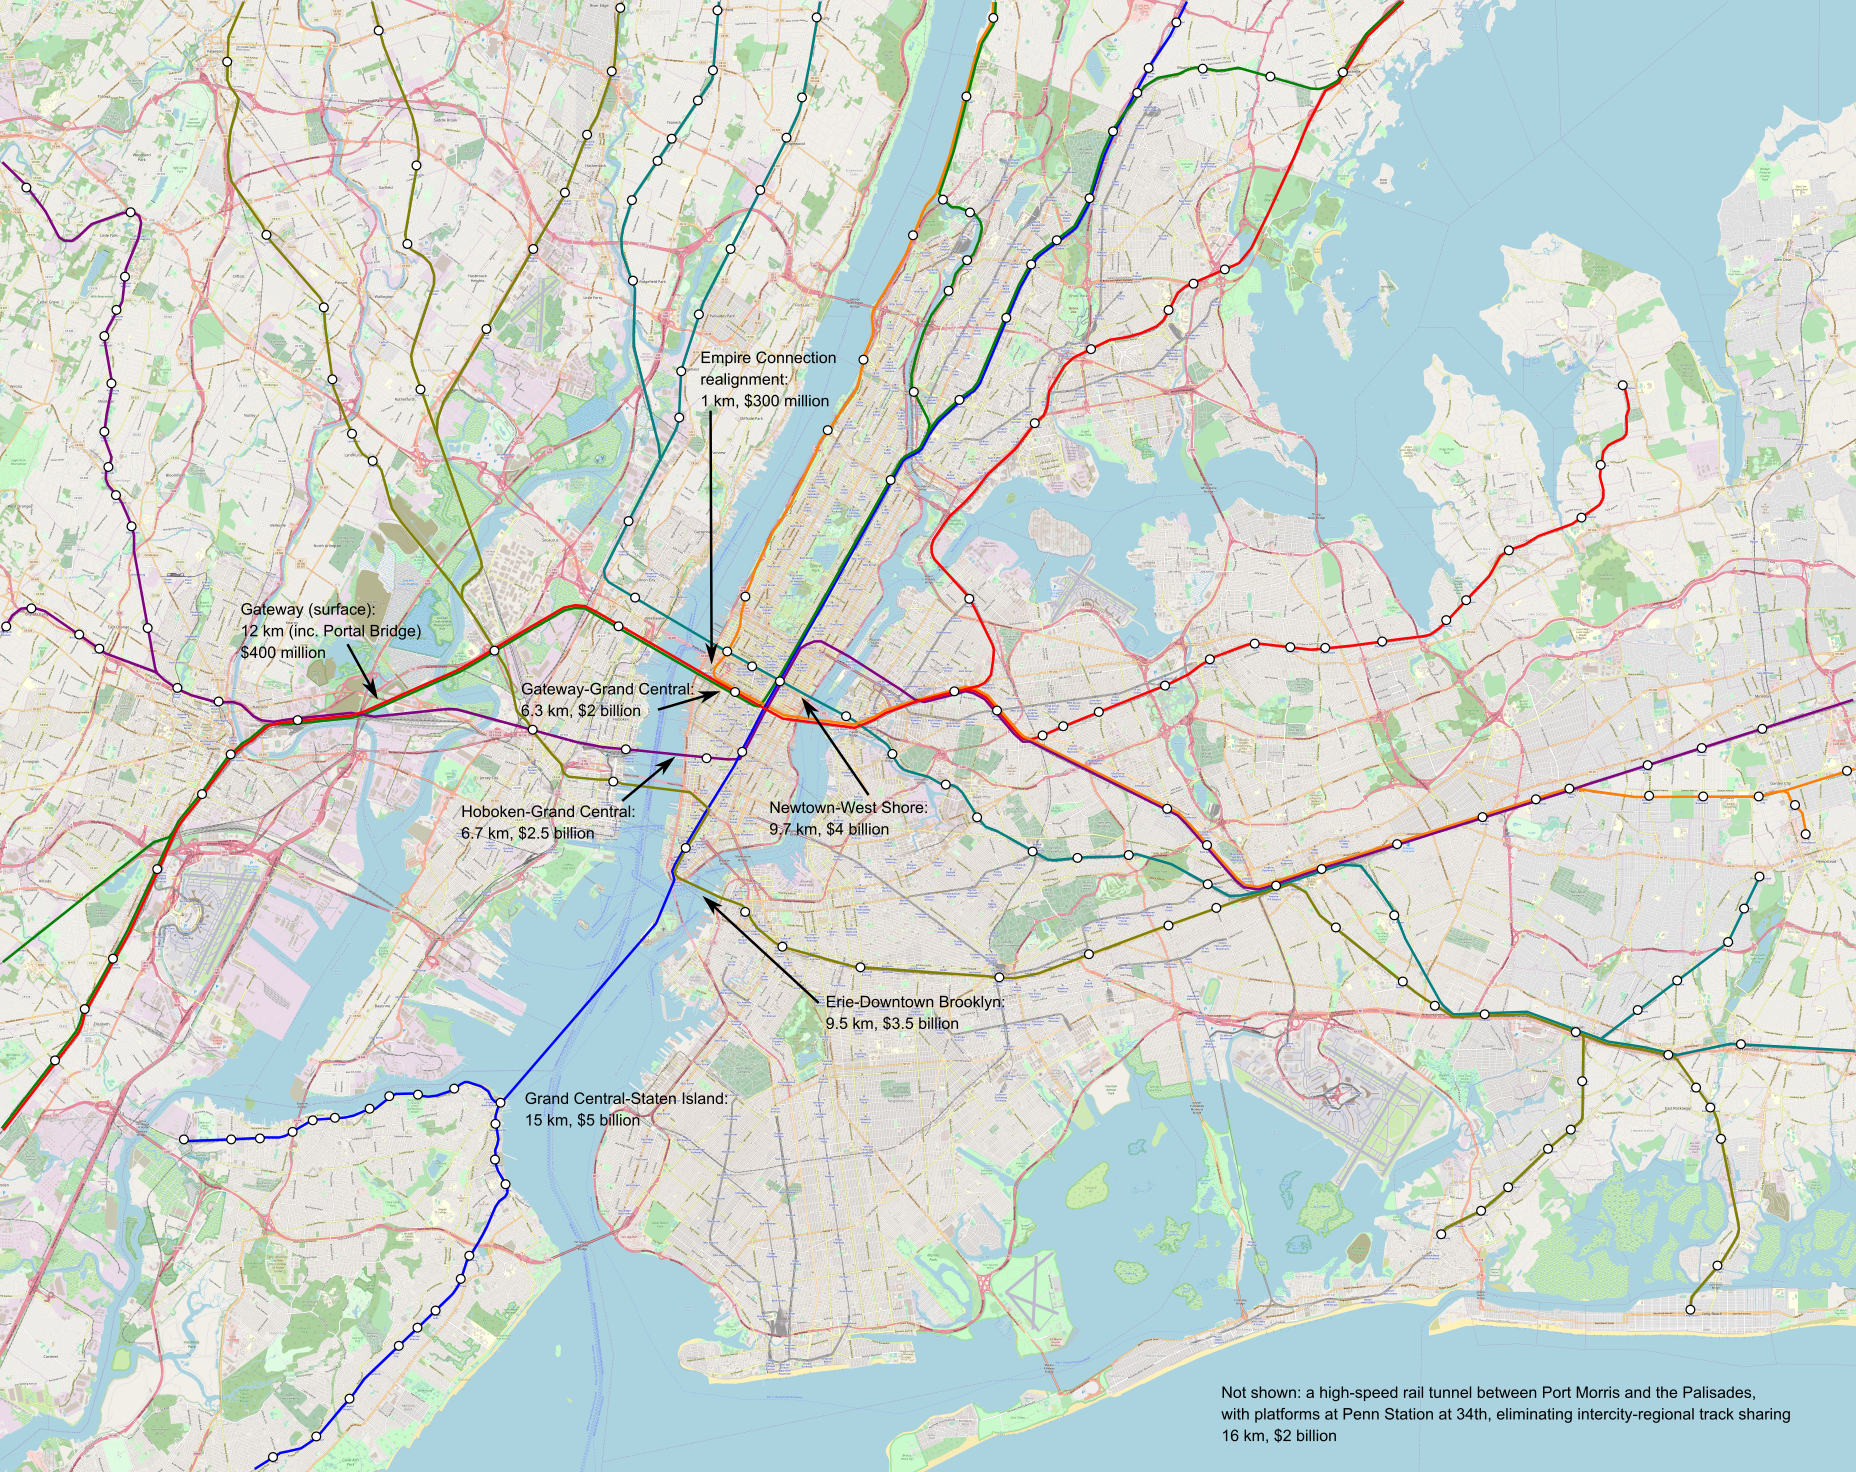
The issue is that too much traffic wants to use the Northeast Corridor lines in both New Jersey and Connecticut. Therefore, it’s not possible to segregate everything, with lines using the preexisting North River Tunnels and the new Gateway tunnels having to share tracks. It’s not optimal, but it’s what’s possible.
The Invention of the Traditional System of Project Delivery
In the Sweden case, I contrasted the emerging UK-influenced norms of infrastructure project delivery, which I called the globalized system, with the way Nordic procurement was previously done, which I called the traditional system. This explained Nordic trends well, in which Stockholm went from having construction costs so low in the second half of the 20th century they were at times even lower than those of Spain to having rather average costs for Europe. But elsewhere, calling the set of good project delivery practices reliant on an active, expert, apolitical public sector traditional ended up obscuring too much. In the United States, for one, the traditional practices did not work like that at all. In Italy, the project delivery practices are thoroughly traditional in the Nordic sense, but go back to mani pulite in the 1990s.
That said, this procurement system represents an evolution of prior norms of state-led planning, and is less of a break from them than the globalized system is. It’s best viewed as a system based on transparency and good government insights from the second half of the 20th century, rather than on giving up on good government and privatizing to the private sector as the globalized system does. In either case, it has little to do with traditional or emerging American practices, the former based on the good government practices of the early 20th century and the latter an adaptation of the globalized system in an even worse context. Regardless, its benefits are extensive, with interviewees in New York and increasingly London finding various wastes in the process of their own project delivery that can double the cost or even worse.
Good procurement practices: a recap
Good infrastructure megaproject delivery – at least subways, but also likely road tunnels as far as we can tell from small data – requires an active public sector that can supervise consultants and contractors, learn within its own institutions, and assume risk.
In Southern Europe today, and in the Nordic countries until recently, this means the following:
- Technical scoring: infrastructure contracts must be awarded primarily on the technical score of the proposal (50-80% of the weight of the contract) and not on the cost (maximum 50%, ideally about 30%)
- Itemized costs: contracts must have a bill of items, priced based on transparent lists produced by the state, with change orders using the same itemized list to reduce conflict
- Separation of design and construction into two contracts (design-bid-build), rather than bundling into design-build contracts
- Public-sector planning, with the decisions on the type of project and technology made before any designers are contracted
- Flexibility for the builders to vary from the design, so that in practice the design only covers 60-80% of the design, as 100% design is impossible underground until one starts digging
- Moderate-size contracts (tens of millions of dollars or euros to very low hundreds), to allow more contractors to compete
- Limited use of consultants, or, if consultants are used, regular public-sector supervision
This is not entirely in pure contrast to the globalized system, which centers the needs of large multinationals. The large multinationals prefer large-size fixed-price design-build contracts with early contractor involvement and extensive reliance on consultants, but they also prefer technical scoring, which makes them feel like racing to the top rather than the bottom.
This is also not always traditional. In the United States, for example, there is no tradition of technical scoring, itemization of costs, or any flexibility for builders to vary from design. This is because American procurement laws and traditions go back to the Progressive Era, when lowest-bid contracts were thought to be a good government innovation; as it is, American law permits technical scoring as the law states lowest responsible bid, but it’s almost never used, and never to the full extent, so the tradition remains lowest-bid.
The evolution of project delivery in Scandinavia
Traditional Nordic subway infrastructure project delivery was largely in line with the above outline of good practices. However, two variations are notable, one small and one large.
The small variation is that Nordic governments have been happier to outsource operations and even some construction design to private contractors than governments in the rest of Europe; in Finland, project delivery was largely done by private consultants, but under public-sector supervision, with institutional knowledge retained in government agencies even in an environment of privatization.
The large variation is that the risk allocation did not, in practice, permit flexibility for the building contractors. The traditional implementation of design-bid-build assigned the risk to the build contractors if they made any change to the design and to the design contractors if the build contractors made no such changes. This led to defensive design: the build contractors never varied from the design, and the design contractors knew this and prescribed some overbuilding to account for risks that could be discovered later in the process, for example grouting tunnels that might not be necessary. It’s this conflict, driving up costs in Oslo, that contributed to the acceptance of design-build in Scandinavia.
But it wasn’t just the failure of one of the features of the otherwise good project delivery system. It was British soft power, and the perception that English-speaking multinational consultants with extensive experience in megaprojects that use consultants knew better than the Swedish or Danish or Finnish or Norwegian state. There was limited attention in the Nordic procurement strategy to largely traditional Germany, which does not exert this soft power on countries that are richer than Germany and speak English and not German, let alone Southern Europe, which Northern Europe constantly looks down on.
In this sense, Sweden has not been too different from France. France, too, began implementing globalized system features under the soft power of English-speaking multinationals; for all of their frothing at the mouth about France’s superiority to the UK and US, the top 1% of France wish they were the top 1% in a higher-inequality country like the US, and are happy with privatization. And in both France and Sweden, the process is being halted as its poor results are visible; Swedish public transport watchers are already noticing how the emerging system is based on the needs of large multinationals and not those of society, and in France, the delivery of Grand Paris Express in a UK/US-style single-purpose delivery vehicle (SPDV) turned into a permanent institution to build suburban rail extensions throughout France.
The invention of itemization in Italy
Italy is the only case I’m aware of in which there was a large systemic reduction in the cost of subway construction. This occurred in the environment of mani pulite, in which outrage over the endemic corruption of the Cold War-era Italian state led to massive, mediagenic investigations, forcing former Prime Minister Bettino Craxi into exile, putting half of parliament under indictment, and destroying all major political parties. The remnants of the communist party (PCI), the largest and most moderate in Europe, formed the new center-left, the present-day Democratic Party (PD); on the right, the dominant element in the coalition was previously nonpartisan media mogul Berlusconi and later the coalescence of fringe far right parties into more serious conservative blocs, currently Fratelli d’Italia (FdI).
In Italian historiography, mani pulite is rather bittersweet. Berlusconi himself was openly corrupt, and used his media influence to shut down the investigations before they could get to him as he entered politics, since he too had been involved in the corruption of the 1980s, including influence peddling with Craxi. I analogize it to civil rights in the United States, in which by the late 1960s, early-1960s optimism about ending racism was dashed, and the civil rights laws and court rulings led to a backlash symbolized by the election of Richard Nixon on a law-and-order platform. But just as the racial wage gaps in the United States markedly fell in the 1960s-70s, so did Italian infrastructure corruption levels markedly fall in the 1990s due to the legislation passed in the wake of mani pulite.
The history of itemization in Italy goes back to those post-mani pulite reforms. By the 1990s, it was clear that fighting corruption required extensive sunshine, as well as a proactive apolitical state willing to put people in prison; this was the same era of prosecutors and judges putting Cosa Nostra leaders in prison, with some being assassinated during trial and many of the others having to hide out for the duration. One can’t privatize the state in face of the mafia. The upshot is that instead of American-style rules and traditions aiming to solve the problems of the late 19th century, Italian public procurement law aims to solve those of the late 20th century.
Implementing good project delivery practices
If there’s a common theme to the various elements of Southern European (and largely also French and German) urban rail procurement norms, it’s that they require an expert civil service. Teams of engineers, planners, architects, procurement experts, and public-sector project managers are required to manage such a system, and they need to be empowered to make decisions.
This empowerment contrasts with American public-sector norms, in which to a small extent in law and to a very large extent in political culture, civil servants are constantly told that they are dregs and cannot make any decisions. Instead, they are bound by red tape requirements that can only be waived if a political appointee wants to take the risk. The United Kingdom is similar, except without the political appointees, so ministerial approval is required. Everything below that level is designed to avoid change and avoid any decisionmaking. The role of the public-sector engineer in these societies is to prostrate before the political advisor who went to the right elite universities and went through the right pipelines. The idea of listening to engineers and planners is denigrated as siloing, whereas generalist managers with little knowledge are elevated to near-godhood. Much of the growth of the globalized system in these environment comes from the fact that in privatizing planning to multibillion-dollar design-build contracts, the only public-sector decisions are made at the level of a top political leader, such as a governor, without having to deal with civil servants.
In contrast, it is less important how many civil servants are hired to supervise contracts than that they have the authority to make judgment calls and that they do not have to answer to an overclass of generalist managers. Italy and France use very large bureaucracies of planners and engineers at Metropolitana Milanese and RATP respectively, but Nordic planning always used smaller teams with more use of consultants under client supervision. In this sense, the fact that a Swedish procurement civil servant who didn’t know me was willing to tell me on the record that functional procurement doesn’t work speaks louder than any organization chart; in the United States, civil servants would never criticize their own organizations’ plans so openly.
Once the civil servants can make decisions and supervise contractors, they can look at bids and score them technically, or delve through itemized lists, or oversee changes and make quick yes-or-no decisions as the builders are forced to vary from the design. With such tight project management, they do with one dollar what 10 years ago New York procurement did with two, and what today New York does with more than two, making this the most significant single intervention in reducing infrastructure construction costs.
Transit-Oriented Development and Rail Capacity
Hayden Clarkin, inspired by the ongoing YIMBYTown conference in New Haven, asks me about rail capacity on transit-oriented development, in a way that reminds me of Donald Shoup’s critique of trip generation tables from the 2000s, before he became an urbanist superstar. The prompt was,
Is it possible to measure or estimate the train capacity of a transit line? Ie: How do I find the capacity of the New Haven line based on daily train trips, etc? Trying to see how much housing can be built on existing rail lines without the need for adding more trains
To be clear, Hayden was not talking about the capacity of the line but about that of trains. So adding peak service beyond what exists and is programmed (with projects like Penn Station Access) is not part of the prompt. The answer is that,
- There isn’t really a single number (this is a trip generation question).
- Moreover, under the assumption of status quo service on commuter rail, development near stations would not be transit-oriented.
Trip generation refers to the formula connecting the expected car trips generated by new development. It, and its sibling parking generation, is used in transportation planning and zoning throughout the United States, to limit development based on what existing and planned highway capacity can carry. Shoup’s paper explains how the trip and parking generation formulas are fictional, fitting a linear curve between the size of new development and the induced number of car trips and parked cars out of extremely low correlations, sometimes with an R^2 of less than 0.1, in one case with a negative correlation between trip generation and development size.
I encourage urbanists and transportation advocates and analysts to read Shoup’s original paper. It’s this insight that led him to examine parking requirements in zoning codes more carefully, leading to his book The High Cost of Free Parking and then many years of advocacy for looser parking requirements.
I bring all of this up because Hayden is essentially asking a trip generation question but on trains, and the answer there cannot be any more definitive than for cars. It’s not really possible to control what proportion of residents of new housing in a suburb near a New York commuter rail stop will be taking the train. Under current commuter rail service, we should expect the overwhelming majority of new residents who work in Manhattan to take the train, and the overwhelming majority of new residents who work anywhere else to drive (essentially the only exception is short trips on commuter rail, for example people taking the train from suburbs past Stamford to Stamford; those are free from the point of view of train capacity). This is comparable mode choice to that in the trip and parking generation tables, driven by an assumption of no alternative to driving, which is correct in nearly all of the United States. However, figuring out the proportion of new residents who would be commuting to Manhattan and thus taking the train is a hard exercise, for all of the following reasons:
- The great majority of suburbanites do not work in the city. For example, in the Western Connecticut and Greater Bridgeport Planning Regions, more or less coterminous with Fairfield County, 59.5% of residents work within one of these two regions, and only 7.4% work in Manhattan as of 2022 (and far fewer work in the Outer Boroughs – the highest number, in Queens, is 0.7%). This means that every new housing unit in the suburbs, even if it is guaranteed the occupant works in Manhattan, generates demand for more destinations within the suburb, such as retail and schools.
- The decision of a city commuter to move to the suburbs is not driven by high city housing prices. The suburbs of New York are collectively more expensive to live in than the city, and usually the ones with good commuter rail service are more expensive than other suburbs. Rather, the decision is driven by preference for the suburbs. This means that it’s hard to control where the occupant of new suburban housing will work purely through TOD design characteristics such as proximity to the station, streets with sidewalks, or multifamily housing.
- Among public transportation users, what time of day they go to work isn’t controllable. Most likely they’d commute at rush hour, because commuter rail is marginally usable off-peak, but it’s not guaranteed, and just figuring the proportion of new users who’d be working in Manhattan at rush hour is another complication.
All of the above factors also conspire to ensure that, under the status quo commuter rail service assumption, TOD in the suburbs is impossible except perhaps ones adjacent to the city. In a suburb like Westport, everyone is rich enough to afford one car per adult, and adding more housing near the station won’t lower prices by enough to change that. The quality of service for any trip other than a rush hour trip to Manhattan ranges from low to unusable, and so the new residents would be driving everywhere except their Manhattan job, even if they got housing in a multifamily building within walking distance of the train station.
This is a frustrating answer, so perhaps it’s better to ask what could be modified to ensure that TOD in the suburbs of New York became possible. For this, I believe two changes are required:
- Improvements in commuter rail scheduling to appeal to the growing majority of off-peak commuters as well as to non-commute trips. I’ve written about this repeatedly as part of ETA but also the high-speed rail project for the Transit Costs Project.
- Town center development near the train station to colocate local service functions there, including retail, a doctor’s office and similar services, a library, and a school, with the residential TOD located behind these functions.
The point of commercial and local service TOD is to concentrate destinations near the train station. This permits trip chaining by transit, where today it is only viable by car in those suburbs. This also encourages running more connecting bus service to the train station, initially on the strength of low-income retail workers who can’t afford a car, but then as bus-rail connections improve also for bus-rail commuters. The average income of a bus rider would remain well below that of a driver, but better service with timed connections to the train would mean the ridership would comprise a broader section of the working class rather than just the poor. Similarly, people who don’t drive on ideological or personal disability grounds could live in a certain degree of comfort in the residential TOD and walk, and this would improve service quality so that others who can drive but sometimes choose not to could live a similar lifestyle.
But even in this scenario of stronger TOD, it’s not really possible to control train capacity through zoning. We should expect this scenario to lead to much higher ridership without straining capacity, since capacity is determined by the peak and the above outline leads to a community with much higher off-peak rail usage for work and non-work trips, with a much lower share of its ridership occurring at rush hour (New York commuter rail is 67-69%, the SNCF part of the RER and Transilien are about 46%, due to frequency and TOD quality). But we still have no good way of controlling the modal choice, which is driven by personal decisions depending on local conditions of the suburb, and by office growth in the city versus in the suburbs.
High-Speed Rail Ridership Estimator Applet
Thijs Niks made a web applet for calculating high-speed rail network ridership estimates. This is based on the gravity model that I’ve used to construct estimates. The applet lets one add graph nodes representing metro areas and edges representing connections between them. It estimates ridership based on the model, construction costs based on a given choice of national construction costs, and overall profitability after interest. It can also automate the exact distances and populations, using estimates of population within a radius of 30 km from a point, and estimates of line length based on great circle length. The documentation can be found here and I encourage people to read it.
This is a very good way of visualizing certain things both about high-speed rail networks and the implications of a pure gravity model. For one, Metcalfe’s law is in full swing, to the point that adding to a network improves its finances through adding more city pairs than just the new edges. The German network overall is deemed to have insufficient financial rate of return due to the high costs of construction (and due to a limitation in the applet, which is that it assumes all links cost like high-speed rail, even upgraded classical lines like Berlin-Hamburg). But if the network is augmented with international connections to Austria, Czechia, Poland, Belgium, the Netherlands, France, and Switzerland, then it moves into the black.
To be clear, this is not a conclusion of the applet. Rather, the applet is a good visualization that this is a conclusion of the model. The model, with the following formula,

is open to critique. The minimum distance d can be empirically derived from ridership along a line with intermediate stops; I use 500 km, or around a trip time of 2:15. The constant c is different in different geographies, and I don’t always have a good explanation for it. The TGV has a much higher constant than the Shinkansen (by a factor of 1.5), which can be explained by its much lower fares (a factor of about 1.7). But Taiwan HSR has a much higher constant than either, with no such obvious explanation. This is perilous, because Taiwan is a much smaller country than the others for which I’ve tested the model (Japan, South Korea, France, Germany, Spain, Italy). There may be reason to believe that at large scale, c should be lower for higher-population geographies, like the entirety of Europe; the reason is that if c is truly independent of population size, then the model implies that the propensity to travel per individual is not constant, but rather is larger in larger geographies, with an exponent of 0.6. This could to some extent be resolved if we have robust Chinese data – but China has other special elements that make a straight comparison uncertain, namely much lower incomes (reducing travel) and much higher average speeds (increasing travel).
The other issue is that the value of c used in the applet is much higher than the one I use. I use 75,000 for Shinkansen and 112,500 for Europe, with the populations of the metro areas stated in millions of people, the distance given in kilometers, and the ridership given in millions of riders per year. The applet uses 200,000, because its definition of metro area is not taken from national lists but from a flat applet giving the population in a 30 km radius from a point, which reduces Paris from 13 million people to 10.3 million people; it also omits many secondary cities in France that get direct TGVs to the capital, most notably Saint-Etienne and Valence, collectively dropping 12% of the modeled Paris-PACA ridership and 37% of the Paris-Rhône-Alpes ridership. (Conversely, the same method overestimates the size of metro Lille.)
Potentially, if the definition of a metro area is the population within a fixed radius, then the 0.8 exponent may need to be replaced with 1, since the fixed radius already drops many of the suburbs of the largest cities. The reason the gravity model has an exponent of 0.8 and not 1 is that larger metro areas have diseconomies of scale, as the distance from the average residence to the train station grows. Empirically, splitting combined statistical areas in the US into smaller metro areas and metropolitan divisions fits an exponent of 0.8 rather than 1, as some of those divisions (for example, Long Island) don’t have intercity train stations and have a longer trip time; it is fortunate that training the same model on Tokyo-to-secondary city Shinkansen ridership results in the same 0.8 exponent. However, if the definition of the metropolitan area is atypically unfair to New York and other megacities then the exponent is likely better converted to the theoretically simpler 1.
