Category: Transportation
The Magic Triangle: Infrastructure-Timetable-Rolling Stock
In the last month, Amtrak decided not to purchase additional Acela cars, but instead replace the Acela fleet ahead of time, and try to buy trains that aren’t compliant with FRA regulations. More recently, Amtrak and the California HSR Authority decided to bundle their orders together. The latter decision drew plenty of criticism from some good transit advocates, such as Clem Tillier, and even the former decision did. Clem explained,
The whole notion of buying quicker trains for the NEC is ridiculous– the existing Acela Express trains have plenty of oomph (16 kW/tonne) to do anything they need to do. “Lighter” and “faster” isn’t the key to anything on the NEC, and dropping in a higher-performance train will not lead to material trip time improvements. They need to speed up the slow bits first, which isn’t something you do by blowing money on trains.
Clem’s criticism got a fair amount of flak in comments, from me and others, for underestimating how important getting around FRA regulations is. What nobody said in comments, and I only realized after the discussion died out, is how the choice of rolling stock depends heavily on what Amtrak plans to do with infrastructure and service planning in the Northeast. It doesn’t make sense in any case to tether Amtrak’s plans for a corridor that’s in many ways globally unique to the California HSR Authority’s for a fairly standard HSR implementation. But what rolling stock is required, and thus how bad the tethering is, depends on a concrete plan for infrastructure and schedule.
At the highest level, the unique issue with the Northeast Corridor is that significant parts can’t be feasibly upgraded to more than 200-250 km/h or easily bypassed, while others can. This means that there’s a tradeoff between top speed and cant deficiency, and the optimal choice depends on how much investment there is into speeding up segments. In any case it’s critical to improve station throats, interlockings, and railroad junctions, but after the 50 and 100 km/h zones are dealt with, the remaining questions are still nontrivial.
The more money is invested, the less it makes sense to run a 270 mm-cant deficiency, 250 km/h Pendolino, and the more it makes sense to run a Talgo AVRIL or E5/E6, both of which are capable of 350 km/h but only about 180 mm of cant deficiency (or N700-I, which is on paper capable of 330 km/h and about 135 mm and in practice could probably be run at 360 km/h and 175 mm). If there’s one segment that tilts the decision, it’s New Haven-Providence: using the legacy Shore Line, even with heavy upgrades, limits speeds and favors high cant deficiency, while bypassing it on I-95 favors high top speeds. But even the New York-Washington segment of today has a few curves strategically located at the worst locations, which make higher tilt degree a benefit.
In medium-speed territory, the Pendolino versus E5/AVRIL/N700-I decision is the muddiest. I ran rough simulations on an upgraded New Haven Line, with bypasses including those I advocated as a first step but also additional ones in the more difficult Stamford-New Haven segment. A train with E5 cant deficiency and N700-I acceleration did New York-New Haven in 32 minutes, and a Pendolino with all cars powered did it in 30. Neither is a standard trainset, though the former is very close to standard (and the Talgo AVRIL is also quite close). The Pendolino as it is, with about half the cars powered, has low power by HSR standards, and this is a problem for accelerating back from a slow zone at medium speed. With all cars powered (which is feasible, at higher acquisition cost) it’s still far from turbocharged, but can change speed more easily. An off-the-shelf Pendolino would not beat an E5 or AVRIL or N700-I on such a corridor, and of course would not beat it south of New York or north of New Haven.
Since nonstandard trains cost more, it’s important to also decide whether they’re worth the cost. Bearing in mind that Amtrak said a new noncompliant trainset costs $35-55 million, which is above the range for 8-car trains (China pays about $4 million per 350+ km/h car), so it may already be factoring in a premium, paying more for trains is worth it whenever the benefits to passengers are noticeable enough. This, like choosing very high-speed rolling stock rather than a Pendolino, is the most effective at high levels of infrastructure investment. An off-the-shelf Pendolino is good enough for most applications. So is an off-the-shelf N700-I without tilt. It’s okay to be 15 minutes slower than the cutting edge if the cutting edge is too expensive. But the effect of 15 minutes on ridership is more pronounced if it’s the difference between 1:35 and 1:50 than if it’s the difference between 3:00 and 3:15. In addition, the faster the service is, the more revenue each train earns, and this allows spreading the extra acquisition cost among more passengers.
Another factor that’s neglected, at least in public statements, is the service plan. Amtrak service is heavily padded: the fastest northbound Acela is scheduled to do Providence-Boston in 47 minutes, but in the opposite direction it’s 34. Remove the Route 128 stop and this can get close to 30 or even below it. About the fastest trains can go with no schedule padding is 19.25 minutes, and reasonable but not onerous padding raises it to about 20.5. Clearly, more of the difference comes from operating efficiencies than from any speed raising; the Acela already goes 240 km/h between Providence and Boston and already has about 180 mm (7″) cant deficiency.
The limiting factor here is more MBTA ownership and operating culture. A good service plan would make it clear how trains can share the corridor (and the same is true on the New Haven Line, another unduly slowed commuter-owned segment), and because MBTA trains are so slow, any cooperation would involve public statements regarding upgrades to the MBTA. The Acela has level boarding at every stop except New London, which is the easiest to cut out and should be bypassed together with the rest of Shore Line East. It’s the MBTA that has non-level boarding, which remains one of the biggest schedule risks, requiring plenty of recovery time to deal with possible long dwell times coming from above-average crowds.
The problem is that Amtrak has made no statements regarding how to integrate the three legs of the magic triangle. It proposed the Vision plan, which even political transit bloggers like Ben Kabak note the extreme cost of; there’s no funding, and the first segment for which it’s trying to obtain funding, the Gateway Tunnel, is very far from the top priority for speed or even for intercity rail capacity. It now proposes new rolling stock, but is unclear about what the trains are supposed to do except be very fast. (Bundling with a new-build line like California makes sense only if all curves are straightened to a radius of 4+ kilometers, even extremely expensive ones.)
Perhaps it’s a feature of opaque government, that Amtrak refuses to say how much money it needs to meet each timetable and capacity goal. For example, it could say that if Congress gives it $10 billion it could reduce travel time from Washington to Boston from the present 6:45 to 5:45 while also running a peak of 4 long trains per hour at that speed. (I think for $10 billion it’s possible to get down to 3:30 or at worst 4:00, but this is a matter of cost control and not just transparency, though transparency can indirectly lead to better cost control.) This would involve heavy cooperation with the commuter railroads that share its tracks and joint plans, as well as detailed public plans for how much to spend on each segment and for what purpose. This is routine in Swiss rail infrastructure planning, since all major projects have to be approved by referendum, but does not happen in the US. It could be that Amtrak knows what it’s doing but acts like it doesn’t because the structure of government in the US is such that these decisions are made behind closed doors.
But more likely, Amtrak doesn’t know what it’s doing, and is just proposing new initiatives that make it seem forward-looking. Changing FRA rules is an unmixed blessing. Bundling an order with California HSR is not. The fact that Amtrak is doing so, while keeping mum about even what kind of rolling stock it thinks it needs, suggests that it reverses the usual way reform should be: instead of a need for reform producing good results and thence good headlines, a need to get good headlines about reform produces reform ideas that sound good. Some of those good-sounding ideas really are good, but not all are. It’s important for good transit advocates to distinguish the two both privately and publicly.
I feel like in the last two years, we’ve seen important American transit and railroad managers say correct things. Shortly after I started making noise in comments about New York’s outsized subway construction costs, Jay Walder said as much in a report entitled Making Every Dollar Count. Joe Lhota proposed through-running on commuter rail as a solution to improve efficiency. Scott Stringer, too, talked publicly about comparative construction costs, and for all of my criticisms of transit managers who say that, I thought it was enough for him to say that as a political candidate for a medium-term office to deserve my endorsement for the mayoral election, which he unfortunately bowed out of. The FRA proposed to start working on new rules for rolling stock last year. At Amtrak, we’ve just now seen Joseph Boardman propose noncompliant rolling stock. Perhaps I’d be more optimistic if Walder and Lhota had stayed at the MTA for longer to implement their positive reform ideas, instead of using it as a springboard to secure a higher-paying job or run for mayor, but increasingly it looks like the good reform talk is not generally accompanied by good actions.
This is, again, where good transit advocates can have the most influence. We more or less know which reforms are required and which are not. There are disagreements at times (Clem, for one, has much better credentials as a good transit activist than I do), but on most of the agenda items there’s agreement. We already know what details we might want to see from a good plan of action, and the advantage of this is that we can check proposed plans against them. That Amtrak’s gotten so many details wrong suggests that it still doesn’t know what the best practices for rail construction are, even if the basic idea of getting around FRA rules is sound. I wish I didn’t have to say it, but I’ll believe Amtrak’s improved when I see it.
C-Shaped Lines
The ideal rapid transit line looks something like a straight line. It can have deviations, but on a map it will be more or less a line with a definitive direction. Most rapid transit lines are indeed linear, or failing that circular (to provide circumferential service) or L-shaped. In most cities there are just a handful of C-shaped exceptions: London has just one (the Piccadilly Line), Tokyo two (the Marunouchi Line and the Yokosuka-Sobu Line), Paris one (the RER C; Metro 2 and 6 should really count as a circle), Seoul one (Line 6). In contrast, in some cities, such as New York, there are many C-shaped lines. Since most people aren’t traveling in semicircles, it’s worth talking about reasons why cities may build lines that don’t have the most efficient shape.
Reason 1: water
Cities right next to a large body of water may have lines that double back. Chicago has the Blue Line, Toronto has the Yonge-University-Spadina Line, San Francisco has the Daly City-Dublin and Daly City-Fremont BART routes and the T-Third Muni route. If Boston extends the Green Line to Somerville, the Green Line will form a C. Tokyo’s Yokosuka-Sobu through-line is in this category as well. Usually, the transit operator doesn’t expect anyone to take the line for its full length; Toronto is planning a crosstown line bridging the far ends of the C. Such lines are C-shaped because they are really two interlined lines coming from the same direction.
Reason 2: two separate lines joined at the outer end for operational reasons
This can be similar to reason 1 in that nobody is expected to take the line along its full length, but here the joining occurs at the outer end. Singapore’s North-South Line and Vancouver’s Millennium Lines are both examples of this. In Singapore’s case this comes from an international boundary; in Vancouver’s it comes from the need to connect the line to the Expo Line so that trains can go to the maintenance yard, and it proved too hard to connect the lines at the inner end, at Broadway/Commercial. In both examples, what should really be two separate lines are joined by an outer loop that functions as somewhat of a circumferential, but the lines were not planned to provide circumferential service and are not good at connecting to anything other than the two joined lines. (Singapore built a separate circumferential, the Circle Line.) Arguably, the RER C falls into this category too, except the connection between the lines is too inner.
Reason 3: a half-formed circumferential
Hong Kong’s Kwun Tung Line is circumferential in the sense that it doesn’t serve Hong Kong Island, just Kowloon; partially because of water, it is C-shaped. New York’s G route used to be in this category back when it ran to Forest Hills, but in 2001 it was truncated to Court Square and became linear. Other lines in this category are hypothetical: if Paris’s Metro 2 and 6 count as C-shaped, then they fall into this category; Boston’s busiest bus, Line 66, is vaguely C-shaped, acting as a circumferential in the southwestern arc from Harvard to Dudley; and if New York builds Triboro RX then it will fall into this category, too. In this case, usually another reason, or a pure ridership concern, is what prevents completing the line as a full circle, but the line is configured to be useful for interchanges. The Kwun Tung Line is useful for end-to-end trips, but the other hypothetical cases aren’t: Triboro RX would be useful for short trips, but to get from the Bronx to southern Brooklyn, the D is much faster.
Reason 4: administrative boundaries
In regions without much intergovernmental cooperation, administrative boundaries can be as sharp as coastlines. Everything proceeds as in reason #1, but this time the inefficiency is entirely preventable. This specifically affects New York and SEPTA Regional Rail. Morally, New York’s north-south lines should connect the Bronx with Brooklyn and the east-west lines should connect Queens with New Jersey. But because New Jersey is administratively separate, the Queens lines loop back into Brooklyn, creating some awkward shapes on the F, the R, and especially the M both before and after its recent combination with the V. (Some Bronx-Brooklyn lines are also awkwardly shaped, but this is because of water). Likewise, SEPTA Regional Rail barely goes into New Jersey, and only in Trenton; PATCO, serving Camden, is separate, and as a result, while the system had the R# designations, the R5 and R6 were C-shaped and the R7 and R8 self-intersected, helping ensure there was not much suburb-to-suburb ridership.
Reason 5: aberrations
In some cases, such as the Marunouchi Line or Singapore’s self-intersecting Downtown Line, there’s no apparent reason, and in that case the two branches combine to form a C-shaped line for essentially random reasons. Maybe the ideal route through city center is one that connects two branches in the same direction; maybe there is more demand to one direction than to the other.
Of the above five reasons, it is reason 4 that is the most angering. Jersey City and the hill cities to its north have as long a history of ferry-oriented New York suburbanization as Brooklyn. But because of administrative reasons, they never got as much rapid transit, stunting their development. New York’s subway plans never really made any use of the Hudson Tubes, and even the unrealized plans for a North Jersey subway network made surprisingly little use of existing infrastructure. The result: 12 km out of Manhattan, at the same distance as Flushing, New Jersey only has Bogota, Rutherford, and Hackensack; 20 km out, at the same distance as still fairly dense Cambria Heights, New Jersey has Paramus and Montclair.
It’s of course too late for New York to do things right, but for a city just beginning to build a subway network, it’s important to make sure that lines are straight and hit developing suburbs in all directions, so that they can develop as high-density transit-oriented communities, and not as low-density auto-oriented ones.
Asymmetric Mode Choice
In most models I have seen, ridership and mode choice are assumed to be symmetric: if I take the bus to work, I will also take it back home. Of course those models distinguish home from work: if a bus is full inbound in the morning it’s not expected to be full outbound in the morning. But the assumptions are that if the bus is full inbound in the morning, it should be full outbound in the afternoon. To a first-order approximation this is fine, but there are multiple situations in which people can choose differently in each direction. This is less relevant when discussing cars and bikes, because if you use them in one direction you must use them in the other, but it’s relevant to car-share, bike-share, various kinds of buses and trains, walking, and flying.
Most of this post will take the form of anecdotes. I have not seen any model that accounts for these cases, or any discussion elsewhere. The only exception is when large changes in grade are involved: people walk or bike down more easily than up, and this means that in bikeshare systems, the operators sometimes have to tow bikes back to high-elevation neighborhoods because people persistently take them downhill more than uphill. However, in addition to asymmetry caused by physical geography, there’s asymmetry caused by urban layout and transit system layout, as well as asymmetry caused by different characteristics of trips.
Case 1: Frequency Splitting
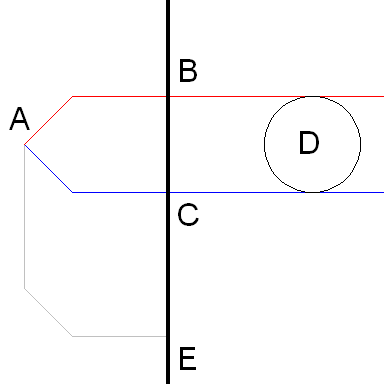
Consider the above image of a transit network. Point A is a major destination; area D is a neighborhood, and point E is an origin. The thick black line is a rapid transit line, passing through and stopping at B, C, and E. The red and blue lines going east from A are frequent rapid bus lines. The gray line going from A to E is a lower-grade bus line: less frequent, and/or slower.
In this image, traveling between A and either D or E, the frequent buses will be more useful going away from A than toward A. For an A-D trip, if I live in neighborhood D and travel to A, then I need to choose which of the two parallel streets to stand on, whereas going back from A to D, I can stand at the bus terminal and take whichever bus comes first. For an A-E trip, if I live at E and am going to A, then again I need to choose which of the two bus lines to use, that is whether to get off the rapid transit line at B or C, whereas going back this is not an issue. On the margin, I might choose to take the lower-grade but direct bus from E to A but not back.
Neither of the situations is hypothetical. When I went to college at NUS, my situation was similar to the A-E case: while the subway has since reached campus, in the mid-2000s the campus was connected by buses to two separate subway stops, Clementi and Buona Vista, and although some parts were definitely closer to one than to the other, the connecting buses served all parts of campus relevant to me. There was no equivalent of the gray bus, and I’d almost always take a taxi to campus, but usually take transit back. Now that I’m in Vancouver and work at UBC, where bus lines converge from parallel east-west streets, my situation is similar to the A-D case, since I can take Broadway buses as well as 4th Avenue buses; there is no alternative to the buses for me, but if there were, for example bikeshare, or walking if I lived closer to campus, I might well use it.
In those examples the asymmetry is for the most part unavoidable, coming from urban layout. In Vancouver, there are multiple east-west streets on the West Side that deserve frequent bus service. Consolidating everything on one street can come from the opening of a Broadway subway to UBC, but because the asymmetry is a second-order effect, the main argument for the subway has little to do with it.
Case 2: Waiting Facilities
Some bus and train stations are notorious for being unpleasant to wait at. Tel Aviv’s Central Bus Station is dark and labyrinthine. In New York, Penn Station and Port Authority are both unpopular. Many older airports are infamous for their poor amenities and confusing layouts. Because people need to wait going outbound but not inbound, this could affect mode choice.
In Vancouver, UBC has two separate bus loops, one for generally express diesel buses, and one for local electric buses; each loop has buses going on multiple streets, as in the above image. I find the diesel loop noisy and disorienting, and therefore avoid it, waiting at the electric loop or the next stop after the loops. Therefore, I usually take electric buses back home from UBC, while I almost always take diesels toward UBC. I have no direct experience with Kennedy Plaza, but other Providence-based bloggers think little of it; I think it was Jef Nickerson who noted that buses going on the same trunk routes are not co-located there. This could induce a similar asymmetry.
It gets worse when bus stops do not have shelter from the elements. Sheltered stops should be included in any bundle of best industry practices, but when they are present only downtown or at major stations, they can bias me to take the bus in just one direction.
Transit agencies can eliminate this asymmetry by making their facilities better. Usually the cost of shelter, clear signage, a bus bay layout that makes identifying the correct bays easy, and similar improvements is negligible, and the benefits are large. Of course, independently of any asymmetry there is no excuse for not having passable facilities, but in some cases, such as the UBC diesel loop, the situation on the ground is worse than it appears on planning maps and this worsens the passengers’ experience.
Case 3: Stress for Time
For some trips – going to an airport or intercity train or bus station, going to a meeting, going to class, going to a workplace where I need to be there at a specific time – there’s a more pressing need for timeliness in one direction than in the other. This biases in favor of more punctual or faster vehicles, even if they’re more expensive or less pleasant. This manifests itself in airport choice (when flying out of New York, I strongly prefer rail-accessible JFK, while my preference for flying in is much weaker), willingness to transfer to save a few minutes of trip time, willingness to ride a more expensive but faster train (for example, the LIRR versus the E), and bus versus train decisions (trains are almost invariably more reliable, often by a large margin). The few times I used transit to get to NUS, I used the subway, whereas when I went back home I’d often use a trunk bus, which was slower but had a station much closer to where I lived.
In this case, there’s not much the transit agency can do. If the bus versus rail issue is persistent, the best thing that can be done is encourage more mixed-use zoning and more symmetric morning travel demand, so that buses would be used in both peaks and not just in the afternoon peak and vice versa for trains.
Case 4: One-Way Routes
To the extent that the transit activist community has an opinion, it is strongly against one-way pairs, going back at least to Jane Jacobs’ criticism in The Death and Life. I’ve written briefly about them; Jarrett has written more extensively. One more issue is that if a bus route runs one-way on different streets (as a consistent one-way pair as in New York, or in a more complex arrangement as in Tel Aviv and Singapore) and I live closer to one direction than to the other, I might take it in just one direction. In Tel Aviv it was not a major problem because the bus I took to middle school run two-way in the segment relevant to me, but in Singapore it was an issue in both middle school and college: I lived next to a very wide one-way street without nearby crosswalks, and getting to the other direction of the buses required crossing it and walking some extra distance; this helped bias me for taking the bus only in the return direction.
The Effects on the Margins
Since asymmetry is small enough an effect that models can ignore it and still come very close to predicting actual ridership, its effect on transit planning is only on decisions that are very close to begin with.
I believe the most common case is the one in the image. A city that transitions from an idiosyncratic network of infrequent direct buses to a regular frequent grid where passengers are expected to transfer needs to decide which of the infrequent buses to keep. It might even have a few peak-only express buses it is considering keeping. In this case, it’s useful to note in which directions the infrequent or peak-only buses are more likely to get passengers, and potentially have an asymmetric number of trips on those in each direction, recycling the equipment for nearby routes whose asymmetry goes in the other direction.
Construction Costs and Perceptions
While looking for South Korean cost data for a major update of my construction costs posts, I stumbled upon a newspaper article excoriating Seoul’s extravagant construction, comparing it unfavorably with the US. Per Joong-Ang, the US neglect of infrastructure is a form of frugality that South Korea should imitate; the National Mall’s poorly maintained, weedy lawns are treated as something to admire. Moreover, Seoul subway construction is more extravagant than in the Washington Metro:
I got on a train at the Smithsonian Metro station. All the stations there have the same architectural styles. They are the 1976 creation of American architect Harry Weese. High ceilings and open spaces are their trademarks. They are known for their practicality. But they are very modest compared to the subway stations of Seoul. The platforms are dimly lighted. It’s hard to read a book there. The walls are concrete, with none of Korea’s flashing signboards. The architecture is very quiet.
After I returned to Seoul, I got on the subway at Guryong Station in Gangnam District, southern Seoul. Marble proliferates at the entrance. A public table is covered with glass. Every day, about 3,600 people use the station, which cost 55 billion won ($51.2 million) to build.
Of course, in reality, Korean construction costs are a fraction of American ones. Guryong Station is an infill subway station in a dense urban neighborhood, opening about a year after the rest of the Bundang Line; it cost about $75 million in 2010 PPP dollars. The US sometimes builds at-grade infill commuter stations for more than that, and those do not have marble entrances or glass tables (update: New York Avenue in Washington is another example of more expensive US infill, this time an elevated station). Building just the shell of an infill subway station on the 7 extension simultaneously with the rest of the extension was estimated at $500 million. Similarly, the Sin-Bundang Line, a driverless rapid transit line, cost 1,169 billion won, about $1.4 billion, for about 18 km; the line is described as “largely underground,” fully underground, and its city terminus is under a dense secondary CBD. In contrast, in Washington, the suburban Silver Line, with very little tunneling, is $6.8 billion (in 2009-2018 dollars) for 37 km. $183 million per km versus about $80.
There are two takeaway lessons from this. The first is that to gauge whether something is cheap or extravagant we need to know the normal range of costs and compare, rather than looking at the quality of construction. Seoul may build very extravagant-looking stations, but it builds them cheaply for some reason.
The second, more important lesson is that people perceive costs the way they perceive local corruption. The US is indeed the world’s most expensive country to build transit in, which Americans can easily believe since they do not trust their government very much. At the opposite corner, Switzerland is quite cheap: a rejected mountain tunneling project in Neuchatel was CHF 850 million for 17 km, and a recently completed urban tunnel in Lucern was CHF 250 million for 1.32 km; accounting for the Swiss franc’s 87% overvaluation relative to PPP, these are $28 and $121 million per km respectively. And as far as I hear from Swiss commenters, the Swiss are proud of the success of their public transportation system. Indeed, Swiss levels of trust in government and institutions are very high.
In contrast, in cheap countries where people do not trust the government, people do not readily accept that construction costs are low. When I talk to Spaniards who are not railfans, they talk about corrupt and extravagant infrastructure projects, and do not believe that both high-speed rail and subway construction costs in Spain are so low. (It doesn’t help that Barcelona’s L9/10, despite still being about average-cost, went over budget by a factor of over 3.) This is no different from the Joong-Ang attitude toward Korean costs: the government self-evidently doesn’t work, and so a $75 million infill subway station is self-evidently a boondoggle.
The situation in the opposite corner – high trust/low perceptions of corruption, high costs – exists as well, in Singapore. The sixth MRT line, soon to begin construction, is S$18 billion for 30 km; the PPP exchange rate between Singapore and US dollars is about 1:1. The line is automated and fully underground, but about half of it is under very wide arterial roads and portions of it are in undeveloped rather than built-up land; it shouldn’t cost this much. The fifth line, currently under construction, is cheaper, S$12 billion for 40-42 km, but still much more expensive than the non-Anglophone average.
And yet, although Singapore’s not far behind Japan in its construction costs, I doubt Singaporeans are as willing to consider their construction practices expensive as Americans, Britons, and Japanese are. I know for a fact that international commentators who hold Singapore in high regard for its efficient government would not be willing to think of it as an expensive-construction country.
All this makes good transit activism somewhat frustrating, in that people will not usually recognize efficient government in absolute numbers. Percentages, certainly – people understand cost overruns and (much less common) cost underruns, and as we’ve seen in Canada people can compare different technologies. But absolute numbers are not as well-understood, and neither are international comparisons of the same technology, where cost differences revolve around questions of project management, contracting practices, labor rules, and details of geology and surrounding infrastructure; people have only recently begun to think in terms of per-km costs in New York, and in the rest of the US I have not seen such thinking. When a transit agency proposes a project, people automatically think it’s expensive, and some will also say it’s necessary, regardless of whether it actually is either. I don’t think reactions to Second Avenue Subway at $5 billion would be materially different from what they were when Phase 1 alone grew to $5 billion.
The upside is that in budget negotiations, the amounts given to transportation are based on absolute shares of the budget rather than on the needs of specific megaprojects, which means that lower costs would translate to more projects built for the same budget. People might not notice that costs have gone down, and might still complain that every subway line is a boondoggle, but more lines would be built and more people would ride those lines. Just the perception of government competence would not change.
Branching
S-Bahns and similar systems have two defining features. One has been hashed to death on this blog: they reuse legacy rail lines, allowing urban rapid transit to extend arbitrarily deep into suburbia. The other, common also to many other transit technologies, is that they branch extensively, allowing them to run many services on the outer ends, where there’s no demand for rapid transit frequency, while interlining to produce high frequency in the center, where there is.
Since branching is a service planning decision independent of technology, any technology could branch. The branching-friendliest technology is subway-surface: the central subway segment has higher capacity measured in trains per hour than the outer surface segments, and this requires branching. For examples, consider the Boston Green Line, Muni Metro, the Frankfurt U-Bahn, and SEPTA’s Subway-Surface lines. However, even when the entire line is rapid transit, branching is useful to ensure higher service where there is higher demand, and infrastructure improvements will typically focus on boosting capacity in the center. For example, the RER A has moving-block signaling allowing 30 peak-direction trains per hour in the center, but fixed-block signaling on the branches, which do not need such capacity.
Even when rapid transit is built separate from both light rail and mainline rail, branching is useful for lines going into the suburbs or even outer-urban neighborhoods. This is practiced in both New York and London, both of which have extensive branching. Observe further that in both cities, the lines reaching farthest out – the A in the Queens-bound direction and the Metropolitan line in the west – are also the most highly branched.
It’s the opposite situation that is weird. When lines do not branch, there must be a strong outer anchor, or else trains need to run empty outside the center. The alternative is short-turns, and if there’s no space for this, the resulting service patterns can be awkward. Shanghai, which has little branching, runs Line 2 in two segments, a central segment with higher frequency and longer trains and an eastern one with lower frequency and shorter trains; trains do not run through. Beijing has a similar awkwardness with the split between Line 1 and the Batong Line, and Toronto has a split between the Bloor-Danforth line and the technologically incompatible Scarborough rapid transit. (The Sheppard line suffers from the same problem today, but it has the excuse that it was planned to continue west to the Spadina subway rather than stub-ending at Yonge.) Paris has little branching on the Métro as well, but the Metro only serves inner parts of the metro area, many lines have strong outer anchors (for example, La Défense on Line 1), and two others providing some of the farthest-out service branch. The RER branches much more heavily, as befits a suburban system. Tokyo has little branching on the subway proper, but the subway is for the most part inner-urban, and lines continue to the suburbs along commuter lines, which do branch.
In North America, this configuration has been common across a variety of new-build systems, especially ones that should have been S-Bahns. BART does this the most extensively, but the Washington Metro is also highly branched for its size, MARTA branches, the light rail systems branch once more than one line is built, and so on. BART in particular imitated the service planning aspect of commuter rail perfectly, and is an S-Bahn in all but the cost of extending the system further.
The problem with any branching is that it reduces frequency on the branches, potentially scaring away ridership. When a single rapid transit line splits in two it’s rarely a problem, and when city-center service splits into suburban services even more is easy to justify. I think the main issue in urban or inner-suburban cases is that with typical rapid transit frequencies (3-minute peak service or slightly better, a peak-to-base ratio of 2:1 or somewhat less) the trunk has about 5-minute off-peak service, and if it splits into two branches, this means 10-minute service on the branches. If the branching occurs early enough that dense neighborhoods with short-distance travel demand are on branches, it may be too little. In addition, if one branch has much more demand than the other, then it’s usually hard to match frequency on each branch to demand, since it requires trains to be unevenly spaced.
The issue is that branch frequency, 10-15 minutes, is in the transition zone between urban show-up-and-go frequency, where schedules do not matter, and suburban frequency, where they do. It’s perhaps less relevant in small cities with small enough transit systems that even 10-minute service is considered very good, but in large cities, people expect more, creating somewhat of an inner-urban metro envy effect.
That said, 10-minute suburban and outer-urban service can be done clockface, making the average wait much smaller. It is done on the RER A in the midday off-peak, with three 10-minute branches, and could be done with two 10-minute branches quite easily. Likewise, it could be done for 15-minute branches (the RER B already does this); the two A branches in New York have close to 15-minute frequency each, and if New York City Transit’s service planning considered it as a factor instead of focusing more on headway management it could ensure predictable schedules at Ozone Park and the Rockaways.
Transit and Place
There is a large class of transit supporters who think that every right-of-way that can be used for transit should be preserved for this purpose, even if it is not very useful. A few overzealous railfans on the message boards opposed the opening of the High Line park and wanted the viaducts to be used for an extension of the 7 train. This is extreme and nowadays the transit activists I know support the High Line while opposing schemes to recreate it in an inferior context. But even serious bloggers like Cap’n Transit, Ben Kabak, and John Morris are opposing plans to create a Low Line out of the abandoned trolley terminal at the Essex/Delancey subway stop, on the grounds that it could be useful for transit one day.
Now, it’s possible that the Low Line idea is bad because people would not want to go to an underground park. But it’s not a problem for transit; the Williamsburg Bridge doesn’t need trolleys since it has a subway running on (and because the bridge is high there is no way a bus could cross it without passing within two blocks of Marcy, the subway stop at the Brooklyn end of the bridge). The lines running on it are in fact underused: as can be seen on PDF-pages 65-73 of the latest Hub Bound Travel Data report, peak-hour traffic on the J/M/Z entering the Manhattan core was one of the lower in the system as of 2010 – higher than the bottom two track pairs (8th Avenue local and Montague) but in a near-tie for third lowest with several others. So there’s not much use for the trolley terminal as a modern Williamsburg Bridge bus (or trolley) terminal.
But what is more important than just the Low Line is place. To succeed, transit needs not only to exist, which it already does in the area in question, but also to have places to connect to. If for some reason the trolley terminal would need to be demolished to build room for foundations for several skyscrapers, it would be an unambiguous win for transit, since it would create more destinations for people to take the existing J/M/Z and F trains to. The surrounding neighborhood might disagree regarding the implications for urbanism, though I’d argue that Midtown-like skyscrapers would be better-integrated into the streetscape than the projects east and south of the station. If the Low Line succeeds as a park, it will be similar: not in the sense of providing jobs for tens of thousands of people, but in the sense of creating a place for people to go to. (In fact, a park has less peaky demand than offices, so it could be better for subway finances even at relatively low levels of usage.)
Last year, I brought up the question of the infrastructure’s highest value mainly as a way of deciding which kind of service (regional, intercity, etc.) should get first priority on any given rail line, but the same is true about transit versus place. In an area with enough transit and not enough place, it’s more important to create more development, for both good urbanism and more successful transit.
This does not mean every proposal to turn a rail right-of-way into a park is good. Despite my skepticism that the Rockaway Cutoff can be a successful rail line, I’m even more skeptical about its value as a park; it’s not in an area that can ever draw many people, since the density (of both residences and jobs) is not high by New York standards and it is far from other destinations that could draw people from outside the nearby neighborhoods. However, in areas that are lacking in good parks, or could use new development, it is better to concentrate on creating place.
For examples of this elsewhere, consider the railyards in Long Island City, Hoboken, and Sunnyside. Two of my earliest posts proposed to build a regional rail station in Sunnyside and then develop the area around it with air rights over the railyard; this is what should be done in an area that needs both transit and place. But in Hoboken and Long Island City, there’s ample transit, and the only use of the railyards is to park trains that can’t do to Manhattan because of lack of electrification or lack of capacity in the approach tunnels. Since parking trains is an inefficient use of space, and both areas have good connections to Manhattan by subway or PATH, there should be plans to remove the railyards and redevelop them to create more place, leaving just enough rail infrastructure to run through-trains, to be parked in lower-value areas. This development can be either parkland or buildings, depending on what is in demand in the area. Based purely on Google Earth tourism, I believe Hoboken does not need additional parks and so development there should be just a new secondary CBD on top of the PATH station, while Sunnyside and Long Island do, and so development there should include parks as well as high-density office and residential construction.
Instead of worrying about turning unused and for the most part unusable transit infrastructure into place, good transit activists should focus on preserving infrastructure that could potentially be used. In the New York area, probably the most useful piece of infrastructure that isn’t currently used is the Bergen Arches, allowing the Erie lines to enter Jersey City at Pavonia/Newport, a more central location than Hoboken; this is one of four options for a location for a new regional rail tunnel from New Jersey to Lower Manhattan, and is arguably the best option for an integrated regional rail network.
In the 1990s there were plans to reuse the Bergen Arches for a roadway, since modified to include both a road option and a rail option, and in 2011 the Christie administration allocated some money to further studies; an analysis from 2004 scored various road and transit options, not including a regional rail network, and gave the highest score to a roadway with a single high-occupancy vehicle and bus lane per direction. (A trail got the second lowest score, after no-build.) Since Jersey City (and the entire region) needs more transit from the north and west, while further formation of place will and should cluster around the waterfront, it’s important to fight any plan to give the Bergen Arches to a non-railroad use unless and until a regional rail plan is formulated that places the New Jersy-Lower Manhattan tunnel at another location.
In contrast, the Low Line should not be a priority. On the contrary, if the park plan is even partially sound, or the place could be reused as another place if the park idea fails, then good transit advocates should support the idea, since it’d be good urbanism. With a few exceptions, good transit requires good urbanism and vice versa.
Intercity Buses and Trains
In the three countries with the longest and traditionally largest HSR networks – Japan, Germany, and France – there is no large intercity bus network, with government regulations against the development of one. The US and Canada are in somewhat of the opposite situation – intercity buses are legal, but intercity trains are subject to a variety of regulations and operating practices raising operating costs so much that outside the thickest corridors they might as well be illegal. The best situation is in South Korea, which has well-developed networks of both buses and trains; the result is that on the Seoul-Daegu and Seoul-Busan city pairs, buses have 7-8% of the market and trains 67%.
On top of that, the express buses in North America do not get very high mode share. I’ve seen no reliable numbers, but when I looked at Megabus and Bolt schedules on the largest city pairs, the two carriers combined were about even with Amtrak, whose mode share on the entire NEC is 6% according to the Vision.
So why is Cap’n Transit suddenly telling us to love the bus (though he rejects the loaded term “love the bus”) and advocate for more investment into bus stations at various locations around the metro area? Doctrinaire libertarians have the excuse that the kind of regulations they are used to thinking of are the French regulations against domestic competition with rail and not the FRA’s safety rules. But the Cap’n of course knows exactly how pernicious FRA rules are. Since he thinks in terms of activist energy as the primary resource to manage, and not the government’s budget, this could be taken as a desperation at any attempt to reform Amtrak and the FRA.
But more likely, this comes from the fact that many intercity bus supporters fought (and lost) regulations against curbside pickups, which are the way Megabus, Bolt, and others could serve New York without paying for space at Port Authority, imitating the practices of the older Chinatown buses.
The immediate trigger for thinking where to place bus stops then is the impending loss of curbside space. Since buses are in many ways intermediate between cars and trains in terms of capacity and the point-to-point versus hub-and-spoke tradeoff, a bus expansion then has to mean finding more and more places to pick up. A legacy train station will run out of running line capacity long before it runs out of station track capacity, but a curbside bus stop uses valuable urban space and a bus station can and does run out of space.
And this is where buses stop being too useful. Frequency is freedom. Because the bus operators compete with one another, passengers need to be ticketed on a specific company, and that already cuts into frequency. On top of that, unlike trains, buses have a very large stop penalty, since they need to get off the highway and into the city. New York-Washington trains make intermediate stops in Philadelphia; express buses don’t. Even with dominant CBD stations, the frequency on the buses in the Northeast isn’t great: from New York, Bolt offers half-hourly service from to Philadelphia, hourly service to Boston, and less than hourly service to each of Baltimore and Washington, and all four city pairs have one dominant stop pair; Megabus frequency is hourly to Boston and hourly with a half-hourly peak to the other three.
Adding more stops means diluting this less-than-great frequency even further. It would work if bus stops were consolidated and people could buy one ticket good on any company, but the business model that has reduced ticket prices is probably not compatible with such cooperation. It would also work if the market share were 67%, but it isn’t and never will be.
The other problem is that people have not just origins but also destinations – and those destinations cluster in the CBDs, and the more the passenger is willing to pay, the likelier it is they’ll be traveling to the CBD. A train run from Woodside or Newark to New York will be full in one direction and empty in the other; the reason those trains can make money (they don’t in New York, but do in Tokyo, which is as CBD-dominant) is that they’re so full in the peak direction it makes up for lower reverse-peak occupancy. For intercity travel, this is harder. High-speed rail can make a profit on these asymmetric intercity runs because it’s so fast that it can cut costs that depend on travel time and not distance, such as operator wages, dispatcher wages, and some train maintenance. Buses don’t have that luxury, and need to be full in both directions, which favors CBD-to-CBD runs, or runs between neighborhoods that are likely to be destinations as well as origins (such as Chinatown-to-Chinatown runs).
Trains are unique among common-carrier transportation modes in that service uses corridors and not points. They are similar to cars this way: I-95 and the Northeast Corridor serve many overlapping city pairs. Bus services do not have this advantage, because the nature of an expressway network is such that they have to deviate to make a station stop, and in the largest cities this deviation is considerable; it can take an hour for a bus to navigate New York’s streets. This makes them more point-to-point, like planes, and on a corridor with four large cities on one line, this is much less efficient.
In general, I think a lot of the pro-bus attitude among liberals and general transit activists (as opposed to libertarians, who I will address in a future post) amounts to defeatism. We will never be able to improve government to the point that trains have high mode share, so let’s downgrade service. We will never be like France or Germany or Switzerland or Japan, so let’s import practices from China and Scotland.
Transit activists for the most part have not only political but also personal preferences for travel by transit. When I visited Buffalo, I took the Empire Service instead of flying. This creates a skewed impression for what’s good; to me, the Empire Service is a semi-useful service, even as to the average traveler it might as well not be there. If the existing service is straightforwardly a worse version of good service – such as a commuter train that should run faster and more frequently, or an intercity train that should be HSR – this is not a problem. But if it is different – such as a bus where a train is more appropriate, a light rail or dedicated subway line where an S-Bahn is appropriate, or even a rapid transit line in the wrong type of neighborhood – then the activism can be in a wrong direction.
The problem is that the 80-90% of travelers who drive are not currently agitating for the mode of transit most likely to get them to switch. Like transit users, they have at least to some extent made their peace with their current mode’s deficiency, and if anything they will demand more highway expansions even on corridors where transit is much more useful for the same cost. But we can take a step back and look at case studies from peer first-world countries and see that buses have mode shares in the single digits while trains can dominate corridors in the Northeast Corridor distance range.
Relative Costs of Transit Construction
The relative costs of different technologies of transit are not fixed. Although there are some rules of thumb for the ratio of tunneling cost to above-ground transit cost, the actual ratio depends on the city and project, and this would favor the mode that’s relatively cheaper. Likewise, the ratio of operating to capital costs is not always fixed, and of course long-term real interest rates vary between countries, and this could again favor some modes: more expensive construction and cheaper operations favor buses, the opposite situations favor rail.
In general, els cost 2-2.5 times as much as at-grade light rail, subways 4-6 times as much, according to Table 6 in this Flyvbjerg paper; Table 5, sourced to a different previous paper, estimates per-km costs, and has ratios of 1.8 and 4.5 respectively.
However, specifically in Vancouver, the premiums of elevated and underground construction appear much lower. The cost estimates for rail transit to UBC are $2.9 billion for an almost entirely underground extension of SkyTrain and $1.1 billion for at-grade light rail along Broadway, both about 12 km. Elevated construction is in the middle, though closer to the light rail end: the estimates for the two all-elevated SkyTrain extension alternatives into Surrey are $900 million for 6 km for rapid transit alternative 3 and $1.95 billion for 15.5 km for alternative 1. The under-construction Evergreen Line, which is 11 km long of which about 2 are in tunnel, is $1.4 billion.
In the rest of Canada, this seems to be true as well, though the evidence is more equivocal since the projects that are considered above-ground are often elevated rather than at-grade. The Canadian above-ground projects that Rob Ford’s Eglinton subway is compared with are not wholly above ground. Calgary’s West LRT, which with the latest cost overrun is $1.4 billion (a multiple of the preexisting three-line system) for 8 km, includes a 1.5 km tunnel, a short trench, and some elevated segments. Edmonton’s North LRT is $750 million for 3.3 km, of which about 1 km is in tunnel and the rest at-grade. But while it’s hard to find the exact ratio because of those mixed projects, the costs are not consistent with the ratios found in Flyvbjerg’s sources.
Outside Canada, those ratios seem to hold up better. American above-ground transit projects, such as the Portland Milwaukie extension and the Washington Silver Line, are as expensive as Calgary and Edmonton’s light rail, but American subways are much more expensive than Toronto’s Eglinton subway ($325 million/km, 77% underground and the rest elevated): Manhattan tunneling is more difficult, so its $1.3-1.7 billion/km cost may not be representative, but conversely, BART to San Jose’s $4 billion for about 8 km of tunnel is for tunneling partially under a wide railroad right-of-way, with no crossings of older subway infrastructure as is the case for Eglinton at Yonge.
Conversely, French tunneling costs are comparable to or lower than Canadian ones, but at-grade light rail is far less expensive than in North America. The RER E extension was at least as of 2009 budgeted at €1.58-2.18 billion for 8 km of tunnel (see PDF-page 79 here; this excludes €620 million in improvements to the existing commuter lines the tunnel will be linked with) – somewhere between the per-km costs of Vancouver and Toronto subways, but in a much denser environment with more infrastructure to cross. But the cost range for Parisian trams is much lower, about €30-50 million per km, in line with the subway:tram cost ratio of 4-6; the cost range in other French cities tends to be a little lower.
What this means is that in Canada in general, and in Vancouver in particular, questions about what mode to build should have higher-end answers than elsewhere. It doesn’t mean that the Eglinton subway is justified, but it does bias suburban rail lines in Vancouver toward elevated SkyTrain extensions rather than light rail, and inner extensions toward SkyTrain subways. For the same cost of building a subway under Broadway, Translink couldn’t build too much additional light rail; it could build two lines, say on Broadway and 41st, or maybe three if both non-Broadway routes are short, but certainly nothing like the entire network that SkyTrain opponents believe is the alternative, citing European tramway construction costs.
Nobody Likes Riding North American Commuter Rail
In New York, two neighborhoods at the edge of the city have both subway and commuter rail service: Wakefield and Far Rockaway. Wakefield has 392 inbound weekday Metro-North boardings, and 4,955 weekday subway boardings. Far Rockaway has 158 riders (an average of boardings and alightings) and 4,750 subway boardings. Although both Wakefield and Far Rockaway are served by the 2 and A, which run express in Manhattan, those trains make many local stops farther out – in fact the 2 and A are the top two routes in New York for total number of stations – and are much slower than commuter rail: the 2 takes 50 minutes to get to Times Square while Metro-North gets to Grand Central within 25-30 minutes; the A takes about 1:05 to get to Penn Station, the LIRR about 55 minutes.
Vancouver, whose commuter rail service runs 5 daily roundtrips, all peak-hour, peak-direction, has a weekday ridership of 10,500. The Evergreen Line, duplicating the inner parts of the commuter rail service, is expected to get 70,000.
Caltrain, a service of intermediate quality between Vancouver’s peak-only trains and New York’s semi-frequent off-peak electrified service, has an intermodal station at Millbrae, which is now BART’s southern terminal. Millbrae has 5,970 BART exits per weekday versus 2,880 Caltrain boardings. And BART takes a circuitous route around the San Bruno Mountain and only serves San Francisco and the East Bay, while Caltrain takes a direct route to just outside the San Francisco CBD and serves Silicon Valley in the other direction.
The MBTA provides both subway and commuter rail service, with several intermodal stations: Forest Hills, Quincy Center, Braintree, Porter Square, Malden, JFK-UMass. In all cases, ridership levels on the subway are at least 30 times as high as on commuter rail. Rapid transit and commuter rail stations are close together at the edge of the Green Line’s D line, a former commuter line; the line’s outer terminus, Riverside, gets 2,192 weekday boardings, while the nearest commuter rail station, Auburndale, gets 301.
Across those systems and several more, such as Chicago’s Metra and Toronto’s GO Transit (no link, it’s private data), the commuter rail stations located within city limits, even ones not directly adjacent to a rapid transit station, usually get little ridership (there are some exceptions, such as Ravenswood on Chicago’s UP-N Line). The suburban stations beyond reasonable urban transit commute range are much busier.
Of course, this is just a North American problem. In Japan, where commuter rail and urban rapid transit are seamlessly integrated, people ride commuter rail even when the subway is an option. Consult this table of ridership by line and station for JR East lines in Tokyo: not only would any investigation of ridership on the main lines (e.g. Tokaido on PDF-page 1, Chuo on PDF-page 8) show that their ridership distribution is much more inner-heavy than in New York and Boston, but also stations with transfers to the subway can have quite a lot of riders. Nakano on the Chuo Line, at the end of Tokyo Metro’s Tozai Line, has 247,934 daily boardings and alightings, comparable to its subway traffic of 133,919 boardings.
Although my various posts about commuter rail industry practices focus partially on operating costs, this is not directly what makes people choose a slower subway over a faster commuter train. Rather, it’s a combination of the following problems:
1. Poor service to microdestinations. Rapid transit gets you anywhere; North American commuter rail gets you to the CBD. For people in Wakefield who are going anywhere but the immediate Grand Central or East 125th Street area, Metro-North is not an option. Station spacing is too wide, which means the choice of destinations even from a station that isn’t closed is more limited, and trains usually make just one CBD stop.
2. Poor transfers to other lines. The transfers usually require paying an extra fare and walking long distances from one set of platforms to another.
3. High fares. In the German-speaking world, and in Paris proper, fares are mode-neutral. It costs the same to ride the RER as the Metro, except for a handful of recent Metro extensions to the suburbs that postdate the RER, such as to La Defense. In Japan, JR East fares are comparable to subway fares, though there are no free transfers. In North America this is usually not the case: it costs much more to ride commuter rail than to ride a parallel subway or light rail line.
4. Low frequency. This is partly a result of low ridership based on the previous factors, partly a tradition that was never reformed, and partly a matter of very high operating costs. With low enough off-peak frequency (Wakefield and Far Rockaway are served hourly midday), commuter rail can achieve cost recovery similar to that of subways, and in some cities even surpass it. People who have no other options will ride hourly trains.
None of those problems is endemic to mainline rail. They’re endemic to North American mainline rail culture, and in some cases to labor practices. It’s all organization – it’s not a problem of either electronics or concrete, which means that the cost to the taxpayers of fixing it, as opposed to the political cost to the manager who tries to change the culture, is low.
The electronics and concrete do matter when it comes to building extensions – and this is where the ARC Alt G vs. Alt P debate comes from, among many others – but even commuter rail systems that do not need such extensions underperform. For example, Toronto does not need a single meter of commuter rail tunnel. Philadelphia, which already got most of the concrete it needs and partially fixed the microdestination problem, gets somewhat more commuter rail ridership in areas where people have alternatives, but frequency on the branches is still pitiful and inner-city stop spacing outside Center City is still too wide, leading to disappointing ridership.
Another way to think about it is that infrastructure should be used for everything, and not segregated into local transit and railroad super-highways that aren’t very accessible to locals. There are eight tracks connecting Manhattan directly with Jamaica, but the four used by the subway are far busier than the four used almost exclusively by suburbanites. Something similar is true of the Metro-North trunk, and some MBTA and Metra lines – the commuter rail infrastructure is redundant with rapid transit and gives very high nominal capacity, but in reality much of it is wasted. In this way, the mainline rapid transit concept including the Paris RER, the Germanic S-Bahn, and the Japanese commuter rail network, far outperforms, because it mixes local and regional traffic, creating service that everyone can use.
Sanity Checks on HSR Ridership
If you multiply the populations of the metro areas served as a proxy for HSR ridership, then by comparison to Shinkansen lines as well as the AVE, New York-Washington traffic should be about 15-20 million passengers per year. It’s even higher if we include Madrid-Seville, an overperformer with more ridership than Madrid-Barcelona. This is just between the two metro areas, excluding additional passengers to Philadelphia. This raises two questions: what does the data suggest about modifying product-of-populations as a proxy, perhaps to account for distance? And, more importantly, is such ridership realistic for the Northeast Corridor?
First, at least on the Shinkansen and the AVE, in the range of distances up to nearly 4 hours, there’s no effect of distance on ridership, especially if we combine air and rail ridership. (We’re trying to apply this analysis to a city pair on which trains will take not much more than an hour and a half; end-to-end air traffic can be assumed to be zero.) Beyond that, Tokyo-Fukuoka air and rail ridership combined still underperforms shorter-distance links. One explanation is that as distance increases, total travel volume decreases, but rail and then air market share grows at the expense of cars and buses, and in the 1.5-4-hour range, these effects more or less cancel out. At longer distances, there is no longer much highway travel for trains and planes to poach.
With distance ignored, large cities consistently underperform small cities. This is not a surprise based on SNCF’s refined gravity model of ridership, in which travel volume is proportional not to the product of the city populations, but to the product raised to an exponent lower than 1. SNCF uses an empirically derived exponent, between 0.8 and 0.9, and AVE and Shinkansen data is indeed more consistent with that range. Some city pairs still underperform in a way that can’t be explained by population and distance, such as Tokyo-Okayama, but the exponent perfectly explains why Tokyo-Osaka underperforms a model with exponent 1.
So what about the Northeast Corridor? Current Amtrak ridership between New York and Washington is 1.74 million, but that’s just between Penn Station and Union Station. Amtrak provides its top 10 city pairs in the Northeast in its Master Plan, which include New York-Baltimore and New York-BWI, at 650,000 between them. I don’t know the ridership on more minor city pairs, such as those involving Newark or Stamford. I would guess the total including those is about 3-3.5 million; this is based just on extrapolating that of the top-10 markets on the southern half of the line just under half the ridership is between the New York and Washington metro areas, and applying a fudge factor to account for the fact that secondary markets not involving New York-Washington are less likely to make the top 10.
In contrast, based on comparison to the Shinkansen and AVE, we should expect HSR ridership of 15-20 million, about 5 times what I believe the present ridership is. (In fact, based on comparison to the lower-fare KTX, it should be if anything higher.) This is despite the fact that the current trip time is either 2:47 or 3:25 whereas with HSR it would be about 1:35. The importance of this is that we can’t expect induced demand to quintuple ridership out of halving trip time, but instead we need to explain this based on competition with cars and buses.
Part of this competition has to be about fares. Amtrak charges very high fares (see the route performance report) – on average, 28 cents per km on the Regional, and 48 on the Acela. Shinkansen fares average 23 cents per km on Tokaido, 20 on Sanyo, and 24 on the JR East network. That said, the shorter distance of New York-Washington means that absolute fares are not higher, particularly on the cheaper option. However, high fare per km does mean the trip is less competitive with cheap express buses and with driving.
This comes in addition to travel time. The Regional is an hour faster than Megabus; HSR that is three hours faster Megabus, especially if it’s also cheaper than today’s Regional, could make a serious dent in the Megabus network. Express buses already have trouble with secondary markets, because those can’t piggyback on primary markets as intermediate stops the way they can with trains. Better trains could poach the express bus market and reduce it to where it was ten years ago.
At the range of the top-performing city pairs, most people take trains rather than use roads. I do not have data for individual city pairs in Japan (but see here for Korea, where HSR overperforms, perhaps due to lower fares, which are about 15 cents per km before discounts), but at the distance of New York-Washington, 360 km, trains get a little more than half the total mode share and cars get the other half. Amtrak’s 2010 Vision says that the current rail mode share on the entire Northeast Corridor is 6%; it does not say what the share on New York-Washington is, but I’ve seen 14% elsewhere (no reference, sorry), and the Vision says that incremental Master Plan improvements will raise it to 26%. Of course going from 14% to 50% also involves induced demand, and this means the expected rise in ridership is a higher factor, potentially a factor of 5.
I’m not going to try using this method to estimate shorter-distance ridership, because then car ownership, sprawl levels, etc. become a much bigger issue, and quick-and-dirty sanity checks don’t work and are no replacement for serious ridership studies. But we can apply the method to other longer-distance portions of the Northeast Corridor. If we use the lower end of the scale, we get New York-Washington at 15 million annual passengers or a little more, New York-Boston at 15 million or a little less, Boston-Washington at 6 million, Boston-Philadelphia at 5 million.
As a secondary sanity check, the Boston-Washington air market is about 2.5 million, and for HSR to get 2.5 times as much ridership on a formerly air-dominated city pair as the pre-HSR air travel volume is the same performance Eurostar got.
All four metro areas should be interpreted as broadly as possible, to maintain comparability with Japanese metro areas, whose definition is loose and roughly comparable to the American combined statistical area. So there are just four cities on the Northeast Corridor, really. This is still not all the ridership there is – there is still New York-Philadelphia and Philadelphia-Washington, I’m just less comfortable making even an ex-recto estimate. But even without those two potentially high-ridership city pairs, we get high passenger density on all segments of the line.
Update: although I have not found city-to-city ridership data from France, I have found region-to-region numbers from Paris to the southwest. I also have some air traffic volumes from which we can deduce air/rail markets: on Paris-Nice the TGV has a 31% share of the air/rail market; on Paris-Marseille I’ve seen numbers ranging from 60% to 83%, and for this post’s purposes I’m going to assume 70%. We get air/rail traffic numbers from Paris to Marseille (5.2 million, but this grows to 9.2 million if we assume 83% TGV share and declines to 3.9 million if we assume 60%), Nice (4.2 million), Midi-Pyrenees (3.2 million), Aquitaine (5.5 million), and Poitou-Charentes (3.3 million). With the exception of the Midi-Pyrenees number, which represents a fairly long distance, all overperform the Shinkansen. Ignoring distance as always and using an exponent of 0.8, Paris-Marseille overperforms Tokyo-Sendai by a factor of 1.85, Paris-Nice by 2.21, Paris-Midi-Pyrenees by 0.77 (i.e. it underperforms), Paris-Aquitaine by 1.26, and Paris-Poitou-Charentes by 1.22. Per-kilometer fares are much lower than on Shinkansen – indeed SNCF’s total revenue, both high- and low-speed, divided just by TGV passenger-km, is €0.14 – and this can contribute to the higher traffic.
Paris-Nice can be explained as a major leisure corridor, similar to the unusually high passenger traffic to Florida or Las Vegas. But bear in mind that Nice and Marseille are metro areas and not entire regions, and under any assumption that Bordeaux and Toulouse get a greater share of the travel to Paris than the rural areas in their respective regions, they will overperform by a substantial margin. Although French metro areas are defined less loosely than Japanese ones, which can skew the Marseille and Nice numbers, the Aquitaine and Midi-Pyrenees numbers are if anything defined too loosely due to the inclusion of outright rural departments.


