New York City Zoning and Subway Capacity
I got a bunch of accolades and a bunch of flaming replies over a tweetstorm imagining a bigger, better New York. Some people complained about my claim that subway trains in Brooklyn are underfull; I urge everyone to read my analysis of data from 2016 – it’s still relevant today, as the only big change is that Second Avenue Subway has reduced Upper East Side crowding. The point of this post is to demonstrate where zoning should definitely focus on adding more apartments, to fill trains that are not yet full.
The map
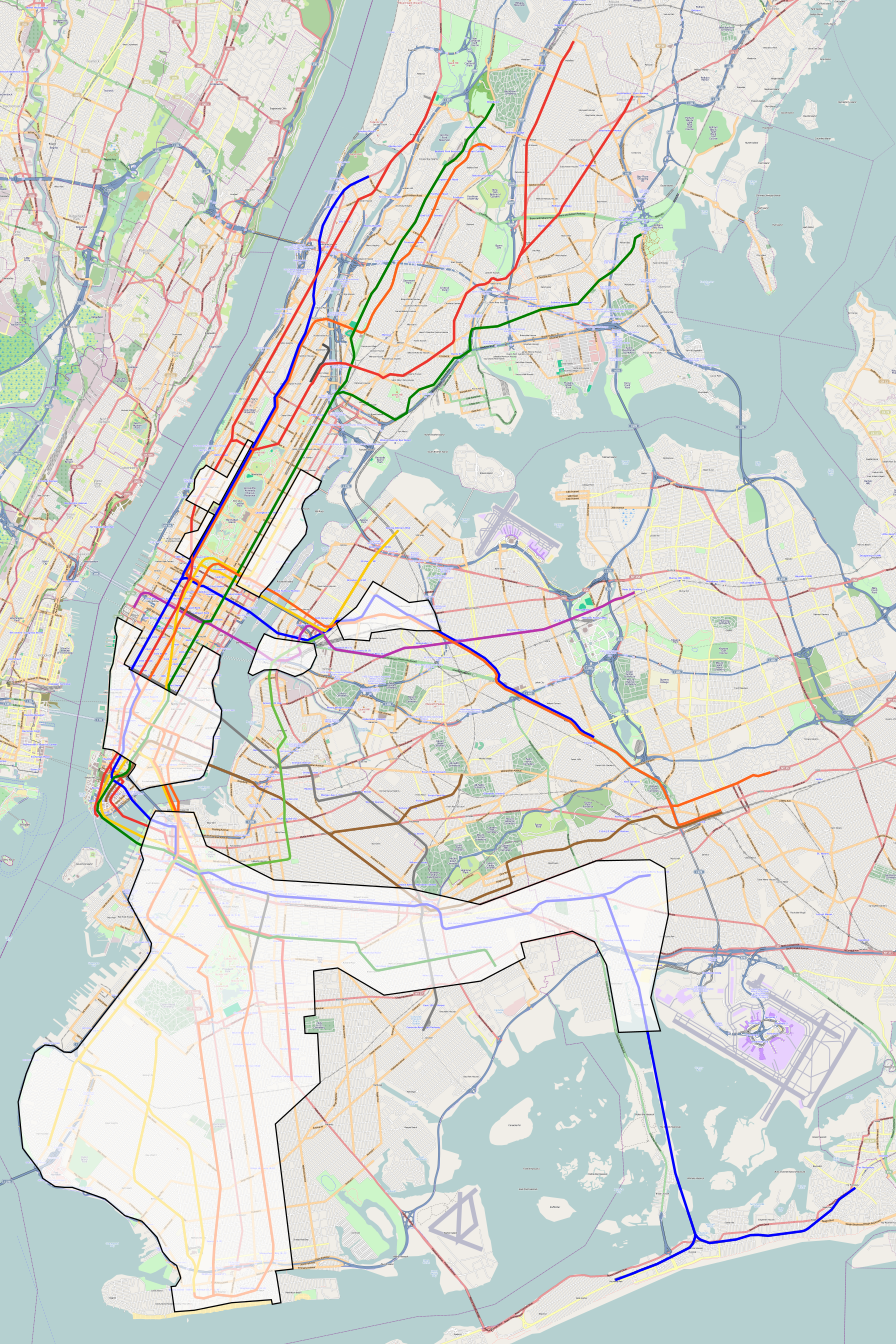
Instead of using the current subway map, let us start with a deinterlined map:

The reason for using this map is that it’s cleaner than the real map, since there is no track-sharing between routes of different colors, and not much route-sharing (one color local, one express). Getting from here to this map is cheap but not free, as it requires certain junction rebuilds, especially on the 2/3. I ask that my commenters resist the temptation to argue over the details of this map, since the point about zoned capacity does not really depend on questions like whether the E runs local in Queens and the F runs express or the reverse.
Where there is capacity
In 2016, three directions on the subway were truly at capacity, surpassing 4 standees per square meter: the 2/3 and 4/5 coming into Midtown from Uptown, and the L. The analysis looks at crowding on trains entering the Manhattan core, so it lumps lines from Queens based on which tunnel they enter from, which underestimates crowding on the E, since it shares tracks with the under-capacity M. Counted properly, the express Queens Boulevard trains should be viewed as near or at capacity as well, the F having 3.33 standees per square meter and the E having somewhat more.
Additional lines with capacity crunches, with about 3 standees per square meter or more, include the A/D coming in from Uptown, the 6, and the Astoria Line (then the N/Q, now the N/W). The 1 and 7 trains have capacity crunches as well in outlying areas: the 7 is overcrowded until it hits the transfer points to the E/F and N/W but has plenty of space in Long Island City, and the 1 is fairly crowded north of the junction with the express trains and then unloads passengers onto the overcrowded 2/3. These areas should not be deemed to have much spare capacity until such time as operations on the subway improve, permitting higher frequency and eventually more lines.
In contrast, the remaining lines have space, often plenty of space. Everything in Brooklyn except the L and to some extent the J/M/Z is underfull: these trains have high frequency as determined by crowding guidelines at the Uptown or Queens end, but in Brooklyn there are fewer people today so the ridership is weaker. The local lines on the Upper West Side both have plenty of space on the trains as well as space on the tracks for more trains if need be. The 7 downstream of Queensboro Plaza has plenty of space, and the local Queens Boulevard trains downstream of Jackson Heights have nowhere for passengers to transfer to an overcrowded express service.
Since I’m relying on data from 2016, there’s no accounting for Second Avenue Subway. Even then, the 4/5 was only the third most overcrowded trunk line entering the Manhattan core, and it’s likely that there’s additional capacity coming from the new line. There’s certainly space on the tracks for more trains on Second Avenue, and one of the goals of deinterlining specifically is to make it feasible to run more service on this line, which currently only runs a train every 6-8 minutes at rush hour.
The map of where New York could add housing
The map excludes parts of Lower and Midtown Manhattan where the highest and best use is commercial rather than residential. But the boundaries there are deliberately crude: Downtown Brooklyn, NYU, and the Meatpacking District are drawn, to avoid excessive fragmentation of the drawn area, while Chelsea and Hell’s Kitchen are excluded as too close to Midtown.
The map also does not look at considerations other than capacity. Some of the highlit areas on the Upper East and West Sides and Lower East Side are already built to very high density, at least on the avenues and major streets; these areas should be the template of how the rest of the city should look. At the other end, East New York has too weak demand for massive construction, especially if everything to its west is upzoned.
However, large swaths of desirable, close-in areas with relatively short buildings are highlit. Rich inner Brooklyn neighborhoods like Park Slope and South Brooklyn are currently built to missing middle density, with a floor area ratio of about 1.5 away from corner lots. A more appropriate floor area ratio in these neighborhoods is 12, corresponding to tapering buildings in the 20-30 story range, as on the avenues on the Upper East and West Sides. Park Slope is half an hour from Midtown by subway, and less than that from Lower Manhattan. The population of these neighborhoods is perhaps 150,000, and should be more than a million given their proximity to job centers.
Subway deserts and future additions
The map is designed to work with more or less the same service as today, maybe with slightly more frequency on lines that could handle it easily (that is, Second Avenue Subway). But what about future service? The L train is overcrowded, but only runs 19 trains per hour at the peak due to electrical limitations, and could go up to 26 with better electrical capacity, or for that matter lighter trains drawing less power during acceleration. Further extensions of Second Avenue Subway could more effectively relieve pressure off the 4/5, to the point of creating more capacity in the Bronx, which remains well below peak population. Commuter rail modernization opens up large swaths of Queens. Decades in the making extensions on Nostrand and Utica fill in the transit desert in southeast Brooklyn, currently served by buses that nominally come every 2 minutes and in practice comes in platoons of 4 every 8 minutes.
As with the map above, a hypothetical map of development sites assuming reasonable subway expansion includes areas that would be unlikely to actually see new development. Williamsburg and Greenpoint may turn into forests of towers given the opportunity, but in neighborhoods like Sheepshead Bay and East Flatbush developers might well stick to the occasional 6-to-10-story mid-rise building that would not look out of place in Paris. In Eastern Queens, the desired density is probably spiky, with clusters of tall buildings around LIRR stations surrounded by single-family houses and missing middle, much like the structure of density in Toronto and Vancouver.


