Gentrifier Stereotypes

The American discourse about gentrification is full of stereotypes that the participants don’t recognize as such. For example, a widely-shared Buzzfeed article created an entire theory out of a single busybody who was responsible for half of the police complaints on their West Harlem block. The main check on stereotypes – “that’s racist” – only works when the stereotypes resemble the forms of racism society is most familiar with. The history of white racism against black people in the US is so different that it colors what Americans perceive as racial stereotypes and what they don’t. So as public service, I’d like to give some examples to draw commonalities between stereotypes in other cities I’ve lived in (Tel Aviv, Vancouver, Paris) and familiar anti-gentrification rhetoric.

Tel Aviv

Last decade, there was an influx of black refugees into working-class areas of South Tel Aviv, centered on Levinsky Park. The area is underpriced relative to its job access, courtesy of Central Bus Station, a failed urban renewal project that attracted crime; already in the 1990s it was nicknamed Central Stench (tsaḥana merkazit; Central Station is taḥana merkazit) and lampooned in a popular comic as a literal gateway to hell. The neighborhood’s response was violent, and the discourse within Israel is divided into people who wish the refugees imprisoned and deported from the country and people who wish them forcibly dispersed around the country.

Other parts of South Tel Aviv have been gentrifying since the 1990s, centered on Florentin. South Tel Aviv’s right-wing Jewish working class began connecting the two trends. A few years ago I saw a widely-shared Facebook post claiming that the influx of black refugees is deliberately engineered by developers as a ploy to gentrify the neighborhood. The theory, as I recall, is that black people are so odious that developers are using them to engineer white flight, after which they’ll evict the refugees, demolish the neighborhood’s mid-rise housing stock, and erect luxury towers.

Vancouver

In the last decade or so Vancouver has seen rising rents and even faster-rising housing prices, and the region’s white population is blaming Chinese people. In 2016, British Columbia passed a 15% tax on residential buyers who are not Canadian citizens or permanent residents; the tax was phrased neutrally, but the target was predominantly Chinese, and 21% of correspondence from citizens to the government on the issue was explicitly Sinophobic. In a city with rapid immigration, it should not be a surprise that new buyers tend to be immigrants, often on work or investor visas, but the region has a moral panic about Chinese people buying condos and houses as investments and leaving them empty.

The specific stereotypes of Chinese people in Vancouver vary. When I lived in Vancouver I encountered some light generic stereotyping (“people in Richmond are aggressive drivers”), but nothing connoting poverty, even though Richmond is poorer than Surrey, which some people I met compared with Camden, New Jersey. The language I see in the media concerning housing goes the other way: Chinese immigrants are stereotyped as oligarchs laundering ill-begotten wealth.

Paris

Like people in every other highly-toured region, Parisians hate the tourists. Seeing small declines in city population over the 2009-14 period, city electeds decided to blame Airbnb, and not, say, low housing construction rates (raising rents), a falling birth rate, or commercialization in city center. The mayor of the 1st arrondissement, Jean-Francois Legaret, called Airbnb “a true catastrophe for Central Paris.” The 1st arrondissement has high residential incomes; the lower-income parts of the city are the 10th, 11th, 13th, 18th, 19th, and 20th.

Rich and poor stereotypes

An ethnic or national group can stereotype another group as rich, poor, or both. White stereotypes of black people in the US and Europe are, within each ethnic group, associated with poverty: crime, aggressive physicality, laziness, indifference to education, proclivity for certain kinds of music and sport. Anti-Semitism today invokes stereotypes of the rich: greed, political subversion, disloyalty to the nation, corruption, success with money. Islamophobic stereotypes tend toward stereotypes of poverty, but are sometimes also bundled with stereotypes of Gulf money. In the last few decades Sinophobic stereotypes transitioned from ones of poverty (treating the Chinese as a faceless horde) to ones of wealth, similar to anti-Semitic stereotypes, to the point that people in Vancouver forget Richmond’s low incomes and people in New York forget the high poverty rates of Asian-New Yorkers and the overcrowding in Chinatown.

But as in the case of South Tel Aviv, the stereotypes can merge. The racists in South Tel Aviv blend two groups they hate – middle-class leftists and poor non-Jews – into one mass, blaming them for a trend that is usually blamed on the rich and the middle class. Historically, anti-Semitism was fully blended: the Jew was simultaneously poor and rich, wretched and exploitative, communist and capitalist, overly studious and overly physical. This blending of stereotypes was overt in Nazi propaganda, but also in the softer anti-Semitism directed against immigrants to the US.

The urban as a foreigner

Nationalists and populists stereotype cities like prewar anti-Semites stereotype Jews. The urban poor are lazy criminals, the rural poor are honest workers; the urban rich are exploitative capitalists sucking life out of the country, the rural rich are successful small business leaders; the urban middle class are bo-bo globalists, the rural middle class is the very definition of normality. This mentality is hard to miss in anti-urbanist writers like Joel Kotkin, and more recently in articles trying to portray an opposition between the Real Country (in the US but also in Israel and France) and the Urban Elites.

The definition of what is rural and what is urban is fractal. In the South, Long Island is part of New York; on Long Island, Long Island is Real America, distinct from the city that Long Island’s residents fled in the 1950s and 60s. Within cities the Real Country vs. Urban Elite opposition can involve the outer city vs. the inner city, as in Toronto, where Rob Ford won the mayoral election by appealing to outer-urban resentment of David Miller’s attempt to redistribute street space from cars to public transit. But it is in many cases demographic rather than geographic: the newcomer is the new rootless cosmopolitan.

In this mentality, the newcomer can be a rich gentrifier displacing honest salt-of-the-earth third-generation residents by paying higher rents or a refugee doing the same through living multiple people to a bedroom (or even both, in the case of some San Francisco programmers). In either case, the newcomer is a foreigner who doesn’t belong to the city’s culture and does not deserve the same access to city resources. People who build housing for this foreigner are inherently suspect, as are businesses that cater to the foreigner’s tastes. The demands – removal of access to housing – are the same regardless of whether the foreigners so stereotyped are poor or rich, and the stereotypes of wealth and poverty mix easily. That anti-gentrification activism looks so similar regardless of which social class it targets suggests that ultimately, any argument made is an excuse justifying not liking outsiders very much.

The Value of Modern EMUs

I do not know how to code. The most complex actually working code that I have written is 48 lines of Python that implement a train performance calculator that, before coding it, I would just run using a couple of Wolfram Alpha formulas. Here is a zipped version of the program. You can download Python 2.7 and run it there; there may also be online applets, but the one I tried doesn’t work well.

You’ll get a command line interface into which you can type various commands – for example, if you put in 2 + 5 the machine will natively output 7. What my program does is define functions relevant to train performance: accpen(k,a,b,c,m,x1,x2,n) is the acceleration penalty from speed x1 m/s to speed x2 m/s where x1 < x2 (if you try the other way around you’ll get funny results) for a train with a power-to-weight ratio of k kilowatts per ton, an initial acceleration rate of m m/s^2, and constant, linear, and quadratic running resistance terms a, b, and c. To find the deceleration penalty, put in decpen, and to find the total, either put in the two functions and add, or put in slowpen to get the sum. The text of the program gives the values of a, b, and c for the X2000 in Sweden, taken from PDF-p. 64 of a tilting trains thesis I’ve cited many times. A few high-speed trainsets give their own values of these terms; I also give an experimentally measured lower air resistance factor (the quadratic term c) for Shinkansen. Power-to-weight ratios are generally available for trainsets, usually on Wikipedia. Initial acceleration rates are sometimes publicly available but not always. Finally, n is a numerical integration quantity that should be set high, in the high hundreds or thousands at least. You need to either define all the quantities when you run the program, or plug in explicit numbers, e.g. slowpen(20, 0.0059, 0.000118, 0.000022, 1.2, 0, 44.44, 2000).

I’ve used this program to find slow zone penalties for recent high-speed rail calculations, such as the one in this post. I thought it would not be useful for regional trains, since I don’t have any idea what their running resistance values are, but upon further inspection I realized that at speeds below 160 km/h resistance is far too low to be of any consequence. Doubling c from its X2000 value to 0.000044 only changes the acceleration penalty by a fraction of a second up to 160 km/h.

With this in mind, I ran the program with the parameters of the FLIRT, assuming the same running resistance as the X2000. The FLIRT’s power-to-weight ratio is 21.1 in Romandy, and I saw a factsheet in German-speaking Switzerland that’s no longer on Stadler’s website citing slightly lower mass, corresponding to a power-to-weight ratio of 21.7; however, these numbers do not include passengers, and adding a busy but not full complement of passengers adds mass to the train until its power-to-weight ratio shrinks to about 20 or a little less. With an initial acceleration of about 1.2 m/s^2, the program spits out an acceleration penalty of 23 seconds from 0 to 160 km/h (i.e. 44.44 m/s) and a deceleration penalty of 22 seconds. In videos the acceleration penalty appears to be 24 seconds, which difference comes from a slight ramping up of acceleration at 0 km/h rather than instant application of the full rate.

In other words: the program manages to predict regional train performance to a very good approximation. So what about some other trains?

I ran the same calculation on Metro-North’s M-8. Its power-to-weight ratio is 12.2 kW/t (each car is powered at 800 kW and weighs 65.5 t empty), shrinking to 11.3 when adding 75 passengers per car weighing a total of 5 tons. A student paper by Daniel Delgado cites the M-8’s initial acceleration as 2 mph/s, or 0.9 m/s^2. With these parameters, the acceleration penalty is 37.1 seconds and the deceleration penalty is 34.1 seconds; moreover, the paper show how long it takes to ramp up to full acceleration rate, and this adds a few seconds, for a total stop penalty (excluding dwell time) of about 75 seconds, compared with 45 for the FLIRT.

In other words: FRA-compliant EMUs add 30 seconds to each stop penalty compared with top-line European EMUs.

Now, what about other rolling stock? There, it gets more speculative, because I don’t know the initial acceleration rates. I can make some educated guesses based on adhesion factors and semi-reliable measured acceleration data (thanks to Ari Ofsevit). Amtrak’s new Northeast Regional locomotives, the Sprinters, seem to have k = 12.2 with 400 passengers and m = 0.44 or a little less, for a penalty of 52 seconds plus a long acceleration ramp up adding a brutal 18 seconds of acceleration time, or 70 in total (more likely it’s inaccuracies in data measurements – Ari’s source is based on imperfect GPS samples). Were these locomotives to lug heavier coaches than those used on the Regional, such as the bilevels used by the MBTA, the values of both k and m would fall and the penalty would be 61 seconds even before adding in the acceleration ramp. Deceleration is slow as well – in fact Wikipedia says that the Sprinters decelerate at 5 MW and not at their maximum acceleration rate of 6.4 MW, so in the decpen calculation we must reduce k accordingly. The total is somewhere in the 120-150 second range, depending on how one treats the measured acceleration ramp.

In other words: even powerful electric locomotives have very weak acceleration, thanks to poor adhesion. The stop penalty to 160 km/h is about 60 seconds higher than for the M-8 (which is FRA-compliant and much heavier than Amfleet coaches) and 90 seconds higher than for the FLIRT.

Locomotive-hauled trains’ initial acceleration is weak that reducing the power-to-weight ratio to that of an MBTA diesel locomotive (about 5 kW/t) doesn’t even matter all that much. According to my model, the MBTA diesels’ total stop penalty to 160 km/h is 185 seconds excluding any acceleration ramp and assuming initial acceleration is 0.3 m/s^2, so with the ramp it might be 190 seconds. Of note, this model fails to reproduce the lower acceleration rates cited by a study from last decade about DMUs on the Fairmount Line, which claims a 70-second penalty to 100 km/h; such a penalty is far too high, consistent with about 0.2 m/s^2 initial acceleration, which is far too weak based on local/express time differences on the schedule. The actual MBTA trains only run at 130 km/h, but are capable of 160, given long enough interstations – they just don’t do it because there’s little benefit, they accelerate so slowly.

Unsurprisingly, modern rail operations almost never buy locomotives for train services that are expected to stop frequently, and some, including the Japanese and British rail systems, no longer buy electric locomotives at all, using EMUs exclusively due to their superior performance. Clem Tillier made this point last year in the context of Caltrain: in February the Trump administration froze Caltrain’s federal electrification funding as a ploy to attack California HSR, and before it finally relented and released the money a few months later, some activists discussed Plan B, one of which was buying locomotives. Clem was adamant that no, based on his simulations electric locomotives would barely save any time due to their weak acceleration, and EMUs were obligatory. My program confirms his calculations: even starting with very weak and unreliable diesel locomotives, the savings from replacing diesel with electric locomotives are smaller than those from replacing electric locomotives with EMUs, and depending on assumptions on initial acceleration rates might be half as high as the benefits of transitioning from electric locomotives to EMUs (thus, a third as high as those of transitioning straight from diesels to EMUs).

Thus there is no excuse for any regional passenger railroad to procure locomotives of any kind. Service must run with multiple units, ideally electric ones, to maximize initial acceleration as well as the power-to-weight ratio. If the top speed is 160 km/h, then a good EMU has a stop penalty of about 45 seconds, a powerful electric locomotive about 135 seconds, and a diesel locomotive around 190 seconds. With short dwell times coming from level boarding and wide doors, EMUs completely change the equation for local service and infill stops, making more stops justifiable in places where the brutal stop penalty of a locomotive would make them problematic.

Focus on What’s Common to Good Transit Cities, not on Differences

Successful transit cities are not alike. There are large differences in how the most expansive transit networks are laid out. It takes multiple series of posts across several blogs (not just mine but also Human Transit and others) covering just one of them, for example stop spacing or how construction contracts are let. With so much variation, it’s easy to get caught up in details that differentiate the best systems. After all, the deepest communities of railfans tend to sprout in the cities with the largest rail networks; arguing with railfans with experience with London, Tokyo, or Paris is difficult because they know intricate details of how their systems work that I am catching up on but only know in the same depth for New York. Add in the fact that London and Paris view each other as peer cities and from there the route to arguing minutiae about two cities that by most standards have good public transit is short.

But what if this is wrong? What if, instead of or in addition to figuring out differences among the top transit cities, it’s useful to also figure out what these transit cities have in common that differentiates them from auto-oriented cities? After all, in other aspects of development or best practices this is well-understood: for example, a developing country can choose to aim to be hyper-capitalist like Singapore or the US or social democratic like Sweden or France, but it had better develop the institutions that those four countries have in common that differentiate them from the third world.

Unfortunately, before discussing what the common institutions to transit cities are, it’s necessary to discuss things that may be common but don’t really matter.

The US as a confounding factor

The biggest problem with figuring out things all good transit cities have in common is that in the developed world, the US (and to some extent Canada and Australia) is unique in having bad transit. Frequent commenter Threestationsquare has a list of cities by annual rapid transit ridership (counting BRT but not infrequent commuter rail, which lowballs parts of the US); New York is near the top, but the second highest in the US, a near-tie between Boston, Chicago, and Washington, would rank #22 in Europe. As a result, some social, political, and technical features that appear to differentiate good and bad transit are not really about transit but about the US and must be discarded as confounding factors. Fortunately, most of these confounding factors are easy to dispose of since they also occur in New York.

The more difficult question concerns factors that are distantly related to the weakness of US transit but are not direct explanations. I wrote about racism as such a factor a few months ago, arguing that high US construction costs come from weak civil service, which in turn comes from the way American segregation works. The US is not uniquely racist or even uniquely segregated; the unique aspect is that it a) has a long-settled oppressed minority and not just immigrants who arrived after the characteristic of the state was established, and b) has segregation within metro areas (unlike Singapore, which has social but not spatial segregation) but not between them (unlike Israel, where the built-up area of Tel Aviv has very few Arabs). But while this can explain why institutions developed in a way that’s hostile to transit, it’s not a direct explanation for poor US transit except in Atlanta, where the white state underinvests in the black city. White people in Boston, Los Angeles, Houston, and other cities with little to no public transit do not avoid the bus or the train out of stereotypes that match typical American racial stereotypes, such as crime; they avoid the train because it doesn’t go where they’re going and the bus because it is slow and unreliable.

There are two ways to avoid confounding factors. The first is the sanity check, where available: if some feature of transit exists across major transit cities but is absent in auto-oriented cities not just in the US but also in Canada, Australia, New Zealand, Israel, and Italy, then it’s likely to be relevant. Unfortunately, clean examples are rare. The second and more difficult method is to have theoretical understanding of what matters.

Size artifacts

London and Paris are transit cities. So are Prague and Stockholm. I’ve stressed the importance of scale-variance before: features that work in larger cities may fail in smaller ones and vice versa. Thus, it’s best to look at common features of successful transit cities within each size class separately.

In fact, one way cities can fail is by adopting transit features from cities of the wrong size class. China is making the mistake in one direction: Beijing and Shanghai have no express subway trains or frequent regional rail services acting as express urban rail, and as a result, all urban travel has to slow down to an average speed of about 35 km/h, whereas Tokyo has express regional lines averaging 60 km/h. China’s subway design standards worked well for how big its cities were when those standards were developed from the 1970s to the 1990s, but are too small for the country’s megacities today.

In contrast, in the developed world, the megacities with good public transit all have frequent express trains: Tokyo and Osaka have four-track (or even eight-track!) regional lines, Paris has the RER, New York has express subways (and the premium-price LIRR trains from Jamaica to Penn Station), London has fast regional rail lines and Thameslink and will soon have Crossrail, Seoul has a regional rail network with express trains on Subway Line 1, and Moscow stands alone with a strictly two-track system but has such wide stop spacing that the average speed on the Metro is 41 km/h. Smaller transit cities sometimes have frequent express trains (e.g. Zurich and Stockholm) and sometimes don’t (e.g. Prague), but it’s less important for them because their urban extent is such that a two-track subway line can connect the center with the edge of the built-up area in a reasonable amount of time.

And if China failed by adopting design standards fitting smaller cities than it has today, the US fails in the other direction, by adopting design standards fitting huge megacities, i.e. New York. Small cities cannot hope to have lines with the crowding levels of the Lexington Avenue Line. This has several implications. First, they need to scale their operating costs down, by using proof of payment ticketing and unstaffed stations, which features are common to most European transit cities below London and Paris’s size class. Second, they need to worry about train frequency, since it’s easy to get to the point where the frequency that matches some crowding guideline is so low that it discourages riders. And third, they need to maximize network effects, since there isn’t room for several competing operations, which means ensuring buses and trains work together and do not split the market between them.

The best example of an American city that fails in all three aspects above is Washington. While railfans in Washington lament the lack of express tracks like those of New York, the city’s problems are the exact opposite: it copied aspects of New York that only succeed in a dense megacity. With interlining and reverse-branching, Washington has low frequency on each service, down to 12 minutes off-peak. The stations are staffed and faregated, raising operating costs. And there is no fare integration between Metro and the buses, splitting the market in areas with price-sensitive riders (i.e. poor people) like Anacostia.

The political situation

While I’ve written before about what I think good metro design standards are, these standards themselves cannot separate the major transit cities from cities like Los Angeles (which has about two and a half rail trunks in a metro area larger than that of London or Paris) or Tel Aviv (which has no metro at all). Instead, it’s worth asking why these cities have no large subway systems to begin with.

In the case of Tel Aviv, Israel has had an official policy of population dispersal since independence. After independence the North and South of the country had Arab majorities, and the government wished to encourage Jews to settle there to weaken any Palestinian claims to these areas. As a result, Prime Minister David Ben Gurion rejected a plan to develop an urban rail network centered on Tel Aviv and instead encouraged low-income Jewish immigrants to move far away, either to depopulated Arab towns or to new towns (“development towns”) built at strategic points for national geopolitics. Decentralization was national policy, and with it came auto-oriented urbanism. A less harsh but equally politicized environment led to Malaysia’s auto-centric layout: Paul Barter’s thesis outlines how Malaysia choked informal transit and encouraged auto-oriented suburbanization in order to create an internal market for state-owned automakers.

In the case of the US, the situation is more complex, since there were several distinct political trends in different eras favoring cars. In postwar suburbia (and in Los Angeles going back to the 1920s) it was the association of cars with middle-class normality, and in California also with freedom from hated railroads; it’s related to the fact that American suburbanization was led by the middle class rather than by the working class as with more recent exurbanization. In Israel suburbanization was led by the working class, but the deliberate government policy of decentralization meant that the urban middle class’s demands for better transportation were ignored until the 1990s.

Without enough of an urban middle class to advocate for more transit, US transit withered. New cities in the Sunbelt had little demand for public transit, and in the older cities the middle class cared little for any transit that wasn’t a peak-only commuter train from the suburbs to the CBD. Moreover, in existing transit cities the middle class demanded that the urban layout change to fit its suburban living situation, leading to extensive job sprawl into office parks that are difficult to serve on transit. This paralleled trends in Canada, Australia, and New Zealand; Sydney in particular saw middle-class suburbanization early, like Los Angeles.

The political situation changed in the 1970s, 80s, and 90s, but by then high construction costs, NIMBYism constraining the extent of TOD (unlike in Canada), and indifference to leveraging regional rail for urban transit (as in Canada and until recently Israel but unlike in Australia) made it difficult to build more public transit lines.

Regional rail and TOD

The largest transit cities in the rich and middle-income world all make extensive use of regional rail, with the aforementioned exception of Chinese cities, where the lack of regional rail is creating serious travel pain, and New York, where the city itself is transit-oriented but its suburbs are not. Smaller transit cities usually make use of regional rail as well, but this isn’t universal, and to my understanding is uncommon in Eastern Europe (e.g. Kyiv has one semi-frequent ring line) even in cities with very high metro and tramway usage.

However, smaller transit cities that do not have much regional rail have full metro systems and not just tramways, let alone BRT. Curitiba and Bogota are famous for their BRT-only transit networks, but both instituted their systems in a context with low labor costs and both are building metro systems right now.

The other common element to transit cities is TOD. Here, we must distinguish old cities like London, Paris, Berlin, and Vienna, whose urban layout is TOD because it was laid out decades before mass motorization, and newer cities like Stockholm, Tokyo, and every city in Eastern Europe or the East Asian tiger states. The latter set of cities built housing on top of train stations, often public housing (as in the communist world or in Stockholm) but not always (as in Tokyo and to some extent Hong Kong), in an era when the global symbol of prosperity was still the American car-owning middle class.

The importance of TOD grows if we compare countries with relatively similar histories, namely, the US and Canada. Neither country does much regional rail, both have had extensive middle-class suburbanization (though Canada’s major cities have maintained bigger inner-urban middle classes than the US’s), and English Canada’s cities came into the 1970s with low urban density. The difference is that Canada has engaged in far more TOD. Calgary built up a large CBD for how small the city is, without much parking; Vancouver built up Downtown as well as transit-oriented centers such as Metrotown, New Westminster, Lougheed, and Whalley, all on top of the Expo Line. Nowhere in the US did such TOD happen. Moreover, American examples of partial TOD, including Arlington on top of the Washington Metro and this decade’s fast growth in Seattle, have led to somewhat less awful transit usage than in the rest of the country.

Most cities in the developed world are replete with legacy rail networks that can be leveraged for high-quality public transit. We see cities that aim at transit revival start with regional rail modernization, including Auckland and to some extent Tel Aviv (which is electrifying its rail network and building new commuter lines, but they run in freeway medians due to poor planning). Moreover, we see cities that are interested in transit build up high-rise CBDs in their centers and high- and mid-rise residential development near outlying train stations.

“Regional rail and TOD” is not a perfect formula; it elides a lot of details and a lot of historical factors that are hard to replicate. But both regional rail and TOD have been major elements in the construction of transit cities over the last 60 years, and while they both have exceptions, they don’t have many exceptions. In the other direction, I don’t know of examples of failed TOD – that is, of auto-oriented cities that aggressively built TOD on top of new or existing rail lines but didn’t manage to grow their transit ridership. I do know some examples of failed regional rail, but usually they make glaring mistakes in design standards, especially frequency but also station siting and fare integration.

At a closer in level of zoom, it’s worthwhile to talk about the unique features of each transit city. But when looking at the big picture, it’s better to talk about what all transit cities of a particular size class have in common that auto-oriented cities don’t. Only this way can an auto-oriented city figure out what it absolutely must do if it wants to have better public transit and what are just tools in its kit for achieving that goal.

Massachusetts Sandbags the North-South Rail Link

Boston has two main train stations: South Station, and North Station. Both are terminals, about 2 km apart, each serving its own set of suburbs; as a result, over the last few decades there have been calls to unify the system with a regional rail tunnel connecting the two systems. This tunnel, called the North-South Rail Link, or NSRL, would have been part of the Big Dig if its costs hadn’t run over; as it were, the Big Dig reserved space deep underground for two large bores, in which there is clean dirt with no archeological or geotechnical surprises. The NSRL project had languished due to Massachusetts’ unwillingness to spend the money on it, always understood to be in the billions, but in the last few years the pressure to build it intensified, and the state agreed to fund a small feasibility study.

A presentation of the draft study came out two days ago, and is hogwash. It claims on flimsy pretext that NSRL would cost $17 billion for the tunnel alone. It also makes assumptions on service patterns (such as manual door opening) that are decades out of date not just in Europe and East Asia but also in New York. The Fiscal and Management Control Board, or FMCB, discusses it here; there’s a livestream as well as a link to a presentation of the draft study.

The content of the study is so weak that it has to have been deliberate. The governor does not want it built because of its complexity, no matter how high its benefits. Thus, the state produced a report that sandbags a project it doesn’t want to build. People should be fired over this, starting with planners at the state’s Office of Transportation Planning, which was responsible for the study. The way forward remains full regional rail modernization. As for the cost estimate, an independent study by researchers at Harvard’s Kennedy School of Government estimates it at about $5 billion in today’s money; the new study provides no evidence it would be higher. I urge good transit activists in Massachusetts, Rhode Island, and New Hampshire to demand better of their civil servants.

Tunneling costs

The study says that the cost of a four-track NSRL tunnel under the Big Dig would be $17 billion in 2028 dollars. In today’s money, this is $12 billion (the study assumes 3.5% annual cost escalation rather than inflation-rate cost escalation). It claims to be based on best practices, listing several comparable tunnels, both proposed and existing:

  • California High-Speed Rail tunnels (average estimated cost about $125 million per km, not including overheads and contingency)
  • Crossrail (see below on costs)
  • The M-30 highway tunnel in Madrid (average cost about $125 million per km of bored tunnel in the mid-2000s, or around $150 million/km in today’s money)
  • The canceled I-710 tunnel in California (at 7.2 km and $5.6 billion, $780 million per km
  • The Spoortunnel Pannerdensch Kanaal (around $200 million in today’s money for 1.6 km of bore, or $125 million per km)

Unlike the other tunnels on the list, Crossrail has stations frustrating any simple per km cost analysis. The headline cost of Crossrail is £15 billion; however, I received data from a freedom of information request showing that the central (i.e. underground) portion is only £11.6 billion and the rest is surface improvements, and of this cost the big items are £2.2 billion for tunneling, £4.1 billion for stations, £1 billion for tracks and systems, and £2.7 billion for overheads and land acquisition. The tunneling itself is thus around $150 million per km, exclusive of overheads and land (which add 30% to the rest of the project). All of this is consistent with what I’ve found in New York: tunneling is for the most part cheap.

With the exception of Crossrail, the above projects consist of two large-diameter bores. The mainline rail tunnels (California HSR and Pannerdensch Kanaal) are sized to provide plenty of free air around the train in order to improve aerodynamics, a feature that is desirable at high speed but is a luxury in a constrained, low-speed urban rail tunnel. The highway tunnels have two large-diameter bores in order to permit many lanes in each direction. The plan for NSRL has always been two 12-meter bores, allowing four tracks; at the per-km boring cost of the above projects, this 5 kilometer project should cost perhaps a billion dollars for tunneling alone.

The stations are typically the hard part. However, NSRL has always been intended to use large-diameter tunnels, which can incorporate the platforms within the bore, reducing their cost. Frequent commenter Ant6n describes how Barcelona used such a tunnel to build Metro Lines 9 and 10, going underneath the older lines; the cost of the entire project is around $170 million per km, including a cost overrun by a factor of more than 3. Vertical access is likely to be more difficult in Boston under the Big Dig than in Barcelona, but slant shafts for escalators are still possible. At the worst case scenario, Crossrail’s station costs are of an order of magnitude of many hundreds of millions of dollars each, and two especially complex ones on Crossrail 2 are £1.4 billion each; this cost may be reasonable for Central Station at Aquarium, but not at South Station or North Station, where there is room for vertical and slant shafts.

It’s possible that the study made a factor-of-two error, assuming that since the mainline rail comparison projects have two tracks, their infrastructure is sized for two urban rail tracks, where in reality a small increase in tunnel diameter would permit four.

Researchers at the Harvard Kennedy School of Government came up with an estimate of $5.9 billion in 2025 dollars for a four-track, three-station NSRL option, which is about $5 billion today. Their methodology involves looking at comparable tunneling projects around the world, and averaging several averages, one coming from American cost methodology plus 50% contingency, and two coming from looking at real-world cost ranges (one American, one incorporating American as well as rest-of-world tunnels). Their list of comparable projects includes some high-cost ones such as Second Avenue Subway, but also cheaper ones like Citybanan, which goes deep underneath Central Stockholm with mined tunnels under T-Centralen and Odenplan, at $350 million per km in today’s money.

But the MassDOT study disregarded the expertise of the Kennedy School researchers, saying,

Note: The Harvard Study did not include cost for the tunnel boring machine launch pit and only accounted for 2.7 miles of tunneling (the MassDOT studies both accounted for 5 miles of tunneling), and no contingency for risk.

This claim is fraudulent. The Kennedy School study looks at real-world costs (thus, including contingency and launch pit costs) as well as at itemized costs plus 50% contingency. Moreover, the length of the NSRL tunnel, just under 5 km, is the same either way; the MassDOT study seems to be doubling the cost because the project has four tracks, an assumption that is already taken into account in the Kennedy School study. This, again, is consistent with a factor-of-two error.

Moreover, the brazenness of the claim that a study that explicitly includes contingency does not do so suggests that MassDOT deliberately sabotaged NSRL, making it look more expensive than it is, since the top political brass does not want it. Governor Baker said NSRL looks expensive, and Secretary of Transportation Stephanie Pollack is hostile as well; most likely, facing implicit pressure from above, MassDOT’s overburdened Office of Transportation Planning scrubbed the bottom of the barrel to find evidence of absurdly high costs.

Electrification costs

Massachusetts really does not want or understand electrification. Even some NSRL supporters believe electrification to be an expensive frill that would sink the entire project and think that dual-mode locomotives are an acceptable way to run trains in a developed country in the 2010s.

In fact, dual-mode locomotives’ weak performance serves to raise tunneling costs. Struggling to accelerate at 0.3 m/s^2 (or 0.03 g), they cannot climb steep grades: both the Kennedy School and MassDOT studies assume maximum 3% grades, whereas electric multiple units, with initial acceleration of 1.2 m/s^2, can easily climb 4% and even steeper grades (in theory even 10%, in practice the highest I know of is 7%, and even 5% is rare), permitting shorter and less constrained tunnels.

As a result of its allergy to electrification, MassDOT is only proposing wiring between North Station and the next station on each of the four North Side lines, a total of 22.5 route-km. This choice of which inner segments to electrify excludes the Fairmount Line, an 8-stop 15 km mostly self-contained line through low-income, asthma-riven city neighborhoods (source, PDF-pp. 182 and 230). Even the electrification the study does agree to, consisting of about 30 km of the above surface lines plus the tunnels themselves, is projected to cost $600 million. Nowhere in the world is electrification so expensive; the only projects I know of that are even half as expensive are a pair of disasters, one coming from a botched automation attempt on the Great Western Main Line and one coming from poor industry practices on Caltrain.

A more reasonable American budget, based on Amtrak electrification costs from the 1990s, would be somewhat less than $2 billion for the entire MBTA excluding the already-wired Providence Line; this is the most familiar electrification scheme to the Bostonian reader or planner. At French or Israeli costs, the entire MBTA commuter rail system could be wired for less than a billion dollars.

Another necessary element is conversion to an all-EMU fleet, to increase performance and reduce operating costs. Railway Gazette reports that a Dutch benchmarking study found that the lifecycle costs of EMUs are half as high as those of diesel multiple units. As the MBTA needs to replace its fleet soon anyway, the incremental cost of electrification of rolling stock is negative, and yet the study tacks in $2.4 billion on top of the $17 billion for tunneling for vehicles.

A miscellany of incompetence

In addition to the sandbagged costs, the study indicates that the people involved in the process do not understand modern railroad operations in several other ways.

First, door opening. While practically everywhere else in the first world doors are automatic and opened with the push of a button, the MBTA insists on manual door opening. The MassDOT study gives no thought to high platforms and automatic doors (indeed, the Old Colony Lines are already entirely high-platform, but some of their rolling stock still employs manual door opening), and assumes manual door opening will persist even through the NSRL tunnels. Each train would need a squad of conductors to unload in Downtown Boston, and the labor costs would frustrate any attempt to run frequently (the study itself suggests hourly off-peak frequency; in Paris, RER lines run every 10-20 minutes off-peak).

Second, capacity. The study says a two-track NSRL would permit 17 trains per hour in each direction at the peak, and a four-track NSRL would permit 21. The MBTA commuter rail network is highly branched, but not more so than the Munich S-Bahn (which runs 30 at the peak on two tracks) and less so than the Zurich S-Bahn (which before the Durchmesserlinie opened ran either 20 or 24 tph through the two-track tunnel, I’m not sure which).

Worse, the FMCB itself is dumbfounded by the proposed peak frequency – in the wrong direction. While FMCB chair Joe Aiello tried explaining how modern regional rail in Tokyo works, other members didn’t get it; one member dared ask whether 17 tph is even possible on positive train control-equipped tracks. My expectations of Americans are low enough that I am not surprised they are unaware that many lines here and in Japan have automatic train protection systems (ETCS here, various flavors of ATC in Japan) that meet American PTC standards and have shorter minimum headways than every 3-4 minutes. But the North River Tunnels run 24-25 peak tph into Manhattan, using ASCES signaling, the PTC system Amtrak uses on the Northeast Corridor; the capacity problems at Penn Station are well-known to even casual observers of American infrastructure politics.

A state in which the FMCB members didn’t really get what their chair was saying about modern operations is going to propose poor operating practices going forward. MassDOT’s study assumes low frequency, and, because there is no line-wide electrification except on the Providence Line and eventually South Coast Rail (where electrification is required for wetland remediation), very low performance. MassDOT’s conception of NSRL has no infill stops, and thus no service to the bulk of the contiguous built-up area of Boston. Without electrification or high platforms, it cannot achieve high enough speeds to beat cars except in rush hour traffic. Limiting the stop penalty is paramount on urban rail, and level boarding, wide doors, and EMU acceleration combine to a stop penalty of about 55 seconds at 100 km/h and 75 seconds at 160 km/h; in contrast, the MBTA’s lumbering diesel locomotives, tugging coaches with narrow car-end doors with several steps, have a stop penalty of about 2.5 minutes at 100 km/h.

Going forward

The presentation makes it very clear what the value of MassDOT’s NSRL study is: at best none, at worst negative value through muddying the conversation with fraudulent numbers. The Office of Transportation Planning is swamped and could not produce a good study. The actual control was political: Governor Baker and Secretary of Transportation Pollack do not want NSRL, and both the private consultant that produced the study and the staff that oversaw it did what the politicians expected of them.

Heads have to roll if Massachusetts is to plan good public transportation. The most important person good transit activists should fight to remove is the governor; however, he is going to be easily reelected, and replacing the secretary of transportation with someone who does not lie to the public about costs is an uphill fight as well. Replacing incompetent civil servants elsewhere is desirable, but the fish rots from the head.

Activists in Rhode Island may have an easier time, as the state is less hostile to rail, despite the flop of Wickford Junction; they may wish to demand the state take lead on improving service levels on the Providence Line, with an eye toward forcing future NSRL plans to incorporate good regional rail practices. In New Hampshire, provided the state government became less hostile to public investment, activists could likewise demand high-quality commuter rail service, with an eye toward later connecting a North Station-Nashua-Manchester line to the South Side lines.

But no matter what, good transit activists cannot take the study seriously as a planning study. It is a political document, designed to sandbag a rail project that has high costs and even higher benefits that the governor does not wish to manage. Its cost estimates are not only outlandish but brazenly so, and its insistence that the Kennedy School study does not include contingency is so obviously incorrect that it must be considered fraud rather than a mistake. Nothing it says has any merit, not should it be taken seriously. It does not represent the world of transportation planning, but rather the fantasies of a political system that does not understand public transportation.

Reverse-Branching Does not Save You the Transfer

I wrote a detailed proposal about why New York should deinterline, and how. I got a lot of supportive comments (in the transit blogging sense, i.e. nitpicking), but also some pushback, arguing that people like their one-seat rides, and making them transfer under a more coherent system would make their riding experience worse. I could go on about how London is facing the same problem and is choosing to invest a lot of money into deinterlining in order to increase train capacity, but in the case of New York, there’s a blunter answer: what one-seat ride? The extent of reverse-branching on the subway does not really give people one-seat rides, and New York City Transit is making service decisions that do not maximize one-seat rides even when doing so would be relatively painless.

Outer branches

Most outer branches with just one route naturally offer direct service to the route’s trunk line. Let’s look at the current subway_map, and compare it with my proposed deinterlining, which is again this:

Today, riders on the West End Line only have service on the D, so they only have a one-seat ride to Sixth Avenue. Riders on the Sea Beach Line only have the N, and riders on the local Brighton Line trains only have the Q, so they only have one-seat rides to the Broadway express trains, and if they want to travel to Prince Street or 8th Street-NYU on the R they have to change trains at Canal, which is not a cross-platform transfer. Only a handful of stations get genuine choice between the two trunk lines: 36th Street on the D and N, and the inner few express stops on the B and Q, say up to Newkirk Avenue. These are express stops, with more ridership than the locals, but they’re not the majority of ridership on the subway in Southern Brooklyn. The majority of riders have to deal with the drawbacks of both reverse-branching (slow, infrequent trains) and coherent service (fewer one-seat rides).

Queens Boulevard has the same situation: local and express patterns mix up in a way that makes the choice of one-seat rides much weaker than it appears on the map. Riders at the local stations can choose between the M and the R, two trains that are never more than a few blocks apart in Midtown; only one station on either line is inconvenient to access from the other, 57th Street/7th Avenue, the least busy stop on the Broadway Line in Midtown on a passengers per platform basis (49th and 5th have less ridership but have two platform tracks and no Q service). The express stops get more serious choice, between the E and F, but those are just three stations: Jackson Heights-Roosevelt Avenue, Forest Hills-71st Avenue, and Kew Gardens-Union Turnpike. Queens Plaza has E, M, and R service, but passengers actually getting on at Queens Plaza can equally get on at Queensboro Plaza and ride the N, W, or 7.

Genuine choice between two relatively widely-separated trunk lines on the same trunk only exists in two and a half places in New York: the Central Park West Line offers a choice between the B and C trains, the Nostrand Avenue Line offers a choice between the 2 and 5 trains, and the inner half of the White Plains Line offers a choice between the 2 and 5 trains off-peak (at the peak the 5 runs express, so local stations only get the 2).

Cross-platform transfers

New York is blessed with cross-platform interchanges, usually between local and express trains on the same line. Riders on the 1 train are used to transferring to the 2 and 3 trains cross-platform at 96th Street; in the morning, the 1 train’s busiest point is actually from 103th Street to 96th, and not heading into Midtown. With 170,000 boardings at its stations north of 96th per weekday, the 1 is much busier than Nostrand (with 60,000 weekday boardings) or the combined total of local Central Park West stations from 72nd to 116th (with 65,000 boardings). It’s also slightly busier than the White Plains Road Line, let alone the inner segment with both 2 and 5 service (which has 95,000 boardings).

In Queens, a similar situation occurs on the 7. The stations east of Queensboro Plaza, excluding 74th Street-Broadway (where the transfer to the Queens Boulevard Line is), have a total of 215,000 weekday boardings. The trains fill at the outer end and then discharge at 74th Street as most passengers transfer, not cross-platform, to the faster Queens Boulevard Line; then they fill again at the stations to the west and discharge at Queensboro Plaza, which has a cross-platform transfer to the N and W.

This is relevant to some of the few segments of the subway where reverse-branching offers choice between different trunk lines. Passengers on the Nostrand Avenue Line could transfer cross-platform at Franklin Avenue, where the platforms aren’t much narrower than at 96th Street and Broadway, where passenger volumes are almost three times as high. Similarly, passengers on the Central Park West Line and its branches to Washington Heights and Grand Concourse could transfer cross-platform at 125th Street or at Columbus Circle; Columbus Circle is extremely busy already with origin-and-destination traffic, and the interchanges between local and express passengers could not possibly overwhelm it.

Only one place has a difficult connection: 149th Street-Grand Concourse, the interchange between the 2, 4, and 5 trains. This also happens to be the most difficult deinterlining project in general, because of the merger of the 2 and 3 further south; it requires either closing the northernmost two stations on the 3, or opening up a few blocks of Lenox Avenue to construct a pocket track. Because of the disruption involved, this project can be left for last, and come equipped with more passageways at 149th Street, just as London is first deinterlining the Northern line to the south (raising peak capacity on the Bank branch from 26 trains per hour to 32) and leaving the north for later (which would raise capacity further to 36 tph).

NYCT has deinterlined in the past

Upper Manhattan witnessed two deinterlinings in the second half of the 20th century, one in the 1950s and another in the 1990s. The service NYCT inherited from its three predecessor networks had systematic route nomenclature taking into account conventional and reverse branching.

On the IRT, West Side trains were numbered 1 (to Van Cortlandt Park), 2 (to the White Plains Road Line), and 3 (to Harlem-148th Street), and Lexington trains were numbered 4 (to the Jerome Avenue Line), 5 (to the White Plains Road Line), and 6 (to the Pelham Line); 2, 4, and 5 trains ran express, 3 and 6 trains ran local, and 1 trains could be either local or express. In the 1950s, NYCT changed this system on the West Side so that all 1 trains became local and all 3 trains became express. This was the result of track layout: the junction at 96th Street is flat if 3 trains have to cross over to the local tracks and 1 trains have to cross over to the express tracks, but under today’s present service pattern there are no at-grade conflicts. NYCT chose capacity and reliability over offering one-seat rides from West Harlem and Washington Heights to the express tracks.

On the IND, trains were identified by letters. A, C, and E trains ran on Eighth Avenue and B, D, and F trains on Sixth Avenue; A and B trains went to Washington Heights, C and D trains to Grand Concourse, and E and F trains to the Queens Boulevard Line. Local and express trains were identified using letter doubling: a single letter denoted an express train, a doubled one (e.g. AA) a local. The single vs. double letter system ended up discontinued as few trains consistently run express (just the A and D) and several run a combination of local and express (the B, E, F, N, and Q), and NYCT slowly consolidated the trains on Eighth and Sixth Avenue until there were only seven services between them. Eventually the B and C switched northern terminals, so that now the C runs as the local version of the A and the B as something like the local version of the D. Passengers in Washington Heights who wish to use Sixth Avenue Line have to transfer.

The situation on the IND wasn’t as clean as the deinterlining on the IRT. But it shows two important things. First, changes in train service have made the original reverse-branching less tenable from an operational perspective. And second, the value of a one-seat ride from Washington Heights or Central Harlem to local tracks is limited, since everyone takes the express train and transfers at Columbus Circle.

How Deinterlining Can Improve New York City Transit

New York is unique among the major subways of the world in the extent of interlining its network has. All routes share tracks with other routes for part of the way, except the 1, 6, 7, and L. The advantage of this system is that it permits more one-seat rides. But the disadvantages are numerous, starting with the fact that delays on one line can propagate to nearly the entire system, and the fragile timetables lead to slower trains and lower capacity. New NYCT chief Andy Byford just released a plan calling for investment in capacity, called Fast Forward, focusing on accessibility and improved signaling, but also mentioning reducing interlining as a possibility to increase throughput.

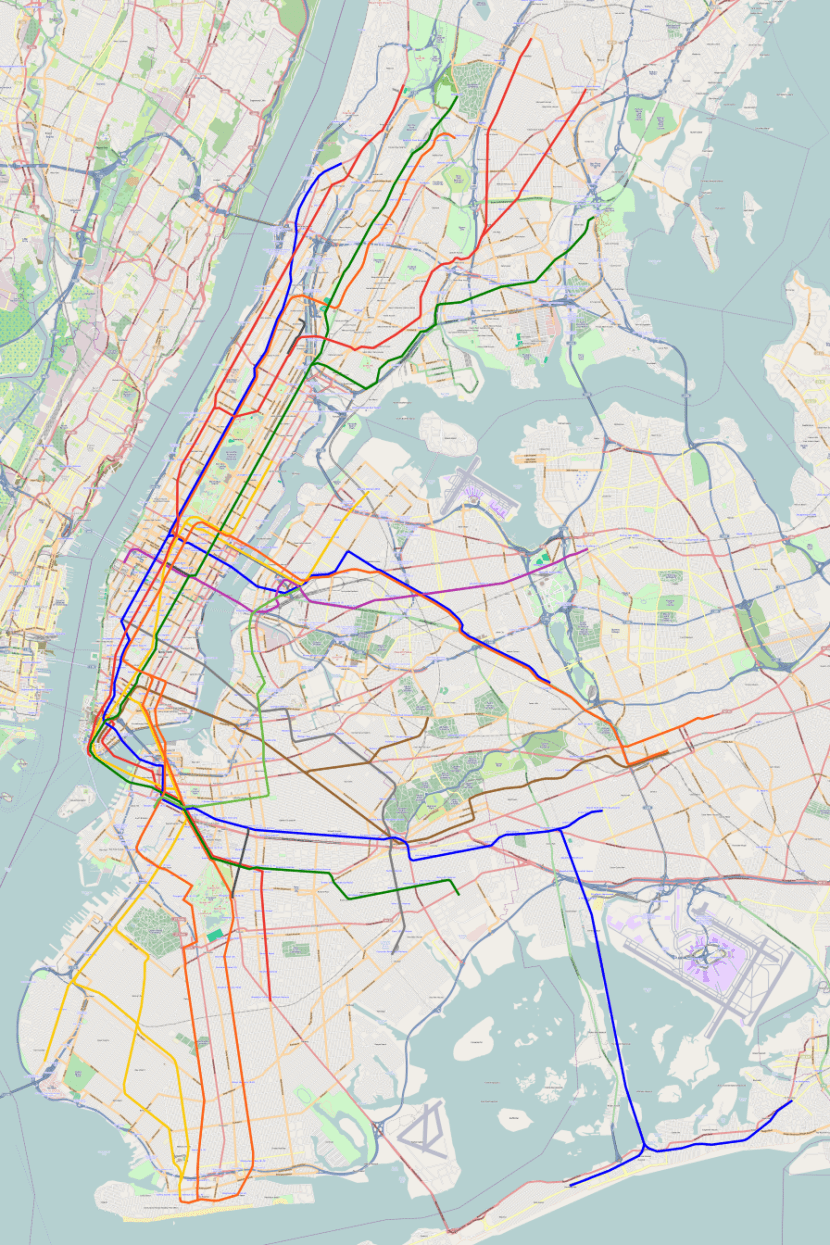
I covered the interlining issue more generally in my article about reverse branching, but now I want to explain exactly what it means, having learned more about this issue in London as well as about the specifics of how it applies to New York. In short, New York needs to reduce the extent of reverse branching as much as possible to increase train speed and capacity, and can expect serious gains in maximum throughput if it does so. It should ultimately have a subway map looking something like this:

Lessons from London

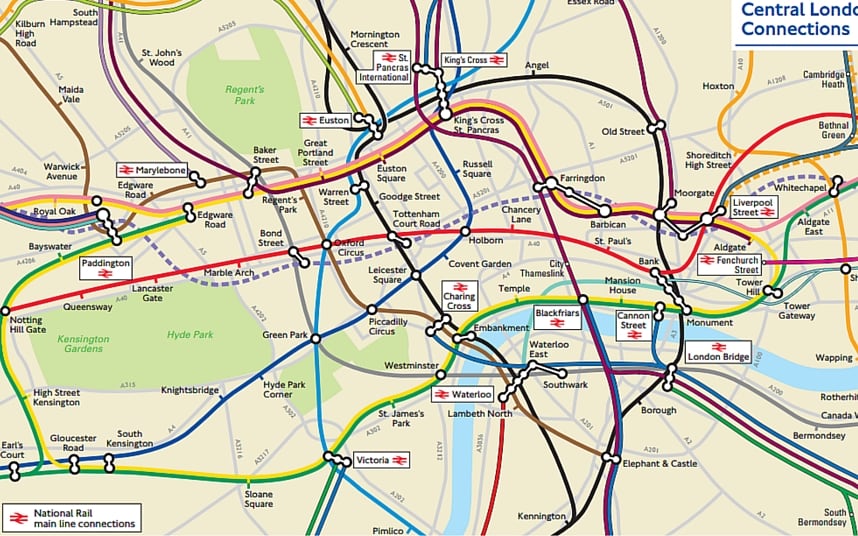
In London, there is extensive interlining on the Underground, but less so than in New York. The subsurface lines form a complex interconnected system, which also shares tracks with one branch of the Piccadilly line, but the Northern, Central, Victoria, Jubilee, and Waterloo and City lines form closed systems (and the Bakerloo line shares tracks with one Overground line). The Northern line reverse-branches: it has two central trunks, one through Bank and one through Charing Cross; one southern segment, with through-trains to both trunks; and two northern branches, each sending half its trains to each trunk. The other closed systems have just one trunk each, and as a result are easier to schedule and have higher capacity.

As the Underground moves to install the same high-capacity signaling on more and more lines, we can see what the outer limit of throughput is on each system. The Northern line’s new moving-block signaling permits 26 trains per hour on the Bank trunk and 22 on the Charing Cross trunk. When the Battersea extension opens, reverse branching on the south will end, pairing the older line to Morden with Bank and the new extension with Charing Cross, and capacity will rise to 32 tph per trunk. Planned improvements to transfer capacity at Camden Town, the northern branch point, will enable TfL to permanently pair each northern branch with one central trunk, raising capacity to 36 tph per trunk. Moreover, TfL expects moving block signaling to raise District line capacity from 24 tph to 32, keeping the current reverse branching. The Victoria line already runs 36 tph and the Jubilee line soon will too, while the Central line runs 35 tph. So 36 vs. 32 seems like the difference coming from the final elimination of reverse branching, while more extensive reverse branching reduces capacity further.

The reason complex branching reduces capacity is that, as delays propagate, the schedule needs to incorporate a greater margin of error to recover from unexpected incidents. It also slows down the trains, since the trains are frequently held at merge points. The general rule is that anything that increases precision increases capacity (such as automation and moving block signaling) and anything that reduces precision reduces capacity; reverse branching reduces timetable precision, because each train can be delayed by incidents on more than one line, making delays more common.

What deinterlining in New York entails

NYCT has its work cut out for it when it comes to deinterlining. There are eight different points in the system where reverse-branching occurs – that is, where lines that do not share track in Manhattan (or on the G trunk outside Manhattan) share tracks elsewhere.

  1. The 2 and 5 trains share tracks on the Nostrand Avenue Line.
  2. The 2 and 5 also share tracks in the Bronx.
  3. The A and C trains share tracks on the two-track narrows through Lower Manhattan and Downtown Brooklyn.
  4. The A and D share the express tracks on Central Park West while the B and C share the local tracks.
  5. The E and F share the express tracks on Queens Boulevard, while the M and R share the local tracks, the E and M share the tunnel from Queens to Manhattan, and the N, R, and W share a different tunnel from Queens to Manhattan.
  6. The B and Q share tracks in Brooklyn, as do the D and N.
  7. The F and G share tracks in South Brooklyn.
  8. The M shares the Williamsburg Bridge tracks with the J/Z but runs in Manhattan on the same tracks as the F.

NYCT should work to eliminate all of the above reverse branches. The easiest to start with is #6: the junction at DeKalb Avenue should be set to keep the B and D trains together and to keep the N and Q together rather than to mix them so that the B shifts to the Q tracks and the D to the N tracks. This requires no changes in physical infrastructure, and has especially high benefits as the junction delays trains by several minutes in each direction. Moreover, the loss of one-seat rides is minimal: the BDFM and NQRW run closely parallel in Manhattan and intersect with a transfer at Herald Square in addition to the inconveniently long BQ/DNR transfer at Atlantic Avenue.

Another relatively easy reverse branch to eliminate is #8, a recent introduction from the 2010 service cuts. Previously, today’s M route in Queens and Manhattan was covered by the V train, which turned on the Lower East Side, while the M ran the same route as the J/Z, merging onto the R and thence the N in Brooklyn at rush hour. Today’s route is thus an M-V merger, which railfans including myself hoped would help decongest the L by creating an alternative route from Williamsburg to Midtown. Unfortunately, such decongestion has not happened, perhaps because gentrification in Williamsburg clusters near the L and not near the J or M.

Harsh decisions

Fixing the reverse-branching at DeKalb Avenue and on the Williamsburg Bridge is painless. The other reverse branches require a combination of hard decisions and new infrastructure.

Fixing reverse branches #3 and #4 requires no capital investment, just political will. Reverse branch #4 is there because there’s demand for two routes’ worth of capacity in the tunnel from Brooklyn but there’s only one express line on Eighth Avenue, and that in turn is the result of reverse branch #3; thus these two issues should be tackled together.

NYCT should decide between having the A and C trains run express between 145th and 59th Streets and the B and D trains run local, or the other way around. This is not an easy decision: either Washington Heights or Grand Concourse would get consigned to local trains. North of 145th the total number of boardings is 102,000 at B/D stations compared with 79,000 on the A/C, but conversely Concourse riders can change to the express 4 trains whereas Washington Heights’ only alternative is the local 1. However the A and C run, express or local, the E should run the opposite in Manhattan – it can merge to either the local or express tracks – and the express trains should continue to Brooklyn. The map I made doesn’t distinguish local from express service, but my suspicion is that Washington Heights should get express trains, on account of its long commutes and lack of fast alternatives.

The same problem of harshness occurs in reverse-branch #5. In theory, it’s an easy fix: there are three track pairs in Queens (Astoria, Queens Boulevard local, Queens Boulevard express) feeding three tunnels to Manhattan (63rd, 60th, and 53rd Streets). In practice, the three Manhattan trunks have astonishingly poor transfers between them in Midtown. Nonetheless, if it does nothing else, NYCT should remove the R from Queens Boulevard and route all 60th Street Tunnel trains to Astoria; together with fixing DeKalb Avenue, this would separate the lettered lines into two closed systems, inherited from the BMT and IND.

However, undoing the connection between the BMT and the IND probably requires constructing a transfer station in Long Island City between Queensboro Plaza and Queens Plaza, which involves a few hundred meters of underground walkway. Even then, the connection cannot possibly be convenient. The saving grace is that Eighth Avenue, Sixth Avenue, and Broadway are close enough to one another that passengers can walk to most destinations from any line.

Subsequently, NYCT should make a decision about whether to send express Queens Boulevard trains to 63rd Street and Sixth Avenue and local trains to 53rd and Eighth, as depicted in the above map, or the other way around. The problem is that the merge point between 53rd and 63rd Street Tunnels is one station east of Queens Plaza, at a local station, and thus the true transfer point is Roosevelt Avenue, far to the east. Riders on the local stations west of Roosevelt would get no choice where to go (though they get little choice today – both the E and M serve 53rd Street, not 63rd). The argument to do things as I depict them is to give the local stations access to 53rd Street; the argument to switch the lines is that there is more demand on 53rd than 63rd and also more demand on the express tracks than the local tracks, so the busiest lines should be paired. However, this in turn runs into turnback capacity limitations on the E in Manhattan, at the World Trade Center bumper tracks.

Potentially, NYCT could try to convert 36th Street into an express station, so that passengers could connect cross-platform. But such a dig would be costly and disruptive to operations. There were plans to do this at 59th Street on the 1/2/3 a few decades ago, for the transfer to the A/B/C/D, but nothing came of them.

Where new infrastructure is needed

The remaining reverse branches get increasingly more difficult. Already #7 requires new turnouts. The South Brooklyn trunk line has four tracks, but there’s not enough demand (or space in Manhattan) to fill them, so only the local tracks are used. There are occasional railfan calls for express service using the F, but it’s better to instead use the express tracks to segregate the G from the F. The G could be turned at Bergen Street on the local tracks, while the F could use the express tracks and then transition to the locals on new turnouts to be constructed at Carroll Street.

Also in the category of requiring new turnouts is #1: Rogers Avenue Junction is set up in a way that briefly forces the 2, 3, and 5 trains to share a short segment of track, limiting capacity. This can be resolved with new turnouts just east of the junction, pairing Nostrand Avenue Line with the local tracks and the West Side and the portion of the Eastern Parkway Line east of Nostrand with the express tracks and the Lexington Avenue Line. Trains on Eastern Parkway could either all go local, or keep the current mixture of local trains to New Lots (currently the 3) and express trains to Utica (currently the 4), skipping a total of two stations. This fix also reduces passengers’ access to one-seat rides, but at least there is a reasonable cross-platform transfer at Franklin Avenue, unlike on Queens Boulevard or at 145th Street and St. Nicholas.

And then there is #2, by far the most difficult fix. Demand on the White Plains Road branch in the Bronx is too strong to be a mere branch: the combined number of boardings at all stations is 166,000 per weekday, and besides, the line branches to Dyre Avenue near its outer end and thus needs the frequency of either a trunk or two branches to ensure adequate service to each other branch. This is why it gets both the 2 and 5 trains. There is unfortunately no infrastructure supporting a switch eliminating this track sharing: the 4 and 5 trains could both use this line, but then the 2 has no way of connecting to Jerome Avenue Line without new tunnels.

On the map, I propose the most obtrusive method of fixing this problem: cutting the 3 trains to a shuttle, with a new pocket track at 135th Street, letting passengers transfer to the 2, ideally cross-platform. With all through-trains running on the 2, there is no need (or space) for the 5 on White Plains Road, and instead the 5 should help boost the frequency on Jerome Avenue. In addition, some work is required at Woodlawn, which currently has bumper tracks, fine for a single branch but not for a non-branching trunk line (the bumper tracks on the L limit throughput to 26 tph no matter how good the electronics are).

Additional infrastructure suggested by deinterlining

Deinterlining is a service increase. Lines that today only get half or two-thirds service would get full trunk frequency: Second Avenue Subway would get the equivalent of the Q and N trains, the Astoria Line would get the entirety of 60th Street Tunnel’s capacity, Eighth Avenue would get more express trains, and 63rd Street Line and the South Brooklyn Line would get more than just the half-service of the F. With six track pairs on the lettered lines through Midtown and six north and east (Central Park West*2, Second Avenue, Astoria, Queens Boulevard*2), there is no room for natural branching to give more service to busy areas than to less busy ones.

One solution to this situation is targeted development on weak lines. Even with half service, South Brooklyn has underfull F trains, and Southern Brooklyn’s B, D, N, and Q trains aren’t much busier, making this entire area an attractive target for upzoning.

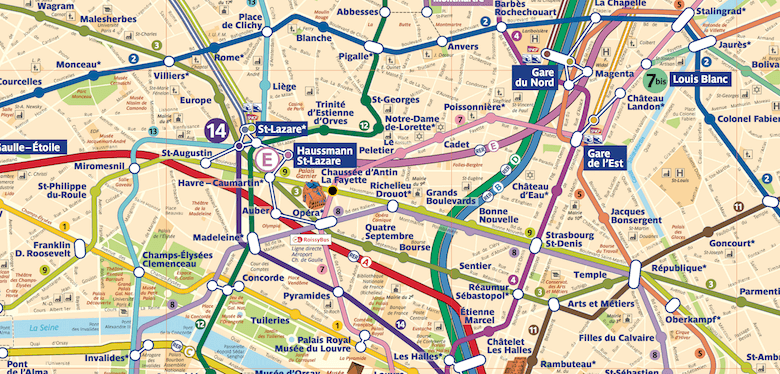
However, it’s more interesting to look at lines with extensions that suggest themselves. Second Avenue Subway has the obvious extension north to Harlem in phase 2, and a potential subsequent extension under 125th Street to Broadway, which is less obvious but popular among most area railfans (including one of my inside sources at NYCT). The Astoria Line has a natural extension to LaGuardia, ideally elevated over Ditmars to capture local ridership on Astoria as well as airport traffic; while the steel el structures in New York are soundboxes, it is possible to build quieter els using concrete (as on the 7 el over Queens Boulevard in Sunnyside) or a mixture of concrete columns and a steel structure (as on the Metro 2 and 6 els here in Paris).

The Nostrand Avenue Line provides an especially interesting example of a subway extension suggested by deinterlining. The terminal, Flatbush Avenue, was intended to be temporary, and as a result has limited turnback capacity. To prevent it from constraining the entire 2 route, which became the city’s most crowded even before Second Avenue Subway began decongesting the 4 and 5, it would be prudent to extend the line to Sheepshead Bay as the city intended when it planned the line in the 1910s.

In contrast, a subway extension under Utica, a stronger bus corridor than Nostrand with a strong outer anchor at Kings Plaza, loses value under deinterlining. It could only get a branch and thus have lower capacity than Nostrand. It would also definitely force branching on the express trains, whereas without such an extension they could run as a single unbranched line between Woodlawn and New Lots Avenue via Jerome Avenue, Lexington Avenue, and Eastern Parkway. A Utica subway should wait until there is political will to fund an entirely new crossing into Manhattan, presumably via Williamsburg to help decongest the L.

A second extension I have occasionally mooted, a subway under Northern, loses value even more. Such a subway would be a fourth trunk line in Queens and have to come at the expense of capacity on Queens Boulevard. It is only supportable if there is an entirely new tunnel to Midtown, passing under the mess that is the tracks in Long Island City.

A deinterlined New York City Subway

Fast Forward proposes moving block signaling on the most crowded subway segments, but typically only on trunks, not branches, and in some cases not even entire trunks. But in the long term, New York should transition to moving blocks and automation on all lines – at the very least the highly automated system used on the L, but ideally fully driverless operation, in recognition that wages are going up with economic growth but driver productivity isn’t. Simultaneously, deinterlined operations should allow tph counts in the mid 30s or even more (Metro 13 here runs 38 tph and Metro 14 runs 42).

Instead of the potpourri of lines offered today, there would be fewer, more intense lines. Nomenclature would presumably change to deal with the elimination of some services, clarifying the nature of the subway as a nine-line system in which five lines have four tracks and four lines have two. Each of these fourteen track pairs should be able to support a train every 90-105 seconds at the peak; not all lines have the demand for such frequency, and some have capacity-limiting bumper tracks that aren’t worth fixing (e.g. the 1 at Van Cortlandt Park), but many lines have the infrastructure and the demand for such capacity, including the express lines entering Midtown from Uptown or Queens.

Off-peak, too, service would improve. There is ample capacity outside rush hour, but turning the system into one of lines arriving every 4-5 minutes with strategic transfers rather than every 8-10 minutes would encourage people to take the trains more often. The trains would simultaneously be faster and more reliable, since incidents on one line would wreck service on other trains on the same line but leave the rest of the network unaffected.

With service improvements both during and outside rush hour, New York could expect to see substantial increases in ridership. Raising peak frequency from the current 24 tph to 36 tph on the busiest lines (today’s 2/3, 4/5, A/D, and E/F) is equivalent to building an entirely new four-track subway trunk line, and can be expected to produce similar benefits for passengers. The passups that have become all too familiar for riders on the 4, L, and other busy trains would become a thing of the past unless ridership rose 50% to match the increase in capacity.

Process for the Sake of Process

A Patreon poll in April asked about political blogging, offering three options: policy certainty in housing, process for the sake of process, and lawsuits and corruption of process. The second option won.

The year is about 2008. A wee grad student and former political blogger in New York is getting interested in transportation policy, and through past connections to political bloggers gets acquainted with a progressive local thinktank called Drum Major Institute, which advocates for all the right priorities of the center-left. One of these priorities is densification and urban growth. The relevant DMI fellow talks about the need to upzone in the city to permit smart growth. The wee grad student asks, why even have zoning at all? Why not let developers build to any density they’d like? The DMI fellow says that zoning is necessary in order to permit planners to have control over where development goes, and doesn’t explain what this control is useful for in the first place.

Fast forward to this decade. Cities install infrastructure for livable streets. Bikeshare revolutionizes cycling, first via the docked systems of Paris, Wuhan, and Hangzhou, and subsequently via the dockless systems developed in the largest Chinese cities. Simultaneously, all over the developed world cities reallocate space away from cars, whether it’s via bus lanes, bike lanes, wider sidewalks, or freeway removal. This trend has generally earned the support of people who support livable streets or are generally progressive. There may be individual pieces of criticism: for example, East Harlem railed against New York’s original decision not to extend bike lanes on First and Second Avenues to its community, and thankfully the city listened after a few years and did extend them. But these criticisms tend to be specific to one issue and constructive.

But then there are the NIMBYs, whose rallying cry is “they didn’t ask us.” In San Francisco, the Mission left-wing community activist group Calle 24 attacked the city for extending bikeshare to the Mission, on grounds that include gentrification but also the process line: “we weren’t consulted.”

There are many defenses of process that do justify its importance. I interviewed Aaron Ritz and Waffiyah Murray at Indego, Philadelphia’s publicly-run docked bikeshare system, which has somewhat better reach to low-income and black residents than systems like Chicago’s Divvy and Washington’s Capital Bikeshare. They gave me concrete examples of how Indego’s community outreach was helpful: it gave the planners tips on the best station siting (e.g. where the community centers are) as well as on different ways different socioeconomic groups use bikeshare (e.g. black Philadelphians are likelier to think of cycling as fun rather than transportation and thus prefer station locations near recreational trails).

But simultaneously there are defenses of process for its own sake. Zoning is the biggest example: the actually useful aspects of urban zoning are so few and far between, and so disconnected from current practice, that there is no coherent defense of the existence of zoning boards. The common arguments used by neighborhood groups (overdevelopment, infrastructure, gentrification, etc.) range from manifestly false to manifestly selfish (property values).

On various YIMBY message boards, there has been a discussion of an alternative zoning code to standard low-density zoning. People discussed form-based codes or transit-oriented development regimes like that of SB 827 in California, and as a first stab I proposed the following at Open New York:

1. Land is residential, commercial, or industrial. Industrial gets set by regional or statewide commission taking into account manufacturing jobs, prevailing winds, etc., and is distinguished in having looser pollution controls. Residential is allowed in commercial zones by right; doctors’ offices, lawyers’ offices, and other independent personal services are allowed in residential areas, as are hotels.

2. Retail is allowed in all commercial zones. Office is allowed in commercial zones that are specifically for office.

3. Commercial zones are allowed to encroach on adjacent residential land: residential land within a certain distance from majority-commercial uses gets automatically reclassified as commercial, and if the commercial uses are mostly offices then the land gets reclassified as office and not just retail.

4. Density is regulated based on distance from high-quality transit, which for the purposes of this discussion does not include buses that run every 15 minutes. The lowest category is not single-family and doesn’t have parking minimums, but allows around floor area ratio 1. The highest one has residential FAR 12, the maximum allowed by New York State, and is within very short distance from rapid transit (say, 500 meters intra muros, 200 extra muros). Everything within a kilometer of a train station is at least FAR 4.

I got “but what about ___?” responses re parking and what New York calls a sky exposure plane. This is a YIMBY group, and even there some people were uncomfortable that a proposed code was not exact enough so as to say exactly who is allowed to do what, instead going for the principle that what’s not forbidden is permitted. Even this attempt at a compromise didn’t win much support (what I actually believe is that if urban land is developable based on scientific understanding of environmental protection it should be developable for any purpose and at any density its owner sees fit).

Outside the YIMBY world, the pushback against such a loose code would be severe, because it would not offer local activists the control over their neighbors’ lives that they crave. San Francisco’s affordable housing community was against SB 827, partly because of misguided fears of gentrification, but also partly because the byzantine process in the city allows community groups to extort benefits by threatening to withhold project approval. In comments on my post about free trade in rolling stock, Adam points out that the California Environmental Quality Act was so weaponized by unions, who demanded that a new plant be unionized as a condition for dropping an environmental lawsuit. When corrupt local groups benefit from the ad hoc nature of the process, they will defend it for its own sake, regardless of whether it achieves its stated purpose (affordable housing, environmental protection, etc.).

But corruption alone can’t explain why outside groups like DMI think zoning is valuable for its own sake. My suspicion is that this is ideological: every regulation must have some purpose, so while revising regulations is fine, getting rid of them entirely reeks of free market libertarianism. Since the right attacks the civil service as bloated and parasitic, the left and center-left reflexively defend the civil service no matter what and, by extension, justify its mission. This pattern flips when it comes to the police, but that’s a narrow issue of criminal justice equality, not even affecting the fire department, which is socially similar to the police but gets no hate from the left. A regulator who decides who gets to build what and where does not have the reputation of a brutal cop or border control agent, and can expect sympathy for the left even if the zoning mission serves no useful purpose and creates problems for left-wing goals of affordable housing.

Which Older Lines Should Express Rail Have Transfers to?

In my writings about metro network design I’ve emphasized the importance of making sure every pair of intersecting lines have a transfer. Moreover, I’ve argued that missed connections often come from having very wide stop spacing, because large metro networks have very closely-spaced lines in the core, and if the stop spacing in the core is too wide, as in Moscow, then lines will frequently cross without transfers. In contrast, in Paris, where the Metro has very closely-spaced stops, there is only one missed connection on the Metro, between Lines 5 and 14. However, what’s missing from this discussion is what to do on lines that, due to network design, have to run express and miss some connections. This question mattered to most RER lines and currently matters to Crossrail and Crossrail 2, and will be critical in any New York regional rail plan.

I claim that the most important connections to prioritize should be to,

  1. The busiest lines.
  2. Lines that are orthogonal to the newly-built express lines.

But before explaining this, I’d like to go over the scale of the underlying problem of prioritizing transfers. For a start, look at the Underground in Central London:

Crossrail is the dashed gray line. Between Paddington and Liverpool Street, it intersects seven north-south lines, including five in rapid succession on the West End; stopping at all of Bond Street, Oxford Circus, Tottenham Court Road, and Holborn would slow down too much what’s intended to be an express relief line to the Central line.

Stopping between two stations and having transfers to both is possible – look at Farringdon-Barbican and at Moorgate-Liverpool Street – but results in very long transfer times. The RER has opted for this solution at Auber, which is located between the Opera and Saint-Lazare, with a transfer stretching over three successive stations on Line 3, leading to legendarily labyrinthine transfers between the RER and the Metro:

Observe that in contrast with the RER A’s convoluted transfer at Auber, the RER B simply expresses between Chatelet-Les Halles and Gare du Nord, missing the connection to the east-west Lines 3, 8, and 9 and the north-south Line 7, and only connecting to the circumferential Line 2 via a long underground passageway. The reason for this is that a transfer station at Bonne Nouvelle or Sentier would be very expensive to construct; the RER’s stations were all extremely costly, and the RER A’s record of $750 million per km for the Nation-Auber segment remains unbroken outside the Anglosphere. On Crossrail (the recordholder in cost per km outside the US, soon to be overtaken by Crossrail 2), it’s the stations that drive up costs as well, and the same problem is even more acute in New York.

The tension is then between the network effects of including more transfer points, and the costs and slowdowns induced by stopping more often. The first point in my claim at the beginning of this post follows immediately: it’s more valuable to stop at transfer points to busier lines. The RER A misses Line 5 entirely, as does the express Line 14, because Line 5 is so weak that it’s not worth it to detour from Gare de Lyon through Bastille to connect to it; the oldest plans for the RER A had a stop at Bastille and not at Gare de Lyon, but under SNCF’s influence the system was redesigned to connect to the train stations better and thus Bastille was replaced.

Whereas the RER A in theory connects to every north-south one except the weakest (although the second strongest after Line 4, Line 13, has an even longer connection than at Chatelet), Crossrail does the opposite. The busiest station in London excluding mainline stations is Oxford Circus, thanks to the three-way transfer of the Bakerloo, Victoria, and Central lines; the Victoria line is the busiest in the system per km (although the longer Northern and Central lines have more riders), and it’s certainly the busiest north-south trunk line. However, plans to have a transfer to both Bond Street and Oxford Circus were rejected in favor of a connection to Bond Street alone. The reason is that London’s low-capacity passageways get congested, and TfL’s hamfisted solution is to omit critical transfers, a decision also made at the Battersea extension of the Northern line, which will miss a connection to the Victoria line at Vauxhall.

This brings me to the second transfer priority: it’s the most important to connect to orthogonal lines. The reason is that parallel lines, especially closely parallel lines, are less likely to generate transfers. New York’s four-track subway lines have very high volumes of local-express transfers, because those are easy cross-platform interchanges; as soon as any walking between platforms is required (for example, on the Lexington Avenue Line at 59th and 86th Streets), transfer volumes fall dramatically. In Paris, transfers between Line 1 and the RER A happen, but usually for longer-distance travel; I find it faster to take Line 1 from Nation to Chatelet than to take the RER A, even without any transfer, purely because it’s easier to get between the street and the Metro platforms at both ends.

This issue was never really in contention when Paris built the original RER system. The one place where the RER prioritized a transfer to a same-direction Metro line over an orthogonal one, Gare du Nord, is such an important destination for commuter and intercity trains that it’s obviously justified to prioritize it over an easier connection to Line 2. However, more recently, the RER E has seen this issue surface with the location of the infill Rosa Parks station. The RER E could have sited a station at the intersection with Line 5, but Line 5 goes northeast and serves much the same area as the RER E, so the network effects from an interchange would be weak. Instead, the station is sited to interchange with the circumferential T3 tramway, which opens up a connection toward Nation and eventually toward Porte d’Asnieres.

In London, the same question is critical to the central route of Crossrail 2. The current plan has three Central London stops: Victoria, Tottenham Court Road (with a transfer to Crossrail), and Euston-St. Pancras. But Victoria itself is not much of a destination, and of the two lines served, the District and the Victoria, the Victoria line is parallel to Crossrail 2 rather than orthogonal to it. The purpose of Crossrail 2 is to add north-south capacity through the West End to decongest the Victoria line and reduce the shuffle at Victoria station between mainline trains and the Underground; to this end, there’s no need to stop at Victoria station itself.

To this effect, Martha Dosztal proposes moving Crossrail 2 to Westminster or possibly Charing Cross. Instead of spending $2 billion on a station at Victoria, London would need to spend probably a comparable amount on a station that interchanges with lines that go northwest-southeast like Jubilee or Bakerloo rather than on the parallel Victoria line; moreover, Westminster and Charing Cross both have connections to the District line, so Crossrail 2 would still connect to all three east-west Underground lines.

Finally, the application to New York is the most delicate. New York’s scores of missed connections come from deliberate indifference on the IND’s part to transfers with the older lines rather than any systematic attempt at prioritizing important interchanges; the older IRT and BMT systems have between them just two missed connections (3/L in Brooklyn, 4-5/R-W in Lower Manhattan). But including better connections in the event the city builds more rail lines remains critical. Second Avenue Subway gets this right by having a cross-platform transfer to the east-west F; there’s no transfer to the north-south Lexington Line, but this is less important given Second Avenue’s role as a Lexington relief line.

Regional rail transfers are especially circumscribed in New York given the system’s nature as a few short tunnels: new tunnels across the Hudson, and ideally a connection between Penn Station and Grand Central. This is why there is little room for improving connectivity between the subway and what I call Lines 1-3 of New York regional rail. However, the priorities I’m advocating in this post suggest two important things about Penn Station: first, it’s important to reopen passageways to Sixth Avenue to allow connections to the NQRW and BDFM trains; and second, it’s not important to have a connection to the 7 at Hudson Yards, as IRUM proposes.

On more speculative lines involving longer tunnels, the same priorities point to my proposed stopping pattern in and around Lower Manhattan. What I call Line 4, a north-south line from Grand Central to Staten Island stopping at Union Square and Fulton Street would intersect the east-west subways: the 7 at Grand Central, the L at Union Square, and PATH and most Brooklyn-bound trains at Fulton Street. The only missed subways – the F/M at Houston Street and the N/Q at Canal – go mostly north-south (except the M, which has a same-platform transfer with the J/Z, connecting at Fulton). Likewise, what I call Line 5, connecting from Pavonia to Atlantic Terminal, would connect to most north-south subways at Fulton Street.

Ideally, it’s better to make every interchange, and subway builders around the world should aim for very long-term planning in order to prevent missed connections in the future. However, when the inevitable changes happen and missed connections are unavoidable, there are emergent rules for which are more important: busier lines are more important than less busy lines, and less obviously, lines that are orthogonal to the new line are more important than ones that are parallel. These priorities make it possible to build express lines that maximize regional connectivity with minimal loss of travel time due to making local stops.

Zoning and Commercialization

YIMBY is a movement that calls for liberalizing land use in order to produce more housing. However, its take on non-residential development is more complicated. I’d always assumed that San Francisco YIMBY was not calling for more commercial development because the Bay Area already builds a lot of office space because of California’s tax incentives, which let municipalities raise taxes on sales but not residential property; however, as a check on this hypothesis I asked YIMBYs in New York, but they too said that office upzoning wasn’t really a priority and only cited mixed projects to me. This approach is usually harmless, but in a few places it creates serious long-term problems, and one of them is the center of SF YIMBY, the South of Market (“SoMa”) area, and the reason is commercialization of near-CBD neighborhoods.

A few months ago I wrote about job sprawl in the US vs. in Europe. In Europe, hostility to high-rise office buildings in most historic city centers has caused jobs to spread to neighborhoods near the CBD, often in the direction of the favored quarter; in the US, CBDs have office towers, but everything right outside them is usually strictly zoned, so jobs sprawl to suburban office parks. Both situations have a number of exceptions (e.g. Kista and La Defense are both examples of high-rise edge cities independent of the CBDs, while Kendall Square and Back Bay are contiguous extensions of the Boston CBD), but for the most part they apply in their respective areas.

In the same way that on a wider scale building more housing in New York and San Francisco would reduce the demand for housing in the places to which these cities’ working and lower middle classes have been pushed out, building more office space in city centers would reduce the demand for suburban office parks. Permitting jobs to move back from suburban edge and edgeless cities to city centers is a good thing, both for urbanism and for transit: for urbanism, the CBD is accessible from all directions (which is why it’s so valuable to begin with), and for transit, congested CBDs tend to maintain decent transit mode shares even in otherwise completely auto-dominated cities.

The political problem is that this requires replacing residential development with commercial development. It’s questionable but possible in European zoning regimes. In the US it’s harder, for several reasons:

  • Near-CBD neighborhoods are as far as I can tell never middle or lower middle class. They’re either very poor (though by now they’ve all been urban-renewed) or rich. The greater extent of local empowerment in the US makes it harder to permit office development in rich areas over NIMBY objections.
  • American residential zoning is stricter than at least German residential zoning, and as far as I can tell is also stricter than French residential zoning, in that it permits no commercial uses at all, except ground-floor retail on main streets. In particular, doctors, lawyers, and accountants’ offices must go in designated commercial zones in the US.
  • American cities are more likely to have low-density neighborhoods in desirable near-downtown areas (for example, Georgetown) and defend their character fiercely through single-family zoning.

While all three factors seem important, the biggest examples of American near-CBD NIMBYism trigger only the first factor. In New York, the main example right now is the Meatpacking District, where there is extensive commercial demand (Google is located there and so do some other tech firms), which already has fairly high residential density, but the residents are rich homeowners who have successfully fought off attempts to build more office space. Historically, Midtown arose this way – rich areas around Fifth Avenue commercialized until the city’s 1916 zoning code put a stop to the practice.

And this brings me back to this post’s motivating example – SoMa. Located right next to the Financial District, with equally good access as the Financial District to the BART and Muni subway spine on Market Street, and better access to Caltrain’s 4th and King terminal, SoMa is a prime target for commercialization. Unfortunately, SF YIMBY opposes this process, saying the city’s zoning plan should add housing there and not office space. The argument is that permitting mostly office space in SoMa would create more demand for housing elsewhere in the Bay Area, exporting San Francisco’s high rents to Oakland and other East Bay cities. Unwittingly, SF YIMBY has turned into a NIMBY group when it comes to the highest and best use in the neighborhood in which it is the strongest.

To SF YIMBY’s credit, it recognizes the similarity between today’s tech workers (who form the vanguard of YIMBY) and last generation’s (who bought houses when they were cheaper than today and form one of several vanguards of area NIMBYism) and is pursuing preemption laws that reduce its own ability to object to growth. But, as preemption is not yet the law, SF YIMBY is opposed to commercialization in its own back yard.

The more specific argument SF YIMBY uses is about jobs-to-bedrooms ratio. Per YIMBY, zoning should have a maximum jobs-to-bedrooms ratio within a neighborhood or city, to prevent creating too much housing demand in other Bay Area cities. Right now, the Proposition 13 regime is such that municipalities derive tax revenues from commercial development but not so much residential development, and so they favor office space. But in reality, the only jobs-to-employed-residents ratio that’s sustainable this way is 1, a ratio that’s far too low for a city that has suburbs, let alone a central neighborhood such as SoMa. The consensus SF YIMBY proposes – an even balance between residential and commercial development everywhere, achieved through preference for housing in areas that are net recipients of inbound commuters – is thus untenable in a major metro area.

The proposed SF YIMBY consensus also does nothing to unseat the current consensus in favor of sprawl. Contrary to the narrative of selfish suburbs that add office space but no housing, the Silicon Valley suburbs are fiercely NIMBY toward high-density office development. Google could never hope to build a supertall skyscraper on top of Mountain View’s train station; it can’t even get permission to build a bridge to let the Googleplex expand to a nearby office park.

The selfish suburbs’ preference is not just office but also sprawl, and blocking commercial development in San Francisco increases sprawl in two distinct ways. First, the tech companies that would like to expand in SoMa – Uber, Slack, Airbnb, and so on – would, if not permitted to build more office space, open more back offices in sprawling areas, in or outside the Bay Area. And second, office development in the suburbs is only accessible to people from one wedge of the metro area, which encourages people to move to exurbs on the outer side, for example Gilroy for development in San Jose.

To counteract the tendency of hyperlocal planning to produce sprawl and replace the single-family housing consensus, the consensus YIMBY should seek is not about managing office-to-residential space ratios, but about letting places densify in whatever ways the market deems to have the highest and best use. In a high-demand place like San Francisco or New York, this means a consensus in favor of a bigger, faster-growing city, using its high productivity to add more people, offices, and apartments, rather than to increase the property values of the incumbents. Plan for long-term growth and long-term changes in zoning rules and don’t play the demand suppression game that NIMBYs love.

Little Things That Matter: Circulation at Transfer Stations

I’ve written before about some problems of metro network design in large cities. In brief, it’s important to maximize network effects in a multi-line system, which means offering plenty of transfers between lines. The perfect network should have every pair of lines intersecting in the center with a transfer, with possible additional intersections outside the center, again with transfers. In practice, it never works quite this way. There are always compromises, based on particular historical and geographical details of city layout. But probably the single biggest contributor to the issue is transfer capacity. This issue also has independent interest, but the two worst examples I know of involve the central transfer points of London and Paris, where many lines converge.

For a start, it’s worth asking why even have multiple stations. Why not just build a perfect star-shaped system? Two-line subway networks usually just cross once in city center. Three-line networks can intersect at one point (as in Stockholm and the first three lines of Moscow), but more commonly they intersect in a triangle of three city center stations. Central transfer points go way beyond three lines, though: Otemachi has five subway lines; Tokyo Station has a subway line and six independent JR East commuter lines; Chatelet-Les Halles has five Metro lines and two and a half RER lines; Bank and Monument together have four Underground lines and the Docklands Light Railway; Times Square has five subway lines, three of which are four-track. Why not just add more lines to the same central station? There are three distinct answers.

Coverage

Transit networks aren’t just about connecting large neighborhoods (“Upper West Side”) to a nebulously defined city center. They’re about specific connections. City centers are larger than a single subway stop, and much larger than a single subway stop in any city that has any business building four or more subway lines. In Stockholm, where three lines is about right, the CBD extends about two stops heading north and east of T-Centralen. New York, Paris, Tokyo, and London all have CBDs several square kilometers in area, so it makes sense to route lines in such a way that it’s easy to reach many points within the CBD from all directions.

Concretely, take Times Square and Grand Central. It’s useful to serve both of them on multiple subway lines, but a north-south line can only serve one. Thus, the 4/5/6 serve Grand Central, and the A/C/E, 1/2/3, and N/Q/R/W serve Times Square. The same process repeats itself at a number of nodes within Midtown, and within CBDs of other large cities.

Construction difficulties

Independently of the value of having extensive service in multiple directions from multiple points in the CBD, there is the cost of bringing lines together. In large cities, the biggest source of missed connections to begin with is that the street available for line 6 may happen to pass right between two widely-spaced stops on line 1, which never had a stop at this street because line 6 was not in the planning stages yet.

For the same reason, urban street networks make it difficult to serve one point from more than a few directions. Even lines bored deep under the surface, without regard for the street network, would find it difficult to go on level -9, beneath eight older lines. The stations with the largest number of independent lines all have tricks to make this work. Times Square has three north-south subways that don’t physically intersect (the 1/2/3 is always to the west of the N/Q/R/W and the A/C/E well to the west of both), a stub-ending east-west subway (the shuttle), and one deep-bored east-west subway (the 7). At Tokyo Station four of the six commuter lines are elevated at the same level. At Otemachi the lines form a square, with one side consisting of two lines that were built together at the same time. Chatelet-Les Halles has platforms that do not intersect, and the most difficult retrofit, the addition of the RER, was a massive excavation project that cost billions of euros.

The same construction difficulties are also relevant to small transfer stations. In Paris, transfer stations try to avoid superimposing one line’s platforms on top of the other, just because it’s hard to build. As a result, transfers often involve long walks; transfers at Chatelet are particularly labyrinthine.

Transfer capacity

The biggest problem is not coverage, and only partly related to construction difficulties. At the busiest stations, pedestrian circulation between platforms can be a challenge. London Reconnections has a fourpart series about Bank, where three deep-level Underground lines meet, all having built in the late 1890s, when expected ridership was far lower than it is today. Circulation is so obstructed that at rush hour TfL occasionally has to close the station for safety reasons, or else passengers would fall onto the tracks. Retrofitting the station with additional connections between lines as well as from the platforms to the street has been a daunting task, since the most logical places for escalators to one line would often pass through the platforms of another.

At Chatelet-Les Halles, the same problem occurs, if not so acutely that trains need to skip the station at rush hour. The passageways between the Metro platforms and between the Metro and the RER are long and narrow, and barely adequate to handle the large volume of passengers.

The simplest way to prevent this problem from occurring at a particular station is to make sure to design enough room for the transfer. The simplest way to do that, in turn, is to ensure transfers are cross-platform. The RER has such cross-platform transfers at the station, pairing westbound RER A trains with northbound RER B trains and eastbound RER A trains with southbound RER B trains. But even the wrong-way RER A-B transfers and the transfers involving the RER D are fine: the station’s extreme cost paid for a full-length, full-width mezzanine. The London Underground, too, retrofitted these onto some older lines when it built the Victoria line, which has cross-platform transfers at such key stations as Oxford Circus (the busiest in London not counting mainline stations – Bank is only the second busiest) and Euston.

However, cross-platform transfers connect two lines. I know of one place where they connect three: Jamaica Station, where one track in each direction has platforms on both sides, and passengers on the trains on the opposite sides of these platforms are sometimes told to walk through the train to transfer. This is a unique feature of regional rail, with its timed connections; subways with a train every 2-3 minutes can’t realistically time the connections, and without timing the connections, passengers are better off walking up and down to the other platform than waiting for a train to come in for a purely horizontal transfer.

The need for coordinated planning

The ultimate problem with using more cross-platform transfers if that they require a great deal of foresight. Retrofitting them is not always possible, and costs money in modification of existing stations. Hong Kong, Singapore, and Taipei all use these transfers extensively, but only on lines that were planned together, such as the first two lines in Singapore; Singapore’s newer lines have long (though spacious) transfer corridors, and Hong Kong’s lines inherited from the original MTR and from mainline rail have poor transfers.

With relatively limited opportunities to have high-capacity, high-quality transfers, it’s no wonder that most cities that build rapid transit try to avoid four- and five-way transfers when possible. Complex transfers like this can arise by accident, over several layers of planning – in the case of Paris, Line 11 was planned and built a generation later than Lines 1, 4, and 7; the RER was built a generation later than Line 1; and Line 14 was built a generation later than the RER, and indeed was designed as a relief line to the RER A.

Ultimately, the best way to prevent a situation like Chatelet or Bank from occurring is to know in advance where every line will go. However, this is necessarily a hard task. In the 1890s, London was a city of 6 million, with a large number of poor people living in overcrowded condition in East and South London; a planner could guess how the city would grow and suburbanize in the 20th century but would not be able to predict this with any certainty. Paris, the capital of a then-poorer and far less industrialized country, has grown even more tremendously – in 1901 Ile-de-France had 4.7 million people, not all living in the built-up area of the capital.

In very large third-world cities, the task of predicting future growth is somewhat easier, but only because they’re already very large and have informal transit pointing the way to the major corridors. I can draw a semi-serious Lagos metro proposal based on the city’s urban layout today and expect much of its future growth to come from increasing building heights so that the same density can be accommodated with less overcrowding, but I can’t meaningfully say which future areas will become hotspots that must be served from all directions or how far the suburban sprawl will go.