Modeling Anchoring
Jarrett Walker has repeatedly called transit agencies and city zoning commissions to engage in anchoring: this means designing the city so that transit routes connect two dense centers, with less intense activity between them. For example, he gives Vancouver’s core east-west buses, which connect UBC with dense transit-oriented development on the Expo Line, with some extra activity at the Canada Line and less intense development in between; Vancouver has adopted his ideas, as seen on PDF-page 15 of a network design primer by Translink. In 2013, I criticized this in two posts, making an empirical argument comparing Vancouver’s east-west buses with its north-south buses, which are not so anchored. Jarrett considers the idea that anchoring is more efficient to be a geometric fact, and compared my empirical argument to trying to empirically compute the decimal expansion pi to be something other than 3.1415629… I promised that I would explain my criticism in more formal mathematical terms. Somewhat belatedly, I would like to explain.
First, as a general note, mathematics proves theorems about mathematics, and not about the world. My papers, and those of the other people in the field, have proven results about mathematical structures. For example, we can prove that an equation has solutions, or does not have any solutions. As soon as we try to talk about the real world, we stop doing pure math, and begin doing modeling. In some cases, the models use advanced math, and not just experiments: for example, superstring theory involves research-level math, with theorems of similar complexity to those of pure math. In other cases, the models use simpler math, and the chief difficulty is in empirical calibration: for example, transit ridership models involve relatively simple formulas (for example, the transfer penalty is a pair of numbers, as I explain here), but figuring out the numbers takes a lot of work.
With that in mind, let us model anchoring. Let us also be completely explicit about all the assumptions in our model. The city we will build will be much simpler than a real city, but it will still contain residences, jobs, and commuters. We will not deal with transfers; neither does the mental model Jarrett and TransLink use in arguing for anchoring (see PDF-p. 15 in the primer above again to see the thinking). For us, the city consists of a single line, going from west to east. The west is labeled 0, the east is labeled 1, and everything in between is labeled by numbers between 0 and 1. The city’s total population density is 1: this means that when we graph population density on the y-axis in terms of location on the x-axis, the total area under the curve is 1. Don’t worry too much about scaling – the units are all relative anyway.
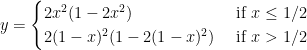
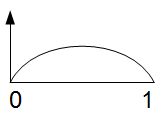
Let us now graph three possible distributions of population density: uniform (A), center-dominant (B), and anchored (C).


Let us make one further assumption, for now: the distributions of residences and jobs are the same, and independent. In city (A), this means that jobs are uniformly distributed from 0 to 1, like residences, and a person who lives at any point x is equally likely to work at any point from 0 to 1, and is no more likely to work near x than anyone else. In city (B), this means that people are most likely to work at point 0.5, both if they live there and if they live near 0 or 1; in city (C), this means that people are most likely to work at 0 or 1, and that people who live at 0 are equally likely to work near 0 and near 1.
Finally, let us assume that there is no modal splitting and no induced demand: every employed person in the city rides the bus, exactly once a day in each direction, once going to work and once going back home, regardless of where they live and work. Nor do people shift their choice of when to work based on the network: everyone goes to work in the morning peak and comes back in the afternoon peak.
With these assumptions in mind, let us compute how crowded the buses will be. Because all three cities are symmetric, I am only going to show morning peak buses, and only in the eastbound direction. I will derive an exact formula in city (A), and simply state what the formulas are in the other two cities.
In city (A), at point x, the number of people who ride the eastbound morning buses equals the number of people who live to the west of x and work to the right of x. Because the population and job distributions are uniform, the proportion of people who live west of x is x, and the proportion of people who work east of x is 1-x. The population and job distributions are assumed independent, so the total crowding is x(1-x). Don’t worry too much about scaling again – it’s in relative units, where 1 means every single person in the city is riding the bus in that direction at that time. The formula y = x(1-x) has a peak when x = 0.5, and then y = 0.25. In cities (B) and (C), the formulas are:
(B):
(C):

Here are their graphs:
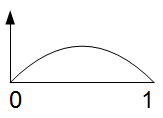

Now, city B’s buses are almost completely empty when x < 0.25 or x > 0.75, and city C’s buses fill up faster than city A’s, so in that sense, the anchored city has more uniform bus crowding. But the point is that at equal total population and equal total transit usage, all three cities produce the exact same peak crowding: at the midpoint of the population distribution, which in our three cases is always x = 0.5, exactly a quarter of the employed population lives to the west and works to the east, and will pass through this point on public transit. Anchoring just makes the peak last longer, since people work farther from where they live and travel longer to get there. In a limiting case, in which the population density at 0 and 1 is infinite, with half the population living at 0 and half at 1, we will still get the exact same peak crowding, but it will last the entire way from 0 to 1, rather than just in the middle.
Note that there is no way to play with the population distribution to produce any different peak. As soon as we assume that jobs and residences are distributed identically, and the mode share is 100%, we will get a quarter of the population taking transit through the midpoint of the distribution.
If anything, the most efficient of the three distributions is B. This is because there’s so little ridership at the ends that it’s possible to run transit at lower frequency at the ends, overlaying a route that runs the entire way from 0 to 1 to a short-turn route from 0.25 to 0.75. Of course, cutting frequency makes service worse, but at the peak, the base frequency is sufficient. Imagine a 10-minute bus going all the way, with short-turning overlays beefing frequency to 5 minutes in the middle half. Since the same resources can more easily be distributed to providing more service in the center, city B can provide more service through the peak crowding point at the same cost, so it will actually be less crowded. This is the exact opposite of what TransLink claims, which is that city B would be overcrowded in the middle whereas city C would have full but not overcrowded buses the entire way (again, PDF-p. 15 of the primer).
In my empirical critique of anchoring, I noted that the unanchored routes actually perform better than the anchored ones in Vancouver, in the sense that they cost less per rider but also are less crowded at the peak, thanks to higher turnover. This is not an observation of the model. I will note that the differences in cost per rider are not large. The concept of turnover is not really within the model’s scope – the empirical claim is that the land use on the unanchored routes lends itself to short trips throughout the day, whereas on the anchored ones it lends itself to peak-only work trips, which produce more crowding for the same total number of riders. In my model, I’m explicitly ignoring the effect of land use on trips: there are no induced trips, just work trips at set times, with 100% mode share.
Let us now drop the assumption that jobs and residences are identically distributed. Realistically, cities have residential and commercial areas, and the model should be able to account for this. As one might expect, separation of residential and commercial uses makes the system more crowded, because travel is no longer symmetric. In fact, whereas under the assumption the peak crowding is always exactly a quarter of the population, if we drop the assumption the peak crowding is at a minimum a quarter, but can grow up to the entire population.
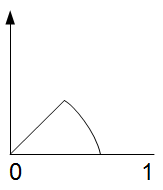
Consider the following cities, (D), (E), and (F). I am going to choose units so that the total residential density is 1/2 and so is the total job density, so combined they equal 1. City (D) has a CBD on one side and residences on the other, city (E) has a CBD in the center and residences on both sides, and city (F) is partially mixed-use, with a CBD in the center and residences both in the center and outside of it. Residences are in white, jobs are in dark gray, and the overlap between residences and jobs in city (F) is in light gray.


We again measure crowding on eastbound morning transit. We need to do some rescaling here, again letting 1 represent all workers in the city passing through the same point in the same direction. Without computing, we can tell that in city (D), at the point where the residential area meets the commercial area, which in this case is x = 0.75, the crowding level is 1: everyone lives to the west of this point and works to its east and must commute past it. Westbound morning traffic, in contrast, is zero. City (E) is symmetric, with peak crowding at 0.5, at the entry to the CBD from the west, in this case x = 0.375. City (F) has crowding linearly growing to 0.375 at the entry to the CBD, and then decreasing as passengers start to get off. The formula for eastbound crowding is,
(F):


In city (F), the quarter of the population that lives in the CBD simply does not count for transit crowding. The reason is that, with the CBD occupying the central quarter of the city, at any point from x = 0.375 east, there are more people who live to the west of the CBD getting off than people living within the CBD getting on. This observation remains true down to when (for a symmetric city) a third of the population lives inside the CBD.
In city (B), it’s possible to use the fact that transit runs empty near the edges to run less service near the edges than in the center. Unfortunately, it is not possible to use the same trick in cities (E) and (F), not with conventional urban transit. The eastbound morning service is empty east of the CBD, but the westbound morning service fills up; east of the CBD, the westbound service is empty and the eastbound service fills up. If service has to be symmetric, for example if buses and trains run back and forth and make many trips during a single peak period, then it is not possible to short-turn eastbound service at the eastern edge of the CBD. In contrast, if it is possible to park service in the center, then it is possible to short-turn service and economize: examples include highway capacity for cars, since bridges can have peak-direction lanes, but also some peaky commuter buses and trains, which make a single trip into the CBD per vehicle in the morning, park there, and then make a single trip back in the afternoon. Transit cities relies on services that go back and forth rather than parking in the CBD, so such economies do not work well for them.
A corollary of the last observation is that mixed uses are better for transit than for cars. Cars can park in the CBD, so for them, it’s fine if the travel demand graph looks like that of city (E). Roads and bridges are designed to be narrower in the outskirts of the region and wider near the CBD, and peak-direction lanes can ensure efficient utilization of capacity. In contrast, buses and rapid transit trains have to circulate; to achieve comparable peak crowding, city (E) requires twice as much service as perfect mixed-use cities.
The upshot of this model is that the land use that best supports efficient use of public transit is mixed use. Since all rich cities have CBDs, they should work on encouraging more residential land uses in the center and more commercial uses outside the center, and not worry about the underlying distribution of combined residential and job density. Since CBDs are usually almost exclusively commercial, any additional people living in the center will not add to transit crowding, even as they ride transit to work and pay fares. In contrast, anchoring does not have any effect on peak crowding, and on the margins makes it worse in the sense that the maximum crowding level lasts longer. This implies that the current planning strategy in Vancouver should be changed from encouraging anchoring to fill trains and buses for longer to encouraging more residential growth Downtown and in other commercial centers and more commercial growth at suitable nodes outside the center.

I need some more time to digest this all. However, it seems like the following assumption:
“Finally, let us assume that there is no modal splitting and no induced demand: every employed person in the city rides the bus, exactly once a day in each direction, once going to work and once going back home, regardless of where they live and work. ”
is not necessarily reasonable in the context of City B, the city with a centrally-biased population distribution. Walking would decrease the intensity of the crowding peak, because many destinations are readily accessible from the center of the peak.
Yep! I didn’t relax that assumption because the post already got unwieldily long, but I did think about it. If you assume that people walk at short range, then the optimal distribution is to pack people in as densely as is politically acceptable and economically feasible. If the maximum acceptable density is 4 times the average, then you want to have a quarter of the population living in the middle quarter of the region.
Another thing: once you introduce a 2D landscape, things change a lot, and then crowding is higher in a CBD-centric distribution, with a maximum density in the center that’s 50% higher than in a uniform distribution. (Anchored behaves like CBD-centric, unless people are indifferent about transfers and can go east-north-east rather than just east-north or north-east).
Nice work. I admit to a little schadenfreude; I’m afraid I like it when someone shows up Walker, since he’s an arrogant ass who all too often doesn’t pay attention to empirical results.
It’s not about showing up Jarrett. I think he made one mistake in his conceptual model of a good grid plan. People make mistakes; it’s a commonplace that Ph.D. theses in math have mathematical errors, and occasionally, very good mathematicians have errors in their papers, sometimes those errors even make it past peer review, and sometimes they are so crucial they invalidate the main theorem. If you’ll allow me to borrow this mathematical language to the anchor model, then this mistake does not invalidate any of Jarrett’s work on designing transit routes or anything he says about discourse and governance (“who isn’t in the room?” and such), only what he says about how to rezone cities to reinforce efficient transit usage.
Jarrett’s usually all right on route design, but he’s a complete fool when it comes to, well, shall I say, *rider preferences*, and he resolutely refuses to pay attention to ridership data which contradicts his abstract theories. A common problem with theorists. This has led to some seriously underperforming proposals being adopted at fairly high cost in Brisbane, Minneapolis, and soon Wellington.
Can you say more about what errors you think Walker has made in his analysis and recommendations that have resulted from his disregard for “ridership data which contradicts his abstract theories”? Though I love Walker’s book and his arguments have significantly shaped the way I think about transit network design, I too have been turned off by Walker’s anti-empirical approach. It reminds me of the Austrian economists who practice “praxeology” and claim to derive apodictic economic truths based on pure armchair theorizing. But what, specifically, has Walker been mistaken about as result of his approach?
The main error in recommendations is that Jarrett endorses rezoning that attempts to make cities look more like example C than like examples A or B. This is the case in Vancouver, which has reserved its most intensive upzoning along the Cambie corridor for the south end, around Marine Landing, rather than closer to the center.
Real life cities are going to have more than one place with lots of activity.
Um, no. Walker does a great job of correcting misconceptions that are widespread among transit and urban planners. I cannot think of him every being wrong about something substantive, except for this anchoring thing.
every being wrong -> ever being wrong
Walker resolutely believes that passengers are mode-neutral, i.e. that you can get the same ridership on a bus as on a train if they follow the same routes, have the same frequencies, both have the same amount of exclusive right-of-way, etc.
On this, Walker has been proven wrong by every single piece of empirical data in world history. The “rail preference” adds between 10% and 20% to ridership, consistently. It’s something which one should just accept. It may not be rational, but it’s how humans actually behave. It should just be figured into the modelling, and most models do figure it in. Not Walker.
For example, Jarrett would not have predicted that the Kansas City Streetcar (which is duplicating and replacing a bus route with the same frequency in the same mixed traffic) would generate increased ridership. It did generate increased ridership, and I believe it was increased by just about the amount you’d expect from passenger rail preference.
Jarrett also doesn’t understand that it is *impossible* to make a busway which cars won’t drive onto (car drivers will drive anywhere there is asphalt), and that there will always be political pressure to open such a busway up to cars — whereas it is *possible* to make a railroad right-of-way that cars won’t drive onto (by not paving it!) It makes a difference. (Of course, *freight* can try to get onto railroad right-of-ways, as BruceMcF points out.)
Jarrett exposes his bias and refusal to pay attention to reality in his comments in this 2011 thread about “BRT” vs. rail. BruceMcF undestands reality, Jarrett doesn’t. I miss BruceMcF (Midnight Populist) — he stopped blogging in 2013.
https://www.thetransportpolitic.com/2011/05/25/the-silly-argument-over-brt-and-rail/
To be clear, I support good buses! But Jarrett has a bad attitude which is not grounded in reality.
Bruce is active on Twitter! He’s @BruceMcF.
*34-43% per Ed Tennyson, and that’s mostly at low service levels. Tennyson looks at ridership declines at postwar bustitution and increases at 1970s and 80s railstitution net of speed increases, but at high service levels trains are consistently faster than buses because they can run fast-ish on rights-of-way or in arterial medians while still making stops, whereas buses either run on freeways and have horrific stops and probably have to run nonstop at shit frequency or run on arterials and are slow.
Given your model, anchoring should help overall route productivity so long as Gandolf is at the CBD telling new riders that “you shall not pass.” Absent his presence, a legal or market based reason behind why the anchor would not create cross-CBD ridership is needed.
Two good anchors that come to mind would be a supermarket; people are likely to choose from the nearest few options likely on their side of the CBD, thus local ridership is generated but cross-CBD ridership is not likely to be created.
Another anchor that would generate large reverse ridership that doesn’t cross the CBD would be a large high school. There are multiple converging factors here:
1. Cities tend to sprout due to the crossing of a major road, railroad, or river with another major road, railroad, or river.
2. School districts (assuming that they are large enough for multiple high schools, which if there is a risk of transit overcrowding is probably the case) tend to draw school attendance boundaries along major roads, railroads, or rivers.
3. School districts also like to site high schools on large, cheap parcels (this isn’t a new factor; if one looks closely often the high school predates the surrounding neighborhood by a few years, even back in the 1920s or earlier). As land is more expensive in the city core, this pushes high schools out to the fringe.
4. As a result, significant passenger flows can be created in the reverse-peak direction, and without an open-enrollment policy or law, may end up with no cross-boundary (ie cross CBD) passenger traffic.
Jarrett’s concept of anchoring may be due to his experience planning small-city transit, where the route that heads from the CBD to terminate at Walmart may have higher ridership than a route from the CBD that loops around a residential area.
The problem with making this argument about small cities is that as a matter of urban planning, Jarrett’s primary example is Vancouver, where the anchors for the east-west buses are regionwide rather than local destinations. Vancouver is even upzoning its southern margin, around Marine Landing, much more than the stops on the Canada Line between Marine Landing and Central Broadway, even though those stops are already major nodes for bus/subway connections.
The outer anchors you’re proposing – supermarkets and high schools – are more about spreading demand at different times of day than about anchoring. Supermarkets generate travel all day. This includes hypermarkets like Wal-Mart. You’d get the same route performance if those hypermarkets were in the CBD – people don’t generally go shopping (or go to work in retail) at rush hour, so the bus routes would not get more crowded at the peak. But hypermarkets pretty much never locate in city centers, and as you note American high schools tend not to, either.
If the city is not big enough to have a strong bus grid, it’s actually better to put the schools right at the center. The reason is that school demand is incredibly peaky, because classes start at the same time, so it’s better to put schools at a place that can draw students from as many directions as possible. You’d get tidal demand either way, but you’d be in the situation of city (E) and not city (D), so there would be less crowding. Universities are of course the same – I’ve complained before about passups on routes serving UBC at class start time, and Stockholm also has a lot of subway crowding on the northbound Red Line trains to KTH and SU at class start time. Stockholm handles it better because it’s a subway and not a bus, but it’s still an essentially unidirectional branch (the problem is that the suburbs behind KTH and SU are the favored quarter, so students can’t afford to live there). But K-12 schools, while smaller than universities, have even more coordinated class start times.
The one change that can be made is shifting when classes start to avoid coinciding with the work commute too much. There, central placement is again better, because it means a shorter school trip, which makes it possible to start classes earlier. The limiting factor to school start time is that making children wake up at 6:30 in the morning for period 0 or what not is a recipe for tired students.
I assume the area around Marine Landing is being upzoned because it’s industrial wasteland and there aren’t NIMBYs there to complain about the upzoning. Not because it has better accessibility than other locations.
It’s being upzoned at the same time as the other sites along the Canada Line. But it’s upzoned more intensively, whereas along the rest of Cambie it’s linear mid-rise zoning just along the street and a few major intersecting streets, with slightly higher density allowed near the stations. It’s in fact the first time Vancouver is zoning for linear mid-rise density in a developed area, rather than building a cluster of high-rises. Between this and the insistence of Translink that city (C) is more efficient than cities (A) and (B), I do think it’s related to the anchoring concept.
I second that start time modification. Here in NYC, there are several schools that exacerbate the AM peak crush. In Queens, Aviation HS and LaGuardia College create crush load conditions on the 7 local. In Manhattan, Hunter College and Rockefeller University start times worsen 6 train overcrowding.
Just to complicate life, don’t forget that commuting to work (in the US at least) is only about 1/4 of (vehicular) trips taken and 1/3 of miles traveled (stats graphed here, data from reputable government sources: https://dr2chase.wordpress.com/2014/04/09/short-trips-in-cars/ ).
For more modeling fun, it turns out that my neighbor studies this stuff as part of her day job, from the POV of “what does daily travel look like”? http://rsif.royalsocietypublishing.org/content/10/84/20130246
Yep. The reason I’m using the model exclusively for work trips is threefold:
1. The picture for transit trips is different – a large majority are used for commuting, since transit users typically make their non-work trips on foot.
2. Peak-hour crowding is caused by commute trips to work and school, whereas other trips are less peaky. People don’t go shopping at 9 in the morning.
3. Whereas the assumption of inflexible mode share for work trips more or less approximates reality, any equivalent assumption for non-work trips is lolzy. It’s not even that the mode share is lower, but that answers to questions like what time of day people travel, whether they chain trips, whether they walk or take mechanized transportation, and which of several retail centers they choose are hugely dependent on urban layout. This, I think, is what makes Vancouver’s routes 3, 8, 20, and 41 outperform routes 25 and 49: they serve corridors with enough continuous small-scale development that people ride them off-peak to a variety of destinations, whereas routes 25 and 49 travel through low-density residential areas and don’t get many non-work trips.
Transit users who don’t own cars make many trips on foot. Transit users who own cars, it gets much more complex.
Is there a difference in crowding between city D and E? In both cities, .375 of linear residential creates .5 ridership, city E just has twice the length of residential.
If buses seat 40 people, and it is known that .375 of linear residential generates 120 boardings to the CBD per hour, city D would have six buses per hour from the west arriving in the CBD, each with 40 people, and city E would also have the same six buses per hour, but three per hour per side, also with 40 people per bus.
Restated, a city with half the total density of city D is the same as the left .5 of city E.
In your example, what you’re missing is that city E’s buses only have to travel half as far as city D’s. So city D provides 6 buses per hour in each direction, and in the morning, the eastbound 6 buses have 40 people when they enter the CBD and the westbound 6 buses are empty; city E provides 6 buses per hour in each direction, and in the morning, both eastbound and westbound buses have 20 people when they enter the CBD and run empty when they exit the CBD.
I support anchoring (to a degree).
The difference between your outlook and Jarrett’s is over the meaning of peak crowding.
You are trying to minimize peak crowding (i.e. maximum transit demand).
Jarrett is trying to cost-effectively provide frequent transit service to an entire service area (i.e. generating enough transit demand to justify high frequency services over a greater area).
Short-turning routes outside the center may save costs, but provides worse transit frequencies at the edges of the service area. And frequency is freedom (to use transit).
The problem is that service in city (A) is Pareto-worse than in city (B), and Pareto-better than in city (C). All three cities provide the same ridership at the same cost and have the same peak crowding, but in city (A) the peak crowding lasts longer than in city (B) and shorter than in city (C). City (B) has the option of cutting service at the edges and saving money; it also has the option of not doing so, and spending the same amount of money as (A) and (C). As I’ve noted, the crowding peak occurs at rush hour, when frequency is usually decent on many routes. Concretely, imagine that all three cities initially provide 9 buses per hour per direction at the peak; city (B) also has the option to instead have 6 buses per hour on the entire route plus 6 more that only run on the inner half, cutting edge frequency from 6:40 minutes to 10 (affecting 43.75% of users) but boosting central capacity by a third (affecting 96.875% of users). Maybe it’s not a good tradeoff, but city (B) isn’t obliged to make it – it merely has that possibility.
Honored that you’d put this much effort into refuting a point of mine — more than I probably put into making it.
I agree that if you have a choice between anchoring at line ends and mixed use along the way, you should do the latter. That’s because mixed use yields shorter trip distances of all kinds, including converting transit trips into walk trips. Shortening trip distances is always the best thing.
But if we have uniform mixed use along a line (your A), I would still be suggesting upzoning near the ends of the line to create a slightly smile-shaped density pattern — high all along but a little higher at the ends. The case for this is the difference between your loading curves A and C. C uses capacity more efficiently.
Your response to that, as I understand, is that C generates more need for person-km than A does, so the additional capacity of C is consumed by induced demand for longer trips, rather than by serving more people, which is not really the ideal outcome. And you’re right that in focusing on efficient loading I may have been unconsciously valuing person-km over person-trips, which is not a good thing in policy terms, nor consonant with the fare structure in any but the most microscopically distance-based fare systems.
Here I suspect it depends a bit on the land uses. Crowding on the well-anchored E-W lines in Vancouver arises not just from the masses of activity but from UBC’s position as a regionwide trip attractor. Due to the infamous mismatch between UBC’s location and where its students and staff (and even faculty) can afford to live, UBC generates high average commute distances and times. Vancouver is fortunate that this is on the transit system rather than in cars, but it’s a fact of life about giant universities sited without much thought of access.
So, to follow the logic, let’s suppose that we used our geeky paranormal powers to reverse the location of UBC and the affluent neighborhoods just to its east. The affluent Point Grey district moves out to the tip of the point, beyond the park buffer, and UBC becomes an urban campus on the hill just west of Alma St. Yes, that’s an improvement. It looks like your B, in which for all practical purposes the whole city that depends on alternatives to driving has shrunk to a smaller area. That a more compact (and hence affordable) high frequency network, and yes, it will shorten average trips, yielding higher turnover. After all, we always want to run fewer line-km so that we can afford more frequency.
I would describe that as making the whole line shorter — because the transit-oriented city is smaller — which of course is a good thing. The affluent and low density area now west of UBC would get some infrequent circulators, because that’s the only service that its own (low) demand justifies. This area becomes a vast cul-de-sac like the British Properties: an area of very low transit demand, and not one it would go through to get to anywhere else. Effectively that moves us toward your case B, although transit planners would resist dealing with this using shortlining, which is much harder in practice than in theory. And it wouldn’t be as sharp as B.
But now let’s do a different thought experiment. What if the UBC site were just a large mixed use centre but not a university: a mix of residential and employment towers, at mixed incomes, but yielding the same daily quantity of trip generation as UBC does. Destinations of these trips would be more consistent with a gravity model than UBC’s are. Attractions to downtown Vancouver and Central Broadway, for example, would be higher, while those to the distant eastern suburbs would be lower. So for example along Broadway, a larger share of riders from the west would have gotten off by Cambie, and thus wouldn’t overlap the heavy market between Central Broadway and Commercial station, or not as much.
That’s the geography in which I suspect anchoring still has value, because now we’re talking about how — all other things being equal including mixed use — your loading curve C is still better than the curve A for the purposes of optimizing the number of people, not just km, we can serve. A nice example of this kind of anchoring is the northern end of the N-S crosstowns in Los Angeles, especially between Vermont and roughly La Cienega. These crosstowns all terminate where they run into the mountains at points along Sunset Blvd, where there’s an east-west strip of density helping to anchor each line. But the density (Hollywood and West Hollywood, basically) is reasonably diverse rather than being a regionwide attractor like UBC. I’d expect you still have high turnover, and thus more people served without more route-km, while also showing the anchoring benefit.
Because again, when you terminate with no uptick in density, you have nearly empty buses at the end of the line, and that’s not serving anyone.
Having said that, I haven’t had time to dig deeply enough into data, and it’s possible I’m just wrong. That’s what people with academic jobs are for. Maybe every bit of the anchoring advantage to seat-utilization lies precisely in making trips longer, in all land use environments. If so, I’m wrong, and will stand corrected. But I can see why university-anchored lines may not be the best test case. And it’s definitely right that the mixture of land uses — and the presence or absence of regionwide attractors — should be held constant in looking for anchoring effects.
Cheers, Jarrett
…can’t have many people making hour long commutes in smaller metro areas. The bus crosses it in 30 minutes….
In the brief mentions of anchoring that I’ve seen on the blog and in the book, I always thought it was about taking a pre-existing pattern of land use and then layering a transit network over it. In that context, anchoring totally makes sense. Since each segment of transit costs resources, you want each segment that you actually put down to have heavy use. The way to make sure of that is to make sure that each segment is between large amounts of transportation demand. Importantly, that means that the endpoints of the line (which only have a small amount of land on one side) should have very large concentrations of demand near them.
However, if we consider the opposite idea, and take a pre-existing transit network and layer land use over it, it seems to me that the considerations ought to work differently. If we’re committed to a given pattern of transit spending, then we no longer have to consider the cost-effectiveness of that particular set of expenditures. Instead, we should be trying to maximize the amount of access that people have. That means increased density at transfer points of major lines (so that people can get to many places) and mixed-use wherever we have density (so that people can walk instead of taking transit, and so that transit can have all-day patterns of demand rather than clumpy demand). It also seems to mean that other things being equal, it’s better to put density near the middle rather than at the ends, unless the local geography means that the ends are good transfer points. (Maybe there’s really good geography for an east-west line right at the foothills of the mountain range that bounds things at the north? Or a north-south line right along the shore of a body of water that bounds things to the west?)
Of course, in the real world, we don’t have either land use or transit network as fixed exogenous patterns – both are developing in tandem with each other (though both are practically limited to remain somewhat similar to the existing patterns of each over the short-to-medium term). I suppose the thought I see here is that if you’ve already set up a high frequency grid, and new development concentrates in areas that already have high density, then you might need to add extra service to these areas to keep up with new demand. But if new development concentrates in areas that are underused (which exist because a high-frequency grid usually needs to maintain this frequency even in some areas of lower density in order to provide all the needed connections) then you might not need to add any extra service. But I don’t see any particular mathematical need for the new development to be concentrated at the *endpoints* of lines, as opposed to underused transfer points at any location in the grid.
D, E, and F are the must more interesting cases to my mind. City D reminds me of Muni service in San Francisco, where most service ends at the Central Business District and is indeed terribly overcrowded near there but empty upon return. Meanwhile, BART in San Francisco & Oakland runs more like City F.
All that said, wouldn’t an accurate model of anchoring be more like City D but with job centers on both ends? I suspect that would, in fact, reduce the peak crowding–unlike City C.