Public Transit is Greener Than It Seems
The main way to judge how good public transportation is for the environment is to measure how many car trips it displaces. But in reality, it’s better, and I’d like to explain why. As a warning, this is a theoretical rather than empirical post. My main empirical evidence for it is that European car usage is lower relative to American levels than one might expect given public transit mode shares; in a way, it’s an explanation for why this is the case.
While the explanation relies on changes in land use, it is not purely a story of zoning. The population density in much of my example case of auto-oriented density – Southern California – is well below the maximum permitted by zoning, thanks to the lack of good transit alternatives. Thus, even keeping zoning regimes mostly as they are, public transportation has an impact on land use and therefore on car pollution.
Transit always displaces the longest car commutes
In an auto-oriented city, the limiting factor to the metro area’s density is car traffic. Adding density with cars alone leads to extra congestion. Devin Bunten’s paper entitled Is the Rent Too High? finds that, assuming no changes in travel behavior (including no change in the option of public transit), zoning abolition would actually reduce American welfare by 6%, even while increasing GDP by 6%, because of much worse congestion; optimal upzoning would increase GDP by 2.1% and welfare by 1.4%, which figures are lower than in the Hsieh-Moretti model.
The upshot is that if there is no public transportation, people live at low density just because the alternative is the traffic jams of dense car-oriented cities; Los Angeles is the most familiar American example, but middle-income examples like Bangkok are denser and worse for it. Low density means people travel longer to reach their jobs, by car, increasing total vehicle travel.
In the presence of mass transit, people don’t have to sprawl so far out. Los Angeles’s “drive until you qualify” mentality is such that, if there were room for a million transit users in the inner parts of the region, then no matter which exact group of million people from the five-county area started taking transit, ultimately the shuffle would be such that there would be a million fewer people driving in from Antelope Valley, Victor Valley, and the Inland Empire.
The model
Consider a city that comprises concentric rings, as in the following diagram:
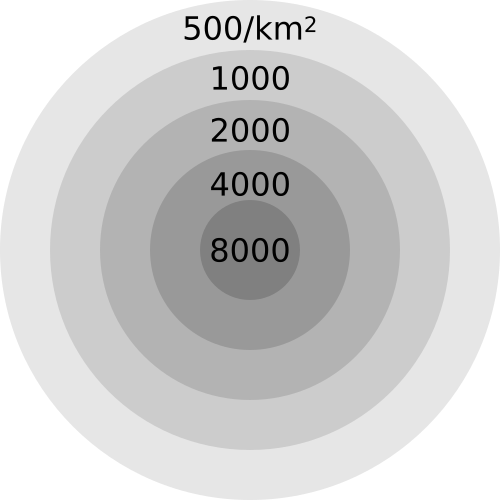
The average density of the city region is 1,660 people per square kilometer, and the weighted density is about 3,400; both figures are typical for the denser American Sunbelt cities, like Los Angeles, San Diego, Miami, and Las Vegas (see table as of 2000 here).
Let us assume that the amount of v-km per inhabitant within each concentric circle is proportional to the outer radius of the circle, so people in the outermost ring drive 5 times as long as those in the inner circle. For concrete numbers, let us assume these figures are 5,000, 10,000, 15,000, 20,000, and 25,000 v-km per year; they average about 13,550 v-km/capita, which is somewhat less than the US average, just below 16,000 per FRED. Note that the outermost ring has 10.8% of the city’s population and 20% of its v-km.
If the modeled density is close to optimal for congestion management given the current state of public transit, then adding transit means subtracting people from the outer ring, not from the inner rings. Say the city builds rapid transit reaching the inner two rings, allowing these areas to densify by exactly 22.5%, which is the ratio of the outer ring’s population to the inner two’s total’s. The total non-auto mode share will rise by 10.8 percentage points, divided between public transit and walking because people in dense, walkable neighborhoods have the option of non-motorized transport; but v-km and the attending greenhouse gas emissions will fall 20%.
If the city keeps growing, the situation is even more extreme. We can add a sixth ring, on the same model, with a density of 250 people per km^2, 30,000 annual v-km per capita, and population equal to 6.6% of the total of the five existing rings or 6.2% of the six-ring total. This 6.6% increase in population raises v-km by 14.7%; in contrast, a transit system capable of supporting this population increase would show an increase of 6.2 points in the non-auto mode share even while avoiding a 14.7% increase in car traffic.
European car usage
We can obtain total v-km per capita by country from a table of traffic accident fatalities: the OECD reports numbers per capita and per v-km, so if we go to PDF-p. 60 of its report, divide the per-capita figure by the per-v-km figure, and multiply by a scaling factor of 10,000, we get v-km per capita. In the US, this figure is just short of 16,000, just as in the FRED graph. The US’s transit mode share for work trips is 5%, so this is about as close as possible to a purely auto-oriented country.
In the Western European countries for which there’s data, including France and Germany, the figure is just short of 10,000. This is close to INSEE’s figure of 756 billion passenger-km in 2016, the difference accounted for by the fact that sometimes multiple people ride in the same car.
The reason people here travel 40% less by car than in the US is not that they instead travel the same distance by public transit. INSEE reports 132 billion passenger-km in buses, trams, and trains excluding TGVs in 2016, and this includes a fair amount of intercity bus and rail travel (9 billion p-km on intercity rail as of 2010 per p. 53 here). Overall, the French modal split is 70% car, 15% transit, 6.7% walk, 4.3% work from home, 4% bike and motorcycle. The American one is 85% car, 5% transit, 2.7% walk, 5.2% work from home. Even relative to the volume of car commuters, the Americans drive 40% further than the French.
Much of my understanding of how provincial France works comes from the Riviera. The Riviera is not the best representative: Alpes-Maritimes is among the richest departments outside Ile-de-France, is among the most conservative, and near-ties Toulouse’s Haute-Garonne and Strasbourg’s Bas-Rhin for third highest provincial transit mode share (13%, behind Rhone’s 23% and Bouches-du-Rhone’s 14%). But it’s a good representative nonetheless of a major provincial city region. There, the coastal towns as well as some interior ones are filled with sprawl, even going up the mountains. There is density in Monaco and Nice, and public transit ridership mostly consists primarily of people who live in Nice and secondarily of people who commute to Monaco. It’s the tramway, the buses, and the general walkability that permit Nice to be what it is, coexisting alongside the offices parks of Sophia-Antipolis and the low-density sprawl up the mountains.
What about zoning?
Devin’s paper is about the economic cost of zoning. Even with the assumption of no change in built form or in transportation modal choice, it does find welfare gains from upzoning, saying that high-demand areas would gain 10-15% in population. This implies that realizing the full environmental gains from public transit requires upzoning areas near stations, to permit the inner two rings in my model city to gain residents who would have otherwise populated a sixth ring.
And yet, the appropriate zoning to some extent already exists. California abolished single-family zoning in 2016 and 2017: accessory dwelling units, or ADUs, are permitted anywhere that residential development is permitted, and homeowners are free to build ADUs in their backyards or carve out ADUs out of their existing buildings. Moreover, in select zones, cities have encouraged transit-oriented development through upzoning or relaxing parking minimums: San Francisco’s TDM process abolished parking minimums anywhere that buildings with at least 10 apartments are permitted, and San Diego slashed parking minimums in an attempt to encourage TOD in North Park along the University Avenue corridor.
The results of TDM in San Francisco are still unclear – the program passed too recently. The same is true of ADUs – existing homeowners react slowly, and new developers may build more two-family houses and fewer single-family houses, but new tract housing would go in the exurbs, not in the coastal cities. But in San Diego the results are clear: developers build more parking than the required minimum at University and 30th, because the public transit option there is a north-south bus that comes every 15 minutes and an east-west bus that comes every 10, which is not actually enough to persuade people who can afford a car not to drive one.
Conclusion
It is difficult to build TOD without public transport. The urban middle class of the 21st century expects travel convenience, which can come in the form of a large rapid transit network or in that of cars and freeways. Thus, even when development sites are available, even in expensive cities, developers sometimes build less than they are allowed to, or insist on more parking than is required, if alternative transportation is inadequate.
The upshot is that adding the layer of transit is likely to stimulate development in the affected urban neighborhoods. The people who would live in this development would not otherwise drive to the outer margin of the city to save on rent, but they would still drive, displacing people would then drive further. The exact details of the churn matter less than the net impact, which is that absent urban transit, cities end up sprawling farther out, forcing people to drive ever-longer distances to work and to other destinations.
A city that succeeds in replacing half of its car trips by public transit, such as Paris, will end up replacing far more than just half of its vehicle-km by transit. Even if the trains are densest within the city core, as is the case even in Paris and other cities with expansive regional rail, the net impact of the transit network is reduction in car travel in the outer parts of the built-up area, where distances are the longest. Planetoscope’s figures for car travel and average distance in Ile-de-France point to a total of just 2,900 v-km/capita in this region – less than one third the national average, and barely one half the national average per car commuter.
The benefit of transit thus goes well beyond the people who use it. The car trips it displaces, even if indirectly, are the ones that cause the worst problems – congestion, pollution, car accidents, greenhouse gas emissions – because they are the longest. Building urban rapid transit can have twice the direct mitigating effect on the harms of car travel as might appear based purely on counting mode choice. With twice the apparent positive environmental impact, mass transit must become a higher priority: nearly every new rapid transit line that’s judged as good must be a top priority for public investment, and many projects that appear marginal must be reevaluated and constructed as planned.

A very interesting post, however, I do not like the logic of ‘the density is low because the alternative is the high congestion’. Someone developing a relatively small plot of land does not care about the congestion the new development will impose on others, and the congestion its residents will suffer from does not depend that much on its density. The only channels through which developers may voluntarily build lower densities in car-oriented cities seem to be:
1. Parking. In an auto-oriented city it is going to be hard to sell a unit without two parking lots, and nearly impossible to sell a unit without at least a single spot. The developer will necessarily compromise on space for people to make space for cars. (Does it really work like this, or will the reduced amount of space be manifested in smaller units?)
2. Large developments. If someone is building a large community they may be able to feel some of the impact of the congestion this community creates and consequentially choose to build at somewhat lower density.
In general, however, it seems that the direct effect of congestion on density isn’t going to be that big. Of course, existing residents may use the political system to create zoning rules that reduce the density and the resulting road congestion that they are going to suffer from, but this is another story.
I wanted to attach a picture of the Los Angeles-on-the-Clyde, but, apparently, you can’t attach images to the comments.
If you’re committed to car ownership, would you live in a congested inner suburb, or far out? The inner burb may offer shorter commutes, but only slightly, since congestion will be severe once you are off the freeways, and you still need to travel the worst section of freeway. OTOH, the outer burb will be much more convenient for non-commute trips, since the peripheral density is low enough for convenient car travel off-peak. (Also the construction costs are lower, but that’s likely a separate issue pulling in the same direction)
Who is really “committed to car ownership” in such a sense that they like their daily commute through congested streets?
My brother works for a car company, is enamored with cars and even he doesn’t particularly like driving to work every day.
colinvparker- You do identify another possible channel for reduced density due to congestion. However, that would lead to reduced demand, not supply, of housing, and would lead to lower housing prices in the city center. That may have been true in the 80s, but is definitely not true today.
City centers have transit (sometimes bad transit, but still). And they’re close to things almost by definition. I’m talking about inner suburbs with no transit or walkability – such areas have lower demand than inner burbs served by transit, I believe.
Good point(s).
I would just add that transit authorities and their funders should rethink the zone system that makes travel more and more expensive the further out you go. In the terms you’ve shown here, it is even more counter-productive.
Okay, now I’m curious how p-km figures have evolved since Ile-de-France went flat-fare for monthly tickets. The Planetoscope data is from 2012.
Alon’s thesis is that transit permits greater density in the center which means less population in the fringe where vmt is high. Does subsidizing transit in the fringe really follow? Maybe if you’re imagining a “Finger Plan” or “Archipelago” structure? Alon, any thoughts how such structures would interact with your thesis? Thanks!
I should note that I have a totally-unrelated bias in favor of Finger or Archipelago structures: I think it’s highly desirable for people to have easy access to both low- and high-intensity uses. Tie that in with infrastructure and nuisance management and to me that’s pretty much the sole/entire purpose of planning.
Of course, but if you look at a density map superimposed on the transit map of Ile de France, you’d find that it conforms to a finger structure. That is not the case for London, a city very comparable in size and geography (entirely related to their preference for terrace housing or SFH). Some of Paris’ structure is evolution guided by the transit over the past half century but it also had the tendency before rail. Though if you go the next step further out from London, ie. 60-minute commuter towns (Oxford, Cambridge, Brighton-Hove, Tunbridge Wells! etc.) then it does conform too.
The point is that even for US city sprawl, transit can work to reduce those v-km. By promoting TOD it will further reduce v-km by providing more and more jobs within walking distance for people within the TOD (or one half of a working couple etc.; kids within walkable distance of school etc).
Berlin is also very finger-y, in part going back to 19th century plans
What would you propose instead?
Remember that often municipal coffers depends on people living inside the city.
Zone-free travel, or at least a much gentler price increase for the outer zones. This is what Paris has done with its recent dramatic change on Navigo cards for RER users. Alon has said he will look at the data; however I feel Paris may not be as informative as other big cities that have the combination of high transit fares and severe zoning penalties. Paris is compact and its RER fares were already quite reasonable, thus the impact may be minimal.
Of course there will be a cost to the transit authority though the arguments becoming more common for free transit point out that it is not as great as assumed, especially in the context of externalised effects (such as the topic of the current article). In any case, in big cities these zones and the transit authorities are mostly outside the “city” and often de facto (or actual, as per NYC’s MTA) controlled and funded at state level. I don’t know the history behind the recent Navigo changes but 90+% of the RER (and its pax) lies outside Paris and its mayor’s jurisdiction, plus bit by bit power is being subsumed by a transilien (ie. Greater Paris) authority. Didn’t they abolish fares on the Staten Island ferry years ago? As another argument goes, they don’t charge passengers for using elevators or escalators … (though no doubt there are some bean-counters who would like to) and that includes Hong Kong’s 800m Mid-Levels escalator which is effectively part of the transit system.
Berlin’s current system is one that they shouldn’t change unless politics change.
There are three zones. A B and C. A is inside the ring railway, C is outside the city and state line. Tickets are either AB, BC or ABC. BC tickets are good because they relieve pressure downtown. AB tickets are good because they give citizens a better deal. And ABC tickets are the cost premium for people who don’t pay taxes in Berlin but use Berlin services.
You didn’t give enough information for me to know whether to agree or not. (And I don’t understand the politics comment.) But on the taxes issue, I already pointed out that most of the transit-km will not be within, or be paid for by, the inner city jurisdictions. I don’t know about Berlin (and you should tell us) but I’m guessing it would be the same as any city that has grown so big over the past century or so. In most respects the inner-city benefits, more than it costs, from those suburban commuters (workers, consumers).
Berlin is a city state. What is outside the municipal boundaries is outside the state.
People who live in zone C pay no taxes in Berlin and – more crucially – are not counted towards Berlin population. A lot of allocations get apportioned by population.
Back in the nineties there was a proposal to merge Berlin and Brandenburg (the surrounding heavily rural state whose biggest city, Potsdam is in essence a suburb of Berlin and smaller than Spandau, a single district of Berlin) which was approved by voters in Berlin but rejected in Brandenburg.
Nuremberg – Fürth has the problem that their single trip fare is ridiculous. 3.20€ (there is a discount for buying via the app, which cuts the fare to 2.75€) and that fare is the same whether you go from one end of Nuremberg to the other of Fürth or just a short hop inside Nuremberg. The weird fare level is even valid in some suburbs, so the city subsidizes the suburbs who hardly ever ride and who don’t contribute to municipal coffers…
I wish your logic that “nearly every new rapid transit line that’s judged as good must be a top priority for public investment” had prevailed in my home city of Louisville in the late 1990s when the excuse-for-leaders here allowed proposed light rail system to die. Instead, we extended our 1950s car dependent system into new freeways and Ohio River bridges. Three automobile plants in our region (two Ford and one Toyota) and their union locals carried much weight. Today, small businesses have closed because of the bridge tolls (this has been documented). The failure to consider passenger rail and the maintaining of tax “incentive” packages for Ford and Toyota have killed more jobs than they created. The reverse example of Louisville shows that from now on, it’s build good passenger rail, or die.
TBH I think Louisville might have died anyway.
In Herzogenaurach local employers like Adidad, Puma or Schaeffler are putting their thumb on the scale IN FAVOR OF light rail
Any idea how reliable vkm numbers are in Europe? In North America these numbers are almost always estimated from survey data and demand models which are not exactly precise (and often are biased toward current trends). Too bad that we do not collect vehicle odometer data each year when the annual registration fees are paid.
I don’t know. I would guess INSEE uses survey data – at the very least it would have to for RATP p-km figures, since the Metro only tracks where people get on, not where they get off.
Mileage is checked and recorded at every MOT. No idea if that data is shared or used.
Mileage is checked and recorded at every MOT. No idea if that data is shared or used.
Mileage is checked and recorded at every MOT (an annual check once a car is 3 years old). No idea if that data is shared or used.
I would guess a proxy would be toll data from Spain France or Italy.
Yes I know many roads in those countries aren’t tolled, but as I said, a proxy.
Good insights. I only take slight issue with the assertion that “travel convenience… can come in the form of a large rapid transit network or in that of cars and freeways” given the existence of wealthy European cities with ~40% cycle mode share.
Or mayors in rich cities that bike to work…
Do you find a difference between cities where either decision could be justified whether they choose light or heavy rail for their primary inner city transport?
E.g. Dresden (all light rail) vs Nuremberg (three lines heavy rail, five lines light rail after initial plans to shut the trams down)
I am not sure exactly what is included in your definition of “zoning,” but most every project in LA must go through multiple layers of planning and design review as well as going before a local community board, and large projects have to go through CEQA. These layers discourage new housing, and definitely discourage low-parking projects. So if there were no “zoning” density would definitely be higher (as well as congestion) and transit has no direct impact on density (except perhaps by building political support for density).
Also, all of this could be solved with accurately priced congestion fees (varying with actual traffic) that would encourage carpooling, TNC carpooling, as well as freeway buses.
And also, you are correct to focus on transit reducing driving externalities, which is why Maryland was right to go for the light-rail Purple line in richer areas, thereby moving people from cars to transit, rather than urban heavy rail in poor inner city Baltimore, where they are probably just shifting from buses and are not going to increase density due to Baltimore not being a desirable city. In fact, without upzoning, the T central line in SF makes no sense, as it just shifts from buses to subway, with minimal congestion effects.
The people in the subway aren’t in the congestion. There is more to life than making automobile trips pleasant
In my opinion riders are riders. Whether they be poor or rich. Projects should be judged by ridership per dollar, not whether the riders have many dollars.
I’m not sure I follow the argument here? How does lack of transit constrain developers from utilizing available zoning capacity? I guess I could see an argument about the cost of parking structures making certain levels not pencil out, but that’s not really what you’re stating. Either way, the core of Los Angeles is denser than Boston, Chicago, Philadelphia, SF, every transit oriented city besides NYC. (And the average commute time in LA is lower too…)
A largely meaningless statement and almost certainly not true if you compare like-with-like. You’ve snuck in the word “core” for LA and are presumably comparing with much big citywide areas for the others. But even there it is not true. For example, unlike most of these other examples, San Francisco is a precisely defined area and it has a density of a bit over 7,000/km2. In LA, Santa Monica is the densest residential area and it has a density of 4,240/km2, not much more than half of SFs. LA County has 800/km2 which is relatively high for such a large area in the US. Chicago’s Gold Coast is a tiny zone (0.54km2) with density 18,836 to 25,114/km2 (varies a lot depending on what space one excludes). Those few examples are probably at the extremes but I am sure Boston and Philadelphia have high-density zones too, that would exceed LA’s “core”. Brookline (17.7km2) in Boston has 3,337.0/km2.
By the way, discussion of “average” commutes is almost entirely muddied by such false comparisons. For example the metric is usually de facto by car. When NYC comes in ‘second worst’ after LA what does that mean when in NYC less than 50% of commuters are using cars while closer to double that are in LA (or Atlanta, Houston etc).
See my below reply to Alon
Parking podiums are a pretty hefty proportion of the cost in apartments. And then on top of it all, when there’s a lot of car traffic, the arterials lose value as residential sites because people don’t want to deal with the noise (cf. Manhattan, where avenues are more desirable than streets).
And no, the core of LA is not denser than that of these other cities. The densest part of LA, Koreatown, is about as dense as Japantown, both being the densest non-New York American neighborhoods, but on a scale of many contiguous square kilometers, this is not true. LA has dense areas if you go down to the census tract level, but they’re strewn all over the LA Basin – some near downtown, some in Hollywood, some on the Westside, some on the Eastside, some in Long Beach.
Common misconception. If you look at the “core” of LA – essentially Koreatown, Macarthur Park, Hollywood, stretching to Downtown / Boyle Heights – a shape as contiguous as most other “small” cities, the density is greater than any comparable city.
Take a look at http://maps.latimes.com/neighborhoods/region/central-la/ – it doesn’t map quite to the boundaries I have in mind (I’d swap a few neighborhoods east of the river for the Hollywood hills) but it gets the point across.
If you are gonna contort things there are lots of places that are denser, that are not Manhattan, east of the Rockies. Hudson County NJ for instance. Which isn’t as dense as Queens. Not much more than Philadelphia. In very round numbers, Boston. A bit more than all of Chicago.
Sure, and there are other parts of SoCal that are extremely dense, but not contiguous with the “core.” My point (and what the data bears out) is that Central Los Angeles is extremely dense, more so than every smaller city in the country.
If you’re comparing Chicago to LA, it’s important to remember that the daytime population of the loop/downtown is about 600K people in 3 sq. mi. While downtown LA is about 500K people in 9 sq. mi. The nighttime population density of the loop is lower than the surrounding residential neighborhoods, which are around 30-50K/sq. mi.
The nighttime densities seem somewhat similar between Koreatown & Chicago Northside neighborhoods, but daytime populations between downtown LA vs Chicago is pretty different. More than a factor of 2.
Chicago is an extreme hub & spoke, for better or worse… honestly, probably worse.
Chicago is also the long distance railroad hub of north America.
I once heard it takes freight as long to get from New York to Chicago as it does from one end of Chicago to the other…
So you’re just cherrypicking your data to confirm your biases.
LA Central has a density of 5,580/km2 which is 79% of San Francisco which happens to be very comparable in size: 122km2 versus 149km2. Approximately one fifth the density of Manhattan or Paris.
As in my earlier post one can always cherrypick zones to get an exaggerated result. Thus, to pick a roughly comparable sized zone/neighbourhood to Koreatown:
NYC Upper East Side: 219,920 (2010) on 5.23km2: 42,100/km2.
Close to 3 times the density of Koreatown. Interestingly that is almost identical to Paris’ densest neighbourhood:
Paris-11th: 152,500 in 3.7 km2 for 41,600/km2. (This is interesting because it rather dramatically shows that one doesn’t need hi-rise (ie. above the 6-7 floors of the 11th arrondissement) to equal the highest density of a hi-rise residential district of the US).
At least those three are neighbourhoods. But you can reduce it to smaller zones, such as Stuyvesant Town-Peter Cooper Village, NYC: 11,0250 apartments for 25,000 residents, on 32 hectare, 78,000/km2. But of course the smaller the unit the more artificial and meaningless it is. Stuy-Cooper Village doesn’t contain all the other things one needs in a city (retail, schooling, business, entertainment, hospitals, sporting facilities etc).
In my earlier post I of course chose Santa Monica because it is an incorporated city. The City of Los Angeles (which surrounds SM) has a density of 3,275/km2.
StuyTown has retail along the perimeter, most of the rest is just across the street. How about Co-op City which is almost self contained, at 12,600 per km?
My point was not about convenience or accessibility but that these particular entities are not “real” city and so are not valid to use as examples of what densities can be achieved in a city or neighbourhood.
Re Co-op City, it’s a mixed bag. I saw a news feature on it recently (probably PBS-Newshour) on the occasion of its 50th anniversary –di Blasio gave a speech. For all its faults it does still serve a useful low-cost housing function. But its like will never be built again for good reasons.
Are you really sure it has all amenities? There is a school but not clear if inside. If there were other things like retail it is not apparent.
Wiki says 43,752 residents on 2.42km2 for 18,000/km2. So, quite dense for US but still not the Manhattan or Paris average. From the urbanist angle it proves yet again that these Corbusian “towers in a park” don’t achieve what much nicer Haussmannian housing achieves even in maximising housing per land area. Worse, its buildings of 24 to 33 storeys are built on a swamp and despite deep pilings are sinking causing cracking, not necessarily structural but ugly. They used only 20% of the site for the buildings but over the decades a lot of that open space has been converted to surface car parking! The bit I saw was of a hugely wide street amidst a canyon of hi-rise ugliness. It has undergone a quarter billion dollar renovation but nothing can fix its design defects.
But perhaps the worst aspect is the peculiar form of “ownership” which may have had good intentions (… paving the road to hell). “Sold” at extremely low cost but “owners” are obliged to sell it back to the Co-op if they leave, at the original price! Known as “resale-restricted homeownership”.
This is ridiculous and creates an equity trap as “owners” cannot keep up with property prices anywhere in the real world and gain nothing from years or decades of ownership if they leave (meaning very few would willingly leave).
The better model is that the authority or state, sells at below-market rates but itself retains equity, say 50%, so if later sold at market rates both owner-occupiers and the state benefit. Probably also need a heavy CGT that only drops with time of occupation (to reduce turnover for the wrong reason). The state can (should be mandated to) return the “profits” back into the development or new social-housing. I suspect it is property developers that won’t allow such schemes–probably because they might be all too successful, ie. self-funding over time. Even though private industry doesn’t want to build for this sector of the market they rely on it to apply pressure on the rest of the housing market (and a “lesson” to the aspirant class to get on the property ladder or else …).
So, bottom line, from every point of view, it is pretty bad.
There are malls inside the complex. The towers are on pilings. Everything else is slowly sinking. Including the garages that were torn down. Which is why they took over lawns for parking when they were being rebuilt. Somebody finds it attractive, the wait lists are years long.
https://apps.hcr.ny.gov/AutomatedWaitingList/GenerateWaitlist.aspx
Select Co-op City( Riverbay ) from the drop down list.
(Co-op City)
You mean pilotis? The whole 9 yards of Corbusier!
It is ‘popular’ because it is New York City and is “cheap”. I don’t think one could conclude anyone thinks it is ‘attractive’. But as I said it is a trap unless you are happy to live there for the rest of your life. Not a real solution for affordable housing.
Article in today’s Guardian. This is pure Thatcherism. I suppose the Co-op City looks good in this context …
New Yorkers don’t freak out at tall building, they don’t think twice about living in an elevator building.
You seem intent on missing the point.
If, instead of 24 to 33 floors, the Co-op City had been built to Haussmannian proportions, including streets, it could have housed a lot more people and in cheaper-to-build, yet higher-quality housing. Better at street level, safer and more usable open space (small parks, squares etc).
When it costs more, generally produces low quality construction (especially for soc. housing), provides fewer housing units (per land area and per budget) and poor-quality urbanism, what reasons do you want to give for building these high-rise?
Supplementary question: why do you think everywhere in the west, they have stopped building stuff like this?
Oh, and in high-rise social housing like this, they usually have the minimum elevators and these are among the things that fail especially as they age (due to both age and vandalism if the ‘social’ part of the development isn’t perfect). So maybe you Noo Yawkers ought to think twice …
Actually, while it is fair enough that Co-op City was built back then (1968) the real question is whether they should have spent all that money on renovating it, instead of demolition and new build. The main problem with that is that it often displaces the most-needy households–ie. the malign influence of developers but also in the city which has trouble resisting the $$ that market-price would fetch. But there is so much free land they could probably do a phased build without making anyone homeless. This kind of post-war building is being demolished all over as they are at the end or well beyond their design life; there are 90 such estates in London (none as big as Co-op City but often 3 to 4 thousand apartments) and most are in line to be completely demolished and redeveloped, and always with low-rise and quite a lot more housing on the same site (check out the Heygate Estate and Aylesbury Estate, both under way).
The linked data are designations made up by the LA Times, not *official* boundaries of anything. That particular map includes the city of West Hollywood, which I would have excluded as it’s a separate municipality, specifically to try to avoid the accusation you’re making. We could include other cities like Maywood (~24,000 people /sq mi) – but again, for this exercise I’m trying to go off what is in the city of LA, to try to make an even simpler analogy to many monocentric cities. The reason I would have included a few neighborhoods east of the river (instead of West Hollywood / Hollywood hills) is that they developed earlier, ~1890 through 1910s, as opposed to 10s through 40s. My point being, again, that if you look at the core of LA, that is the contiguous, oldest neighborhoods, they have a density that’s greater than that of any smaller metro in the country.
Here’s another way that make what I’m trying to say clearer.
San Francisco is ~800,000 people in 47 square miles. If you take 47 square miles of “core” LA, it contains more people than that.
Chicago is ~2,700,000 people in 227 square miles. Similarly, if you expand out from LA’s core to 227 square miles, you’ll find it contains more than 2.7m people.
Rinse and repeat for any other size and density…
Here’s another way that make what I’m trying to say clearer.
That you get to cherry pick the data?
Are Manhattan avenues less congested than LA ones?! I just assumed that Manhattan buildings are taller and therefore further removed from the noise. Also, as I pointed out earlier that would lead to reduced demand and lower rents and that is not what we see.
They’re very congested, but you don’t need to care because there’s rapid transit.
You specifically referred to the noise on Los Angeles roads vs NYC not congestion.
Sure, and the noise is a disamenity either way, but in New York you get walkable retail, whereas in LA you need to drive for most of that.
Walkable retail doesn’t depend on transit; it depends on density.
It depends on transit insofar as if people own cars, they’ll drive to the hypermarket.
And rail breeds density where cars breed sprawl
In my, ahem, considerable experience living in big cities the most important thing is not congestion per se but the nature of the traffic and even the drivers. Buses are some of the worst things to live above, because they make an inordinate amount of noise (which is directed upwards–this is the opposite of cars which direct it under the car; it is to disperse their exhaust away from street level) and often have noisy air-brakes and are stopping and starting continuously. In Italy it is the damned small scooters which make a racket, lots of pollution and whose riders appear to rejoice in making as big a noise as possible very late at night/early morning, and police refuse to regulate. There are plenty of additional reasons but for this one alone I could not live in Italy–in some towns and villages I find it even worse than big cities–because in no time I would be up for manslaughter or GBH.
Though I never lived on a really major road in Paris, my impression has been that it is relatively tolerable at night (and improved by the solid buildings).
A lot of this road-related dis-amenity is going to transform over the next 10-15 years with electrification, at least in France (and northern Europe) where they will encourage and regulate the old stuff out of existence. Not so much in southern Europe like Italy and Spain where they will do nothing (as today). BTW, there is a big EU action on city noise, currently limited to comprehensive surveys but which ultimately will result in law (which again ClubMed will ignore).
Less green and open space. More density. More congestion. More foot traffic. Ever wonder why they called it “planned development”? We will pay the price now and later. California is for the dogs, literally. https://www.facebook.com/LAUSA2020/