Category: Transportation
Who Learns from Who?
My interactions with Americans in the transit industry, especially mainline rail, repeatedly involve their telling me personally or in their reports that certain solutions are impossible when they in fact happen every day abroad, usually in countries that don’t speak English. When they do reference foreign examples, it’s often shallow or even wrong; the number of times I’ve heard American leftists attribute cost differences to universal health care abroad (in most of these countries, employers still have to pay health benefits) is too high to count. Within the US, New York stands head and shoulders above the rest in its incuriosity. This is part of a general pattern of who learns from who, in which the US’s central location in the global economy and culture makes it collectively stupid.
Symmetric learning
Some learning is symmetric. The Nordic countries learn from one another extensively. The Transit Costs Project’s Sweden case study has various references in the literature to such comparisons:
- Eliasson-Börjesson-Odeck-Welde compare Sweden and Norway in the use of benefit-cost analyses for road projects.
- Smith-Sochor-Sarasini compare Sweden and Finland in Mobility as a Service.
- The Finnish transport ministry compares Finland’s public transport system with those of the other Nordic countries and a selection of other Northern European countries.
- The Nordic Council of Ministers has long worked on pan-Nordic horizontal ties; here is its report on investment in transport infrastructure.
- Södrström-Schulman-Ristimäki compare Stockholm and Helsinki’s urban forms.
- Nilsson-Nyström benchmark Sweden’s privatization of maintenance to Finland, the Netherlands, and Britain.
- LO’s report on labor rights and repression in Swedish tunnel projects compares the situation to that of Norway (where immigrant workers readily join unions) and Denmark (where they do at much lower rates, albeit higher than Sweden’s).
This goes beyond transportation. People in the four mainland Nordic states constantly benchmark their own national performance to that of the other three on matters like immigration, education, energy, corona, and labor. This appears in the academic literature to some extent and is unavoidable in popular culture, including media and even casual interactions that I had in two years of living in Sweden. Swedes who criticize their country’s poor handling of the corona crisis don’t compare it with Taiwan or South Korea but with Norway. Likewise, Swedes who think of a country with open hostility to immigration think of Denmark rather than, say, the United States, Italy, or Lithuania.
Other macro regions exist, too, with similar levels of symmetric learning. The German-speaking world features some of this as well: the advocacy group ProBahn has long championed learning from Switzerland and Austria, and the current Deutschlandtakt plan for intercity rail is heavily based on both Swiss practice and the advocacy of ProBahn and other technically adept activists. Switzerland, in turn, developed its intercity rail planning tradition in the 1980s and 1990s by adopting and refining German techniques, taking the two-hour clockface developed in 1970s Germany under the brand InterCity and turning it into a national investment strategy integrating infrastructure construction with the hourly timetable.
This, as in the Nordic countries, goes beyond transport. Where Swedes’ prototype for hostility to immigrants is Denmark, Germans’ is Austria with its much more socially acceptable extreme right.
Asymmetric learning
Most of the learning from others that we see is not symmetric but asymmetric: one place learns from another but not vice versa, in a core-periphery pattern. Countries and cities prefer to learn from countries that are bigger, wealthier, and culturally more dominant than they are. In our Istanbul case, we detail how the Turks built up internal expertise by bringing in consultants from Italy, Germany, and France and using those experiences to shape new internal practices.
In Europe, the biggest asymmetry is between Southern and Northern Europe. Few Spaniards, Italians, and Turks believe that their respective countries build higher-quality infrastructure than Germans – some readily believe that the costs are lower but assume it must be lower quality rather than higher efficiency. The experts know costs are low, but anything better from Northern Europe or France penetrates into Southern European planning with relative ease. It didn’t make it to the infrastructure-focused Italian case, but Marco Chitti documents how the German clockface schedule is now influencing Italian operations planning, for example here and here on Twitter. Spain’s high-speed rail infrastructure provides another example: it was deeply influenced by France in the 1990s, including the idea of building it, the technical standards and the (unfortunate) operating practices, but the signaling system is more influenced by Germany.
In contrast, in the other direction, there is little willingness to learn. Nordic capital planners and procurement experts cite other Northern European examples (in and out of Scandinavia) as cases to learn from but never Southern European or French ones. The same technically literate German rail activists who speak favorably of Swiss planning look down on French high-speed rail, and one American ESG investor even assumed Italy is falsifying its data. In the European core-periphery model, the North is the core and the South and East are the periphery, and the core will not learn from the periphery even where the periphery produces measurably better results.
Domestically, it’s often the case that smaller cities learn from larger ones in the same country. Former Istanbul Metropolitan staff members were hired by the state, and many staff and contractors went on to build urban rail projects in Bursa, İzmir, and Mersin. In France, RATP acts as consultant to smaller cities, which do not have in-house capacity for metro construction, and overall there is obvious Parisian influence on how such cities build their urban rail. In Italy, Metropolitana Milano has acted as consultant to other cities. This is the primary mechanism that makes construction costs so uniform within countries and within macro regions like Scandinavia.
In this core-periphery model, the Anglosphere is the global core, the United States views itself as its core (Britain disagrees but only to some extent), and New York is the core of the core. New Yorkers respond to any invocation of another city or country with “we are not [that country],” and expect that their audience will believe that New York is superior; occasionally they engage in negative exceptionalism, but as with positive exceptionalism, it exists to deflect from the possibility of learning.
This asymmetry may not be apparent in transportation – after all, Europe and Asia (correctly) feel like they have little to learn from the United States. But on matters where the United States is ahead, Europeans and Asians notice. For example, the US military is far stronger than European militaries, even taking different levels of spending into account – and Europeans backing an EU army constantly reference how the US is more successful due to scale (for examples, here, here, and here). Likewise, in rich Asia, corporations at least in theory are trying to make their salaryman systems more flexible on the Western model, while so little learning happens in the other direction that at no point did Europe or the US seriously attempt to imitate Taiwan’s corona fortress success or the partial successes of South Korea and Japan.
In this schema, it is not surprising that New York (and the United States more generally) has the highest construction costs in the world, and that London has among the highest outside the United States. Were New York and London more institutionally efficient than Italian cities, Italian elites would notice and adapt their practices, just as they have begun to adapt German practices for timetabling and intermodal integration.
Superficial learning
On the surface, Americans do learn from the periphery. There are immigrant planners at American transit agencies. There’s some peer learning, even in New York – for example, New York City Transit used RATP consultants to help develop the countdown clocks, which required some changes to how train control works. And yet, most of this is too shallow to matter.
What I mean by “shallow” is that the learning is more often at the level of a quip comment, with no followup: “[the solution we want] is being used in [a foreign case],” with little investigation into whether it worked or is viewed positively where it is used. Often, it’s part of a junket trip by executives who hoard (the appearance of) knowledge an refuse to let their underlings work. Two notable examples are ongoing in Boston and the Bay Area.
In Boston, the state is making a collective decision not to wire the commuter rail network. Instead, there are plans to electrify the network in small patches, using battery trains with partial wiring; see here and follow links for more background. Battery-electric trains (BEMUs) exist and are procured in European examples that the entire Boston region agrees are models for rail modernization, so in that sense, this represents learning. But it’s purely superficial, because nowhere with the urban area size of Boston or the intensity of its peak commuter rail traffic are BEMUs used. BEMUs trade off higher equipment cost and lower performance for lower infrastructure costs; they’re used in Germany on lines that run an hourly three-car train or so, whereas Massachusetts wants to foist this solution on lines where peak traffic is an eight-car train every 15 minutes.
And in San Jose, the plan for the subway is to use a large-diameter bore, wide enough for two tracks side-by-side as well as a platform in between, to avoid having to either mine station cavern or build cut-and-cover stations. This is an import from Barcelona Metro Lines 9 and 10, and agency planners and consultants did visit Barcelona to see how the method works. Unfortunately, what was missing in that idea is that L9 is by a large margin Spain’s most expensive subway per kilometer, and locally it is viewed as a failure. In Rome, the same method was studied and rejected as too risky to millennia-old monuments, so the most sensitive parts of Metro Line C use mined stations at very high costs by Italian standards. Barcelona’s use case – a subway built beneath a complex underground layer of older metro lines – does not apply to San Jose, which is building its first line and should build its stations cut-and-cover as is more usual.
No such superficiality is apparent in the core examples of both symmetric and asymmetric learning. Swedes, Danes, Finns, and Norwegians are acutely aware of the social problems of one another, and will not propose to adopt a system that is locally viewed as a failure. At most, they will propose an import that is locally controversial, with the same ideological load as at its home. In other words, if a Swede (or more generally a Western European) proposes to import a solution from another European country that is in its home strongly identified with a political party or movement, it’s because the Swede supports the movement at home. This can include privatization, cancellation of privatization, changes to environmental policy, changes to immigration policy, or tax shifts.
This includes more delicate cases. In general the US and UK are viewed as inegalitarian Thatcherite states in Sweden, so in most cases it’s the right that wants to Anglicize government practice. But when it comes to monetary policy, it was Stefan Löfven who tried to shift Riksbank policy toward a US-style dual mandate from the current single mandate for price stability, which the left views as too austerian and harsh toward workers; globally the dual mandate is viewed as more left-wing and so it was the Swedish left that tried to adopt it.
In contrast, in superficial learning, the political load may be the opposite of what it is in its origin country, because the person or movement who purport to want to import it are ignorant of and incurious about its local context. Thus, I’ve seen left-wing Americans proposing education reforms reinvent the German Gymnasium system in which the children of the working class are sent to vocational schools, a system that within Germany relies on the support of the middle-class right and is unpopular on the left.
Individual versus collective knowledge
Finally, I want to emphasize that the issue is less about individual knowledge and learning than about collective knowledge. Individual Americans are not stupid. Many are worldly, visit other countries regularly and know how things work there, and speak other languages as heritage learners or otherwise. But their knowledge is not transmitted collectively. Their peers view it at best as a really cool hobby rather than a key skill, at worst as a kind of weirdness.
For example, an American planner who speaks Spanish because they are a first- or second-generation Hispanic immigrant is not going to get a grant to visit Madrid, or for that matter Santo Domingo, and form horizontal ties with planners and engineers there to figure out how to build at low Spanish or Dominican costs. Their peers are not going to nudge them to tell them more about Hispanic engineering traditions and encourage them to develop their interests. American culture writ large does not treat them as benefiting from bicultural ties but instead treats them as deficient Americans who must forget the Spanish language to assimilate; it’s the less educated immigrants’ children who maintain the Spanish language. In this way, it’s not too different from how Germany treats Turks as a social problem rather than as valuable bicultural ambassadors to a country with four times Germany’s housing production and one third its metro construction costs.
Nor is experience abroad valued in planning or engineering, let alone in politics. A gap year is a fun experience. Five years of work abroad are the mark of a Luftmensch rather than valued experience on a CV, whereas an immigrant who comes with foreign work experience will almost universally find this experience devalued.
Even among the native-born, the standard pipelines through which one expresses interest in foreign ideas are not designed for this kind of learning. The United States most likely has the strongest academic programs in the world for Japanese studies, outside Japan itself. Those programs are designed to critique Japanese society, and Israeli military historian of Japanese imperialism Danny Orbach has complained that from reading much of the critical theory work on the country one is left to wonder how it could have ever developed. It goes without saying such programs do not prepare anyone to adapt the successes of the big Japanese cities in transportation and housing.
This, as usual, goes beyond transportation. I saw minimal curiosity among Americans in the late 2000s about universal health care abroad, while a debate about health care raged and “every rich country except the US has public universal health care” was a common and wrong line among liberals. Individual Americans and immigrants to the US might be able to talk about the French or Japanese or Israeli or Ghanaian health care system, but nobody would be interested to hear except their close friends; political groups they were involved with would shrug that off even while going off about the superiority of those countries’ health care (well, not Ghana’s, but all of the other three for sure, in ignorance of Israel’s deep problem with nosocomial infections, responsible for 9-14% of the national death rate).
The result is that while individual Americans can be smart, diligent, and curious, collectively the United States is stupid, lazy, and ignorant on every matter that other parts of the world do better. This is bad in public transportation and lethal in those aspects of it that use mainline rail, where the US is generations behind and doesn’t even know where to start learning, let alone how to learn. It’s part of a global core-periphery model in which Europe hardly shines when it comes to learning from poorer parts of Europe or from non-Western countries, but the US adds even more to that incuriosity. Within the US, the worst is New York, where even Chicago is too suspect to learn from. No wonder New York’s institutions drifted to the point that construction costs in the city are 10 times higher than they can be, and nearly 20 times as high as absolute best practice.
More on Six-Minute Service in New York
Two years ago I wrote about how New York should aim to run every bus and subway service every six minutes off-peak. Buses would require a combination of aggressive bus redesign and speedup treatments for this to be viable. The subway already has very low variable operating costs off-peak and such a boost in frequency would naturally increase efficiency; New York City Transit gets around 550 service-hours annually per train driver, whereas the Berlin U-Bahn with its flat all-day schedule gets around 900. But now, the more mainstream New York-area transit advocacy group Riders’ Alliance has its own proposal for six-minute service, which it has aggressive marketed using the hashtag #6minuteservice.
This is a good campaign and I hope more people in the region take notice and push for it until the state implements it in full. The impact on passenger convenience is massive, not just in the form of shorter waits but also higher reliability coming from better timetabling, and hopefully also slightly more speed coming from said higher reliability. The proposal says that it would take $250 million a year in extra spending to effect this system, and it’s unknown but plausible that it would increase ridership by enough to defray this cost entirely, even without any efficiency treatments to reduce unit costs.
What’s in the Riders’ Alliance proposal?
Between 5 am and 9 pm on weekdays, and between 8 am and 10 pm on weekends, all subway routes and the top 100 bus routes in the city should run at worst every six minutes. This echoes a report by the comptroller’s office from last year, recommending this as an alternative to rush hour-focused service by bringing up corona-related ridership decreases.
It’s not stated but I think the subway routes in question are reckoned by letter or number, which means the A train runs every six minutes but each of its two branches runs every 12. This is fine – the two branches of the A are exceptionally far out, which is why a single service splits to them, where elsewhere in New York each branch gets its own number or letter.
The implications for timetabling
Timetabling a consistent all-day service is much easier than timetabling bespoke service patterns. The Riders’ Alliance proposal aims to face the general public rather than planners and therefore omits this benefit, but this benefit reaches passengers as well, in non-obvious ways.
First, if all trains and buses run every six minutes, then it’s possible to set up clockface timetables. These don’t matter very much if they run every six minutes, but they do if they run every 12, as I expect the two A branches to. The same is true of buses that branch: some outer ends may run every 12 minutes, in which case they can and should run on repeating clockface timetables that passengers can memorize. Passengers who can remember “my bus leaves at :01, :13, :25, :37, and :49” without having to consult timetables or trip planners all the time are likelier to take the trip; this was my commute for a year in Vancouver.
The A train today runs every 15 minutes on each branch but it’s not on a consistent clockface schedule, which depresses ridership. In effect, current practice is little different from what Swiss planners warn of: they say the best way to reduce ridership is to run service every 11, 13, or 17 minutes, rather than every 12 or 15 on a clockface pattern.
Second, if all trains run on the same frequency, then service planning on a complexly interlined system like New York’s becomes more tractable. Today, every train runs on a separate frequency, often different from the services it shares track with. The 2 and 3 trains share track most of the way, from Franklin Avenue to 135th Street, but the 2 is just a little more frequent, resulting in the following northbound timetable at Franklin:
10:03: 2
10:07: 3
10:12: 2
10:15: 3
10:21: 2
10:28: 3
10:32: 2
10:34: 3
10:37: 2
10:41: 3
10:43: 2
10:49: 2
10:51: 3
10:57: 3
11:01: 2
11:03: 3
11:09: 2
11:15: 3
11:17: 2
11:22: 3
11:24: 2
11:28: 3
This is irregular both on the trunk and on each individual service – the 2 on average runs every eight minutes but has a 12-minute gap, and the 3 runs on average every nine but also has a 12-minute gap. It’s an unavoidable consequence of the combination of extensive reverse-branching and subway frequency guidelines that run different services at different headways. The six-minute service proposal straightens this by aligning the trains to a single frequency, with regular alternation between successive trains on trunks.
And third, another benefit of a regular frequency to planning is that schedule planners can reliably avoid merge conflicts. This, in turn, speeds up service, which is full of planned delays and schedule padding at pain points. It’s not a full substitute for deinterlining, which would eliminate the merge conflicts at the worst junctions, but it makes it viable to no longer write impossible schedules with the planning department that New York City Transit has.
Service quality and demographics
Both Riders’ Alliance and the comptroller report it uses as its source point out demographic differences between peak and off-peak riders: rush hour subway commuters have a median income of $50,783 a year, even higher (slightly) than drivers, but off-peak subway commuters have a median income of $37,048 and bus commuters have a median income of $30,374.
In both reports this is taken to be indicative that off-peak service is mostly for poorer people, but it’s not the right analysis. The picture that emerges from the data is not that in general rush hour commuters outearn off-peak commuters; for one, most off-peak commutes are done by car, not by public transportation. Rather, what’s going on is that off-peak public transit quality is bad and this suppresses ridership among those who can afford a car.
By the same token, we can look at the incomes of commuters in regions of the United States that have no public transit to speak of – maybe some buses or even a few trains but with rounding-error ridership and low single-digit modal split. In metro New York, public transit and car commuters have about the same median income, and in some secondary transit cities like Chicago public transit commuters actually outearn drivers, since service to non-CBD destinations is so bad it suppresses ridership below median income more than above it. But in places like Los Angeles, the median income of transit commuters is not much more than half that of car commuters, because service quality is so bad that anyone who can afford to drive does.
The upshot of this is that better off-peak transit service is going to increase the average income of off-peak transit users, by attracting people who currently drive. This is also going to lead to higher-socioeconomic status shifts: higher levels of degree attainment, a larger proportion of white riders, a larger proportion of native-born riders.
I bring this up because a rise in the relative average income of users as service quality improves means the improvement is working as intended. It doesn’t mean the subway is gentrifying or turns away poorer riders, it just means it no longer repels riders who can afford to drive. This is important, because too much American transit planning is based on market segmentation in which service is supposed to be for a specific class of rider, and if the demographics are changing it means it’s being revamped for a different class. In reality, there’s just one transit system for one city and income differences are indicative of quality differences and not of inherent differences in the travel market.
How much does this cost? What is the ridership impact?
The Riders’ Alliance proposal says the additional cost of the program is $250 million a year in operating expenses. In 2019, NYCT spent $8.8 billion on operations and got $4.6 billion in fares, so this is in theory a 6% increase in subsidy, and in practice a little less as better service attracts more fare-paying riders. This is without any concurrent attempts to use the increase in service to increase efficiency (read: reduce unit staffing levels) and, I think, without bus speedups that permit much higher frequency for the same cost.
It’s unclear what the revenue impact should be; the ridership impact can be estimated from longstanding results in the literature about ridership-frequency elasticity, which in the case of NYCT should be about 0.4. The proposal increases off-peak service on the subway by around 50% in principle and a bit more in practice because of the reduced variability in frequency, say two-thirds: most lines are to go from 10- to six-minute headways and the rest, which are mostly more frequent than this, get a smaller increase that we round up to two-thirds by taking the impact of higher reliability into account. This means an increase in off-peak ridership of around 23%. The bus impact is even larger – in Brooklyn the median bus headway is right between 12 and 15 minutes, and even taking into account that the busiest buses do much better, this is close to a doubling of the effective frequency.
In turn, most ridership is off-peak. In 2019, peak (7-10 am) ridership into the Manhattan core was 923,000 per weekday, amounting to 44% of ridership entering the Manhattan core on a weekday, or around 33% of all inbound weekday ridership and 27% of all ridership. Even adding a bit to account for peak ridership that doesn’t enter Manhattan, only about a third of subway ridership in New York was at the peak before corona; the peak share has fallen since, but is slowly creeping back up as workers slowly return to the office. Raising two-thirds of ridership by 23% is massive – it’s a 15% systemwide increase for a much smaller increase in operating costs, and a somewhat larger increase in bus ridership to boot.
Unfortunately, I can’t turn this into a revenue impact estimate. While the demographics in the section above specify off-peak commuters, the studies that my ridership estimate is based on measure riders, including peak commuters who ride more often for non-work trips. Such riders already have monthly passes, so making it easier for them to ride is excellent for the city’s long-term health but doesn’t defray the added cost. Converted riders who are not already on the system as well as the odd peak rider who doesn’t already have a pass do generate more revenue, but I don’t know how many there are; these need to be a little more than a third of the overall increase in ridership to fully defray costs, which sounds plausible to me.
Subway Expansion to Kingsborough Community College
One of the perennial wishlist items for New York subway expansion is Nostrand Avenue. The 2 and 5 trains run under the avenue between Eastern Parkway and Brooklyn College, a distance of 4 km; from the start, the line was intended to be extended farther south, and in both the 1950s and 1970, there were plans for such extension as well as one shortly to the east under Utica, to be built right after Second Avenue Subway. The case for Nostrand and Utica remains strong – these two streets host Brooklyn’s two busiest buses (the B44 and B46 respectively), and another top route, the B41 on Flatbush, is closely parallel. The purpose of this post is to ask what the southern end of Nostrand should be, and whether a longer extension going to Kingsborough Community College is a good idea.
Nostrand: current plans
All plans I am aware of for extending the subway under Nostrand have it following the street to Sheepshead Bay. For example, my proposal from 2019 would terminate it right at the water, at Emmons Avenue, where the B44’s southern end is. This reflects official proposals over the last few generations: a Nostrand subway is to run just under Nostrand.
Kingsborough Community College
Right across geographic Sheepshead Bay from the neighborhood named after the bay, the eastern end of geographic Coney Island comprises the neighborhood of Manhattan Beach. It is not a dense area, and for the use of residents, there are buses to the Brighton Beach subway station. However, at the easternmost end of Manhattan Beach, Kingsborough Community College (KBCC) is a huge destination.
How huge? The bus serving it, the B1, is one of the busiest in Brooklyn, with some rush hour runs just operating back and forth as short-hop shuttles between Brighton Beach and KBCC, a distance of 2 km. Frequency at rush hour reached a bus every 3-4 minutes before corona.
This is not easily legible to commuter-oriented planning tools like OnTheMap. That area has only 1,000 jobs; KBCC itself doesn’t generate many jobs, nor does it anchor other industries around it that aim to employ graduates. Those planning tools can capture other universities if they’re more residential and higher-end – those have a higher ratio of faculty to students, have ample research labs, and anchor employers who look to locate near residential students. In contrast, a commuter college is largely invisible to them. In reality, there are 18,000 students, all of whom commute from elsewhere.
How much ridership does this generate?
KBCC has 18,000 students, and the overall area has 1,000 workers. If the modal split were 100%, this should generate 38,000 trips per weekday; commuter colleges don’t generate as many non-commute trips as do residential colleges. In reality, the modal split is not 100%, but it should be high given the low car ownership rates in the city, especially low for college students.
The bigger question is what proportion of the travel market would ride a Nostrand subway in preference to a rail-bus connection at Brighton Beach. This in turn depends on the state of the rest of the system. If the Interborough Express or some variant of it is already built, then from all points on or north of the IBX route, an all-rail route is superior to a rail-bus connection. If it isn’t, then it’s dicier, and from much of Southern Brooklyn from the Brighton Line to the west, the B1 is likely faster.
IBX should be built ahead of such a connection based on current plans, so the assumption should be the more optimistic one – and, of course, if there is long-term planning for subway extensions, then this should figure as an argument in favor of IBX. KBCC is hardly the only place that, despite being far from IBX, IBX can help riders access. In that scenario, 30,000 trips a day are not unrealistic, and 20,000 should be conservative.
How much should this cost?
I do not know. In an unusual inversion, I’m more confident of the benefits than the costs. The travel market is fairly circumscribed. In contrast, the costs have a question mark, because of the premium coming from underwater construction.
With no premium at all, New York should be able to reduce its construction costs for subways to $200 million per km on average, and less on easy sections, that is, on outer extensions of the system in the Outer Boroughs. But Nostrand has a high water table, and the underwater segment across Sheepshead Bay is not easy; figure $250-300 million per km, with a wide error margin.
This is not an onerous cost. It’s about 600-700 meters longer than the usual plan for Nostrand to Emmons, and presumably the whole route would be built at once with a tunnel boring machine, so the fixed costs are already paid. So $200 million is probably a reasonable cost.
Eno’s Project Delivery Webinar
Eno has a new report out about mass transit project delivery, which I encourage everyone to read. It compares the American situation with 10 other countries: Canada, Mexico, Chile, Norway, Germany, Italy, South Africa, Japan, South Korea, and Australia. Project head Paul Lewis just gave a webinar about this, alongside Phil Plotch. Eno looks at high-level governance issues, trying to figure out if there’s some correlation with factors like federalism, the electoral system, and the legal system; there aren’t any. Instead of those, they try teasing out project delivery questions like the role of consultants, the contracting structure, and the concept of learning from other people.
This is an insightful report, especially on the matter of contract sizing, which they’ve learned from Chile. But it has a few other gems worth noting, regarding in-house planning capacity and, at meta level, learning from other people.
How Eno differs from us
The Transit Costs Project is a deep dive into five case studies: Boston, New York, Stockholm (and to a lesser extent other Nordic examples), Istanbul (and to a lesser extent other Turkish examples), and the cities of Italy. This does not mean we know everything there is to know about these cases; for example, I can’t speak to the issues of environmental review in the Nordic countries, since they never came up in interviews or in correspondence with people discussing the issue of the cost escalation of Nya Tunnelbanan. But it does mean knowing a lot about the particular history of particular projects.
Eno instead studies more cases in less detail. This leads to insights about places that we’ve overlooked – see below about Chile and South Korea. But it also leads to some misinterpretations of the data.
The most significant is the situation in Germany. Eno notes that Germany has very high subway construction costs but fairly low light rail costs. The explanation for the latter is that German light rail is at-grade trams, the easiest form of what counts as light rail in their database to build. American light rail construction costs are much higher partly because American costs are generally very high but also partly because US light rail tends to be more metro-like, for example the Green Line Extension in Boston.
However, in the video they were asked about why German subway costs were high and couldn’t answer. This is something that I can answer: it’s an artifact of which subway projects Germany builds. Germany tunnels so little, due to a combination of austerity (money here goes to gas subsidies, not metro investments) and urbanist preference for trams over metros, that the tunnels that are built are disproportionately the most difficult ones, where the capacity issues are the worst. The subways under discussion mostly include the U5 extension in Berlin, U4 in Hamburg, the Kombilösung in Karlsruhe, and the slow expansion of the tunneled part of the Cologne Stadtbahn. These are all city center subways, and even some of the outer extensions, like the ongoing extension of U3 in Nuremberg, are relatively close-in. The cost estimates for proposed outer extensions like U7 at both ends in Berlin or the perennially delayed U8 to Märkisches Viertel are lower, and not too different per kilometer from French levels.
This sounds like a criticism, because it mostly is. But as we’ll see below, even if they missed the ongoing changes in Nordic project delivery, what they’ve found from elsewhere points to the exact same conclusions regarding the problems of what our Sweden report calls the globalized system, and it’s interesting to see it from another perspective; it deepens our understanding of what good cost-effective practices for infrastructure are.
The issue of contract sizing in the Transit Costs Project
Part of what we call the globalized system is a preference for fewer, larger contracts over more, smaller ones. Trafikverket’s procurement strategy backs this as a way of attracting international bidders, and thus the Västlänken in Gothenburg, budgeted at 20,000 kronor in 2009 prices or around $2.8 billion in 2022 prices, comprises just six contracts. A planner in Manila, which extensively uses international contractors from all over Asia to build its metro system (which has reasonable elevated and extremely high underground costs), likewise told us that the preference for larger contracts is good, and suggested that Singapore may have high costs because it uses smaller contracts.
While our work on Sweden suggests that the globalized system is not good, the worst of it appeared to us to be about risk allocation. The aspects of the globalized system that center private-sector innovation and offload the risk to the contractor are where we see defensive design and high costs, while the state reacts by making up new regulations that raise costs and achieve little. But nothing that we saw suggested contract sizing was a problem.
And in comes Eno and brings up why smaller contracts are preferable. In Chile, where Eno appears to have done the most fieldwork, metro projects are chopped into many small contracts, and no contractor is allowed to get two adjacent segments. The economic logic for this is the opposite of Sweden’s: Santiago wishes to make its procurement open to smaller domestic firms, which are not capable of handling contracts as large as those of Västlänken.
And with this system, Santiago has lower costs than any Nordic capital. Project 63, building Metro Lines 3 and 6 at the same time, cost in 2022 PPP dollars $170 million/km; Nya Tunnelbanan is $230 million/km if costs don’t run over further, and the other Nordic subways are somewhat more expensive.
Other issues of state capacity
Eno doesn’t use the broader political term state capacity, but constantly alludes to it. The report stresses that project delivery must maintain large in-house planning capacity. Even if consultants are used, there must be in-house capacity to supervise them and make reasonable requests; clients that lack the ability to do anything themselves end up mismanaging consultants and making ridiculous demands, which point comes out repeatedly and spontaneously for our sources as well as those of Eno. While Trafikverket aims to privatize the state on the British model, it tries to retain some in-house capacity, for example picking some rail segments to maintain in-house to benchmark private contractors against; at least so far, construction costs in Stockholm are around two-fifths those of the Battersea extension in London, and one tenth those of Second Avenue Subway Phase 1.
With their broader outlook, Eno constantly stresses the need to devolve planning decisions to expert civil servants; Santiago Metro is run by a career engineer, in line with the norms in the Spanish- and Portuguese-language world that engineering is a difficult and prestigious career. American- and Canadian-style politicization of planning turns infrastructure into a black hole of money – once the purpose of a project is spending money, it’s easy to waste any budget.
Finally, Eno stresses the need to learn from others. The example it gives is from Korea, which learned the Japanese way of building subways, and has perfected it; this is something that I’ve noticed for years in my long-delayed series on how various countries build, but just at the level of a diachronic metro map it’s possible to see how Tokyo influenced Seoul. They don’t say so, but Ecuador, another low-cost Latin American country, used Madrid Metro as consultant for the Quito Metro.
Quick Note: What’s a Megaproject?
I gave my webinar talk about the Stockholm case and uploaded the video here. I don’t want to repeat either the case or my presentation thereof, but rather just point to one thing I said during the Q&A, about what counts as a megaproject. At the time I thought it was just an extemporaneous answer, but Sandy Johnston highlit it in his livetweeting, and I think it has some deeper meaning.
The issue at hand is that the definition of what a megaproject is is relative to local capabilities and practices. Building 5 km of subway tunnel is a megaproject if you’re an American city or a small European capital, but not if you’re a large European or Asian city. What I mean by this definition is that the usual properties of megaprojects are relative to local capabilities in the following ways:
- Megaprojects are hotly debated politically at the highest level – Crossrail and High Speed 2 were in the manifestos of both Labour and the Conservatives, and Grand Paris Express evolved with direct government involvement. In smaller cities, projects of similar levels of political importance are as one might expect smaller, like Citybanan (which is 6 km) and Nya Tunnelbanan (which is 19 km); in turn in Paris, extensions of the Métro totaling 19 km happen gradually without such political involvement.
- Megaprojects are institutionally new. Grand Paris Express not only was decided by the government, as an expansion of Métro service almost as long as the preexisting system, but also stretched project management capacity to the point of collapse, setting up the cost overrun; thus, the current project is being built using institutionally novel techniques including a single-purpose delivery vehicle with some design-build aspect.
- Megaprojects have a large, noticeable impact on the city or region if built; this can be an economic impact as with transport projects, but also a cultural impact, as with the Sydney Opera House, whose factor of 15 cost overrun is a case study in Bent Flyvbjerg’s oeuvre.
In a way, this means megaprojects are defined by cost. A 3 km expansion of the T-bana is not a megaproject, let alone a 3 km expansion of the Istanbul Metro, but a 3 km expansion of the New York City Subway is, because it’s a full order of magnitude costlier. A lower-cost city or country is one that builds more, simply because more projects are cost-effective, and thus it has more projects that are below the threshold of what counts as a megaproject and instead are routine extensions.
The Transit Costs Project hasn’t consciously made any comparison of megaprojects with technically similar non-megaproject transit expansion. The Istanbul case comes closest with its focus on Marmaray and smaller metro projects, but Istanbul Metro expansion writ large should be viewed as a megaproject (it’s certainly planned and politicized as such), and Marmaray is genuinely more technically difficult than just about any other urban rail project. A vulgar quantitative comparison across our database is probably infeasible – there are too few examples by definition, and, moreover, because megaprojects are in practice defined by cost, they’re likelier to be more expensive, even if their specific features do not raise costs.
That said, I do believe that megaprojects are likely to be costlier than equivalent non-megaproject extensions. Stockholm is not a good example for this because it isn’t doing incremental urban rail expansion, only megaprojects. But Paris is a good example, and the per-km cost rose dramatically in the wake of Grand Paris Express. In Barcelona, L9 is a very expensive megaproject; part of its mega- status comes from its worse-than-factor-of-3 cost overrun, but it’s also a large extension of the metro and its construction technique, a large-diameter tunnel boring machine, was new.
Berlin is more complex. We’ll need to wait to see which of the U-Bahn extensions under discussion are built, but those are liminally mega-, sharing some features of megaprojects (namely, political debate, consisting of modal warfare between U-Bahn and streetcar expansion) but not others (they’re not institutionally new and nobody claims they’re transformational for the city). That said, I tilt toward not viewing them as a megaproject, because the debate over them is more general modal warfare, in the same way I don’t think a project subject to debate over spending versus austerity or road versus public transport investment is a megaproject. The key political attribute is not that there’s any political debate, but rather that the political debate introduces politicization of technical decisions over alignment and construction methods; the modal warfare in urban Germany between streetcars and rapid transit is a proxy for much broader fight between consumption- and quality of life-oriented urbanism on the one hand (favoring streetcars and bike lanes) and production- and job access-oriented urbanism on the other (favoring rapid transit and also motorway construction).
IBX Cannot be a Tram
Clay Guse of the NY Daily News reports that in New York, the plans for the Interborough Express connector between Brooklyn and Queens are starting to lean in the direction of light rail. To be very clear, light rail in this context just means running light rail vehicles on infrastructure that is entirely grade-separated, either in the Bay Ridge Branch right-of-way (which has a handful of freight trains and is mostly wide enough for light rail and freight on separate tracks) or on viaducts (over the sections of the branch that are too narrow). I do not think there is any plan to downgrade IBX to a tramway. However, on Twitter I was asked about this anyway: why not make it a tramway, for more on-street flexibility?
What is a tram? Or a streetcar? Or light rail?
A tram or streetcar is a rail vehicle that runs predominantly on-street. The quality of the right-of-way may vary, from full mixed traffic as was traditional, to dedicated lanes that may be shared with buses and emergency traffic, to a grassy median that is no longer usable by road vehicles. But the distinguishing feature of the streetcar is that it runs on a street.
The doesn’t mean the streetcar has to run on-street the entire way. Street running is slow, even with dedicated lanes. Paris’s T3, an orbital tram in the grassy median of the Boulevards des Maréchaux on the outer margin of the city, averages 18 km/h. Berlin’s streetcars average 19 km/h; a handful of central sections are mixed-traffic but most have dedicated lanes, and in outer parts of the city there’s just less traffic and lines are generally faster.
There are two main ways to speed up the streetcar: make it faster in city center via tunneling (called subway-surface, Stadtbahn, or premetro), or make it faster outside city center by finding grade-separated rights-of-way (called tram-trains). Confusing, both subway-surface and tram-train systems are called light rail in the US, and Germany’s most celebrated tram-train, that of Karlsruhe, is also called Stadtbahn. Because these systems have evolved from all-surface streetcars, the separation between them and streetcars is not always perfect, which is why the American distinction between light rail (either subway-surface or tram-train) and streetcar (all on-street) is sometimes muddied in popular reporting.
Can IBX function as a tram variant?
No.
The problem with running an orbital tram parallel to the right-of-way is that there is no good street for it to run on. On the map below, the thick black line denotes the right-of-way that IBX is to use:
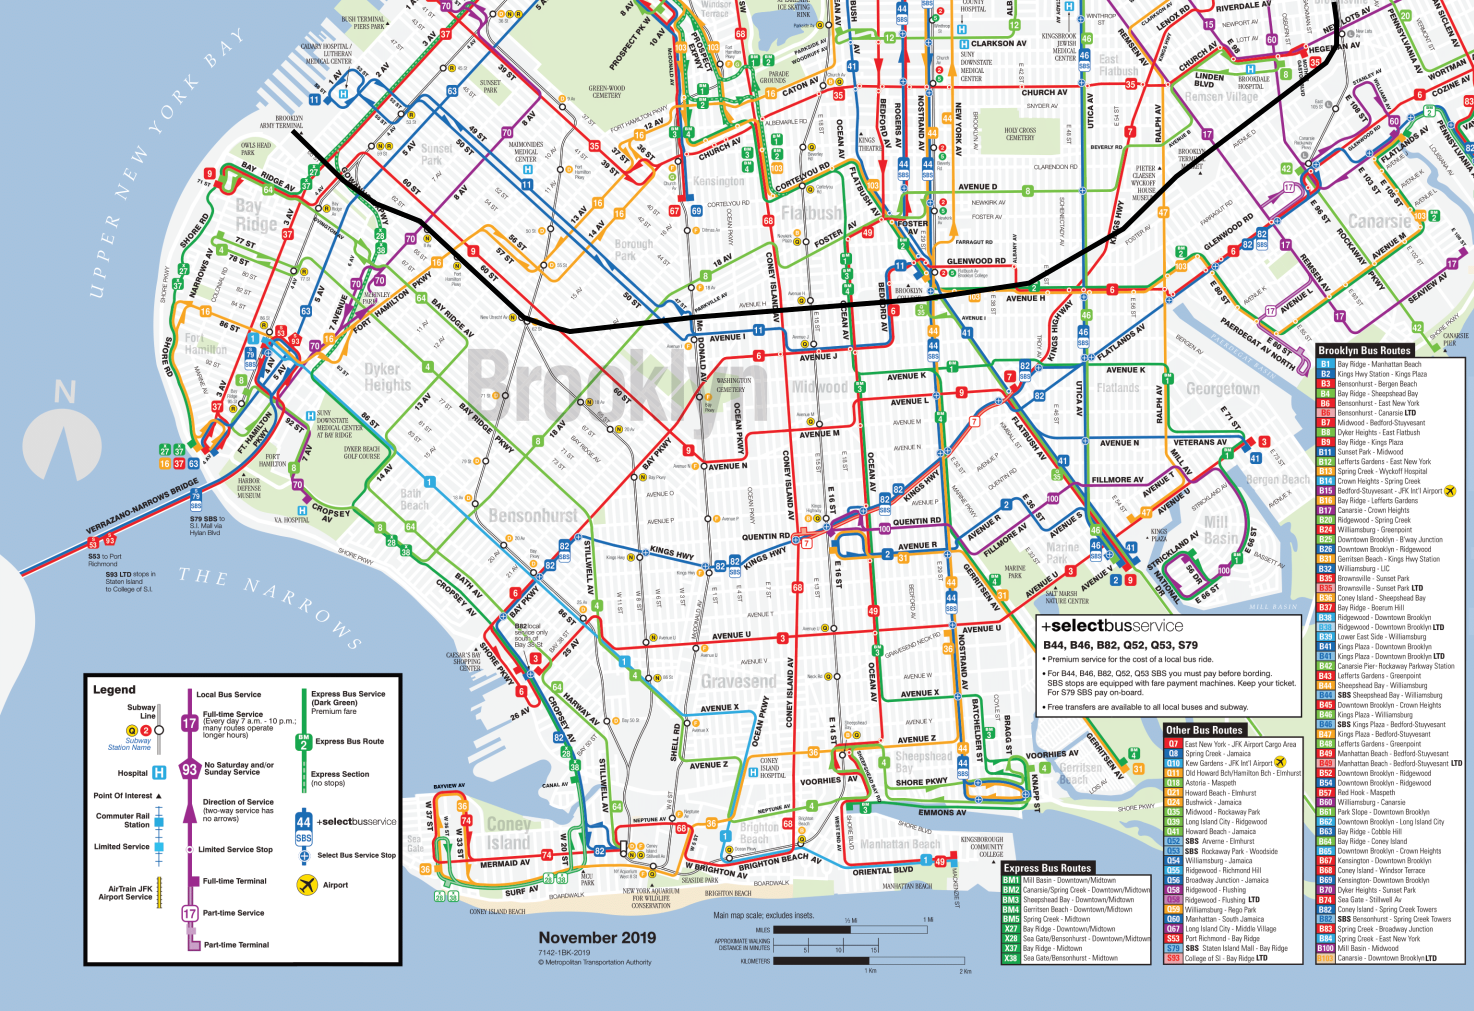
There are no on-street alternatives to the right-of-way. Brooklyn has three major orbital buses: the B35 on Church, and the B6 and B82. Church is not wide – dedicated lanes there would be contentious and still produce inferior speeds to those of T3, let alone streetcars in less dense cities; it’s a great corridor for dedicated bus lanes, but not for a tram. The B6 and B82 shift between different streets, as do other crosstown routes, like the B1, B3, B8, B9, and B11. Even Kings Highway is only 24 meters wide.
This, in turn, is why IBX is such a great idea: it provides service that the surface bus networks can’t provide, because the quality of rights-of-way is poor unless one uses the Bay Ridge Branch. When the street network is poor, surface transit ridership is suppressed relative to travel demand, which means that a rapid transit service like IBX will overperform any model trained on existing travel volumes.
This is also why no variant with any street running is viable. Not only is there no good street for a streetcar, but also there is no section of a street that is good for a streetcar. The narrow sections of the Bay Ridge Branch right-of-way, mainly the segment between the F and Q trains, don’t parallel any convenient street.
Moreover, subway-surface alignments work by branching the grade-separated core into many surface branches, but there is no good tie-in. Circumferential lines sometimes do branch, but the best use case is when there are major destinations just off the route. This is not the case for IBX: Brooklyn College is on-route. The most significant destination in Brooklyn off the route is Kings County Hospital/SUNY Downstate, which is unusually poorly-served by the street network even by Brooklyn standards, and is therefore only on one bus route, the B12, rather than at the intersection of multiple buses as it ideally should be. There is no viable surface deviation off of the IBX right-of-way that serves it.
So why light rail?
The modal alternatives analysis seems biased in favor of light rail. This, to be clear, is not light rail as a service or infrastructure technology – the plan is to use viaducts wherever the Bay Ridge Branch right-of-way is too narrow for IBX and freight tracks side by side. Rather, the plan is to use light rail vehicles on a service that is entirely rapid transit.
This has precedent in the United States. In the same manner that historic streetcars evolved into subway-surface lines in Boston, Philadelphia, and San Francisco, and into the tram-trains that are called light rail elsewhere (with inspiration from Germany, brought in by American troops serving there in the Cold War), some light rail lines evolve into fully grade-separated rapid transit. It’s uncommon, because usually the parts that are left on the surface are the most difficult to construct, but it does exist. The Green Line in Los Angeles runs LRVs on a fully grade-separated right-of-way, mostly in the median of the 105, and the Gold Line’s initial section to and beyond Pasadena has just 1.5 km of street running, on Marmion Way. In Calgary and Dallas there are plans to bury light rail lines, which could result in fully grade-separated lines that still run LRVs and are locally conceived of as light rail.
But in New York, this is not a wise course of action. Running rapid transit with LRVs is great for a city that has LRVs but not subway trains, like the Los Angeles of the early 1990s. A city with both may potentially still elect to use LRVs if it expects some surface extensions. But New York has large-scale operations and maintenance for subway rolling stock, and none for LRVs. The only light rail in the region is in Jersey City and Newark, which do not share management or maintenance facilities with the city, and couldn’t do the latter even if they wanted to since they’re on the wrong side of the Hudson.
If intermediate-capacity transit is desired, New York could build shorter platforms, only long enough for 4- or 5-car trains. If even less capacity is desired, it could go down to 2-car platforms; the rolling stock would need to be somewhat captive to the line, since the rest of the system runs permanently coupled 4- and 5-car trains, but that’s completely normal for a large subway system, and heavy maintenance facilities can still be shared. I’m wary of reductions in capacity just for the sake of downsizing – this is an entirely above-ground project, so station costs are not as onerous as they are underground – but I can see a case for smaller trains.
I can’t find a good reason for this preference for light rail over subway equipment for what is, by infrastructure and service, rapid transit. I can find many bad ones, of which the most likely is a desire for something different from the subway with all the connotations it has.
But this does not mean that the IBX plan is a tram. It’s not; it’s rapid transit service, which could easily be a normal subway, running LRVs for bad reasons.
The Sweden Cost Report is Launched!
You can read it here. It evolved a lot during writing, partly because of the rising costs in the Nordic countries, partly because of the tension between the forward-looking rhetoric of what the report calls the globalized system and what interviewees with more practical involvement have said, partly because of the voluminous literature on models of capital construction and maintenance that only look at Northern Europe or the UK.
In a similar manner to the webinar about the Italian and Turkish cases, there is going to be a webinar about this one. The date is the 20th of September, 17:00 Central European Summer Time (UTC+2); here is the Zoom registration page. It will take the format of a short presentation, around half an hour, to be followed by a Q&A of indefinite duration, and I will try not to be mostly negative – even with the cost overruns, Nya Tunnelbanan is noticeably cheaper per km than the average 2020s subway, and there are a lot of commendable aspects of the Nordic model of infrastructure construction including at least one (labor efficiency) that is superior to the otherwise-cheaper Southern European models.
Deinterlining and Schedule Robustness
There’s an excellent Uday Schultz blog post (but I repeat myself) about subway scheduling in New York. He details some stunning incompetence, coming from the process used to schedule special service during maintenance (at this point, covering the entirety of the weekend period but also some of the weekday off-peak). Some of the schedules are physically impossible – trains are scheduled to overtake other trains on the same track, and at one point four trains are timetabled on the same track. Uday blames this on a combination of outdated software, low maintenance productivity, aggressive slowdowns near work zones, and an understaffed planning department.
Of these, the most important issue is maintenance productivity. Uday’s written about this issue in the past and it’s a big topic, of similar magnitude to the Transit Costs Project’s comparison of expansion costs. But for a fixed level of maintenance productivity, there are still going to be diversions, called general orders or GOs in New York, and operations planning needs to schedule for them. How can this be done better?
The issue of office productivity
Uday lists problems that are specific to scheduling, such as outdated software. But the software is being updated, it just happens to be near the end of the cycle for the current version.
More ominous is the shrinking size of ops planning: in 2016 it had a paper size of 400 with 377 positions actually filled, and by 2021 this fell to 350 paper positions and 284 actually filled ones. Hiring in the American public sector has always been a challenge, and all of the following problems have hit it hard:
- HR moves extraordinarily slowly, measured in months, sometimes years.
- Politicians and their appointees, under pressure to reduce the budget, do so stupidly, imposing blanket hiring freezes even if some departments are understaffed; those politicians universally lack the competence to know which positions are truly necessary and where three people do the job of one.
- The above two issues interact to produce soft hiring freezes: there’s no hiring freeze announced, but management drags the process in order to discourage people from applying.
- Pay is uncompetitive whenever unemployment is low – the compensation per employee is not too far from private-sector norms, but much of it is locked in pensions that vest after 25 years, which is not the time horizon most new hires think in.
- The combination of all the above encourages a time clock managerial culture in which people do not try to rock the boat (because then they will be noticed and may be fired – lifetime employment is an informal and not a formal promise) and advancement is slow, and this too deters junior applicants with ambition.
Scheduling productivity is low, but going from 377 to 284 people in ops planning has not come from productivity enhancements that made 93 workers redundant. To the contrary, as Uday explains, the workload has increased, because the maintenance slowdowns have hit a tipping point in which it’s no longer enough to schedule express trains on local train time; with further slowdowns, trains miss their slots at key merge points with other lines, and this creates cascading delays.
Deinterlining and schedule complexity
One of the benefits of deinterlining is that it reduces the workload for ops planning. There are others, all pertaining to the schedule, such as reliability and capacity, but in this context, what matters is that it’s easier to plan. If there’s a GO slowing down the F train, the current system has to consider how the F interacts with every other lettered route except the L, but a deinterlined system would only have to consider the F and trains on the same trunk.
This in turn has implications for how to do deinterlining. The most urgent deinterlining in New York is at DeKalb Avenue in Brooklyn, where to the north the B and D share two tracks (to Sixth Avenue) and the N and Q share two tracks (to Broadway), and to the south the B and Q share tracks (to Coney Island via Brighton) and the D and N share tracks (to Coney Island via Fourth Avenue Express). The junction is so slow that trains lose two minutes just waiting for the merge point to clear, and a camera has to be set up pointing at the trains to help dispatch. There are two ways of deinterlining this system: the Sixth Avenue trains can go via Brighton and Broadway trains via Fourth Avenue, or the other way around. There are pros and cons either way, but the issue of service changes implies that Broadway should be paired with Fourth Avenue, switching the Q and D while leaving the B and N as they are. The reason is that the Fourth Avenue local tracks carry the R, which then runs local along Broadway in Manhattan; if it’s expected that service changes put the express trains on local tracks often, then it’s best to set the system up in a way that local and express pairings are consistent, to ensure there’s no interlining even during service changes.
This should also include a more consistent clockface timetable for all lines. Present-day timetabling practice in New York is to fine-tune each numbered and lettered service’s frequency at all times of day based on crowding at the peak point. It creates awkward situations in which the 4 train may run every 4.5 minutes and the 5, with which it shares track most of the way, runs every 5.5, so that they cannot perfectly alternate and sometimes two 4s follow in succession. This setup has many drawbacks when it comes to reliability, and the resulting schedule is so irregular that it visibly does not produce the intended crowding. Until 2010 the guideline was that off-peak, every train should be occupied to seated capacity at the most crowded point and since 2010 it has been 125% of seated capacity; subway riders know how in practice it’s frequently worse than this even when it shouldn’t be, because the timetables aren’t regular enough. As far as is relevant for scheduling, though, it’s also easier to set up a working clockface schedule guaranteeing that trains do not conflict at merge points than to fine-tune many different services.
Deinterlining and delocalization of institutional knowledge
Uday talks about New York-specific institutional knowledge that is lost whenever departments are understaffed. There are so many unique aspects of the subway that it’s hard to rely on scheduling cultures that come from elsewhere or hire experienced schedulers from other cities.
There is a solution to this, which is to delocalize knowledge. If New York does something one way, and peers in the US and abroad do it another way, New York should figure out how to delocalize so that it can rely on rest-of-world knowledge more readily. Local uniqueness works when you’re at the top of the world, but the subway has high operating costs and poor planning and operations productivity and therefore its assumption should be that its unique features are in fact bugs.
Deinterlining happens to achieve this. If the subway lines are operated as separate systems, then it’s easier to use the scheduling tools that work for places with a high degree of separation between lines, like Boston or Paris or to a large extent London and Berlin. This also has implications for what capital work is to be done, always in the direction of streamlining the system to be more normal, so that it can cover declining employee numbers with more experienced hires from elsewhere.
The Nine-Euro Ticket
A three-month experiment has just ended: the 9€ monthly, valid on all local and regional public transport in Germany. The results are sufficiently inconclusive that nobody is certain whether they want it extended or not. September monthlies are reverting to normal fares, but some states (including Berlin and Brandenburg) are talking about restoring something like it starting October, and Finance and Transport Ministers Christian Lindner and Volker Wissing (both FDP) are discussing a higher-price version on the same principle of one monthly valid nationwide.
The intent of the nine-euro ticket
The 9€ ticket was a public subsidy designed to reduce the burden of high fuel prices – along with a large three-month cut in the fuel tax, which is replaced by a more permanent cut in the VAT on fuel from 19% to 7%. Germany has 2.9% unemployment as of July and 7.9% inflation as of August, with core inflation (excluding energy and food) at 3.4%, lower but still well above the long-term target. It does not need to stimulate demand.
Moreover, with Russia living off of energy exports, Germany does not need to be subsidizing energy consumption. It needs to suppress consumption, and a few places like Hanover are already restricting heating this winter to 19 degrees and no higher. The 9€ ticket has had multiple effects: higher use of rail, more domestic tourism, and mode shift – but because Germany does not need fiscal stimulus right now and does need to suppress fuel consumption, the policy needs to be evaluated purely on the basis of mode shift. Has it done so?
The impact of the nine-euro ticket on modal split
The excellent transport blog Zukunft Mobilität aggregated some studies in late July. Not all reported results of changes in behavior. One that did comes from Munich, where, during the June-early July period, car traffic fell 3%. This is not the effect of the 9€ ticket net of the reduction in fuel taxes – market prices for fuel rose through this period, so the reduction in fuel taxes was little felt by the consumer. This is just the effect of more-or-less free mass transit. Is it worth it?
Farebox recovery and some elasticities
In 2017 and 2018, public transport in Germany had a combined annual expenditure of about 14 billion €, of which a little more than half came from fare revenue (source, table 45 on p. 36). In the long run, maintaining the 9€ ticket would thus involve spending around 7 billion € in additional annual subsidy, rising over time as ridership grows due to induced demand and not just modal shift. The question is what the alternative is – that is, what else the federal government and the Länder can spent 7 billion € on when it comes to better public transport operations.
Well, one thing they can do is increase service. That requires us to figure out how much service growth can be had for a given increase in subsidy, and what it would do to the system. This in turn requires looking at service elasticity estimates. As a note of caution, the apparent increase in public transport ridership over the three months of more or less free service has been a lot less than what one would predict from past elasticity estimates, which suggests that at least fare elasticity is capped – demand is not actually infinite at zero fares. Service elasticities are uncertain for another reason: they mostly measure frequency, and frequency too has a capped impact – ridership is not infinite if service arrives every zero minutes. Best we can do is look at different elasticity estimates for different regimes of preexisting frequency; in the highest-frequency bucket (every 10 minutes or better), which category includes most urban rail in Germany, it is around 0.4 per the review of Totten-Levinson and their own work in Minneapolis. If it’s purely proportional, then doubling the subsidy means increasing service by 60% and ridership by 20%.
The situation is more complicated than a purely proportional story, though, and this can work in favor of expanding service. Just increasing service does not mean doubling Berlin U-Bahn frequency from every 5 to every 2.5 minutes; that would achieve very little. Instead, it would bump up midday service on the few German rail services with less midday than peak frequency, upgrade hourly regional lines to half-hourly (in which case the elasticity is not 0.4 but about 1), add minor capital work to improve speed and reliability, and add minor capital work to save long-term operating costs (for example, by replacing busy buses with streetcars and automating U-Bahns).
The other issue is that short- and long-term elasticities differ – and long-term elasticities are higher for both fares (more negative) and service (more positive). In general, ridership grows more from service increase than from fare cutting in the short and long run, but it grows more in the long run in both cases.
The issue of investment
The bigger reason to end the 9€ ticket experiment and instead improve service is the interaction with investment. Higher investment levels call for more service – there’s no point in building new S-Bahn tunnels if there’s no service through them. The same effect with fares is more muted. All urban public transport agencies project ridership growth, and population growth is largely urban and transit-oriented suburban.
An extra 7 billion € a year in investment would go a long way, even if divided out with direct operating costs for service increase. It’s around 250 km of tramway, or 50 km of U-Bahn – and at least the Berlin U-Bahn (I think also the others) operationally breaks even so once built it’s free money. In Berlin a pro-rated share – 300 million €/year – would be a noticeable addition to the city’s 2035 rail plan. Investment also has the habit to stick in the long term once built, which is especially good if the point is not to suppress short-term car traffic or to provide short-term fiscal stimulus to a 3% unemployment economy but to engage in long-term economic investment.
Nordic Costs and Institutional Knowledge
Institutional knowledge at agencies that build infrastructure shapes up to be an important factor behind how well they handle projects. Good agencies build up a knowledge base over time that lets them see what works and what doesn’t, and this way they’re capable of making in-house planning decisions, and even when they use consultants, they make sure to learn what the consultants have taught them and implement those lessons in the future. In our Italian, Turkish, and (soon to be released) Swedish cases, the agencies have all built up this knowledge over decades.
Denmark provides an interesting test case for this, because Copenhagen opened its metro in 2002 (Helsinki: 1982; Oslo: 1966, Stockholm: 1950), and so it’s possible to compare it with the other Nordic capitals. The construction costs in Copenhagen are notably higher: the City Circle Line (built 2009-19) cost 25,300 DKK for 15.5 km, which in 2022 PPP dollars is around $280 million/km, and the soon-to-open M4 extension to Sydhavn is 9,100 DKK for 4.5 km, or $330 million/km; in contrast, we have the following costs for the other Nordic capitals:
| City | Line | Length | Years | Cost | Cost/km (2022 PPP) |
| Oslo | Løren | 1.6 | 13-16 | 1.33b NOK | $110 million |
| Oslo | Fornebu | 8.2 | 20-29 | 26.4b NOK, ’21 | $330 million |
| Stockholm | Nya Tunnelbanan | 19 | 20-30 | 32b SEK, ’16 | $235 million |
| Helsinki | West Metro phase 1 | 13.5 | 09-17 | 1.171b€ | $145 million |
| Helsinki | West Metro phase 2 | 7 | 14-23 | 1.159b€ | $275 million |
All of these costs are higher than you may have seen in past posts – this is mostly an inflation artifact (and in particular, you should mentally increment all costs by 25% if you remember them in mid-2010s dollars). But it’s notable that in both Oslo and Helsinki, real costs are sharply up; the Fornebu Line is more complex than the Løren Line, but much of its complexity is an engineering choice to deep-mine the stations.
In Stockholm there’s no similar comparison, but Citybanan cost, also in 2022 PPP dollars, $365 million/km, and a factor of 1.5 is an unusually low premium for city center regional rail carrying 250 meter trains over regular metro trains; the RER premium in Paris looks like a factor of 2, and the Munich S-Bahn tunnel was budgeted at a factor of 2 premium over a current U-Bahn extension and has since announced a factor of 2 overrun over that, for which it has been widely mocked in the German press. It’s plausible that when the regional rail premium is netted out properly, Stockholm has in fact seen a large real increase in costs, which matches the history of Nya Tunnelbanan’s cost overrun, from 23 to 32 billion kronor.
Denmark is seeing a real cost increase as well, but a much smaller one. In effect, what’s happening is that Copenhagen started building its metro in the 1990s at higher cost than Nordic norms, and in the generation since then, costs in the other Nordic countries have converged to Danish costs.
So what’s going on?
Some hints can be found in the details of the most recent Danish extension, M4 to Sydhavn. The soft cost multiplier over hard costs is higher than one would find elsewhere, and the contingency is 30% at the contract award, an unusually high figure; 20% is more typical, or even less at contract award (but more during earlier planning). Moreover, the entire project was awarded as a single design-build contract to a joint venture of Vinci and Hochtief, with hard costs worth 460M€.
The entire Nordic world is trying to transition to that style of contracting. This is inspired by British and Dutch models of privatization, which the state, academic, and consultant studies I’ve read while writing the Stockholm report view positively. The procurement strategy for Trafikverket in Sweden calls for transitioning to a so-called “pure client” model for the next big rail investment, Gothenburg’s West Link, like Citybanan not included on the above table as it is a regional rail through-running tunnel. The emerging model in the Nordic countries, which I call globalized in the report since it aims at international competitiveness attracting global contracting firms, can be compared with the traditional model as follows:
| Traditional | Globalized |
| Design-bid-build | Design-build |
| Itemized contracts | Fixed price contracts |
| Smaller contracts (hundreds of millions of kronor) | Larger contracts (billions of kronor) |
| Product procurement (“how to build”) | Functional procurement (“what to build”) |
| Public client risk | Private contractor risk |
The Nordic project I’m most familiar with, Nya Tunnelbanan, does not use the globalized system; it uses elements of both the globalized and the traditional systems, but the trend is to be more globalized. Moreover, the Fornebu Line uses design-bid-build; its problem is partly that the private risk allocation encourages defensive design. If the builder strictly follows the design, all liability is on the designer, otherwise it’s on the builder; thus, the builder strictly follows the design, and because geotechnical surprises are inevitable during tunneling, the designer is overly cautious and tries to anticipate every potential problem rather than seeing what is actually necessary while the tunnel is dug. The traditional system has problems, especially when the risk allocation is improper like this. What’s more, the preference for larger contracts over smaller ones comes from ongoing industry consolidation – there just aren’t enough domestic contractors anymore, and pan-European ones, let alone global ones, are not going to enter an unfamiliar market for a $100 million contract. Unfortunately, the move to privatization of risk under the pure client model does not improve things, and is associated with higher costs.
I am less familiar with the Copenhagen Metro than with the Stockholm Metro, but from reading both how the expansion is done and what Eno is saying about its model (it did a case there but not in Stockholm), Denmark was an early adopter of the globalized system. Eno even pointed out that it uses design-build to showcase that low-construction cost cities use it successfully.
So the Denmark effect is real – this does appear to be a matter of experience. Having never built a metro before – the last urban rail tunnel in Denmark, the S-tog, opened in 1934 – Copenhagen never had the institutional knowledge of how to use the traditional system, so it opted for (elements of) the globalized system, which was not how the other Nordic countries did things but was what British consultants recommended. Note that this does not mean higher costs (that is, around global average, rather than far less) were inevitable in Denmark – it could have adopted the traditional system by leaning on intra-Nordic connections, which are extensive. But perhaps in the 1990s, and certainly in the 2000s, even the other Nordic countries started to come to believe in greater privatization of risk.
The tragedy is that we can see, in real time, how good institutional knowledge is forgotten. Nya Tunnelbanan is, by itself, a pretty straightforward case of cost overrun. But in the context of parallel trends in Helsinki and Oslo, and perhaps an imputation of how much more complex Citybanan was, the situation is different. Real costs increased over time – this was not a mere matter of cost underestimation. Moreover, they increased during a time of ongoing, successful construction of metro projects – the lines that have opened all have healthy ridership, encouraging plans to build even more. And yet, the real problems with the traditional system have led to the adoption of what appears to be a worse procurement system, supported every step of the way by the same agencies that used to compete for world records for low-cost construction.
