Category: Transportation
Cities and Cultural Cringe
Following up on my last post’s promise to tackle both cultural theory of risk and cultural cringe, here is my take on the latter issue.
It is normal for people to have some degree of national pride and fervor. Cultural cringe refers to the opposite trend: when, in some circumstances, people in certain countries feel national shame and develop an inferiority complex. The term cultural cringe itself was coined by A. A. Phillips in 1950, describing Australia’s inferiority complex toward Britain in literary fields: Australians thought their literature was too provincial and perhaps too incomprehensible to the British readers, and as a result many authors were uncomfortable making the local references celebrated in the literary canon of Britain, France, Russia, the US, etc. This notion has been generalized elsewhere. Amos Oz says he felt uncomfortable writing books in such a peripheral country as Israel until he read Sherwood Anderson’s Winesburg, Ohio, showing how literature of and by the provinces can thrive.
From its origin in Australian literature, the idea of the cultural cringe has expanded to other fields, including the law, social relations, technology, and business. It seems endemic in former colonies, especially ones that are not rich. One writer in Nigeria argues how best practices thinking is cultural cringe by giving an example of a recent legal importation that turns out to already exist in traditional Yoruba law. In Australia itself, political scientist L. J. Hume pushed back against the notion that there is cultural cringe, arguing it is true of literature but not economics of other fields. But in mass culture, the vast majority of countries, both developed and developing, consider American film and television superior to their own and have domestic industries that focus on arthouse films or low-budget flicks.
Cultural cringe in legal, political, or technological fields remains endemic in many other developed countries. In one recent example, Emmanuel Macron said France is inherently resistant to change and (by implication) ungovernable, comparing it negatively with Denmark. In business, 1980s-era America was replete with books telling managers how to think like a Japanese or German, which trend ended when the Japanese lost decade and the economic crisis of German unification made these countries less fashionable.
Lying in the intersection of business, politics, and technology, urbanism and transportation are amenable to analysis using this concept. As in the Nigerian example, the third world tends to have too much cultural cringe and too much faith in the merits of importing first-world methods. Conversely, the United States (and to a large extent Canada) today is resistant to outside ideas and does not know how to be a periphery.
Urban layout: there’s a world outside Europe
During the SB 827 debate in California, supporters reassured restive city residents that the density the bill promoted – up to 7 floors right next to transit lines and up to 5 a little farther away – was gentle. “Paris density,” they said. Everyone likes Paris as a tourist. Everyone recognizes Paris as good urbanism.
There is very little cultural cringe in the United States – on the contrary, Americans are solipsistic in every field. However, one of very few exceptions is that the American middle class vacations in Europe and is familiar with how walkable European cities are. (It’s even referenced on Mad Men when a minor character goes on walks in their car-oriented New York suburb.) Paris is the largest and richest city Americans of a certain wealth and education level can be expected to be familiar with and like, but by the same token the YIMBYs could mention Barcelona, Amsterdam, and Rome.
But it’s useful to think of what was not mentioned. Certainly not Hong Kong or Dubai, which seem to be mentioned almost exclusively negatively in Western discourse. Not Tokyo, which Westerners are much less likely to visit to the point that the Western blogs talking about Japanese urbanism (like Urban Kchoze) are notable for it. Nothing in the middle-income world, including some old cities (like Mexico City and Istanbul) that have building height, street width, and stylistic variation that first-world urbanists would approve of (and do if they’ve been there).
In this situation, the invocation of famous European cities feels less like a dialogue and more like an attempt to induce cringe defensively, to make people feel less attached to their cities’ American auto-oriented character. In effect, it’s an attack on “it will change the character of our neighborhood,” a line that’s much less common in countries that are used to thinking of themselves as inferior to whatever they consider the metropolitan core (such as the first world writ large in Israel, or the former colonial master in ex-colonies).
Transportation: a little cringe is good, but not too much
In the developing world, there is extensive cringe. Without using that term, I suggested it as a reason behind high construction costs in the third world, which are similar to the costs of the first world today and several times as high as those of the first world from back when its income levels were comparable to those of subway-building third-world countries, in the early 1900s. In Latin America and China, development is more inward-looking, and China in particular learned to build subways from the USSR in the 1950s, not a rich country. In former colonies, there seems to be a greater willingness to import methods from either the former colonizer or from countries that aggressively invest in third-world infrastructure, like Japan and China; the result is very high construction costs for projects for which I have data in India and other countries of that development level.
In some cases, like India’s high-speed rail program, the country imports technology wholesale, and Japan (or China) may insist on an exact copy of its methods. As it is, Japan refuses to call Taiwan High-Speed Rail a Shinkansen system even though it runs Shinkansen rolling stock: construction methods were European, so Japan only calls THSR a high-speed rail system using Shinkansen-based technology.
However, decisions like India’s standard-gauge metro lines happen even in indigenous systems. Delhi Metro uses standard gauge not for some turnkey technological import, but purely because it feels more modern whereas Indian mainline trains feel dinghy and dangerous. Evidently, Delhi Metro electrification is 25 kV, which is standard on mainline trains but unheard of on first-world metros; modifying subways for high-voltage electrification requires expensive concrete pouring, since high-voltage catenary requires more generous clearances to avoid arcing, whereas modifying rail gauge is routine since the European vendors are used to selling to broad-gauge Finland and Spain and the Japanese ones are used to their country’s multitude of gauges.
And if India errs on the side of too much shiny adoption of foreign technology, the US errs on the side of adopting too little. Americans do not think their country is inferior. American authors do not think they need to experience another country or speak another language before they write. There was a time when the American business community felt outcompeted, but today it feels like it’s at the top of the world, Silicon Valley having long left Japanese corporations in the dust; I stopped seeing complaints that American cars were inferior to German and Japanese ones not long after Obama’s auto industry bailout.
The American policy sphere seems especially constrained. There is some cultural cringe toward London, leading thinktanks like the Regional Plan Association and TransitCenter to overlearn from London’s peculiarities (like the Oyster fare cap and contactless credit card payment), but not much toward Continental Europe and practically none toward Japan. Instead, the attitude toward non-English-speaking countries is one of dismissal. When Richard Mlynarik pointed out to a Caltrain official consultant that Japanese trains turned much faster at terminals than Caltrain thought possible, the consultant replied, “Asians don’t value life the way we do.” (Update 2020-09-05: since a bunch of people in the Bay Area reference this line, I am reminded that this was not a public employee of Caltrain but a consultant brought in for the Transbay Terminal project.)
If India fails to understand where its own methods could be superior despite being a peripheral country, the United States fails to understand that it’s a peripheral country in the first place. Transportation innovation rarely happens in North America. It happens in Western Europe and Japan, and to some extent in developing countries that have less cultural cringe than former colonies, such as Brazil and Colombia and their invention of BRT or Colombia, Bolivia, and Mexico’s use of aerial gondolas in mountainous suburban areas.
Urban development: you are not New York
I’ve been reading Aaron Renn’s blog, the Urbanophile, since maybe 2008. At the time he was still in Indianapolis, in (I believe) management consulting, writing about how his city was trying to become culturally and economically bigger than it was, and sometimes but not always succeeding. A recurrent theme in his writings has been that Midwestern American cities are desperate for development. They keep saying they need more creative people, more venture capital, or whatever else is in vogue. (In contrast, he says, Rhode Island, where he lived later, doesn’t even understand how peripheral it is.)
However, the way the Midwestern cities he focuses on try to attract this elusive development is through cheap copying. An old post of his I can no longer find contrasts world-class Indianapolis with world class in Indianapolis. The former involves investing in some city institution to make it world-class, or more realistically notable enough that boosters can call it world-class with a straight face. The latter involves inviting a starchitect or another person with international cachet (such as Richard Florida) to build something in Indianapolis that’s notable and is exactly as notable as what this person might build in any other city of that size, with no particular connection to the city itself.
In the transportation field, many American cities build mixed-traffic downtown streetcars and beam with pride if they get 4,000 riders per weekday. Often this mentality overrides any attempt to provide services to city residents: thus, the streetcar in Detroit is not integrated with the city’s bus network, and in fact a bus runs on the same street, on different lanes from the streetcar. This isn’t about some mythical preference for rail over bus: these cities build whatever they hear is in vogue and will get them noticed by New York media, whether it’s peak-only commuter rail, a downtown streetcar, a limited bus that calls itself BRT, or now a bus network redesign around untimed 15-minute frequencies.
Cringe vs. dialogue
It’s important to distinguish dialogue with a foreign culture and cultural cringe toward it. One difference is that cringe implies infatuation; however, infatuation can also develop among immigrants who are steeped in the metropole’s culture after having lived there even while maintaining ties to the old country. A bigger difference is the extent of two-way dialogue. Israelis use the expression “unbroken country” to refer to the mythical average first-world country in which you can get things done without having to tell government bureaucrats that you served in the military with their bosses; however, few have lived abroad long enough to know the details of what makes these countries tick better.
With limited knowledge of the core, the periphery can worship at the feet of the few people who do know, which leads to political bias. This is where moral panics of no-go zones come from: there is an Israeli television show purporting to portray how things are in Europe, but any connection between Belleville (or other racially diverse Paris neighborhoods) and what they depict is completely incidental. In that case, the bias is right-wing. In the opposite direction, left-wing bias can occur when American liberals and socialists are enamored by European health care and education systems and elide a thousand details that distinguish them from American renditions of single-payer health care or free college tuition.
But the biased reaction is only common in places that care little about how to govern. “Well, actually Tower Hamlets is a no-go zone” is not a blueprint for reducing nonwhite immigration to the United States or Israel. Instead, in the policy sphere a more common reaction is a shrug. Dialogue is threatening: the people capable of it are typically not the top pundits on this issue. Instead, it’s more common to aggressively dismiss knowledge that’s hard to access, even among people who at the same time invoke the cringe. In Israel it takes the form of self-denigrating lines like “this is Israel, not Finland.” Cultural cringe leads to lower expectations this way.
When Phillips criticized Australian authors who deracinated their writing to appeal to British taste, he was implicitly saying that Australians couldn’t root their literature in British experience. Oz, similarly, felt constrained about writing when he was young because living in Israel, he could not root his books in Paris, Milan, and other flashy cities whose books he devoured. The economic (or legal, or technological) analogue of this observation is that the reason there is cultural cringe is that people in peripheral areas (which in transportation include the United States) are too unfamiliar with the core and cannot dialogue with it the way people in different parts of the core can.
Urbanism is not literature. One doesn’t need extraordinary sensitivity and a lifetime (short as it may be) in a culture to produce very good insights about transportation, housing, or municipal governance. It’s possible to break out of the cringe by acquiring detailed knowledge of how the core operates. In the case of the third world and subway construction, it means learning enough about current and historical construction methods to be able to propose ways to build infrastructure at low costs commensurate with these cities’ low wages; in the case of the United States, it means learning enough about what makes European, Japanese, Latin American, etc. urbanism tick that it can be adopted domestically.
Urbanism is not literature in a far more important sense: there really are better and worse traditions there. It’s not enough to have pride in what you have when what you have is a third-world city where the poor don’t have running water, or for that matter an American city that would shut down instantly were gas prices to rise to levels necessary to stop global warming. Learning from the core is crucial. It’s just equally important to do so through dialogue and not through the ignorant self-denigration that is cultural cringe.
Cities and Cultural Theory
I ran a Patreon poll about sociological theories as applied to urbanism, offering two options: cultural theory of risk, and cultural cringe. The poll was tied, so I feel compelled to do one post on each (when cultural theory was ahead I was outlining two separate posts on it, one about transit and one about housing).
Psychologists and sociologists have long known that people’s perceptions of risk can vary widely from actual risks (e.g. people are more afraid of flying than of driving even though planes are safer), and, moreover, different people have different evaluations of risk. Early theories analyzed differences in risk perception along lines of class, race, or gender, but subsequently a group of social scientists, many (though not all) libertarians, argued for an ideology-based cultural identity. In 1982, the anthropologist Mary Douglas and the political scientist Aaron Wildavksy published Risk and Culture, arguing for three different identities (later expanded to four). Douglas used her past insights from analyzing premodern societies’ social taboos to analyzing risk perception within industrialized societies, especially the rise of the environmental movement during a time of falling pollution levels.
Urbanism and public transit are intimately connected with environmentalism. A large fraction of transit advocacy is environmental in nature, and both early NIMBYs and present-day YIMBYs come from green progressivism. Even when the arguments are not explicitly ecological, the parallels are unavoidable: Jane Jacobs’ critique of urban renewal has strong similarities with Rachel Carson’s critique of DDT. Legally, the mechanisms that exist to protect both endangered species and neighborhoods are often the same (e.g. the American environmental impact report process). Thus, understanding a sociological theory developed originally to analyze environmentalism should have straightforward applications to cities and urban transportation.
Grid-group typology
Cultural theory begins with the distinction between markets and hierarchies. These are two distinct ways of organizing society, leading to different institutions and different social views. Douglas and Wildavsky’s innovation is to distinguish two different axes of separation between markets and hierarchies, which they call group and grid, leading to a 2*2 chart:
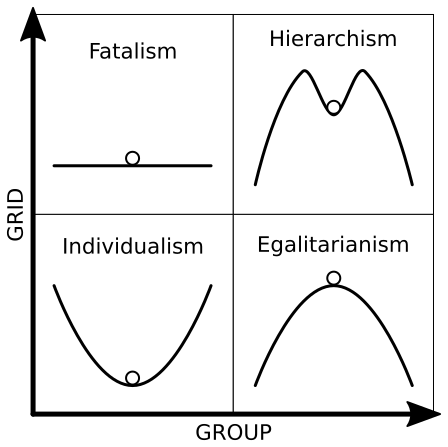
Group measures group solidarity among members of the system; grid measures the restrictions placed on the individual’s ability to exit the system. While individualism and hierarchy are politically stronger than the other two cultural identities, group and grid are fairly independent on the level of personal politics and there are numerous examples of egalitarianism and fatalism.
I strongly recommend reading the original book, but this review does it and the theory’s subsequent developments justice.
Individualism arises in institutions that are atomized and like it. The free market is the best example, but professions with mostly independent workers (like academia and the law, especially historically) also fit. Individualists view nature as resilient, returning to a stable equilibrium no matter what happens, and thus business control of the environment is to be celebrated as development; I had this aspect of cultural theory in mind when I wrote one of my early posts critiquing the idea that cities have a single equilibrium. Rejecting systemic or environmental risks, individualists focus on risks that disrupt the market’s operation, like war or recession.
Hierarchy arises in institutions where everyone has a predetermined role to play. Examples include the military, premodern feudalism, and modern bureaucracies. Hierarchists view nature as perverse or tolerant, capable of adapting to change to an extent but not beyond circumscribed limits, and therefore employ what their society considers expert opinion (e.g. scripture, bureaucratic process, big science, etc.) to figure these limits. Hierarchists focus on risks that indicate social deviance, like crime.
Douglas and Wildavsky call the above two tendencies the center, distinguished from what they call the border, whose growth they ascribe to the erosion of trust in institution in the 1960s and 70s (coming in the US from the Vietnam War and Watergate, in France from the reaction to the social protests of 1968, etc.).
Egalitarianism was the border tendency studied in Risk and Culture, which polemically called it sectarianism. It occurs in groups that rely on intensive solidarity among members but cannot enforce their collective will on the individual, and thus require other mechanisms to encourage people not to leave. These include internal equality, to stave off discontentment, and the precautionary principle, to prevent change from inducing disaffected members to exit. Thus they view nature as fragile, prone to collapse at any moment if the system endures any change in direction, and focus on low-probability, high-impact risks (such as environmental collapse), which enhance the group’s internal solidarity against outside enemies.
One of the key oppositions Douglas and Wildavsky point out is between the Hutterites and the Amish. Both denominations are high-group, socializing almost exclusively among their own kind, adhering to strict religious principles. But despite their common Anabaptist origin, they differ in one crucial aspect: the Hutterites have communal ownership of property, the Amish don’t. This makes the Hutterites high-grid, since members who leave start from zero, whereas Amish who leave get to keep their land. The Amish openly adhere to the precautionary principle, which they famously interpret extremely conservatively; the Hutterites have formal rules for group size and adopt modern farming technology easily.
Fatalism is the last tendency, so politically weak that it was ignored in the original book and only discussed in subsequent refinements of the theory. It arises in institutions whose lower-ranked members (whether by market poverty or low rank in the hierarchy) are disaffected, unable to leave and yet not sharing any of the group’s purported values. They tend to view nature as capricious, moving without clear direction, and do not have any particular risk focus, but tend to be especially concerned about things they do not understand (such as unfamiliar or complex technology). Transgressive fiction like The Wire tends to depict fatalist institutions; geekier readers may also recognize H. P. Lovecraft’s mythos as fatalist, portraying a universe so far beyond human understanding that any who begins to figure any of it out goes insane or slowly becomes a monster.
Some political movements have obvious cultural identities. Libertarianism is individualist. The New Left is egalitarian. The far right is hierarchist: Cas Mudde calls it pathological normalcy, and its issue focus (crime, immigration as genetic pollution, terrorism) is hierarchical, even as it rejects traditional hierarchical institutions. However, the broader left vs. right distinction does not neatly map to any of the four cultural biases. About the only generalization that can be made is that activists are usually not fatalists.
Cultural theory and transportation
Transportation planning is an inherently hierarchical industry. The technologies involved are old and continuously tweaked within well-understood parameters. With so much accumulated knowledge, work experience matters, requiring companies in the industry to adopt a hierarchical setup. Moreover, the transportation network itself is complex and interconnected, with changes in one region cascading to others. Changes to the bus network, the train schedule, etc. are possible but only if the people implementing them know what they’re doing, creating a picture of the network much like the hierarchical view of nature as tolerant up to a limit.
The individualist ethos of tech companies – move fast and break things – works for fast-growing industries. Individualism is by far the fastest of the four biases in reacting to sudden changes. The tech industry’s denigration of public transit as an old hat has to be understood as individualists reacting poorly to an industry that has to be run by a business culture they find alien.
Readers who have been following me closely may ask, well, what about me? I’m an individualist. I evidently talk more to startups than to transportation consulting megacorps. One reader notes that I’ve called for people in positions of authority to be fired for incompetence so many times that a post like this one may read as hesitant purely because I only call for removing the governor of Massachusetts and the secretary of transportation and not also for firing planners.
The answer is that while there is extensive accumulated knowledge about good public transit in Western Europe, Japan, and South Korea, there is very little in the area I’m most involved in, North America. This is especially true when it comes to regional rail: the existing mainline rail in the US should be treated as more or less tabula rasa. Adopting best practices requires extensive expert knowledge, but the methods in which they should be implemented have little to do with the internal bureaucracy of hierarchical organizations, since the railroads that would ordinarily be in charge (like the LIRR or the MBTA) are the problem and not the solution.
But if the actual process of running a transportation network is hierarchical, the politics are completely different. As with left-right politics, the politics of public transit don’t neatly fit into any of the four tendencies. Center-right hierarchists tend to support extensions of the status quo, which means more urban transit in New York, London, Paris, and other large cities, as well as high-speed rail on strong corridors (High Speed 2 in the UK is bipartisan), but more roads everywhere else. Individualists on the right tend to be anti-rail, partly because it looks so hierarchical, partly because of peculiarities like Koch funding of American libertarianism (which has been exported to Israel, at least).
Egalitarian environmentalists tend to be pro-transit, but their discomfort with hierarchy sometimes shows up as mistrust of big infrastructure projects. The radical environmentalist Chris Clarke, opposed early attempts to fast-track California High-Speed Rail and called Robert Cruickshank of California HSR Blog a shill for developer interests. Jane Jacobs herself ended up arguing late in her life that mass transit was at the wrong scale and instead cities should encourage community jitney services.
The process itself has issues of trust that activate egalitarians and fatalists, the latter often reflexively opposing reforms since they assume things must always get worse. It leads to tension between community outreach, which helps defuse this opposition, and speed of implementation.
Cultural theory and housing development
Whereas transportation politics isn’t neatly slotted into the grid-group paradigm, the politics of urban development is: YIMBY is an individualist movement, with near-universal support from people who identify with that cultural bias. The other three tendencies are split. The market urbanist proposition of abolition or near-abolition of zoning doesn’t appeal to hierarchists (who want to be able to control where housing goes) or egalitarians (who worry about the consequences of empowering market actors); but there are egalitarian left-YIMBYs and hierarchical city leaders who favor transit-oriented development.
In fact, when analyzing NIMBYism, it’s useful to slot it not by class or political opinion, but by cultural identity. There is much less difference between working-class and middle-class NIMBYs than leftists posit, and in some cases anti-gentrification politics and racist opposition to fair housing blend together (as in South Tel Aviv, where the local far right has argued black refugees are part of a gentrification ploy).
The key is that egalitarianism really consists of two distinct concepts, both necessary to maintain high group solidarity without grid: internal equality, and strong boundedness (which refers to sharp distinctions between insiders and outsiders). The cultural geographer Stentor Danielson argued once that surveys consistently show people approve of internal equality but not of strong boundedness, which is why egalitarian communities are so rare even though many people agree with most of their tenets.
Thus, when NIMBYs argue that more development would bring outsiders or change the character of the neighborhood, this is as compatible with egalitarianism as with hierarchy. Gentrification is just the name for when these outsiders are not begging for scraps. The real difference is in where this is taken. Egalitarian NIMBYism emphasizes irrevocable change, high-impact risks (e.g. that a new development would induce runaway gentrification), and trust. Hierarchical NIMBYism instead talks about behavioral norms, usually referring to middle-class moral panics about crime, but occasionally flipping to black American fears that white people would call the police more often.
The fatalists, too, have their own criticism of redevelopment – namely, that it represents another sudden change involving forces they have no control over. “Nobody asked us” has to be understood as a fatalist and not egalitarian cry, even though egalitarians often try to organize fatalists.
It’s not really possible to promise any of the other groups what it really wants: protection from change for egalitarians, a more concrete relationship between development and their actual lives for fatalists, or ethnic or other kinds of homogeneity for hierarchists. Nonetheless, alliances are possible with some egalitarians and hierarchists. SF YIMBY has to be viewed as an attempt at an individualist-egalitarian alliance for more housing, ceding ground on rent control to curry favor with ideological socialists (and its East Bay offshoot is run by actual socialists). In the other direction, Theresa May’s making noises about releasing more land for housing to get young people on the “housing ladder,” invoking a hierarchical sense of normality regarding when it’s appropriate to buy a house.
Overbuilding for Future Capacity
I ran a Patreon poll with three options for posts about design compromises: overbuilding for future capacity needs, building around compromises with unfixably bad operations, and where to build when it’s impossible to get transit-oriented development right. Overbuilding won with 16 votes to bad operations’ 10 and development’s 13.
It’s generally best to build infrastructure based exactly on expected use. Too little and it gets clogged, too much and the cost of construction is wasted. This means that when it comes to rail construction, especially mainline rail, infrastructure should be sized for the schedule the railroad intends to run in the coming years. The Swiss principle that the schedule comes first was just adopted in Germany; based on this principle, infrastructure construction is geared around making timed transfers and overtakes and shortening schedules to be an integer (or half-integer) multiple of the headway minus turnaround time for maximum equipment utilization.
And yet, things aren’t always this neat. This post’s topic is the issue of diachronic optimization. If I design the perfect rail network for services that come every 30 minutes, I will probably end up with a massive upgrade bill if ridership increases to the point of requiring a train every 20 minutes instead. (I chose these two illustrative numbers specifically because 30 is not a multiple of 20.) In some cases, it’s defensible to just build for higher capacity – full double-tracking even if current ridership only warrants a single track with passing sidings, train stations with more tracks in case more lines are built to connect to them, and so on. It’s a common enough situation that it’s worth discussing when what is technically overbuilding is desirable.
Expected growth rates
A fast-growing area can expect future rail traffic to rise, which implies that building for future capacity today is good. However, there are two important caveats. The first is that higher growth usually also means higher uncertainty: maybe our two-track commuter line designed around a peak of 8 trains per hour in each direction will need 32 trains per hour, or maybe it will stay at 8 for generations on end – we usually can’t guarantee it will rise steadily to 16.
The second caveat, applicable to fast-growing developing countries, is that high growth raises the cost of capital. Early British railroads were built to higher standard than American ones, and the explanation I’ve seen in the rail history literature is that the US had a much higher cost of capital (since growth rates were high and land was free). Thus mainlines in cities (like the Harlem) ran in the middle of the street in the US but on elevated structures in Britain.
But with that in mind, construction costs have a secular increase. Moreover, in constrained urban areas, the dominant cost of above-ground infrastructure cost is finding land for multiple tracks of railroad (or lanes of highway), and those are definitely trending up. The English working class spent 4-5% of its income on rent around 1800 (source, PDF-p. 12); today, spending one third of income on rent is more typical, implying housing costs have grown faster than incomes, let alone the general price index.
The upshot is that cities that can realistically expect large increases in population should overbuild more, and optimize the network around a specific level of traffic less. Switzerland and Germany, both of which are mature, low-population growth economies, can realistically predict traffic many decades hence. India, not so much.
Incremental costs
The expected growth rate helps determine the future benefits of overbuilding now, including reduced overall costs from fronting construction when costs are expected to grow. Against these benefits, we must evaluate the costs of building more than necessary. These are highly idiosyncratic, and depend on precise locations of needed meets and overtakes, potential connection points, and the range of likely train frequencies.
On the Providence Line, the infrastructure today is good for an intercity train at current Amtrak speed every 15 minutes and a regional train making every stop every 15 minutes. There is one overtake segment at Attleboro, around three quarters of the way from Boston to Providence, and the line is otherwise double-track with only one flat junction, with the Stoughton branch. If intercity trains are sped up to the maximum speed permitted by right-of-way geometry, an additional overtake segment is required about a quarter of the way through, around Readville and Route 128. If the trains come every 10 minutes, in theory a mid-line overtake in Sharon is required, but in practice three overtakes would be so fragile that instead most of the line would need to be four-tracked (probably the entire segment from Sharon to Attleboro at least). This raises the incremental costs of providing infrastructure for 10-minute service – and conversely, all of this is in lightly developed areas, so it can be deferred without excessive future increase in costs.
An even starker example of high incremental costs is in London. Crossrail 2 consists of three pieces: the central tunnel between Clapham Junction and Euston-St. Pancras, the northern tunnel meandering east to the Lea Valley Lines and then back west to connect to the East Coast Main Line, and the southern tunnel providing two extra tracks alongside the four-track South West Main Line. The SWML is held to be at capacity, but it’s not actually at the capacity of an RER or S-Bahn system (as I understand it, it runs 32 trains per hour at the peak); the two extra tracks come from an expectation of future growth. However, the extreme cost of an urban tunnel with multiple new stations, even in relatively suburban South London, is such that the tunnel has to be deferred in favor of above-ground treatments until it becomes absolutely necessary.
In contrast, an example of low incremental costs is putting four tracks in a cut-and-cover subway tunnel. In absolute terms it’s more expensive than adding passing tracks in suburban Massachusetts, but the effect on capacity is much bigger (it’s an entire track pair, supporting a train every 2 minutes), and moreover, rebuilding a two-track tunnel to have four tracks in the future is expensive. Philadelphia most likely made the right choice to build the Broad Street Line four-track even though its ridership is far below the capacity of two – in the 1920s it seemed like ridership would keep growing. In developing countries building elevated or cut-and-cover metros, the same logic applies.
Sundry specifics
The two main aspects of every infrastructure decision are costs and benefits. But we can discern some patterns in when overbuilding is useful:
- Closing a pinch point in a network, such as a single- or double-track pinch point or a flat junction, is usually worth it.
- Cut-and-cover or elevated metro lines in cities that are as large as prewar New York (which had 7 million people plus maybe 2 million in the suburbs) or can expect to grow to that size class should have four tracks.
- On a piece of infrastructure that is likely to be profitable, like high-speed rail, deferring capacity increases until after operations start can be prudent, since the need to start up the profitable system quickly increase the cost of capital.
- Realistic future projections are imperative. Your mature first-world city is not going to triple its travel demand in the foreseeable future.
- Higher uncertainty raises the effective cost of capital, but it also makes precise planning to a specific schedule more difficult, which means that overbuilding to allow for more service options becomes reasonable.
- The electronics before concrete principle extends to overbuilding: it’s better to complete a system (such as ETCS signaling or electrification) even if some branches don’t merit it yet just because of the benefits of having a single streamlined class of service, and because of the relatively low cost of electronics.
Usually cities and countries should not try to build infrastructure ahead of demand – there are other public and private priorities competing for the same pool of money. But there are some exceptions, and I believe these principles can help agencies decide. As a matter of practice, I don’t think there are a lot of places in the developed world where I’d prescribe overbuilding, but in the developing world it’s more common due to higher future growth rates.
The Dynamics of Bus Bunching
I’ve been wanting to write a paper about how to use dynamical systems to analyze failure modes for transportation networks. So far I haven’t been able to analyze this more carefully, but there’s one relatively simple example, namely bunching along a single bus line. This intersects to some extent with what I did in math academia, although the mathematical tools I’m using are fairly primitive within dynamics, going back to the early 20th century and not to the advanced machinery that dynamicists have developed in the last forty years (like the Mandelbrot set). As a caution, despite the math jargon and the math paper structure, it’s a blog post, and not something I’d even be comfortable uploading to the arXiv.
The upshot of the mathematical model in this post is that several already-understood reforms can seriously reduce bus bunching: speeding up boarding through prepayment and all-door boarding, using bigger buses with many doors on the busiest routes, implementing signal priority and enforcing bus lanes better, and improving dispatching to tell bus drivers to maintain even headways leaving each terminus. Section 1 provides mathematical background, and people who know some dynamics can skip it; it’s meant to be accessible to a general audience (if you’ve heard of derivatives, you should be fine). Section 2 constructs the model for bus schedule variations, section 3 explains how the model predicts bunching, and section 4 goes into how the above interventions can improve the situation. The mathematics I’m using is not terribly advanced, but it may benefit from careful reading, especially around the formulas.
1. Background on dynamics and chaos
Before I left academia, when people asked me to explain my research, I’d use the following example. In dynamics, we study what happens when we take a function and iterate it many times. We are specifically interested in chaotic behavior, which arises when two very close numbers can end up widely separated after sufficient iteration. There is no chaos if we only look at linear functions, so the simplest example is quadratic:

The simplest behavior of any number when we apply a function many times is if nothing changes. A point where this happens is called a fixed point. Two numbers are fixed points for the function x^2: 0 and 1. But in practice, it’s useful to view infinity as a number, so that instead of being far away from each other, the numbers 1,000,000, 1,000,000,000, and -1,000,000 should be viewed as all very close to infinity. Under the squaring function, infinity is a fixed point as well.
The key to understanding the dynamics of a function is to look at the behavior of the function near a fixed point. Near the point 0, if we take the square of a number, it gets much smaller. For example, 0.1^2 = 0.01. This means that if a number x is close to zero, then as we iterate the function x^2 we will get closer and closer to 0, very quickly. This behavior is called attracting. Near 0, small changes in initial conditions don’t matter much: the numbers 0.1 and 0.11 are close, and if we keep squaring them, we will approach 0 either way. Infinity is attracting as well once you get used to thinking of very large (or very large with a negative sign) numbers as close to infinity: 1,000 is pretty close to infinity and 1,000^2 = 1,000,000, even larger, i.e. closer.
However, near the point 1, we get the opposite behavior: 1.1^2 = 1.21, which is about twice as far away from 1 as 1.1, and similarly 0.9^2 = 0.81, again about twice as far away from 1 as 0.9. We then say that 1 is a repelling point. Near a repelling point, we have chaotic behavior, because two points that start out close, like 0.9 and 1.1 or even 0.99 and 1.01, end up widely separated after iteration (0.99 eventually approaches 0, 1.01 eventually approaches infinity).
If you’ve learned calculus, your reaction to the line about how 1.21 is about twice as far away from 1 is “the derivative is 2!”. In general, the way to figure out whether a fixed point is attracting or repelling is to take the derivative f‘(x) at the point (technically it’s called the multiplier). If the absolute value of the derivative is less than 1, the point is attracting; if it’s more than 1, the point is repelling; if it’s exactly equal to 1, we say the point is indifferent and then the behavior near the fixed point depends on further details that I don’t want to get into. As a note of caution, taking the derivative anywhere except at a fixed point won’t tell you anything about the function – for example, the derivative of x^2 (which is 2x) is 4 when x = 2 but 2 is not repelling, it’s a non-fixed point that ends up going off to infinity.
(You may wonder what it exactly means to take the derivative at infinity. The answer is that if f is a polynomial, then the multiplier at infinity is always 0. If f is not a polynomial, there is a definition on Wikipedia.)
Attracting points are in every sense nicer to deal with than repelling points. Unfortunately, chaos is everywhere: most points of every nonlinear function are repelling. More precisely: in addition to fixed points, there are periodic points (i.e. fixed points of iterates). The periodic points of x^2 are a little hard to unpack if you’re not used to complex numbers: they’re solutions to equations like x^4 = x, x^8 = x, etc., and these are all complex numbers on the unit circle. We can compute multipliers there too (take the derivative of the iterate for which they’re fixed) and classify them as attracting or repelling. One of the foundational theorems of dynamics is that all but finitely many periodic points are repelling – and the number of non-repelling points is at most 2d-2 where d is the degree of the function (and if the function is a polynomial of degree d, then there are at most d-1, not counting infinity). My main contribution to math is to extend this result to a certain number-theoretic application.
2. Modeling buses using dynamics
The key insight of why buses bunch is that maintaining the exact schedule is a repelling fixed point, so small variations from the schedule (due to traffic, slow passengers, or random noise in passenger numbers) will compound over time, just as the variation of 0.9 or 1.1 from 1 compounds over time as you apply the squaring function.
More precisely, let’s say buses on a certain street run every 10 minutes. Eventually we will call the scheduled headway h, but to make this concrete, let’s say h = 10 minutes. Every few hundred meters, the buses stop to pick up and drop off passengers. Before San Francisco instituted prepayment, each additional passenger took on average 3.9 seconds to board and another 3.9 to disembark (link, PDF-p. 14); the TRB claims the average is 3 seconds to board (link, PDF-p. 20). We will call the extra boarding time per passenger b, and right now set b = 3 seconds = 0.05 minutes.
To understand why bunching occurs, let’s say that our bus falls behind schedule by a minute. It’s now 11 minutes behind the bus ahead (which we’ll assume is on schedule), not 10 minutes. On average, there will be 10% more passengers to pick up at each stop (passengers arrive at stops at a uniform rate). Let’s say the bus gets 60 boardings per hour (which is the Brooklyn-wide average). Typically we expect the bus to get 10 boardings in the next 10 minutes, but because there are 10% more passengers per stop, there will instead be 11 boardings. The one extra boarding will slow the bus down by 3 more seconds. The bus will then be 1:03 minutes behind. It’s a small difference, but over time it compounds.
There will also be more alightings as the bus gets more crowded, with a lag time equal to average passenger trip length. But in practice, to avoid introducing exponential factors, complicating the analysis, it’s best to just think of boardings plus alightings as a single metric, which if there are 60 boardings per hour equals 120 per hour or 2 per minute, and take note that a 1-minute delay only starts accumulating half a lag time in the future (e.g. 10 minutes if the average unlinked passenger trip is 20 minutes, as in New York). We call the number of boardings plus alightings per hour r, and in our example case r = 2.
If we choose our unit of time to be the minute, then the formula for the average delay a minute after our bus was x minutes behind the bus ahead is,
In the example we worked out above, it took 10 minutes to accumulate an additional 6-second delay (3 from boarding, 3 from alighting). Using the numbers h = 10, x = 11, b = 0.05, r = 2, verify that the formula spits out 0.01, or in other words an extra 0.6-second delay per minute. If x = h, that is if the headway between our bus and the bus ahead is exactly as timetabled, then there is no additional delay, making the correct headway a fixed point, but a repelling one. The multiplier is equal to,

Note that choosing units is important. The reason is that the mathematics I’m using assumes there are discrete steps: you apply the squaring function (or any other nonlinear function) once at a time. In reality, time is continuous. So to model it using discrete dynamics, it matters which unit of time we pick; this is the equivalent of choosing between x^2, x^4, x^16, or any other iterate. Fixed points will stay attracting or repelling (or indifferent) no matter what, but the exact value of the multiplier will change.
With this in mind, when our quantum of time is a minute, the multiplier with our usual values of h, b, and r is equal to 1.01. Every minute, a delay multiplies by a factor of 1.01. Within an hour, this factor grows to 1.82. This doesn’t seem too bad – it means a 1-minute delay turns into a 1:49-minute delay within an hour.
3. How bunching occurs
In section 2 we showed that if h is the scheduled headway, b is the average boarding time per passenger, r is the average number of boardings and alightings per unit of scheduled service time, and x is the current distance (in units of time) between our bus and the bus ahead of us, then within a minute we expect the distance to grow to
The multiplier is 1 + rb/h, which doesn’t seem too bad. However, there are complications. For one, the initial delay may be not 1 minute but longer. In Eric Goldwyn’s interviews with drivers, they cited traffic as the top reason why they believed bunching occurs, and barely mentioned passenger boardings. In math we cannot conflate popular perception with reality, but that the drivers complain about traffic suggests that there is widespread variation in the extent of the initial delays coming from missing a light, drivers blocking the bus lane, etc. If the initial delay is 2 minutes, then all delay numbers are naturally doubled over 1 minute.
But more importantly, our delayed bus will never bunch with the bus ahead. It will bunch with the bus behind. And the effect of the model of cascading delays on the bus behind us is exactly double what I described above. The reason is that if our bus is a minute behind – for example, 11 minutes behind the bus ahead when it should be 10 minutes behind – then the bus behind us, if it starts out on schedule, is now a minute ahead, only 9 minutes behind us when it should be 10 minutes. This means that within 10 minutes, we fall 6 seconds behind (and are thus 11:06 behind the bus ahead of us), but by the same token the bus behind us advances 6 seconds ahead (and is thus 8:48 behind us). In practice, the quantity relevant to bunching is the distance between two successive buses, and behind us, the multiplier is not 1.01 but 1.02. Within an hour a 1-minute delay reduces the gap between our bus and the bus behind us by 3:17, and a 2-minute delay reduces it by 6:34, almost two thirds of the way to catching up with us. If the initial delay is 1 minute, the bus behind us will actually catch up with us within 

And third, the multiplier grows as r grows and h falls – that is, it’s higher when the frequency is higher and when there are more riders per service hour. Keeping r at 2 (again, this is 60 boardings and 60 alightings per hour) but lowering h to 5 raises the multiplier to 1.02 ahead of us and 1.04 behind us. A multiplier of 1.04 with a headway of 5 minutes means the bus behind us will catch us within 
The real limiting factor to the capacity of city buses is not minimum stopping distance, unlike with trains. It’s that as the headway h decreases, bunching becomes so routine that adding more buses does not actually add capacity. If a bus runs every 2.5 minutes, keeping b = 0.05 and r = 2 gives us a multiplier of 1 + 0.05*2/2.5 = 1.04 ahead of us and then 1.08 behind us; the bus behind us will catch our bus within 12 minutes.
4. How to reduce bunching
The formula for the multiplier of the dynamical system formed by bus performance is 1 + rb/h where r is the rate at which passengers board and alight, b is boarding time per passenger, and h is scheduled headway. However, since as our bus gets further and further behind, the bus behind us gets further ahead relative to schedule and certainly relative to us, the multiplier relevant to bunching is 1 + 2rb/h. The bus behind us will catch ours in

minutes, where d is the initial delay (so we start the calculation from x = h + d). On very frequent buses, this will happen very quickly: 2.5-minute headways with New Yorkish assumptions on passenger traffic density and conservative assumptions on boarding speed yield a catchup time of just 12 minutes. So how do we prevent this?
4.1. Reduce boarding time per passenger
Off-board fare collection allows passengers to board the bus more quickly, without paying the driver. This has the effect of greatly reducing b, from 3 seconds to about 1.2 per the TRB. Prepayment also allows all-door boarding, effectively halving the average boarding time per passenger at stops without large volumes of disembarking passengers.
But in addition to prepayment, there are other ways of reducing b. Low-floor buses allow passengers to get on and off more easily; the reason San Francisco’s numbers are higher than the TRB’s is that San Francisco assumes a mostly high-floor bus fleet, whereas on the low-floor fleets boarding is much faster (in fact, faster on low-floor buses without prepayment than on high-floor buses with).
Adding more doors is desirable as well. The typical 12-meter bus has two doors, but some cities have purchased three-door buses, such as Nice and Florence. The typical 18-meter accordion bus has three doors, but in Florence I have seen four-door accordion buses; in contrast, the older accordion buses in New York only had two doors, slowing down boarding and alighting at busy stations. Per TRB data, three-door buses reduce b from 3 seconds to 0.9, or 0.015 minutes. One third the multiplier means roughly three times the time it takes to bunch.
4.2. Use bigger buses
The multiplier depends only on the rate at which passengers wish to board our route. Adding more bus service will reduce r (by spreading boardings across more service-hours) and h (by adding more frequency) at the same rate, but make it take less time for bunching to occur. Just running less service means passengers take longer to get on each bus, but also means that the passenger load per stop is less sensitive to fixed delays occurring upstream.
Of course, running less service is cruel to passengers and can discourage ridership due to a negative frequency-ridership spiral or (on the busiest routes) inadequate capacity. But running bigger buses to compensate can provide the necessary capacity while also helping reduce b through faster access and egress. As noted in section 4.1, accordion buses should have four doors, to minimize loading time.
4.3. Reduce random variability
None of this discussion would matter if we were guaranteed that buses would run exactly on schedule. Of course, they don’t and we cannot get such guarantee. However, we can look for treatments that would make initial delays less common. All-door boarding is one such treatment, in addition to its effect on average boarding time per passenger, because one of the factors that can cause delays is an unexpected wave of passengers all getting on and having to queue one at a time, for example if they come off class or transfer from a full train. Schools with synchronized class times can overload transit networks for the first few minutes after classes end. And in Shanghai, I had to wait 20 minute to buy a metro ticket coming off a full intercity train since two of the three ticket machines were broken and the train was full of visitors who didn’t already have the Shanghai Public Transportation Card.
But as Eric’s interviews with drivers suggest, the biggest single source of variability is traffic and not unusual passenger loads. Bus lanes reduce the impact of traffic, but may not reduce variability, since cars may block them unexpectedly. This suggests that better enforcement of bus lanes could improve schedule regularity and reduce bunching further downstream.
Another source of variability is traffic lights. Traffic lights are discrete: they’re red or green, and a bus that misses the light will be delayed by a full phase, which in New York means about 45 seconds (and in Bangkok means 3 or even 5 minutes). Giving buses signal priority even in its weakest form entails lengthening the green phase in the direction the bus travels in for a few seconds to let a bus through and avoid making it wait a full red phase. This would keep a lid on the maximum variability that a single intersection can produce. Note also that it’s very easy for a bus to be delayed at two successive intersections, for example if traffic is such that it’s a hair slower than usual, forcing it to miss two lights in rapid succession. In this case, 1.5-minute initial delays are routine, setting up bunching later.
4.4. Dispatch buses to maintain even headways at terminals
The most brutal way to eliminate bunching is to have dispatchers tell bus drivers to sit still for a few minutes if the bus either behind or ahead of them is too far behind. The subway in New York would do that to the trains to maintain something that to a manager at control center looked like even headways (“wait assessment”), which multiple independent sources have told me is responsible for falling subway speeds and increased delays. This brutal approach is unlikely to provide better service to riders.
However, telling bus drivers to sit still to maintain even headways has no such downside when it is done at the terminus of the bus route. At most, agencies would have to pay bus drivers some overtime, which is probably swamped by the positive effect reducing bunching has on ridership (or for that matter the fact that reducing bunching permits the transit agency to provide the same effective frequency with fewer service-hours).
4.5. More empirical research is needed
This section is a lot less quantitative than sections 1, 2, and 3, owing to the fact that we are stepping away from strict modeling. While quantifying the effect of low floors, more doors, bigger buses, and prepayment is easy within the confines of the model, quantifying the initial shock to ridership discussed in subsection 4.3 is more difficult. There is a range of plausible shocks, and the serious questions to ask are along the lines of “what is the 90% confidence interval of the travel time on each segment?”.
The literature review I’ve done for signal priority in particular is not comprehensive, but suggestive that there is no research yet in that direction. Figuring out exactly how common initial delays are and which treatments can reduce them by how much must be the next step.
Fare Payment Without the Stasi
Last year, I saw a tip by the Metropolitan Police: if you witness any crime on a London bus and wish to report it later, you should tell the police the number on your Oyster card and then they’ll already be able to use the number to track which bus you rode and then get the names and bank accounts of all other passengers on that bus. Londoners seem to accept this surveillance as a fact of life; closed-circuit TV cameras are everywhere, even in front of the house where Orwell lived and wrote. Across the Pond, transit agencies salivate over the ability to track passenger movements through smartcards and contactless credit cards, which is framed either as the need for data or as a nebulous anti-crime measure. Fortunately, free countries have some alternative models.
In Germany, the population is more concerned about privacy. Despite being targeted by a string of communist terrorist attacks in the 1970s and 80s, it maintained an open system, without any faregates at any train station (including subways); fare enforcement in German cities relies on proof of payment with roving inspectors. Ultimately, this indicates the first step in a transit fare payment system that ensures people pay their fares without turning the payment cards into tracking devices. While Germany resists contactless payment, there are ways to achieve its positive features even with the use of more modern technology than paper tickets.
The desired features
A transit fare payment system should have all of the following features:
- Integration: free transfers between different transit vehicles and different modes should be built into the system, including buses, urban rail, and regional rail.
- Scalability: the system should scale to large metro areas with variable fares, and not just to compact cities with flat fares, which are easier to implement. It should also permit peak surcharges if the transit agency wishes to implement them.
- No vendor lock: switching to a different equipment manufacturer should be easy, without locking to favored contractors.
- Security: it should be difficult to forge a ticket.
- Privacy: it should not be possible to use the tickets to track passengers in most circumstances.
- Hospitality: visitors and occasional riders should be able to use the system with ease, with flexible options for stored value (including easy top-up options) and daily, weekly, and monthly passes, and no excessive surcharges.
Smartcard and magnetic card systems are very easy to integrate across operators; all that it takes is political will, or else there may be integrated fare media without integrated fares themselves, as in the Bay Area (Clipper can store value but there are no free transfers between agencies). Scalability is easy on the level of software; the hardest part about it is that if there are faregates then every station must have entry and exit gates, and those may be hard to retrofit. Existing smartcard technologies vary in vendor lock, but the system the US and Britain are standardizing on, contactless credit cards, is open. The real problem is in protecting privacy, which is simply not a goal in tracking-obsessed Anglo-American agencies.
The need for hospitality
Hospitality may seem like a trivial concern, but it is important in places with many visitors, which large transit cities are. Moreover, universal design for hospitality, such as easily recognizable locations for topping up stored value, is also of use to regular riders who run out of money and need to top up. Making it easy to buy tickets without a local bank account is of use to both visitors and low-income locals without full-service bank accounts. In the US, 7% of households are unbanked and another 20% are underbanked; I have no statistics for other countries, but in Sweden banks will not even give debit cards to people with outstanding debts, which suggests to me that some low-income Swedes may not have active banking cards.
New York’s MetroCard has many faults, but it succeeds on hospitality better than any other farecard system I know of: it is easy to get the cards from machines, there is only a $1 surcharge per card, and season tickets are for 7 or 30 days from activation rather than a calendar week or month. At the other end of the hospitality scale, Navigo requires users to bring a passport photo and can only load weekly and monthly passes (both on the calendar); flexible 5-day passes cost more than a calendar weekly pass.
In fact, the main reason not to use paper tickets is that hospitality is difficult with monthly passes printed on paper. Before the Compass Card debacle, Vancouver had paper tickets with calendar monthly passes, each in a different color to make it easy for the driver to see if a passenger was flashing a current or expired pass. The tickets could be purchased at pharmacies and convenience stores but not at SkyTrain stations, which only sold single-ride tickets.
ID cards and privacy
The Anglosphere resists ID cards. The Blair cabinet’s attempt to introduce national ID cards was a flop, and the Britons I was reading at the time (such as the Yorkshire Ranter) were livid. And yet, ID cards provide security and privacy. Passports are extremely difficult to forge. Israel’s internal ID cards are quite difficult to forge as well; there are occasional concerns about voter fraud, but nothing like the routine use of fake drivers’ licenses to buy drinks so common in American college culture.
At the same time, in countries that are not ruled by people who think 1984 was an uplifting look at the future, ID cards protect privacy. The Yorkshire Ranter is talking about the evils of biometric databases, and Israeli civil liberties advocates have mounted the same attack against the government’s attempt at a database. But German passports, while biometric, store data exclusively on the passport, not in any centralized database. ID cards designed around proving that you paid your fare don’t even have to use biometrics; the security level is lower than with biometrics, but the failure mode is that the occasional forger can ride without paying $100 a month (which is much less than the cost of the forgery), not that a ring of terrorists can enter the country.
Navigo’s ID cards are not hospitable, but allowing passengers to ride with any valid state-issued ID would be. Visitors either came in from another country and therefore have passports, drove in and therefore have drivers’ licenses, or flew in domestically and therefore still have ID cards. Traveling between cities without ID is still possible here and in other free European countries, but everyone has national ID cards anyway; the ID problem is mainly in the US with its low passport penetration (and secondarily Canada and Australia), and the US has no intercity public transit network to speak of outside the Northeast Corridor.
What this means is that the best way to prevent duplication of transit passes is to require ID cards. Any ID card must be acceptable, including a passport (best option), a national ID card (second best), or an American driver’s license (worst).
Getting rid of the faregates
There are approximately three first-world Western cities that have any business having faregates on their urban rail networks: London, Paris, New York. Even there, I am skeptical that the faregates are truly necessary. The Metro’s crowd control during the World Cup victory celebration was not great. New York’s faregates sometimes cause backups to the point that passengers just push the emergency doors open to exit, and then rely on an informal honor system so that passengers don’t use the open emergency doors to sneak in without payment.
Evidently, the Munich S-Bahn funnels all traffic through a single two-track city center tunnel and has 840,000 weekday users, without faregates. Only one or two trunk lines are busier in Paris, the RER A with about a million, and possibly the RER B and D if one considers them part of the same trunk (they share a tunnel but no platforms); in London, only the Central, Victoria, and Jubilee lines are busier, none by very much; in New York, none of the two-track trunks is as busy. Only the overcrowded lines in Tokyo (and a handful in Osaka, Beijing, and Shanghai) are clearly so busy that barrier-free proof-of-payment fare enforcement is infeasible.
The main reason not to use faregates is that they are maintenance-intensive and interfere with free passenger flow. But they also require passengers to insert fare media, such as a paper ticket or a contactless card, at every station. With contactless cards the system goes well beyond exact numbers of users by station, which can be obtained with good accuracy even on barrier-free systems like Transilien using occasional counts, and can track individual users’ movements. This is especially bad on systems that do not have flat fares (because then passengers tag on and off) and on systems that involve transferring with buses or regional trains and not just the subway (because then passengers have to tag on and off at the transfer points too).
Best industry practice here is then barrier-free systems. To discourage fare evasion, the agency should set up regular inspections (on moving vehicles, with unarmed civilian inspectors), but at the same time incentivize season passes. Season passes are also good for individual privacy, since all the system registers is that the passenger loaded up a monthly pass at a certain point, but beyond that can’t track where the passenger goes. All cities that have faregates except for the largest few should get rid of them and institute POP, no matter the politics.
Tickets and ID cards
In theory, the ID card can literally be the ticket. The system can store in a central database that Alon Levy, passport number [redacted], loaded a monthly pass valid for all of Ile-de-France on 2018-08-16, and the inspector can verify it by swiping my machine-readable passport. But in practice, this requires making sure the ticket machine or validator can instantly communicate this to all roving fare inspectors.
An alternative approach is to combine paper tickets with ID cards. The paper ticket would just say “I am Alon Levy, passport number [redacted], and I have a pass valid for all of Ile-de-France until 2018-09-14,” digitally signed with the code of the machine where I validated the ticket. This machine could even be a home printer, via online purchase, or a QR code displayed on a phone. Designing such a system to be cryptographically secure is easy; the real problem is preventing duplication, which is where the ID card comes into play. Without an ID card, it’s still possible to prevent duplication, but only via a cumbersome system requiring the passenger to validate the ticket again on every vehicle (perhaps even every rail car) when getting on or off.
The same system could handle stored value. However, without printing a new ticket every time a passenger validates, which would be cumbersome, it would have to fall back on communication between the validator and the handheld readers used by the inspectors. But fortunately, such communication need not be instant. Since passengers prepay with stored value, the ticket itself, saying “I am Alon Levy, passport number [redacted], and I loaded 10 trips,” is already valid, and the only communication required is when passengers run out of money; moreover, single-use tickets have a validity period of 1-2 hours, so any validator-to-inspector communication lag time of less than the validity period will be enough to ensure not to validate expired tickets. The same system can also be used to have a daily cap as in Oyster, peak surcharges, and even generally-undesirable station-to-station rather than zonal fares.
It’s even possible to design a system without single-use tickets at all. Zurich comes close, in that a 24-hour pass costs twice as much as a single-use ticket (valid for just an hour), so passengers never have any reason to get a single-use ticket. In this system there would not be any stored value, just passes for a day or more, valid in prescribed zones, with printable tickets if regular riders in one zone occasionally travel elsewhere.
The upshot here is that advanced technology is only required for printing and reading QR codes. The machines do not need to be any more complicated than ATMs or Bitcoin ATMs (insert money, receive a Bitcoin slip of paper); I don’t know how much Bitcoin ATMs cost, but regular ATMs are typically $2,000-3,000, and the most expensive are $8,000, unlike the $75,000 ticket machines used at New York SBS stations. The moving parts are software and not hardware, and can use multi-vendor cryptographic protocols. In effect, the difficult part of verifying that there is no duplication or forgery is offloaded to the state ID system.
Bus Stop Spacing and Network Legibility
I had an interesting interview of the annoying kind, that is, one where my source says something that ends up challenging me to the point of requiring me to rethink how I conceive of transportation networks. On the surface, the interview reaffirmed my priors: my source, a mobility-limited New Yorker, prefers public transit to cars and is fine with walking 500 meters to a bus stop. But one thing my source said made me have to think a lot more carefully about transit network legibility. At hand was the question of where buses should stop. Ages ago, Jarrett suggested that all other things equal (which they never are), the best stop spacing pattern is as follows:

The bus stops on the north-side arterials are offset in order to slightly improve coverage. The reason Jarrett cites this doesn’t occur much in practice is that there would also be east-west arterials. But maybe there aren’t a lot of east-west arterials, or maybe the route spacing is such that there are big gaps between major intersections in which there’s choice about which streets to serve. What to do then? My source complained specifically about unintuitive decisions about which streets get a bus stop, forcing longer walks.
In the case of the most important streets, it’s easy enough to declare that they should get stops. In Brooklyn, this means subway stations (whenever possible), intersecting bus routes, and important throughfares like Eastern Parkway or Flatbush. Right now the B44 Select Bus Service on Nostrand misses Eastern Parkway (and thus the connection to the 3 train) and the M15 SBS on First and Second Avenues misses 72nd Street (and thus the southernmost connection to Second Avenue Subway). However, there is a bigger question at hand, regarding network legibility.
Bus networks are large. Brooklyn’s current bus network is 550 km, and even my and Eric Goldwyn’s plan only shrinks it to about 340, still hefty enough that nobody can be expected to memorize it. Passengers will need to know where they can get on a stop. For the sake of network legibility, it’s useful to serve consistent locations whenever possible.
This is equally true of sufficiently large subway networks. Manhattan subway riders know that the north-south subway lines all have stops in the vicinity of 50th Street, even though the street itself isn’t especially important, unlike 42nd or 34th. In retrospect, it would have been better to have every line actually stop at 50th, and not at 49th or 51st, but the similarity is still better than if some line (say) stopped at 47th and 54th on its way between 42nd and 59th. A bad Manhattan example would be the stop spacing on the 6 on the Upper East Side, serving 68th and 77th Streets but not the better-known (and more important) 72nd and 79th.
There are similar examples of parallel subway lines, some stopping on consistent streets, and some not. There are some smaller North American examples, i.e. Toronto and Chicago, but by far the largest subway network in the world in a gridded city is that of Beijing. There, subway stops near city center are forced by transfer locations (Beijing currently has only one missed connection, though several more are planned), but in between transfers, they tend to stop on consistent streets when those streets are continuous on the grid.
But outside huge cities (or cities with especially strong grids like Chicago, Philadelphia, and Toronto), consistent streets are mostly a desirable feature for buses, not subways. Bus networks are larger and less radial, so legibility is more important there than on subways. Buses also have shorter stop spacing than subways, so people can’t just memorize the locations of some neighborhood centers with subway stops (“Nation,” “Porte de Vincennes,” etc.).
In the other direction, in cities without strong grids, streets are usually not very long, and the few streets that are long (e.g. Massachusetts Avenue in Boston) tend to be so important that every transit route intersecting them should have a stop. However, streets that are of moderate length, enough to intersect several bus lines, are common even in interrupted grids like Brooklyn’s or ungridded cities like Paris (but in London they’re rarer). Here is the Paris bus map: look at the one-way pair in the center on Rue Reaumur and Boulevard Saint-Denis (and look at how the northbound bus on Boulevard de Strasbourg doesn’t stop at Saint-Denis, missing a Metro transfer). There are a number of streets that could form consistent stops, helping make the Parisian bus network more legible than it currently is.
As with all other aspects of legibility, the main benefits accrue to occasional users and to regular riders who unfamiliar with one particular line or region. For these riders, knowing how to look for a bus stop (or subway station, in a handful of large cities) is paramount; it enables more spontaneous trips, without requiring constantly consulting maps. These occasional spontaneous trips, in turn, are likelier to happen outside the usual hours, making them especially profitable for the transit agency, since they reduce rather than raise the peak-to-base ratio. (Bus operating costs mostly scale with service-hours, but very peaky buses tend to require a lot of deadheading because they almost never begin or end their trip at a bus depot.)
The main takeaway from this is that bus network redesigns should aim to stop buses on parallel routes at consistent streets whenever possible, subject to other constraints including regular stop spacing, serving commercial nodes, and providing connections to the rail network. To the extent cities build multiple parallel subway lines, it’s useful to ensure they serve stations on consistent streets as well when there’s a coherent grid; this may prove useful if New York ever builds a subway under Utica and extends the Nostrand Avenue Line, both of which extensions were on the drawing board as recently as the 1970s.
Radial Metro Networks for Portions of Cities
I’ve harped about the necessity of radial metro networks, looking much like the following schematic:
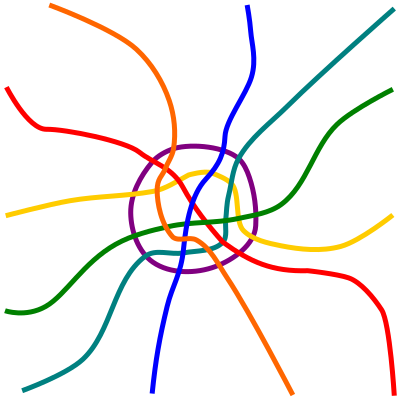
However, in practice such pure radial networks are rare. Some networks have parallel lines (such as Paris and Beijing), nearly all have lines intersecting without a transfer at least once (the largest that doesn’t is Mexico City), some have chordal lines and not just radial or circular lines, and nearly all have lines that meet twice. Often these variations from pure radii are the result of poor planning or a street network that makes a pure radial system infeasible, but there are specific situations in which it’s reasonable for lines to meet multiple times (or sometimes even be parallel). These come from the need to built an optimal network not just for the whole city but also notable portions of it.
The unsegmented city
The diagram depicted above is a city with a single center and no obvious sub-areas with large internal travel demand. If the city is on a river, it’s not obvious from the subway map where the river passes, and it’s unlikely its non-CBD bank has a strong identity like that of the Left Bank of Paris, South London, or Brooklyn and Queens.
Among the largest metro networks in the world, the one most akin to the diagram above is Moscow. It has seven radial lines through city center (numbered 1-10, omitting the one-sided 4, the circular 5, and the yet-incomplete 8). They have some missed connections between them (3/6, 3/7, 6/9), and one pair of near-parallel lines (2/10, meeting only at Line 10’s southern terminus), but no parallel lines, and no case in which two lines cross twice. And Moscow’s development is indeed oriented toward connecting outlying areas with city center. Connections between areas outside the center are supposed to use the circular lines (5 and 14, with 11 under construction).
In a relatively monocentric city, this is fine. Even if this city is on the river, which Moscow is, it doesn’t matter too much if two neighborhoods are on the same side of the river when planning the network. Even in polycentric cities, this is fine if the sub-centers get connections via circular lines or the odd chordal line (as will eventually happen when Los Angeles builds a real subway network with such chords as Vermont and Sepulveda).
The segmented city
London and Paris are both segmented by their rivers, and their wrong sides (South London, Left Bank) both have strong regional identities, as does to some extent East London. New York, partitioned into boroughs by much wider waterways than the Thames and Seine, has even stronger sub-identities, especially in Brooklyn. I do not know of a single New Yorker whose commute to work or school involves crossing a bridge over a river on foot, nor of any case of anyone crossing a bridge in New York on foot (or bike) except for recreational purposes; in Paris I do so habitually when visiting the Latin Quarter, and at a conference in 2010 another attendee biked from Porte de Vincennes to Jussieu every day.
With a difficult water boundary, the wrong-side part of the city became a center in its own right. Downtown Brooklyn and the Latin Quarter should both be viewed as sub-centers that failed to become CBDs. The Latin Quarter, the oldest part of Paris outside the Ile de la Cite, declined in favor of the more commercial Right Bank as the city grew in the High and Late Middle Ages; Downtown Brooklyn declined in favor of more concentration in Manhattan and more dispersion to other centers (often in Queens) over the course of the 20th century.
Early 20th century New York and Paris were not polycentric cities. There was no everywhere-to-everywhere demand. There was demand specifically for travel within Brooklyn and within the Left Bank. To this day, the connections to the Latin Quarter from Right Bank neighborhoods not on Line 4 are not great, and from Nation specifically the alternatives are a three-seat ride and a long interchange at Chatelet. Ultimately, this situation occurs when you have a region with a strong identity and strong demand for internal travel larger than a neighborhood (which can be served by a few subway stops on a single line) but smaller than an entire city.
In this case, a radial subway network (which neither the New York City Subway nor the Paris Metro is) could justifiably have multiple crossings between two lines, ensuring that lines provide a coherent network for internal travel. South London is a partial example of this principle: not counting the Wimbledon branch of the District line, the South London Underground network is internally connected, and the best route between any two South London stations stays within South London. In particular, the Victoria and Northern lines cross twice, once at Stockwell and once at Euston, in a city that has a generally radial metro system.
Don’t go overboard
The need to serve internal travel within portions of a city is real, and it’s worthwhile to plan metro networks accordingly. But at the same time, it’s easy to go overboard and plan lines that serve only travel within such portions. Most of the examples I give of weak chordal lines – the G train in New York, Line 10 and the RER C in Paris, Line 6 in Shanghai – serve internal demand to the wrong side of a city divided by a river; only Shanghai’s Line 3 is an exception to this pattern, as a weak chordal line that doesn’t come from city segmentation.
In the cases of the G and M10, the problem is partly that the lines have compromises weakening them as radials. The G has too many missed connections to radial lines, including the J/Z and the entire Atlantic-Pacific complex; M10 terminates at Austerlitz instead of extending east to the library, which is the second busiest Left Bank Metro stop (after Montparnasse) and which has a particularly strong connection to the universities in the Latin Quarter.
But Line 6 is constrained because it doesn’t serve Lujiazui, just Century Avenue, and the RER C does serve the library but has exceptionally poor connections to the CBD and other Right Bank destinations. It’s important to ensure the network is coherent enough to serve internal demand to a large segment of the city but also to serve travel demand to the rest of the city well.
Good transfers
Serving the entire city hinges on good transfers. The most important destination remains city center, so lines that aren’t circumferential should still aim to serve the center in nearly all cases. Internal demand should be served with strategic transfers, which may involve two lines crossing multiple times, once in or near city center and once on the wrong side of the river.
The main drawback of multiple crossings is that they are less efficient than a pure radial network with a single city center crossing between each pair of lines, provided the only distinguished part of the city is the center. Once internal travel to a geographic or demographic segment is taken into account, there are good reasons to slightly reduce the efficiency of the CBD-bound network if it drastically raises the efficiency of the secondary center-bound network. While demographic trends may come and go (will Flushing still be an unassimilated Chinese neighborhood in 50 years?), geographic constraints do not, and place identities like “Left Bank” and “Brooklyn” remain stable.
Note the qualifiers: since the CBD remains more important than any secondary center, it’s only acceptable to reduce CBD-bound efficiency if the gain in secondary center-bound efficiency is disproportionate. This is why I propose making sure there are good transfers within the particular portion of the city, even at the cost of making the radial network less perfect: this would still avoid missed connections, a far worse problem than having too many transfer points.
So what?
In New York, London, and Paris, the best that can be done is small tweaks. However, there exist smaller or less developed cities that can reshape their transit networks, and since cities tend to form on rivers and bays, segmentation is common. Boston has at least two distinguished wrong-side segments: East Boston (including Chelsea and Revere) and Greater Cambridge. East Boston can naturally funnel transit through Maverick, but in Greater Cambridge there will soon be two separate subway spines, the Red and Green Lines, and it would be worthwhile to drag a rail connection between them. This is why I support investing in rail on the Grand Junction, turning it into a low-radius circular regional rail line together with the North-South Rail Link: it would efficiently connect the Green Line Extension with Kendall.
More examples of segmented cities include the Bay Area (where the wrong-side segment is the East Bay), Istanbul (where Europe and Asia have separate metro networks, connected only by Marmaray), Stockholm (where Södermalm and Söderort are separated by a wide channel from the rest of the city, and Kungsholmen is also somewhat distinguished), and Washington (where the wrong side is Virginia). In all of these there are various compromises on metro network planning coming from the city segmentation. Stockholm’s solution – making both the Red and Green Lines serve Slussen – is by far the best, and the Bay Area could almost do the same if BART were connected slightly differently around Downtown Oakland. But in all cases, there are compromises.
Development-Oriented Transit, Redux
I wrote years ago about the problems of so-called development-oriented transit – that is, transit built not to serve current demand but future development, often to be funded via land value capture and other opaque mechanisms. Today I want to talk not so much about the transit itself but the arguments people make for it.
The context is that I appeared on Kojo Nnamdi’s show last week discussing the plans for a ferry network in Washington DC, which I had heavily criticized in an article for the DC Policy Center. I was discussing the issue with guest host Marc Fisher and two locals involved in the ferry plan. I criticized the ferry plan over the poor land use on most of the waterfront on both sides of the Potomac, contrasting it with the Staten Island Ferry and Vancouver’s SeaBus (both of which have skyscrapers going almost to the water’s edge at the CBD end and decent secondary CBD development at the outlying end). My interlocutors answered, don’t worry, the area is undergoing redevelopment.
I heard something similar out of Boston, regarding the Seaport. People recurrently talk on Commonwealth about how to connect to the Seaport better, and at one point there was a plan to have the Fairmount Line reverse-branch to serve the Seaport (rather than going into the CBD proper at South Station). The crayonistas talk about how to connect the Green Line to the Seaport. Whenever I point out that the Seaport is at best a tertiary destination I’m told that it’s growing so it needs some transit.
In both cases, what’s missing is scale. Yes, waterfront redevelopment in former industrial cities is real. But the only place where it’s happened on sufficient scale to merit changing the entire transit system to fit the new development is London, around Canary Wharf. And even in London, the CBDs are unambiguously still the City and the West End; Canary Wharf is a distant third, deserving of a Crossrail line and some Tube lines but not of the dense mesh of transit that the City and West End have.
The important thing to understand is that TOD sites are practically never going to eclipse the CBD. La Defense, for all its glass-clad glory, is still smaller than the Paris CBD, stretching from west of Les Halles to east of Etoile. The peak job density at La Defense is higher, but westbound RER A trains are at their most crowded heading into Auber, not La Defense, and the CBD maintains its medium-high job density for several square kilometers while La Defense is geographically small. And your city’s waterfront redevelopment is not going to be La Defense or Canary Wharf.
If the TOD sites are not going to be primary CBDs, then they must be treated as secondary centers at best. One does not build transit exclusively for a secondary center, because people along the lines that serve it are going to be much more interested in traveling to the primary CBD. For example, people at the origin end of a ferry system (in Washington’s case this is Alexandria and suburbs to its south) are traveling to the entirety of city center, and not just to the redevelopment site near the waterfront. Thus the transit that they need has to connect to the CBD proper, which in Washington’s case is around Farragut and Metro Center. A ferry system that doesn’t connect to Metro well is of no use to them, and whatever redevelopment Washington puts up near the Navy Yard won’t be enough to prop up ridership.
The principle for redeveloped waterfronts has to be the same as for every secondary neighborhood destination: be on the way. If there is cause to build an entirely new metro line, or run more buses, and the new service can plausibly go through the redevelopment site, then it should. In Boston’s case, the 7 bus has high usage for how short it is, and so does the Silver Line going to the airport, so it’s worthwhile making sure they run more efficiently (right now the 7 and Silver Line run along the same inner alignment but peak in opposite directions without being able to share infrastructure or equipment) to serve the Seaport better. However, building a line from scratch just for the Seaport is a bad idea, and the same is true of the area around Waterfront and the Navy Yard in Washington.
In fact, the two closest things New York has to Canary Wharf – the Jersey City waterfront and Long Island City – both developed precisely because they were on the way. PATH was built to connect the railroad terminals at the then-industrial waterfront and the traditional center of Jersey City at Journal Square with Manhattan. Mainline trains began to be diverted from Jersey City to Manhattan when Penn Station opened, and with the general decline of rail traffic the waterfront was abandoned; subsequently, Exchange Place and Pavonia/Newport became major job and retail centers, since they had available land right on top of rapid transit stations minutes from Lower Manhattan. In Queens, something similar happened with Long Island City, once a ferry terminal on the LIRR, now a neighborhood with rapid residential and commercial growth since it sits on multiple subway lines just outside Midtown.
One exception to the be on the way rule is if there is a nearby stub-end line or a natural branch point. Some metro lines stub-end in city center rather than running through, such as the Blue Line in Boston, the 7 and L trains in New York, and Metro Line 11 here in Paris. If they can be plausibly extended to a new redevelopment site, then this is fine – in this case the CBD will be on the way to the new site. The 7 extension is one example of this principle; the extension is overall not a success, but this is exclusively due to high costs, while ridership per km is not terrible.
In London, the Jubilee line and Crossrail are both examples of this exception around Canary Wharf. Crossrail expects intense demand into Central London but less demand on the specific eastern branch used (the Great Eastern slow lines), making the City into a natural branch point with a separate branch to Canary Wharf and Southeast London. And the Jubilee line stub-ended at Charing Cross when it first opened in the 1970s; plans for an extension to the east are even older than the initial line, and once Canary Wharf became a major office building site, the plans were changed so as to serve the new center on the way to Stratford (itself an urban renewal site with extensive redevelopment, it’s just smaller than Canary Wharf).
The ultimate guideline here is be realistic. You may be staring at a place that’s doubled its job density in a decade, but it won’t be able to double its density every decade forever, and most likely you’ll end up with either high-density condo towers or a small job cluster. This means that you should plan transit to this site accordingly: worth a detour on a line to the CBD, but not worth an entire system (whether ferry or rail) by itself.
Guidelines for Driverless Buses
As I’ve said a few months ago in The American Prospect, driverless bus technology does not yet appear ready for mass deployment. However, research into this technology continues. Of particular note is Google’s work at Waymo, which a source within the Bay Area’s artificial intelligence community tells me is more advanced and more serious than the flops at Uber and Tesla; Waymo’s current technology is pretty good on a well-understood closed route, but requires laborious mapping work to extend to new routes, making it especially interesting for fixed-route buses rather than cars. But ultimately, automated vehicles will almost certainly eventually be mature and safe, so it is useful to plan around them. For this, I propose the following dos and don’ts for cities and transit agencies.
Install dedicated, physically-separated bus lanes
A bus with 40 people should get 40 times the priority of a car with one person, so this guideline should be adopted today already. However, it’s especially important with AVs, because it reduces the friction between AV buses and regular cars, which is where the accident in Las Vegas reference in my TAP article happened. The CityMobil2 paradigm involves AVs in increasingly shared traffic, starting from fully enclosed circuits (like the first line in Helsinki, at the zoo) and building up gradually toward full lane sharing. Dedicated lanes are a lower level of sharing than mixed traffic, and physical separation reduces the ability of cars to cut ahead of the bus.
If there is a mixture of AV and manual buses, both should be allowed in the dedicated lanes. This is because bus drivers can be trained to know how to deal with AVs. Part of the problem with AVs in mixed traffic is that human drivers are used to getting certain cues from other human drivers, and then when facing robot drivers they don’t have these cues and misread the car’s intentions. But professional drivers can be trained better. Professional bus drivers are also familiar with their own bus system and will therefore know when the AV is going to turn, make stops, and so on.
Use Kassel curbs to provide wheelchair accessibility
Buses are at a disadvantage compared with trams in wheelchair accessibility. Buses sway too much to have the precise alignment that permits narrow enough gaps for barrier-free access on trains. However, as a solution, some German cities have reconstructed the edges of the bus lane next to the bus stop platform, in order to ease the wheels into a position supporting step-free access on low-floor buses. Potentially, AVs could make this easier by driving more precisely or by having platform extenders similar to those of some regional trains (such as those of Zurich) bridging the remainder of the horizontal gap.
Driverless trains in Vancouver and even on Paris Metro Line 14 have roll-on wheelchair access: passengers in wheelchairs can board the train unassisted. In contrast, older manually-driven trains tend to tolerate large horizontal and vertical gaps blocking passengers in wheelchairs, to the point that New York has to have some special boarding zones for wheelchairs even at accessible stations. If the combination of precision driving and Kassel curbs succeeds in creating the same accessibility on a bus as on SkyTrain in Vancouver, then the bus driver’s biggest role outside of actually driving the bus is no longer necessary, facilitating full automation.
Don’t outsource planning to tech firms
Transit networks work best when they work in tandem. This means full fare and schedule integration within and across different modes, and coordinated planning. Expertise in maintaining such networks lies within the transit agencies themselves as well as with various independent consultancies that specialize in transportation.
In contrast, tech firms have little expertise in this direction. They prefer competition to cooperation, so that there would be separate fleets within each city by company – and moreover, each company would have an incentive to arrange schedules so that buses would arrive just ahead of the other companies to poach passengers, so there wouldn’t be even headways. The culture of tech involves brazen indifference to domain expertise and a preference for reinventing the wheel, hence Uber and Chariot’s slow realization that no, really, fixed-route buses are the most efficient way of carrying passengers on the street in dense cities. Thus, outsourcing planning is likely to lead to both ruinous competition and retarded adoption of best practices. To prevent this, cities should ban private operations competing with their public bus networks and instead run their own AVs.
Most of the world’s richest cities have deep pools of tech workers, especially the single richest, San Francisco. It would be best for Muni, RATP, NYCT, and other rich-city agencies to hire tech talent using the same methods of the private sector, and train them in transit network planning so that they can assist in providing software services to the transit system in-house.
Resist the siren song of attendants
Las Vegas’s trial run involved an attendant on each bus performing customer service and helping passengers in wheelchairs. A bus that has an attendant is no more a driverless bus than a subway with computer-controlled driving and an operator opening and closing doors is a driverless train. The attendant’s work is similar to that of a bus driver. If the hope of some private operators is that relabeling the driver as an attendant will allow them to de-skill the work and hire low-pay, non-union employees, then it’s based on a misunderstanding of labor relations: transit employees are a prime target for unionization no matter whether they are called drivers.
Ultimately, the difficulty of driving a bus is not much greater than that of dealing with annoying customers, being on guard in case passengers act aggressively or antisocially, and operating wheelchair lifts. Bus drivers get back pain at high rates since they’re at the wheel of a large vehicle designed for passenger comfort for many hours a day, but this may still be a problem on AVs, and all other concerns of bus drivers (such as the risk of assault by customers) remain true for attendants. Either get everything right to the point of not needing any employee on the bus, or keep manual driving with just some computer assistance.
Resist the siren song of small vehicles
All AV bus experiments I know of (which I know for a fact is not all AV buses that are trialing) involve van-size vehicles. The idea is that, since about 75% of the cost of running a bus today is the driver’s wage, there’s no real point in running smaller vehicles at greater frequency if there’s a driver, but once the driver is removed, it’s easy enough to run small vehicles to match passenger demand and reduce fuel consumption.
However, vans have two problems. First, they only work on thin routes. Thick routes have demand for articulated buses running at high frequency, and then vans both add congestion to the bus lane and increase fuel consumption (when the vehicles are full, bigger is always more fuel-efficient). And second, they lead to safety problems, as passengers may be afraid of riding a bus alone with 3-4 other passengers but not with 20 or more (Martha Lauren rides full London buses fearlessly but would make sure to sit near the driver on nearly-empty Baltimore buses).
Medium-size buses, in the range of 20-30 seats, could be more useful on thin routes. However, passenger safety problems are likely to remain if only a handful of people ride each vehicle.
Get your maintenance costs under control
If you remove the driver, the dominant factor in bus operating costs becomes maintenance. Assuming maintenance workers make the same average annual wage and get the same benefits as transit workers in general, the wages of maintenance workers are about 15% of the total operating costs of buses in Chicago and 20% in New York.
The importance of fuel economy grows as well, but fuel today is a much smaller proportion of costs. Around 3% in Chicago and 2% in New York. European fuel costs are much higher than Americans, but so are European bus fuel economy rates: in tests, Boris buses got 4.1 km per liter of diesel, which is maybe twice as good as the US average and three times as good as the New York average.
This suggests that with the driver gone, maybe 75% of the remaining variable operating cost is maintenance. Chicago does better than New York here, since it replaces 1/12 of its fleet every year, so every year 1/12 of the fleet undergoes mid-life refurbishment and work is consistent from year to year, whereas in New York the replacement schedule is haphazard and there is more variation in work needs and thus more idle time. The most important future need for AV procurement is not electric traction or small size, but low lifecycle costs.
Update: by the same token, it’s important to keep a lid on vehicle procurement costs. New York spends $500,000 on a standard-length bus and $750,000 on an articulated bus; the Boris buses, which are bilevel and similar in capacity to an artic, cost about $500,000, which is locally considered high, and conventional artic or bilevel buses in London cost $300,000-350,000. American cities replace buses every 12 years, compared with every 15 years in Canada, and the depreciation in New York is around 6% of total bus operating costs. Cutting bus procurement costs to London levels would only save New York a small percent of its cost, but in an AV future the saving would represent around 12% of variable costs.
Plan for higher frequency
AVs represent an opportunity to reduce marginal operating costs. This means transit agencies should plan accordingly:
- Lower marginal costs encourage running buses more intensively, running almost as much service off-peak and on weekends as at rush hour.
- Very high frequency encourages passengers to transfer more, so the value of one-seat rides decreases.
- Higher frequency always increases capacity, but its value to passengers in terms of reduced wait times is higher when the starting frequency is low, which means agencies should plan on running more service on less frequent routes and only add service on routes that already run every 5 minutes or less if the buses are overcrowded.
The Role of Local Expertise in Construction Costs
When I first looked at construction costs, I looked exclusively at developed countries. Eventually I realized that the difference in average costs between rich and poor countries is small. But then I noticed a different pattern in the third world: some places, like India, Bangladesh, Nigeria, and Indonesia, spend much more than China does. Why is that? While I’ve had a bunch of different explanations over the years, I believe today that the difference concerns local expertise versus reliance on first-world consultants.
The facts, as far as I can tell, are as follows:
- Construction costs in China are about $250 million per km, a little more than the average for Continental Europe.
- Construction costs in post-communist Europe are all over, but are the same range as in Western Europe. Bulgaria is pretty cheap; in this post I bring up a line that costs around $200 million/km in today’s money but other extensions built this decade are cheaper, including one outer one at $50 million/km. In contrast, Warsaw’s Line 2 is quite expensive.
- Latin American construction costs have the same range as Europe, but it seems more compressed – I can’t find either $50 million/km lines or $500 million/km ones.
- Africa and the parts of Asia that used to be colonies have high construction costs: India and Egypt are expensive, and here I give two expensive examples from Bangladesh and Indonesia. The Lagos Metro is spending subway money on an el in the middle of a wide road and is reminiscent of American costs.
- When the first world had comparable income levels to those of the third world today, in the early 20th century, its construction costs were far lower, around $30-50 million per underground km. First-world cost growth in the last 100 years has mostly tracked income growth – it’s been somewhat faster in New York and somewhat slower in Paris, but on average it’s been similar.
For a while, I had to contend with the possibility that Chinese autocracy is just better at infrastructure than Indian (or Bangladeshi, or Indonesian, or Nigerian) democracy. The nepotism and corruption in India are globally infamous, and it’s still well-governed compared with Indonesia and Nigeria, which have personality-based politics. But then, in the developed world, authoritarian states aren’t more efficient at construction (Singapore’s construction costs are high); moreover, post-communist democracies like Bulgaria and Romania manage low construction costs.
What I instead think the issue is is where the state’s infrastructure planning comes from. China learned from the USSR and subsequently added a lot of domestic content (such as the use of cut-and-cover in some situations) fitting its particular needs; as a result, its construction costs are reasonable. The post-communist world learned from the USSR in general. There’s a wide range, with Romania near one end and Poland near the other, but the range is comparable to that of Western Europe today. Overall it seems that Eastern Europe can competently execute methods geared to the middle-income world (as the second world was in the Cold War) as well as, thanks to assistance from the EU, the high-income world.
Latin America, too, uses domestically-developed methods. The entire region is infamous in the economic development literature for having begun an inward economic turn in the Great Depression, cutting itself off from global markets and generally stagnating. Government functions are likewise done domestically or maybe outsourced to domestic contractors (and if international ones are involved, it’s in construction, not planning). Evidently, Latin America developed bus rapid transit, a mode of transportation optimally designed for countries with low incomes (so paying armies of bus drivers is cheaper than building rail tracks) and relatively strong currencies (so importing buses from richer countries isn’t ruinously expensive).
The situation in the ex-colonies is completely different. Even relatively protectionist ones outsource much of their planning to the developed world or increasingly to China, out of a combination of cultural cringe and shortage of domestic capital. The metro lines I have data for in India, Bangladesh, and Indonesia all involve Japanese technology and planning, with no attempt to adapt the technology to local conditions. So insistent is Japan on following its domestic recipe exactly that India’s high-speed rail construction is using standard gauge rather than broad gauge and Shinaknsen-size trains rather than larger Indian trains (which are 3.7 meters wide and can fit people 6-abreast). Elsewhere, China contributes capital and planning as part of the Belt and Road Initiative, and then its methods are geared toward middle income and not low income.
The correct way for countries in the per capita income range of Nigeria, India, and Bangladesh to build subways is to open up their main roads, which are often very wide, and put in four tracks in a cut-and-cover scheme similar to that of early-20th century New York. If they can elevate the tracks instead, they should use the same methods used to build Lines 2 and 6 in Paris in the early 20th century, which use concrete columns and are quiet enough that, unlike in New York, people can carry a conversation under the viaduct while a train passes. If the line needs to deviate from roads, then the city should buy property and carve up a new street (as New York did with Seventh Avenue South and Sixth Avenue in the Village) or else learn to implement late Victorian and Edwardian London’s techniques of deep boring.
However, actually implementing Belle Epoque construction methods requires particular knowledge that international consultants don’t have. Most of these consultants’ income comes from the first world, where wages are so high that the optimal construction methods involve extensive automation, using machinery rather than battalions of navvies with shovels. The technical support required for a tunnel boring machine is relatively easy in a rich country with a deep pool of qualified engineers and mechanics and a nightmare in a poor one where all such expertise has to be imported or trained from scratch. Thus, the consultants are likely to recommend the first-world methods they are familiar with, and if they do try to adapt to low wages, they may make mistakes since they have to reinvent ideas or read historical sources (which they are typically not trained to do – they’re consultants, not historians).
The result is that even though open economies tend to grow faster overall, economies with a history of closure tend to do better on this specific topic, where international consultants are not very useful for the needs of the developing world. India in particular needs to get better at indigenizing its construction and avoid mindlessly copying the first world out of cultural cringe, because even though it is almost a middle-income country by now, its wages remain a fraction of those of North America, Western Europe, and Japan, and its future growth trajectory is very different, requiring extensive adaptations. Both the overall extent of planning and the specific construction methods must be tailored to local conditions, and so far India seems bad at both (hence the undersized, expensive high-speed trains).
