Category: Urban Transit
On Envying Canada
In England and Wales, 15.9% of workers get to work on public transport, and in France, 14.9% do. In Canada, the figure is close: 12.4%, and this is without a London or Paris to run up the score in. Vancouver is a metro region of 2.5 million people and 1.2 million workers, comparable in size to the metropolitan counties in England and to the metro area of Lyon; at 20.4%, it has a higher public transport modal share than all of them, though it is barely higher than Lyon with its 19.9% share. Calgary, Ottawa, Edmonton, and Winnipeg are likewise collectively respectable by the standards of similar-size French regions, such as the departments of Bouches-du-Rhône (Marseille), Alpes-Maritimes (Nice), Gironde (Bordeaux), Haute-Garonne (Toulouse), and Bas-Rhin (Strasbourg).
As a result, Jarrett Walker likes telling American cities and transit agencies to stop envying Europe and start envying Canada instead. Canada is nearby, speaks the same language, and has similar street layout, all of which contribute to its familiarity to Americans. If Europe has the exotic mystique of the foreign, let alone East Asia, Canada is familiar enough to Americans that the noticeable differences are a cultural uncanny valley.
And yet, I am of two minds on this. The most consistent transit revival in Canada has been in Vancouver, whose modal share went from 14.3% in 1996 to 20.4% in 2016 – and the 2016 census was taken before the Evergreen extension of the Millennium Line opened. TransLink has certainly been doing a lot of good things to get to this point. And yet, there’s a serious risk to Canadian public transport in the future: construction costs have exploded, going from Continental European 15 years ago to American today.
The five legs of good transit
I was asked earlier today what a good political agenda for public transportation would be. I gave four answers, like the four legs of a chair, and later realized that I missed a fifth point.
- Fuel taxes and other traffic suppression measures (such as Singapore and Israel’s car taxes). Petrol costs about €1.40/liter in Germany and France; diesel is cheaper but being phased out because of its outsize impact on pollution.
- Investment in new urban and intercity lines, such as the Madrid Metro expansion program since the 1990s or Grand Paris Express. This is measured in kilometers and not euros, so lower construction costs generally translate to more investment, hence Madrid’s huge metro network.
- Interagency cooperation within metropolitan regions and on intercity rail lines where appropriate. This includes fare integration, schedule integration, and timetable-infrastructure integration.
- Urban upzoning, including both residential densification in urban neighborhoods and commercialization in and around city center.
- Street space reallocation from cars toward pedestrians, bikes, and buses.
We can rate how Canada (by which I really mean Vancouver) does on this rubric:
- The fuel tax in Canada is much lower than in Europe, contributing to high driving rates. In Toronto, gasoline currently costs $1.19/liter, which is about €0.85/l. But Vancouver fuel taxes are higher, raising the price to about $1.53/l, around €1.06/l.
- Canadian construction costs are so high that investment in new lines is limited. Vancouver has been procrastinating building the Broadway subway to UBC until costs rose to the point that the budget is only enough to build the line halfway there.
- Vancouver and Toronto both have good bus-rapid transit integration, but there is no integration with commuter rail; Montreal even severed a key commuter line to build a private driverless rapid transit line. In Vancouver, bus and SkyTrain fares have decoupled due to political fallout from the botched smartcard implementation.
- Vancouver is arguably the YIMBYest Western city, building around 10 housing units per 1,000 people every year in the last few years. Toronto’s housing construction rate is lower but still respectable by European standards, let alone American ones.
- There are bike lanes but not on the major streets. If there are bus lanes, I didn’t see any of them when I lived in Vancouver, and I traveled a lot in the city as well as the suburbs.
Vancouver’s transit past and future
Looking at the above legs of what makes for good public transport, there is only one thing about Canada that truly shines: urban redevelopment. Toronto, a metro area of 6 million people, has two subway mainlines, and Montreal, with 4 million people, has 2.5. Vancouver has 1.5 lines – its three SkyTrain mainlines are one-tailed. By the same calculation, Berlin has 6.5 U- and 3 S-Bahn mainlines, and Madrid has 2 Cercanías lines and 7 metro lines. Moreover, high construction costs and political resistance from various GO Transit interests make it difficult for Canadian cities to add more rapid transit.
To the extent Vancouver has a sizable SkyTrain network, it’s that it was able to build elevated and cut-and-cover lines in the past. This is no longer possible for future expansion, except possibly toward Langley. The merchant lawsuits over the Canada Line’s construction impacts have ensured that the Broadway subway will be bored. Furthermore, the region’s politics make it impossible to just build Broadway all the way to the end: Surrey has insisted on some construction within its municipal area, so the region has had to pair half the Broadway subway with a SkyTrain extension to the Langley sprawl.
Put in other words, the growth in Vancouver transit ridership is not so much about building more of a network, but about adding housing and jobs around the network that has been around since the 1980s. The ridership on the Millennium and Canada Lines is growing but remains far below that on the Expo Line. There is potential for further increase in ridership as the neighborhoods along the Canada Line have finally been rezoned, but even that will hit a limit pretty quickly – the Canada Line was built with low capacity, and the Millennium Line doesn’t enter Downtown and will only serve near-Downtown job centers.
Potemkin bus networks
When Jarrett tells American cities to envy Canada, he generally talks about the urban bus networks. Toronto and Vancouver have strong bus grids, with buses coming at worst every 8 minutes during the daytime off-peak. Both cities have grids of major streets, as is normal for so many North American cities, and copying the apparent features of these grids is attractive to American transit managers.
And yet, trying to just set up a bus grid in your average American city yields Potemkin buses. Vancouver and Toronto have bus grids that rely on connections to rapid transit lines. In both cities, transit usage is disproportionately about commutes either to or from a city core defined by a 5 kilometer radius from city hall. Moreover, the growth in public transport commuting in both cities since 1996 has been almost exclusively about such commutes, and not about everywhere-to-everywhere commutes from outside this radius. Within this radius, public transportation is dominated by rail, not buses.
The buses in Toronto and Vancouver have several key roles to play. First, as noted above, they connect to rapid transit nodes or to SeaBus in North Vancouver. Second, they connect to job centers that exist because of rapid transit, for example Metrotown at the eastern end of Vancouver’s 49. And third, there is the sui generis case of UBC. All of these roles create strong ridership, supporting high enough frequency that people make untimed transfers.
But even then, there are problems common to all North American buses. The stop spacing is too tight – 200 meters rather than 400-500, with frequency-splitting rapid buses on a handful of very strong routes like 4th Avenue and Broadway. There is no all-door boarding except on a handful of specially-branded B-line buses. There are no bus lanes.
One American city has similar characteristics to Toronto and Vancouver when it comes to buses: Chicago. Elsewhere, just copying the bus grid of Vancouver will yield nothing, because ultimately nobody is going to connect between two mixed-traffic buses that run every 15 minutes, untimed, if they can afford any better. In Chicago, the situation is different, but what the city most needs is integration between Metra and CTA services, which requires looking at European rather than Canadian models.
Is Canada hopeless?
I don’t know. The meteoric rise in Canadian subway construction costs in the last 15 years has ensured expansion will soon grind to a halt. Much of this rise comes from reforms that the Anglosphere has convinced itself improve outcomes, like design-build and reliance on outside consultants; in that sense, the US hasn’t been copying Canada, but instead Canada has been copying the US and getting American results.
That said, two positive aspects are notable. The first is very high housing and commercial growth in the most desirable cities, if not in their most exclusive neighborhoods. Vancouver probably has another 10-20 years before its developable housing reserves near existing SkyTrain run out and it is forced to figure out how to affordably expand the network. Nowhere in Europe is housing growth as fast as in Metro Vancouver; among the cities for which I have data, only Stockholm comes close, growing at 7-8 net units per 1,000 people annually.
Moreover, with Downtown Vancouver increasingly built out, Vancouver seems to be successfully expanding the CBD outward: Central Broadway already has many jobs and will most likely have further commercial growth as the Millennium Line is extended there. Thus, employers that don’t fit into the Downtown Vancouver peninsula should find a home close enough for SkyTrain, rather than hopping to suburban office parks as in the US. Right now, the central blob of 100 km^2 – a metric I use purely because of limitations on French and Canadian data granularity – has a little more than 30% of area jobs in Vancouver, comparable to Paris, Lyon, New York, Boston, and San Francisco, and ahead of other American cities.
The second aspect is that Canadians are collectively a somewhat more internationally curious nation than Americans. They are more American than European, but the experience of living in a different country from the United States makes it easier for them to absorb foreign knowledge. The reaction to my and Jonathan English’s August article about Canadian costs has been sympathetic, with serious people with some power in Toronto contacting Jonathan to figure out how Canada can improve. The reaction I have received within the United States runs the gamut – some agencies are genuinely helpful and realize that they’ll be better off if we can come up with a recipe for reducing costs, others prefer to obstruct and stonewall.
My perception of Canadian politics is that even right-populists like Doug Ford are more serious about this than most American electeds. In that sense, Ford is much like Boris Johnson, who could move to Massachusetts to be viceroy and far improve governance in both Britain and Massachusetts. My suspicion is that this is linked to Canada’s relatively transit-oriented past and present: broad swaths of the Ontarian middle class ride trains, as is the case in Outer London and the suburbs of Paris. A large bloc of present-day swing voters who use public transport is a good political guarantee of positive attention to public transport in the future. American cities don’t have that – there are no competitive partisan elections anywhere with some semblance of public transportation.
These two points of hope are solid but still run against powerful currents. Toronto really is botching the RER project because of insider obstruction and timidity, and without a strong RER project there is no way to extend public transportation to the suburbs. Vancouver is incapable of concentrating resources where they do the most good. And all Canadian cities have seen an explosion in costs. Canadians increasingly understand the cost problem, but it remains to be seen whether they can fix it.
The Brooklyn Bus Redesign is Out!
Marron just published my and Eric Goldwyn’s Brooklyn bus redesign proposal (with many thanks to Juliet Eldred for doing the graphics and design). The substance isn’t really changed from what we discussed last year. The delay in publication has had a few causes, of which I believe the biggest is that I completely missed that the links to many of the references in the lit review were dead and thus could not be typeset.
Instead of retyping an old blog post, I want to emphasize a few things that have come up in the last year. Some are specific to New York, others more general within the US. The idea of a bus redesign, introduced to the American discourse by Jarrett at the beginning of this decade, has gotten steadily more popular, and New York is beginning its own process, starting with the Bronx; in that context, it’s worthwhile pointing out specifics that Eric and I have learned from the Brooklyn process.
The redesign is a process, not a one-and-done program
Cities change. The point of a bus redesign is to let the bus network reflect the city of today and not that of when bus routes were set, typically when the streetcars were removed in the postwar era. The upshot is that the city can expect to change in the future, which means further bus redesigns may be necessary.
Instead of letting bus networks drift away from serving the city as is and doing a big redesign once in a generation, cities should change buses on an ongoing basis. American transit agencies are learning the principles of bus redesign this decade. They can and should use these principles for forward planning, tweaking bus routes as needed. Any of the following changes can trigger small changes in bus service:
- New development
- Shifts in commuting patterns even without new development
- Changes in traffic patterns
- Changes in the urban rail network
- Long-term changes in driver labor, maintenance, etc.
- Changes in bus technology, such as ride quality, dispatching, or pollution levels
In New York, the biggest ongoing change is probably the urban rail network. There are no subway extensions planned for Brooklyn, but there is expansion of subway accessibility, which changes the optimal bus network since some buses, like the B25 and B63, have no reason to exist if the subway lines they parallel are made accessible. There has been extensive activism about priorities here. To its credit, the MTA is accelerating accessibility retrofits, even though construction costs are extremely high.
New York’s current redesign process is flawed
Eric and I have heard negative feedback from various people involved in the process. Some are planners. One is a community activist, enough of a railfan and busfan not to NIMBY changes for the sake of NIMBYism, but nonetheless disaffected with how the Bronx redesign went.
As far as I can tell, the problem with the current process is that it’s too timid. In the Bronx, this timidity is understandable. The borough’s bus network is mostly good enough. The most important change in the Bronx is to speed up the buses through off-board fare collection, stop consolidation, bus lanes on main streets, and conditional signal priority, and plug the extra speed into higher frequency.
The MTA treats it as part of a separate process – select bus service (“SBS”) – and even though planning these two aspects separately is workable, the MTA does not understand that they are related and that speedups provide crucial resources for higher frequency. The problem here is with operating cost estimation. Like the other American agencies where I’ve asked, the MTA assumes bus costs scale with service-km, and thus higher speeds don’t change frequency. In reality, bus costs, dominated by driver wages, scale with service-hours. Higher speeds can be plugged one-to-one into higher frequency. In Brooklyn, only 30% of the benefits we estimate come from changing the network, and the other 70% come from speeding up the buses.
But Brooklyn is not the Bronx. The Bronx is largely good enough, in ways Brooklyn isn’t. Brooklyn is not terrible, but the bus network has too many circuitous or duplicative routes. Eric and I have consolidated about 530 km of bus route down to 350, without any of the coverage vs. ridership tradeoffs common to areas with less isotropic population density than Brooklyn. The MTA needs to be bolder in Brooklyn, and even bolder than that in Queens, if the redesign is to succeed.
The 14th Street bus lane
Eric and I encountered some political resistance to the idea of mass installation of bus lanes. Local interests listen to people with local connections, who are usually drivers. Transit riders are disproportionately riding to city center jobs, and have citywide rather than local political identities. When I went to an Open New York meeting, people began with a round of introductions in which people say their names and where they live, and the about 20 attendees represented maybe 15 different city neighborhoods. The upshot is that like Open New York’s mission of building more housing, the mission of diverting scarce street space from drivers to bus riders is best done on a citywide rather than street-by-street basis.
There is some hope of such a transformation happening. The bus lane on 14th Street survived a nuisance lawsuit, and ridership rose 17% almost immediately after it opened. The success is stark enough that a citywide increase in installation is plausible. City council speaker Corey Johnson promised to install 48 km of bus lane per year were he to be elected mayor, which is too passive but could do some good on the busiest routes.
Fare Regulations
Public transportation companies may have the ability to raise fares arbitrarily based on market demands, for examples British buses outside London and American freight railroads. Or they may be subject to regulations capping the fare, for example Japanese railroads. Mixed systems exist as well, such as British rail fares. In Britain, the privatized, mostly deregulated approach is so commonly accepted that a Conservative recently called Labour dangerous socialists for proposing municipalizing bus systems, as in such socialist states as the US, Japan, Germany, etc. In reality, in the case of rail specifically (and perhaps buses as well), there’s a theoretical case with some empirical backing for why reasonable fare caps as in Japan can lead to more investment and more capacity, whereas wholly unregulated fares lead to hoarding and capacity cuts to create shortages.
The model
I’m stealing the economic model for this post from Paul Krugman, who used it to explain the California blackouts of 2000-1. The demand curve is inelastic: the demand is 1,000 units at $20/unit, decreasing to 900 units at $1,000/unit, at which point the curve goes flat. The supply curve is a constant $20/unit, but the market is oligopolistic (say, there are very high barriers to entry because building your own power plant is hard), and there are 5 producers, each with 200 units. If the price is regulated at $20/unit, each producer will supply 200 units. If the price is unregulated, then each producer alone gets an incentive to hold back production, since 100*1000 > 200*20, and then production will be curtailed to 900 units.
The model is simplified in a number of ways: real supply curves slope up; the part about demand going flat at 900 units is unrealistic and exists purely to avoid dealing with optimizing where at 800-something units each producer has an incentive to go back to producing more; capacity constraints involve escalating production costs rather than a God-given restriction on the number of suppliers and their capacity. But with all these caveats, it fits markets that have the following characteristics:
- There are steep barriers to entry, for example if large amounts of capital are required to enter (to build a power plant, set up a rail operating company, etc.).
- Demand is highly inelastic.
- Adding new capacity is expensive.
The issue of capacity
In rail, we can start plugging real numbers for both demand elasticity and the cost of new capacity.
In the above model the price elasticity is -0.0244 in the 900-1,000 units range, which is ridiculously inelastic, on purpose so as to highlight how the model works. TCRP Report 95 says the elasticity in a number of large cities studied is about -0.18, and a VTPI review in a mixture of cities and circumstances (peak vs. off-peak, bus vs. rail, etc.) asserts a short-term average of about -0.3. Unregulated fares will lead to supply reductions if the elasticity times the number of producers is more than -1 (or less than 1 if you flip signs); if no producer has <18% of the market, there will be supply restrictions under unregulated fares, just as a monopolist will hold back supply and raise fares if demand is inelastic.
The cost of new capacity of course depends on the line and the characteristics of competition between different railroads. It’s higher in Japan, where separate railroads run their own lines and trains, than in Britain, where different companies franchise to run trains on the same tracks. But even in Britain, getting a franchise requires a commitment to running service for many years. The significance of this is that the long-run public transport ridership elasticity with respect to fare is more elastic (VTPI recommends a range of -0.6 to -0.9), with a few estimates even going below -1.
For the purposes of this section, we do not distinguish capital from operating costs. Thus, the cost of new capacity is not given in units of capital costs, but in units of operating costs: if increasing service by 1% raises operating expenses by 2% counting the extra investment required, then we say the supply elasticity is 2. Note that supply curves slope up so the elasticity is always positive, but the elasticity can be below 1, for example if economies of scale are more important than the need to invest in new capacity.
Set the following variables: u is quantity of service, r is total revenue (thus, fare is r/u), c is total costs. The railroad is assumed profitable, so r > c. We are interested in the change in profit based on quantity of service, i.e.

The important thing to note is that price controls keep dr/du higher in an oligopoly (but not in a competitive environment, like housing – a single landlord can’t meaningfully create a housing shortage). With price controls, we get
whereas without price controls, with elasticity 

And likewise, with supply elasticity 

Note, moreover, that price controls as construed in Japan let operating companies recover profits, letting them raise prices if they invest in more capacity, so that dr/du is actually higher than r/u.
The real world
I do not know to what extent the lack of fare regulation on many British trains contributes to capacity shortages. However, there is some evidence that the same situation is holding back investment in the United States, on Amtrak. Amtrak is a monopolist facing some fare regulations, for example congressional rules limiting the spread between the lowest and highest fares on a given train, but within its ability to set its own capacity in the medium run, it has relatively free hand, and in fact a strong incentive to maximize fares, in order to subsidize money-losing trains outside the Northeast Corridor.
Amtrak generally runs the trains it has on the Northeast Corridor, without explicitly holding back on capacity. However, this is in an environment with very low utilization rates. There are 20 Acela trainsets, but only 16 run in service at a given time, giving them the moniker “hangar queens.” There is no real interest within Amtrak at raising speed just enough to be able to run consistent service intervals, for example hourly with two trainsets coupled to form a 16-car train south of New York. Nor is there any interest in making small investments to permit such long trainsets to run – most Acela stops from New York to the south have platforms long or almost long enough for such trains, but the rest need to be lengthened, within right-of-way so that the cost is positive but low.
In the future, capacity cliffs may prove serious enough to stymie American passenger rail development. Right now the main obstacle are Amtrak itself and obstructive commuter railroads such as Metro-North, but assuming competent, profit-maximizing investment plans, it is not so expensive to invest in capacity and speed so as to permit around 4 long high-speed trains per hour north of New York (or even New Haven) and 6 south of it. But then the next few trains per hour require further bypasses, for example four-tracking most of the Providence Line. High supply elasticity – let’s say around 2 – is plausible. Then eventually a dedicated pathway to intercity trains through New York becomes necessary, raising supply elasticity even higher. In an environment with uncapped, profit-maximizing fares, a rational Amtrak management may well just keep what it has and jack up prices rather than build more capacity.
Urban Freeways and Rapid Transit
A ride-hailing trip today reminded me of something about freeway travel in cities – namely, it is untethered from the surface street network. Oddly enough, for a different reason this is equally true of rapid transit. The commonality to these two ways of travel is that they change the geography of the city, rather than just extending the range of walking along the usual paths as surface arterial streets and surface transit do.
Rapid transit compression
Rapid transit networks compress distances along the lines, and by the same token magnify distances in orthogonal directions. Manhattan is a good example of how this works: north of Midtown the subway only runs north-south, not east-west, so there are separate East Side and West Side cultures. Moreover, as middle-class gentrifiers are displaced by rising rents coming from even richer gentrifiers, they tend to move along subway lines, and thus people from the Upper West Side and Columbia end up in Washington Heights and Inwood.
The contrast here is with surface transit. Bus networks are far too dense to have the same effect. A citywide bus grid would offer 15 km/h transit in all directions in New York, and a tramway grid like what parts of Berlin have (and what big Eastern European cities like Prague and Budapest have) offers 15-20 km/h transit in all directions. It extends walking, in the sense that the most important throughfares probably get their own routes, or if they don’t they are closely parallel with roads with surface transit.
This is not how rapid transit works. A handful of very strong orthogonal routes can and should get rapid transit, hence the Ringbahn, M2/M6 in Paris, and the under-construction M15 – and by the same token, 125th Street in New York should get a subway extension off of Second Avenue. But that still leaves the city with a wealth of major routes that have no reason to get rapid transit, ever. Most of these are crosstown routes, for example the east-west streets of Manhattan, but in less gridded cities they can just be major streets that don’t quite fit into a regionwide radial metro network.
Rapid transit spikiness
I get a lot of pushback when I talk about this, but rapid transit encourages spiky density. This does not mean that every transit city is spiky and every spiky city is a transit city. Density in Paris within the city is fairly uniform, aided by zoning rules that prohibit high-rises even though many could succeed commercially on top of Métro transfer points or RER stations. In the other direction, some American auto-oriented cities have spiky density near transit, like San Diego’s Mission Valley or Atlanta’s Buckhead, but it’s not big enough a development to permit people to comfortably walk and take transit to all destinations.
Nonetheless, for the most part, rapid transit tends to be associated with spiky development forms, especially if it’s been built more recently and if the interstation is long (as in Vancouver, Singapore, Hong Kong, or Stockholm). This isn’t really how a pedestrian city works: pedestrians have no need for spikiness because they don’t have particular distinguished stations – at most, the corner nodes are distinguished, but that includes all corners, which are placed at far shorter intervals than subway stops.
Freeways as street bypasses
Surface transit promotes urban forms that look like an extended pedestrian city. This is equally true of surface roads designed around car access. The car was originally not supposed to take over the entire city, but merely provide convenient intra-urban transportation at a faster speed than walking. It was originally just a faster, more private, more segregated streetcar. The effect on urbanism was to reduce overall density (as did the streetcars and rapid transit in New York, which used to have inhuman overcrowding levels on the Lower East Side), but not to change the urban form beyond that.
Freeways, like rapid transit, are completely different. This does not mean that they change the city in the same way as rapid transit, just that both operate independently of the usual street grid. Freeways, like rapid transit, compress travel distances along the freeway, and simultaneously lengthen them in all other directions because of the effect of traffic congestion.
Moreover, freeways are different from rapid transit in typical alignments. They are far more land-intensive, which is why they tend to be placed in formerly marginal parts of the city. This can include the waterfront if it is originally industrial and low-value, as it was in midcentury America, rather than a place of high-end residential consumption because of the views.
Interface with the street
How does a surface street transit network interface with either rapid transit or freeways?
With rapid transit, the answer is that surface transit is slow, so it should feed rapid transit using transfers, which may be timed if the trains are not so frequent (say, 15 minutes or worse, as is common on suburban rail branches). Rapid transit should then be constructed to connect with surface transit this way, that is the stations should be at intersections with arterial corridors for bus connections.
With freeways, the answer is that often interface is impossible. San Diego provides a convenient example: there is an arterial road that’s great for buses running northward from city center toward the beachfront neighborhood of Pacific Beach. But there’s also a parallel freeway inland, so drivers mostly use the freeway, and commerce on the north-south arterial is neglected. In contrast, the main east-west arterials feeding the freeway are bustling, and one of them has of the city’s strongest buses. Buses can make stops on these arterials and then express to city center on the freeway, but on the freeway itself the buses are not very efficient since there’s minimal turnover, and chaining a few neighborhoods together on one frequent route is usually not possible.
When Reliability Matters Above All Else
This post is about situations in which the most important thing for transportation is reliability, more so than average speed or convenience. It’s inspired by two observations, separated by a number of years: one is my own about flying into or out of Boston, the other is from a New York Times article from yesterday describing a working-class subway rider’s experience.
My observation is that over the years, I’ve used Logan Airport a number of times, sometimes choosing to connect via public transportation, which always involves a bus as the airport is not on the rail network, and other times via taxi or pickup. My choice was always influenced by idiosyncratic factors – for example, which Boston subway line my destination is on, or whether I was visiting someone with a car and free time. However, over the last eight years, a consistent trend is that I am much more likely to use the bus arriving at the airport to the city than departing. I know my own reasoning for this: the bus between South Station and the airport is less reliable than a cab, so when in a crunch, I would take a train to South Station (often from Providence) and then hail a taxi to the airport.
The New York Times article is about a work commute, leading with the following story:
Maribel Burgos barely has time to change into her uniform before she has to clock in at the McDonald’s in Lower Manhattan where she works, even though she gives herself 90 minutes to commute from her home in East Harlem.
It does not take 90 minutes to get between East Harlem and Lower Manhattan on the subway. The subway takes around half an hour between 125th Street and Bowling Green, and passengers getting on at one of the local stations farther south can expect only a few minutes longer to commute with a cross-platform change at Grand Central. Taking walking and waiting time into account, the worst case is around an hour – on average. But the subway is not particularly reliable, and people who work somewhere where being five minutes late is a firing offense have to take generous margins of error.
When is reliability the most important?
What examples can we think of in which being late even by a little bit is unacceptable? Let us list some, starting with the two motivating examples above:
- Trips to the airport
- Work trips for highly regimented shift work
- Trips to school or to an external exam
- Work trips for safety-critical work such as surgery
- Trips to an intercity train station
In some of these cases, typically when the riders are of presumed higher social class, the system itself encourages flexibility by arranging matters so that a short delay is not catastrophic. At the airport, this involves recommendations for very early arrival, which seasoned travelers know how to ignore. At external exams, there are prior instructions of how to fill in test forms, de facto creating a margin of tolerance; schools generally do not do this and do mark down students who show up late. Doctors as far as I understand have shifts that do not begin immediately with a life-critical surgery.
But with that aside, we can come up with the following commonalities to these kinds of trips:
- They are trips to a destination, not back home from it
- They are trips to a fairly centralized and often relatively transit-oriented destination, such as a big workplace, with the exception of regimented shift work for retail (the original NY Times example), which pays so little nobody can afford to drive
- They are disproportionately not peak trips, either because they are not work trips at all, or because they are work trips for work that is explicitly not 9-to-5 office work
- They are disproportionately not CBD-bound trips
The first point means that it’s easy to miss this effect in mode choice, because people can definitely split choice between taxis and transit or between different transit modes, but usually not between cars and transit. The second means that driving is itself often unreliable, except for people who cannot afford to drive. The third means that these trips occur at a point in time in which frequency may not be very high, and the fourth means that these trips usually require transfers.
What does reliability mean?
Reliability overall means having low variance in door-to-door trip time. But for the purposes of this discussion, I want to stress again that trips to destinations that require unusual punctuality are likely to occur outside rush hour. Alas, “outside rush hour” does not mean low traffic, because midday and evening traffic in big cities is still quite bad – to take one New York example with shared lanes, the B35 steadily slows down in the first half of the day even after the morning peak is over and only speeds up to the 6 am timetable past 7 pm. Thus, there are twin problems: frequency, and traffic.
Traffic means the vagaries of surface traffic. Buses are generally inappropriate for travel that requires any measure of reliability, or else passengers have to use a large cushion. Everything about the mixed traffic bus is unreliable, from surface traffic to wait times, and bunching is endemic. Dedicated lanes improve things, but not by enough, and unreliable frequency remains a problem even on mostly segregated buses like the Silver Line to the airport in Boston.
Frequency is the harsher problem. The worker commuting from Harlem to Lower Manhattan is if anything lucky to have a straight-short one-seat ride on the 4 and 5 trains; most people who need to be on time or else are not traveling to city center and thus have to transfer. The value of an untimed transfer increases with frequency, and if every leg of the trip has routine 10-minute waits due to bunching or just low off-peak frequency guidelines, the trip gets intolerable, fast.
What’s the solution?
Bus redesigns are a big topic in the US right now, often pushed by Jarrett Walker; the latest news from Indianapolis is a resounding success, boasting 30% increase in ridership as a result of a redesign as well as other changes, including a rapid bus line. However, they only affect the issue of reliability on the margins, because they are not about reliability, but about making base frequency slightly better. New York is replete with buses and trains that run every 10-15 minutes all day, but with transfers, this is not enough. Remember that people who absolutely cannot be late need to assume they will just miss every vehicle on the trip, and maybe even wait a few minutes longer than the maximum advertised headway because of bunching.
Thus, improving reliability means a wider toolkit, including all of the following features:
- No shared lanes in busy areas, ever – keep the mixed traffic to low-traffic extremities of the city, like Manhattan Beach.
- Traffic signals should be designed to minimize bus travel time variance through conditional signal priority, focusing on speeding up buses that are running slow; in combination with the above point, the idea of giving a late bus with 40 passengers the same priority at an intersection as a single-occupant car should go the way of the dodo and divine rights of kings.
- Off-peak frequency on buses and trains needs to be in the 5-8 minute range at worst.
- Cross-platform transfers on the subway need to be timed at key transfer points, as Berlin manages routinely at Mehringdamm when it’s late and trains run every 10 minutes (not so much when they run every 5); in New York it should be a priority to deinterline and schedule a 4-way timed pulse at 53rd/7th.
- Branch scheduling should be designed around regular gaps, rather than crowding guidelines – variation between 100% and 130% of seats occupied is less important to the worker who will be fired if late than variation between waiting 4 and waiting 8 minutes for a train.
- Suburban transit should run on regular clockface schedules every 30, 20, or 15 minutes, with all transfers timed, including with fare-integrated commuter trains.
New York City Zoning and Subway Capacity
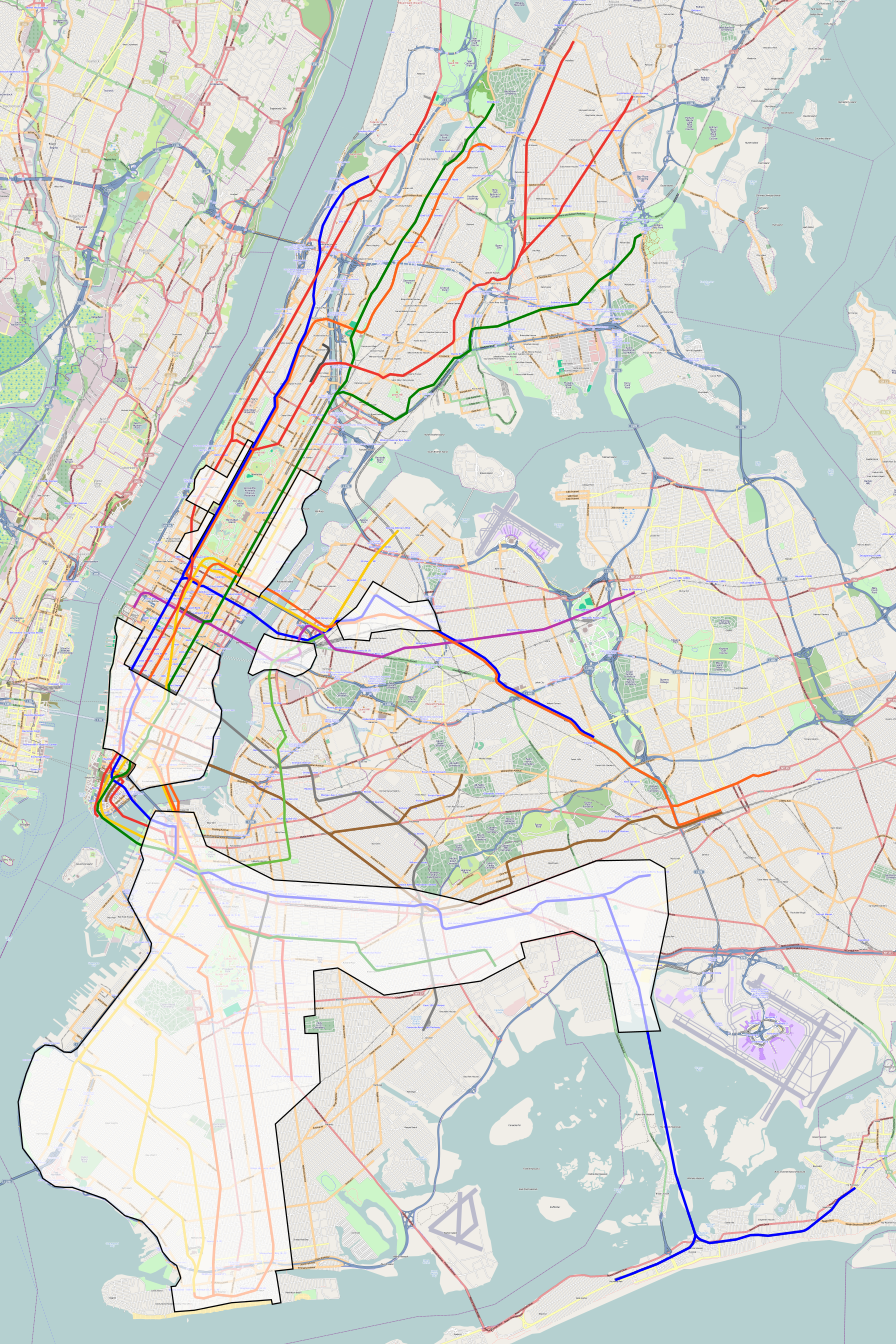
I got a bunch of accolades and a bunch of flaming replies over a tweetstorm imagining a bigger, better New York. Some people complained about my claim that subway trains in Brooklyn are underfull; I urge everyone to read my analysis of data from 2016 – it’s still relevant today, as the only big change is that Second Avenue Subway has reduced Upper East Side crowding. The point of this post is to demonstrate where zoning should definitely focus on adding more apartments, to fill trains that are not yet full.
The map
Instead of using the current subway map, let us start with a deinterlined map:

The reason for using this map is that it’s cleaner than the real map, since there is no track-sharing between routes of different colors, and not much route-sharing (one color local, one express). Getting from here to this map is cheap but not free, as it requires certain junction rebuilds, especially on the 2/3. I ask that my commenters resist the temptation to argue over the details of this map, since the point about zoned capacity does not really depend on questions like whether the E runs local in Queens and the F runs express or the reverse.
Where there is capacity
In 2016, three directions on the subway were truly at capacity, surpassing 4 standees per square meter: the 2/3 and 4/5 coming into Midtown from Uptown, and the L. The analysis looks at crowding on trains entering the Manhattan core, so it lumps lines from Queens based on which tunnel they enter from, which underestimates crowding on the E, since it shares tracks with the under-capacity M. Counted properly, the express Queens Boulevard trains should be viewed as near or at capacity as well, the F having 3.33 standees per square meter and the E having somewhat more.
Additional lines with capacity crunches, with about 3 standees per square meter or more, include the A/D coming in from Uptown, the 6, and the Astoria Line (then the N/Q, now the N/W). The 1 and 7 trains have capacity crunches as well in outlying areas: the 7 is overcrowded until it hits the transfer points to the E/F and N/W but has plenty of space in Long Island City, and the 1 is fairly crowded north of the junction with the express trains and then unloads passengers onto the overcrowded 2/3. These areas should not be deemed to have much spare capacity until such time as operations on the subway improve, permitting higher frequency and eventually more lines.
In contrast, the remaining lines have space, often plenty of space. Everything in Brooklyn except the L and to some extent the J/M/Z is underfull: these trains have high frequency as determined by crowding guidelines at the Uptown or Queens end, but in Brooklyn there are fewer people today so the ridership is weaker. The local lines on the Upper West Side both have plenty of space on the trains as well as space on the tracks for more trains if need be. The 7 downstream of Queensboro Plaza has plenty of space, and the local Queens Boulevard trains downstream of Jackson Heights have nowhere for passengers to transfer to an overcrowded express service.
Since I’m relying on data from 2016, there’s no accounting for Second Avenue Subway. Even then, the 4/5 was only the third most overcrowded trunk line entering the Manhattan core, and it’s likely that there’s additional capacity coming from the new line. There’s certainly space on the tracks for more trains on Second Avenue, and one of the goals of deinterlining specifically is to make it feasible to run more service on this line, which currently only runs a train every 6-8 minutes at rush hour.
The map of where New York could add housing
The map excludes parts of Lower and Midtown Manhattan where the highest and best use is commercial rather than residential. But the boundaries there are deliberately crude: Downtown Brooklyn, NYU, and the Meatpacking District are drawn, to avoid excessive fragmentation of the drawn area, while Chelsea and Hell’s Kitchen are excluded as too close to Midtown.
The map also does not look at considerations other than capacity. Some of the highlit areas on the Upper East and West Sides and Lower East Side are already built to very high density, at least on the avenues and major streets; these areas should be the template of how the rest of the city should look. At the other end, East New York has too weak demand for massive construction, especially if everything to its west is upzoned.
However, large swaths of desirable, close-in areas with relatively short buildings are highlit. Rich inner Brooklyn neighborhoods like Park Slope and South Brooklyn are currently built to missing middle density, with a floor area ratio of about 1.5 away from corner lots. A more appropriate floor area ratio in these neighborhoods is 12, corresponding to tapering buildings in the 20-30 story range, as on the avenues on the Upper East and West Sides. Park Slope is half an hour from Midtown by subway, and less than that from Lower Manhattan. The population of these neighborhoods is perhaps 150,000, and should be more than a million given their proximity to job centers.
Subway deserts and future additions
The map is designed to work with more or less the same service as today, maybe with slightly more frequency on lines that could handle it easily (that is, Second Avenue Subway). But what about future service? The L train is overcrowded, but only runs 19 trains per hour at the peak due to electrical limitations, and could go up to 26 with better electrical capacity, or for that matter lighter trains drawing less power during acceleration. Further extensions of Second Avenue Subway could more effectively relieve pressure off the 4/5, to the point of creating more capacity in the Bronx, which remains well below peak population. Commuter rail modernization opens up large swaths of Queens. Decades in the making extensions on Nostrand and Utica fill in the transit desert in southeast Brooklyn, currently served by buses that nominally come every 2 minutes and in practice comes in platoons of 4 every 8 minutes.
As with the map above, a hypothetical map of development sites assuming reasonable subway expansion includes areas that would be unlikely to actually see new development. Williamsburg and Greenpoint may turn into forests of towers given the opportunity, but in neighborhoods like Sheepshead Bay and East Flatbush developers might well stick to the occasional 6-to-10-story mid-rise building that would not look out of place in Paris. In Eastern Queens, the desired density is probably spiky, with clusters of tall buildings around LIRR stations surrounded by single-family houses and missing middle, much like the structure of density in Toronto and Vancouver.
The Hazards of Federal Subsidies for Operations
There’s an interesting discussion on Twitter, courtesy of Adam Batlan, about federal subsidies for capital funding versus operations. It’s become a popular reform proposal among American public transport advocates, who are frustrated with the status quo of federal funding for capital but not for operations. Unfortunately, the proposed change to the status quo – federal funding of operations and maintenance – is even worse than the status quo. The hazards of outside funding sources for operations are considerable and unavoidable, whereas those of outside funding for capital expansion can be mitigated by defining expansion appropriately, to the exclusion of ongoing maintenance.
Why federal funding should only go to expansion
Public transportation has ongoing operating expenses, and capital funding. Ongoing expenses can only change gradually – rail service in particular is dominated by fixed costs, like maintenance, and service changes have little effect on operating costs. This argues in favor of steady funding for operations.
Can federal funding be this steady? The answer is no. The federal government is where politics is. People with serious differences in opinion over issues including the overall size of federal spending, spending priorities, and how sensitive spending should be to economic conditions contest elections, and if one side has a majority, that side will get its legislative way. Nor is this some artifact of two-party majoritarianism. In consensus democracies the salience of a majority is if anything higher – there are big differences in policy, including transportation policy, between the various parties of Switzerland or the Netherlands, as the parties have to deliver results to attract voters rather than relying on polarization and partisan identity.
This kind of politics is very good when it comes to debating one-time capital projects. A center-right government committed to austerity with little attention to climate change, for example Germany since 2005, will not spend much money on rail expansion, and railroads will formulate their plans accordingly. The key here is that planning around maintaining current operations without expansion is not difficult, whereas planning around sudden cuts in operating funding is.
The issue of ongoing capital expenses
Current US policy is for the federal government to fund capital expenses, but not necessarily expansion. Normal replacement of equipment and long-term maintenance both receive federal funding. This is bad policy, because the way agencies respond to changes in funding levels is to defer maintenance when the federal government is stingy and then cry poverty when the federal government is generous.
The most extreme case of this is the state of good repair (SOGR) scam. The origins of SOGR are honest: New York City Transit deferred maintenance for decades, until the system collapsed in the 1970s, leading to a shift in priorities away from expansion and toward SOGR in the 1980s and 90s. There were tangible improvements in the last era, raising the mean distance between failures on the subway from about 10,000 km in 1980 to 250,000 in the 2000s. But this process led to a trend in which agencies would deliberately defer maintenance, knowing they could ask for SOGR funding letting them spend money without having anything to show for it.
By the 21st century, New York’s SOGR program turned into such a scam. The MTA capital plans keep having line items for achieving SOGR, but there are no improvements, nor does the backlog appear to shrink. If anything, throughout the 2010s service deteriorated due to slowdowns, until Andy Byford began the Saving Precious Seconds campaign. The same scam appears elsewhere, too: Amtrak deferred maintenance in the 2000s under political pressure to look profitable for privatization, a Bush administration priority, and when Obama was elected and announced the stimulus, Bush-installed CEO Joe Boardman began to talk about SOGR on the Northeast Corridor as a way of hogging billions of dollars without having to show increases in speed.
The forward solution to this problem is to credibly commit not to fund maintenance, ever. The fix-it-first maxim is for local governments only. The maxim for outside funding should be that any request for funding for maintenance or replacement is a tacit admission the agency cannot govern itself and requires an outside takeover as well.
The issue of frequency
The problem the thread linked to at the beginning of this post sets to solve is that some cities get money to build a light rail line but then only run it every 20 minutes. This, however, is a problem of incompetence rather than one inherent to the incentives.
A long-term revenue-maximizing agency, confronted with an urban rail line that runs every 20 minutes, will increase its frequency to at worst every 10 minutes, secure in the knowledge that the long run elasticity of ridership with respect to frequency in this range is high enough that it will make more money this way. This remains true even for a dishonest agency, which has no trouble maximizing long-term revenue by deferring maintenance and then asking for SOGR money when funding is available.
This fact regarding frequency is doubly true if the trains already run frequently at rush hour and only drop to 20-minute frequency off-peak. Fleet costs are determined by the peak, and large peak-to-base service ratios require expensive split shifts for crews. Therefore, a bump in off-peak frequency, especially from such a low base as 20 minutes, will increase ridership for very little increase in operating cost.
The thread does not mention the issue of connecting bus service much – I got yelled at for proposing half-hourly local buses timed with commuter trains – but there, too, the rule of only subsidizing expansion rather than maintenance or operation leads to good enough incentives. In Seattle, light rail expansion has led to bus service changes designed to feed the trains, increasing bus ridership even as rail service replaces the most crowded corridors.
The bus cuts of (for example) San Mateo County in response to rail expansion should then be put in the same basket of pure incompetence with the light rail line that runs every 20 minutes off-peak. The incentives line up in one direction, but due to such factors as unfamiliarity with best practices and managers who do not ride the trains they run, management goes in the other direction.
The forward solution here is to stick to funding by expected ridership. If the service plan involves low frequency, this should show up in the ridership screen and penalize the project in question, while urban rail lines that run every 5 minutes get funded.
Paint the Trains in Themes
Most urban rail networks in the world use color to distinguish lines, either alone or in combination with line names or numbers. Moreover, most of these networks have different train fleets for different metro lines – for examples, the trains on the Northern line are used only on the Northern line, and the trains on Paris Metro Line 1 are used only on Line 1. The interiors of these trains have static line maps dedicated to the lines they serve. Occasionally, the trains are also painted in their thematic colors, as in Boston. So, why not extend this and not only paint trains in their thematic colors, but also have different art on each trainset, using the thematic color?
A blue line, like the Piccadilly line or the RER B, would use drawings that incorporate the color blue in some essential way. For example, one trainset could depict an endless ocean, one could depict the sky, one could depict glass-clad skyscrapers that appear blue, and so on.
Recognizability
The key here is to make each trainset visually distinct and recognizable. Part of the reason is pure art: it introduces more interesting variability to a mundane activity, serving the same purpose as street sculptures. This exists in Japan to some extent, with public mascots and Hello Kitty trainsets, but this could generalize to every trainset. In a large city, this would require finding several dozen different paint schemes per color, ideally each by a different artist using a variety of styles.
But there’s another reason for this scheme: it makes it easier for passengers to remember which train they were on if they lost something or wish to report a crime. Right now, trains are tracked by model number, which passengers have no reason to remember after getting off the train. In contrast, a heraldic system is easier for passengers to retain, especially if the art covers both the exterior and the interior of the vehicle.
For the latter reason, it’s fine to be repetitive and paint every car in a trainset with the same scheme: passengers can roughly remember if they were near the front or back of the train, so if they lost something on the train, they can give enough information to reduce the search space to maybe two cars. Trainsets on modern urban rail systems are almost always permanently coupled, often in open gangways – even New York permanently couples cars into half-trains and joins two sets at a time to form a train, making it feasible to associate paint schemes with entire sets rather than individual cars.
Culture
The choice of art should rely on local history, geography, mythology, and culture whenever possible. For example, in the Eastern United States, one red trainset could depict brilliant fall foliage, but in Europe, trees do not turn red in the autumn so the reference would not be easily understood. In Japan, trees turn red in the spring and not the fall, so a red trainset could be painted with the cherry blossom. While Paris does not associate red with the color of leaves in any season, it was historically a center for impressionist art, so one blue trainset could have an impressionistic painting of foliage depicting it in blue.
Iconic food may be another intensely local element to paint in some cities. Everyone in New York knows what a bagel, a New York-style pizza, and a hero sandwich are, and New Yorkers of all ethnic and social groups eat them. At the deli, the professor and the security guard may well order the same pastrami hero. The same is true of döner and currywurst in Berlin, and bento boxes and yakitori in Tokyo.
Mythology and history add more recognizable symbols that are specific to the region or country. London and Paris may each find famous battles to commemorate, just as London names one of its intercity train stations after Waterloo and Paris names one of its after Austerlitz. An American city, especially Washington, may depict Union troops in the Civil War or the raising of the flag at Iwo Jima. Every major city can find an episode of its labor history to paint on one of its trainsets, in red of course. Mythology can add recognizable elements, such as fire-breathing dragons in red, Poseidon in blue, and pots of gold in yellow. Those elements would naturally look differently in a non-Western city like Tel Aviv or Singapore, but the principle is the same.
Diverse cities especially benefit from being able to depict their various cultural backgrounds, making different trainsets more visually distinct. Paris can paint some of its green and black trains with Arabic calligraphy, New York and Chicago can depict black Union troops with blue uniforms, Washington can depict the March on Washington with a blue sky or green lawn background, London can depict the Windrush and lotus art and Muslim South Asian architecture. These cities are all predominantly Western, but have large and growing minorities from non-Western backgrounds or from backgrounds with different takes on Western cultural production (such as black and Hispanic Americans), and should reflect the majority culture as well as the minorities, treating the transit network as a microcosm of the entire population.
Commercial culture and advertising
The plan should be to keep each design for a long time, potentially the entire life of the trainset, or at least through a midlife refurbishment. History, mythology, and geography all provide themes that are sufficiently long-run to remain relevant over the long life of a train.
In some cases, commercial properties can both be expected to exist for a long time and have well-known thematic colors. Examples include Star Wars and the iconic light saber colors, the best-known Pokemon, Hello Kitty, many superheroes, and the Smurfs. Transit agencies could enter long-term advertising contracts with Disney, Nintendo, and other long-lived corporations producing popular culture, and paint their properties on trainsets.
Advertising on the subway has a long history, and can coexist with painting the train if the regular ads are contained to the usual posters. It’s already spilling into painting an entire train: the Hello Kitty train is one example, but negative examples exist as well, when New York wraps an entire subway trainset in an ad for a television show that will be forgotten in a few years.
This kind of long-term advertising, in contrast, reinforces the recognizability of individual trainsets as no two trainsets should ever be painted with the same property (though trains of different colors may be painted with different Pokemon, or one with Jedi and one with Sith, etc.). Moreover, the paint scheme should be stable over 20 years – temporary modifications to help advertise a new film, video game, TV series, or book in the franchise should cost extra, and potentially be treated as regular ad posters.
However, there should be a limit to commercialization: the majority of subway paint schemes should not be based on global brands, but on local factors. Pokemon is everywhere, but the cherry blossom, recognizable skylines, picturesque mountains, and historical battles are specific to a country or region.
Conclusion
Just as cities often have art exhibits at subway stations, and just as they sometimes paint the trains on each color line with the color it’s named after, subway and regional rail networks can paint trains individually in thematic colors. In the largest cities, like New York and London, this could well involve more than a thousand distinct paint schemes; this is fine – those cities have enough artists and enough inspiration for a thousand trainsets.
Overall, the combination of some commercial properties with various aspects of history, geography, tourism, food, and mythology, curated from the majority group as well as from various ethnic and religious minorities, is exactly the mosaic that makes the city’s culture. One of the two prime reasons to do this is as a tool to help passengers remember what train they were on. But the other one is art, which simultaneously is aesthetic and sends a message: on the train we are all New Yorkers, or Londoners, or Parisians, or Berliners.
New York Rolling Stock Costs are Skyrocketing
The Metropolitan Transportation Authority has just released its capital plan for 2020-4. The cost is very high and the benefits substantial but limited, and I urge people to look over criticism by Henry Grabar at Slate about elevators and Ben Kabak’s overview at Second Avenue Sagas. Here I am going to focus on one worrying element: the cost of the trains themselves, on both the subway and commuter rail.
I started comparing subway construction costs nearly ten years ago. Here’s an early post on Second Avenue Sagas, hoisting something I wrote in comments. Over here I started writing about this in 2011. Early on, I was asked about the costs of the trains themselves rather than the tunnels, and said that no, there’s no New York premium there. At the time the most recent rolling stock order for the subway was the R160, for which the base order cost was $1.25 billion for 620 cars (source, PDF-p. 34), or about $110,000 per meter of length. Commuter rail was similar, about $2 million per 25-meter-long M7 in the early 2000s and $760 million for 300 M8s of the same length in the mid-2000s. London’s then-current order, the S Stock, cost £1.5 billion for 191 trains and 1,395 cars, around $90,000 per meter of length for narrower trains; Paris’s MP 05, a driverless rubber-tired train, cost €474 million for 49 trainsets, around $140,000 per meter.
But since then, costs have rapidly risen. The gap is still far smaller than that for infrastructure, which New York builds for an order of magnitude higher cost than the rest-of-world median. But it’s no longer a rounding error. Subway rolling stock costs are rising, and commuter rail rolling stock are rising even faster. The latest subway order, the R211, costs $1.45 billion for 535 cars, or $150,000 per meter, for the base order, and $3.69 billion for 1,612 cars, or $130,000 per meter, including options. Commuter rail equipment costs, once about $100,000 per meter of train length, inched up to $2.7 million per car in 2013, or $110,000 per meter, and then rose to $150,000 per meter for the M9 order.
Construction costs: subway trains
The 2020-4 capital plan has showcased even further rolling stock cost escalation. Go to the link for the MTA capital plan again. On PDF-p. 23 there’s a breakdown of different items on the subway, and rolling stock is $6.057 billion for a total of 1,977 cars, of which 900 are 15 meters long and the rest (I believe) 18, for a total of $185,000 per linear meter.
I’ve blogged before about comparative costs of light rail and regional rail rolling stock. In Europe, both still cluster around $100,000 per linear meter for single-level, non-high-speed equipment. There is no apparent premium over early- and mid-2000s cost even without adjusting for inflation, which is not surprising, as the real prices of manufactured goods tend to fall over time. But what about metros? Here, too, we can look at first-world world comparisons.
In London, a recent Piccadilly line order is, in exchange rate terms, $190,000/meter (the trains are 103 m long) – but it includes 40 years of maintenance and spare parts. In Singapore, a recent order is S$2.1 million per car, which is about $70,000 per meter in exchange rate terms. Grand Paris Express’s first tranche of orders costs €1.3 billion for 183 trains totaling 948 cars, each (I believe) 15 meters long, around $120,000 per meter. Metro Report states Busan’s recent order as ₩55.6 billion for 48 trainsets (replacing 140-meter long trains), which is almost certainly an error; assuming the actual cost is ₩556 billion, this is $70,000/meter in exchange rate terms and $90,000/meter in PPP terms (PPP is relevant as this is an entirely domestic order).
In Berlin, the situation is the diciest, with the highest costs outside New York (not counting London’s maintenance-heavy contracts). An emergency order of 20 52-meter trains, tendered because cracks were discovered in the existing trains, cost €120 million, around $150,000 per linear meter. A longer-term contract to supply 1,500 cars (some 13 meters long, most 16.5 meters long) for €3 billion by 2035 is on hold due to litigation: Siemens had already sued over the emergency order of Stadler cars, but now Alstom made its own challenge. But even here, costs are well below the levels of New York, even before we adjust for inflation since Berlin’s future contract is in 2020-35 prices and New York’s is in in 2020-24 prices.
Construction costs: New York-area commuter rail
Commuter rail is faring even worse. On PDF-p. 27 the LIRR is listed as spending $242 million on 17 coaches and 12 locomotives, and on PDF-p. 29 Metro-North is listed as spending $853 million on 80 EMU cars and 30 locomotives.
Figuring out exact comparisons is not easy, because locomotives do cost more than multiple-units and unpowered coaches, and there is a range of locomotive costs, with uncertainty due to currency conversions, as most information I can find about European locomotives is in Eastern Europe with its weak currencies, since Western Europe mostly uses multiple-units. Railway Gazette’s pages on the world rolling stock market suggest that a European locomotive is around €5 million (e.g. the PKP Vectron order), or $6.5 million; PKP’s domestic order (including some dual-modes) is around $4.2 million per unit measured in exchange rate terms, but twice as much in PPP terms; Bombardier has a sale to an undisclosed customer for about $4.8 million. Siemens claims the Vectron costs €2.5 million per unit, although all the contracts for which I can find prices are substantially more expensive.
For what it’s worth, in the US dual-mode locomotives for New Jersey Transit cost around $9.5 million apiece, which is still evidently lower than what the LIRR and Metro-North plan on spending. 242 – 9.5*12 = 128, and 128/17 = 7.5, or $300,000 per linear meter of unpowered coach; similarly, 853 – 9.5*30 = 568, and 568/80 = 7.1, or $280,000 per linear meter of new Metro-North EMU. If we take the normal-world cost of a locomotive at $6 million and that of an EMU or coach at $2.5 million per US-length car, then the LIRR has a factor-of-2.1 cost premium and Metro-North a factor-of-2.2 premium.
The equipment is conservative
The FRA recently realigned its regulations to permit lightly-modified European mainline trains to run on American tracks. Nonetheless, no American commuter rail operator has taken advantage of the new rules – the only ones buying European equipment had plans to do so even before the revision, going through costly waiver process that increased costs. At a public meeting last month, Metro-North’s vice president of engineering did not even know FRA rules had changed. The LIRR and Metro-North are buying the same equipment, to the same standards, as they have for decades.
The subway, likewise, is conservative. It is a laggard in adopting open gangways: the R211 order is the first one to include any, but that is just two test trainsets, the rest having doors between cars like all other older New York trainsets. It is not buying any of the modular products of the global vendors, like Bombardier’s Movia platform or the Alstom Metropolis. It is buying largely the same kind of equipment it has bought since the 1990s.
Despite this conservatism, costs are very high, consistent with a factor somewhat higher than 2 on commuter rail and somewhat lower than 2 on the subway.
But perhaps the conservatism is what increases costs in the first place? Perhaps the reason costs are high is that the world market has moved on and the MTA and some other American operators have not noticed. In Chicago, Metra found itself trying to order a type of gallery car that nobody makes any longer, using parts that are no longer available. Perhaps the same kind of outmoded thinking is present at the MTA, and this is why costs have exploded in the last 10 years.
A secular increase in costs of infrastructure construction is nearly universal. No such trend can be seen in rolling stock: nominal costs in Paris are 15% lower than they were 15 years ago, and real costs are about 30% lower, whereas in New York nominal costs are 70% higher than 10 years ago and real costs about 40% higher. Paris keeps innovating – M1 and M14 have the highest frequency of any metro system in the world, a train every 85 seconds at the peak, and M1 is the first driverless line converted from earlier manual operations rather than built from scratch. In contrast, New York is stuck in the 1990s, but far from keeping a lid on costs, it has seen rolling stock cost explosion.
Update 9/24: I just saw a new commuter rail coach order in Boston. These are bilevels so some cost premium is to be expected, but $345 million for 80 unpowered coaches, or $170,000 per meter, is excessive, and TransitMatters tried hard to fight against this order, arguing in favor of EMUs on the already-electrified Providence Line.
Cars-and-Trains Urbanism
For all of the rhetoric about banning cars and the inherent conflict between public transportation and private automobiles, the dominant political view of urbanism in large chunks of the world is the cars-and-trains approach. Under this approach, cities build extensive infrastructure for cars, such as parking, wide arterials, and some motorways, as well as for trains, which are as a rule always rapid transit, never streetcars. In the midcentury developed world this was the unanimous view of urban development, and this remains the preference of mainline center-right parties like CDU, the French Republicans, and the British and Canadian Tories; various 1960s urbanist movements with roots in the New Left arose in specific opposition to much of that mentality, which is why those movements are usually NIMBY in general.
In the post-consensus environment of political conflict in most issues, in this case between auto- and transit-oriented urbanism, it’s tempting to go back to the midcentury elite consensus as a compromise, and call for making cities friendly to both transit users and drivers. This is attractive especially to people who hope to defuse culture war issues, either because they identify as political moderates or because they identify as socialists and have some nostalgia for the Old Left. However, this kind of urbanism does not really work. While a destination can sometimes be friendly to both drivers and transit users, the city overall cannot be; the majority of the points of interest in a successful transit city are hostile to cars and vice versa.
Moreover, this cars-and-transit failure is not just historical. It keeps going on today. Middle-income countries waste vast sums of money on building two separate transportation networks that do not work well together. The United States, too, has adopted this mentality in the cities that are building new light rail lines, resulting in large urban rail systems whose ridership is a rounding error since most of the city isn’t oriented around public transportation.
What is cars-and-trains urbanism?
Postwar West Germany built a number of subway networks in its large cities, such as Munich, Frankfurt, Cologne, Dortmund, Essen, and Hanover. With the exception of Munich and Nuremberg, these are subway-surface systems, in which the trains are underground in city center but run in streetcar mode farther out. For the most part, these systems were built with the support of the driver lobby, which wanted the streetcars out of city center in order to be able to drive more easily, and once those systems opened, the cities dismantled the streetcars. Most of West Germany thus eliminated the streetcars that did not feed into the tunnels, just as the US eliminated nearly all of its streetcars except the ones that were part of a subway-surface system in Boston, Philadelphia, and San Francisco.
In the United States, such development only happened in San Francisco, where Muni buried the main streetcar trunk in conjunction with the construction of BART along the same alignment on Market Street. More commonly, cars-and-trains urbanism led to the development of park-and-rides in the suburbs. An early example is the Green Line D branch in Boston, designed for suburban commuters rather than urban residents using the line for all purposes and not just work. Subsequently, light rail lines have been built with park-and-rides, as have full rapid transit systems in the suburb of Atlanta, Washington, and San Francisco. In the same period, American mainline rail networks evolved to be car-oriented, replacing city center stations with park-and-rides for commuter as well as intercity rail uses.
American cars-and-trains development was not without conflict. The auto lobby opposed trains, believing buses were cheaper; top civil servants in what is now the Federal Highway Administration advocated for bus lanes to create more capacity at the peak into city centers such as Washington’s. However, the trains that were built in this era followed the same mentality of creating more peak capacity in areas where widening roads was too expensive because of high city center land prices.
In the US as well as in Europe, and nowadays in developing countries, construction of rapid transit in the biggest cities and high-speed rail between them is paired with large highway systems for everything else. When the Tories won the 2010 election, they proclaimed the end of Labour’s so-called war on motorists, but maintained their support for Crossrail in London and High Speed 2 from London to the major provincial cities. And in Toronto, even Rob and Doug Ford, for all their anti-walkability demagogy, support subways, just not at-grade streetcars that would take lanes away from cars.
How does cars-and-trains transportation fail?
In the United States, public transportation is divided into three groups. There is transit-oriented urbanism, which covers about half to two thirds of New York, and very small segments of Chicago, Boston, San Francisco, Washington, and Philadelphia. There are people riding public transportation out of poverty. And there is cars-and-trains behavior, common in the outer parts and suburbs of cities with urban rail networks. In the major American metropolitan areas with urban rail other than New York, people who commute by public transport actually outearn people who drive alone, because so much transit ridership consists of rich suburban commuters. Because of the weight of those commuters and because American metro areas with public transportation are richer than the rest of the country, the national gap in income between drivers and transit commuters is small and shrinking. And yet, fuel consumption as a proportion of overall consumption is constant around 3.5% in the bottom nine deciles.
In other words: the United States has spent a lot of money on attracting the rich to public transportation, and has succeeded in the sense that transit commuters earn about the same as car commuters, but the rich still drive so much that they consume as much fuel as the poor relative to their total spending. This is not because rich people inherently like driving – rich Manhattanites don’t drive much. This is because the postwar American transportation network does not provide adequate public transportation for non-commute trips. Off-peak frequencies are low, and service to destinations outside city centers is weak.
In Germany, the politics of cars-and-trains infrastructure is still around. A few months ago, when some Berlin Greens proposed congestion pricing, CDU came out in opposition, saying that without park-and-rides, how can people be expected to use the U- and S-Bahn? Walking or biking to the station is apparently not possible in outer Berlin, per CDU.
How does cars-and-trains urbanism fail?
The problem with cars-and-trains urbanism is not just about lack of frequency. The off-peak frequency on some of the American light and heavy rail systems serving park-and-rides is not terrible for regional rail – trains come every 10 or 12 or 15 minutes. But the development repels non-commuter uses of the system. The stations are surrounded by parking rather than high-density office or residential development. People who already own cars will drive them wherever it’s convenient: they’ll shop by car since retail has no reason to cluster in the central business district, and they’ll probably drive to jobs that do not have such agglomeration benefits as to have to be in city center.
That is not just an American problem. Western Europe, too, has built extensive infrastructure to extend auto-oriented postwar suburbia into older city centers, including motorways and parking garages. If the streets are narrow, then the sidewalks may be extremely narrow, down to maybe a meter in Florence. This encourages anyone who can afford to do so to drive rather than walk.
If there is no transit-oriented core to the city, then the result is a standard auto-oriented city. Examples include Los Angeles and Dallas, both of which have large urban rail networks with approximately no ridership. In the three-way division of American transit ridership – New York (and to a small extent a handful of other city cores), suburban commuters, very poor people – Los Angeles’s transit ridership is mostly very poor, averaging half the income of solo drivers. Public transit construction in this case has been a complete waste without policies that create a transit city, which must include both liberalization (namely, zoning liberalization near stations) and coercion (such as higher car and fuel taxes and removal of parking).
If there is a transit-oriented core, then the result cleaves the metro area in two. To people who live in the transit zone, the auto-oriented parts are inaccessible, and vice versa. A few places at the boundary can be crosshatched, but the city itself cannot be entirely crosshatched – the sea of single-family houses in the suburbs is not accessible except by car, and transit-oriented cities have no room for the amount of parking or road capacity required for auto-centric density.
Does rapid transit mean cars-and-trains?
No. In opposition to the postwar elite consensus and the center-right’s support of cars-and-trains urbanism, the New Left tends to be hostile to rapid transit, on the theory that it’s only good for cars and that tramways with dedicated lanes are as good as subways. This theory is hogwash – enough cities built metros before mass motorization in order to avoid streetcar and horsecar traffic jams – but it’s attractive to people who associate subways with the failings of CDU and its equivalents in other countries.
Paris provides a positive example of rejecting cars-and-trains urbanism while building rapid transit. Postwar France was thoroughly cars-and-trains in its mentality, but 21st-century Paris is the opposite. Mayor Anne Hidalgo has narrowed roadways and removed freeways in order to make the city pedestrian-friendlier. Ile-de-France is expanding its tramway network, but it’s at the same time investing enormous amounts of money in expanding the Metro and RER. I do not think there is any city outside China with more underground route-km built than Paris in 2000-30 – Indian metros are mostly above-ground. In my under-construction database, which largely omits China and Russia due to difficulties of finding information in English, Grand Paris Express is 10% of the total route-length.
Postwar Japan is another example of rapid transit without cars-and-trains typology. Unlike present-day Paris, which is ideologically leftist and green, Japanese development has been in an ideological environment similar to the center-right elite consensus, called dirigism in France. Nonetheless, Tokyo’s motorway network is not large relative to the city’s population, and suburban development has been quite dense and rail-oriented. The private rail operators have preferred to build high-density housing at their suburban stations to encourage more ridership, rather than park-and-rides.
It’s one or the other
Drivers are most comfortable on high-speed arterial streets with generous shoulders and setbacks, with parking right next to their destinations. This encourages dispersal – just try building parking for all the jobs of Midtown Manhattan or Central Tokyo on-site. Pedestrians would need to walk long distances along noisy, polluted streets and cross them at inconvenient signal times or places or risk being run over. Public transit users fare little better, as they turn into pedestrians at their destination – and what’s more, public transportation requires destinations to cluster at a certain density to fill a train at a usable frequency.
This situation works in reverse in a transit city. On a robust public transportation network, the most desirable locations are in the very center of the city, or at key interchanges. Usually the density at those nodes grows so high that drivers have to contend with heavy traffic. Widening roads is not possible at reasonable cost in dense centers of economic production; the very reason for cars-and-trains urbanism as opposed to just 100% cars is that it was never economic to build 20-lane highways in city centers.
On the street, too, conflict is inevitable. A lane can be shared, which means dominated by cars so long as a car with one person inside it gets the same priority as a bus or tram with 40; or it can be dedicated to buses and trams, which means cars have less space. And then there are pedestrians, who need adequate sidewalks even in historic city centers where the street width from building to building is 10 meters rather than the more modern 30.
Defusing conflict is attractive, but this is not possible. A city cannot be friendly to drivers and to non-drivers at the same time. The urban designs for the two groups are too different, and for the most part what most appeals to one repels the other. Trying to build two redundant transportation networks may be attractive to people who just like the idea of visible development with its construction jobs, but both will end up underused and overly costly. Good transit has to convert drivers into non-drivers – sometimes-drivers are too expensive to serve, because the urbanism for them is too peaky and expensive.
As a corollary of this, political structures that have to give something to drivers too have to be eliminated if public transportation is to succeed. For example, infrastructure funding formulas that give set amounts of money to the two modes, like the 80% cars, 20% transit split of American federal funding, are bad and should ideally be reduced to 0 if the formula itself cannot be changed; the investment in highways is making public transportation less useful, both through direct competition and through incentives for auto-oriented development. The same is true of schemes that are really fronts for highway widening, like some bus rapid transit in the US and India. Good transit activists have to oppose these, even if it means less money in overall spending, even if it means less money in spending specific for some public transit programs. The cost of highways is just too high to try to maintain a culture truce.
