I propose that transportation agencies hire people whose job is to keep abreast of global developments in the field and report on best practices.
Which agencies should do it?
Ideally, all urban ones. Very small ones should piggyback on large ones, or participate in metropolitan planning to increase the scale. National agencies could aid this by having their own larger offices, but each urban or metropolitan agency should keep a best practices expert for issues relevant to the specific local context.
How big should the team be?
Normally, only one person is required. A larger team may be necessary for language coverage. In Germany, one English-speaking person could interface with every agency in Europe – even in relatively monolingual places like Spain and Italy, enough experts speak English that it’s possible to work without learning the local language. However, East Asia is largely monolingual, and interfacing with experts in Japan, South Korea, Taiwan, and China is harder in English. Moreover, reading local debates and contracts should be done in the local language even in multilingual countries like the Netherlands and Sweden.
So since language coverage is needed, larger agencies should keep teams of sufficient size. It’s not possible to have full coverage, but, again, English is decent in a pinch. A team of about 5 should be fine, especially if the language coverage is random enough that nearby agencies are likely to only partially overlap; for example, if Berlin’s team includes a Japanese speaker and Hamburg’s includes a Chinese speaker, they can learn secondarily.
No large internal hierarchy is required. Not counting language issues, one person could do this. With full language accounting, as required for agencies the size of NYCT, TfL, or RATP, the team may have a director and a few reports, but the reports should still be paid as experienced professionals and have direct access to agency managers.
What are the team’s responsibilities?
Keep abreast of global developments through reading trade publications, following media in relevant countries so as to know whether a proposed solution is locally considered a success or not, and keeping track of how relevant agencies introduce new technology.
Go to international conferences to form horizontal relationships with peers and acquire more detailed knowledge of new methods, and follow up to discuss specifics with them.
Connect local decisionmakers with peers elsewhere in order to discuss how to adapt outside innovations to the local social and political context.
Who should be hired?
People who are likely to have the required knowledge. Horizontal hiring from other agencies is especially valuable, especially agencies from other cultures, where existing hiring is less likely to happen. American agencies occasionally hire Brits and Canadians, so it’s valuable to hire people with Asian, Continental European, or Latin American agency experience for this team.
Such people tend to be mobile, and if they leave to another agency, that’s fine. Often, the most valuable thing is a person who one can email and ask “in Barcelona, how do you do maintenance on the Cercanías?” (and that’s a high-level question, there are more detailed questions at lower zoom level than our work on costs). A former employee who moved on to another agency is always going to remain such a point contact, provided they left on good terms.
To the extent high-wage countries underlearn from lower-wage ones, they have an easier time hiring this way. Junior engineers in Italy earn less than 2,000€/month after taxes; Northern European and American agencies can poach them with better pay.
Here is a table of New York community boards, with their employed resident and job counts, broken down by how many people live and work in the same community board and how many in the same borough:
Borough
CB
Emp. res.
In same borough
%
In CB
%
Jobs
From same borough
%
From CB %
Manhattan
1
38642
29409
76.11%
7221
18.69%
355153
60618
17.07%
2.03%
Manhattan
2
48267
35865
74.31%
5725
11.86%
183115
41596
22.72%
3.13%
Manhattan
3
75441
49648
65.81%
5371
7.12%
57446
12860
22.39%
9.35%
Manhattan
4
66243
50860
76.78%
7494
11.31%
226747
49996
22.05%
3.31%
Manhattan
5
35539
27350
76.96%
15770
44.37%
1048842
237036
22.60%
1.50%
Manhattan
6
73820
56390
76.39%
8073
10.94%
217528
45792
21.05%
3.71%
Manhattan
7
98888
72880
73.70%
6473
6.55%
80773
21832
27.03%
8.01%
Manhattan
8
103360
77749
75.22%
11494
11.12%
150975
35921
23.79%
7.61%
Manhattan
9
50326
32450
64.48%
6133
12.19%
56437
20558
36.43%
10.87%
Manhattan
10
59808
37030
61.91%
1921
3.21%
27069
6582
24.32%
7.10%
Manhattan
11
54461
32989
60.57%
3465
6.36%
59785
13859
23.18%
5.80%
Manhattan
12
88756
53994
60.83%
5585
6.29%
42215
11191
26.51%
13.23%
Brooklyn
1
93858
23771
25.33%
11669
12.43%
95039
43701
45.98%
12.28%
Brooklyn
2
65843
12605
19.14%
4815
7.31%
168183
61063
36.31%
2.86%
Brooklyn
3
75550
22124
29.28%
2437
3.23%
30375
14971
49.29%
8.02%
Brooklyn
4
53047
13365
25.19%
2037
3.84%
20681
8800
42.55%
9.85%
Brooklyn
5
80184
26224
32.70%
4135
5.16%
36692
15537
42.34%
11.27%
Brooklyn
6
59620
12859
21.57%
3060
5.13%
44665
23825
53.34%
6.85%
Brooklyn
7
53912
27560
51.12%
4105
7.61%
51985
18241
35.09%
7.90%
Brooklyn
8
50134
13321
26.57%
1017
2.03%
14092
7875
55.88%
7.22%
Brooklyn
9
50798
17575
34.60%
2437
4.80%
21875
12134
55.47%
11.14%
Brooklyn
10
60178
21084
35.04%
4564
7.58%
26891
14710
54.70%
16.97%
Brooklyn
11
76193
33268
43.66%
6534
8.58%
41384
23491
56.76%
15.79%
Brooklyn
12
67453
35352
52.41%
14929
22.13%
82274
50212
61.03%
18.15%
Brooklyn
13
41841
20415
48.79%
3685
8.81%
31189
17578
56.36%
11.82%
Brooklyn
14
76918
31837
41.39%
4287
5.57%
37103
22108
59.59%
11.55%
Brooklyn
15
67527
32805
48.58%
8909
13.19%
51303
32664
63.67%
17.37%
Brooklyn
16
38147
13099
34.34%
889
2.33%
16258
7932
48.79%
5.47%
Brooklyn
17
74678
29788
39.89%
1993
2.67%
23133
11547
49.92%
8.62%
Brooklyn
18
96069
40009
41.65%
5124
5.33%
38047
21213
55.75%
13.47%
Queens
1
101288
18991
18.75%
7031
6.94%
75098
27667
36.84%
9.36%
Queens
2
64975
12229
18.82%
3489
5.37%
98729
31555
31.96%
3.53%
Queens
3
66603
19098
28.67%
2930
4.40%
24303
11737
48.29%
12.06%
Queens
4
68052
19221
28.24%
2722
4.00%
34347
14520
42.27%
7.93%
Queens
5
89074
22937
25.75%
5969
6.70%
41715
17767
42.59%
14.31%
Queens
6
59248
14194
23.96%
4203
7.09%
51413
23062
44.86%
8.17%
Queens
7
111424
39372
35.34%
18856
16.92%
96104
49400
51.40%
19.62%
Queens
8
66209
21037
31.77%
3413
5.15%
37200
17735
47.67%
9.17%
Queens
9
68350
22171
32.44%
3543
5.18%
36075
16644
46.14%
9.82%
Queens
10
57042
19399
34.01%
2855
5.01%
18793
9398
50.01%
15.19%
Queens
11
51870
17605
33.94%
3145
6.06%
32647
16201
49.62%
9.63%
Queens
12
102652
36664
35.72%
5991
5.84%
41669
19872
47.69%
14.38%
Queens
13
95551
28134
29.44%
4232
4.43%
46851
18484
39.45%
9.03%
Queens
14
46368
12538
27.04%
4837
10.43%
20989
9744
46.42%
23.05%
Bronx
1
40292
8822
21.90%
2151
5.34%
38160
15079
39.52%
5.64%
Bronx
2
20271
4912
24.23%
1395
6.88%
28631
11713
40.91%
4.87%
Bronx
3
31085
7438
23.93%
836
2.69%
16020
6469
40.38%
5.22%
Bronx
4
62233
12619
20.28%
2010
3.23%
22887
8491
37.10%
8.78%
Bronx
5
52639
11308
21.48%
1688
3.21%
18509
8608
46.51%
9.12%
Bronx
6
32209
7811
24.25%
1257
3.90%
21646
8534
39.43%
5.81%
Bronx
7
56770
13256
23.35%
2812
4.95%
37047
15328
41.37%
7.59%
Bronx
8
44353
9093
20.50%
2773
6.25%
22587
9143
40.48%
12.28%
Bronx
9
71562
16749
23.40%
2846
3.98%
23935
9931
41.49%
11.89%
Bronx
10
52005
12813
24.64%
2876
5.53%
32978
13456
40.80%
8.72%
Bronx
11
47966
13213
27.55%
3476
7.25%
41411
18590
44.89%
8.39%
Bronx
12
67597
17499
25.89%
2717
4.02%
21584
8862
41.06%
12.59%
SI
1
80116
20485
25.57%
9719
12.13%
40870
18722
45.81%
23.78%
SI
2
60486
14498
23.97%
7548
12.48%
48136
22915
47.60%
15.68%
SI
3
72208
19871
27.52%
7532
10.43%
25338
13227
52.20%
29.73%
Notes:
The data uses the all-jobs filter on OnTheMap, which assigns a lot of public-sector jobs in the city to City Hall or Brooklyn Borough Hall. The actual number of workers in Brooklyn CB 2 is lower than stated, by perhaps 60,000. The definition of CBs also excludes a few parts of the city with jobs, including the airports. Finally, Marble Hill is in Manhattan but is in the Bronx CB 8; it is counted in Manhattan throughout in same-borough job counts but as part of the Bronx CB 8 in CB job and resident counts.
Very few people work in the same community board they live in. Citywide, it’s 7.8%. The numbers are only high in Manhattan CB 5, which consists of Midtown and is so expensive to live in that people live there if they’re high-income commuters choosing a short walking commute. And yet, local politics is dominated by those 7.8%, who think owning a business near where they live makes them more moral than the rest of the city.
Even working and living in the same borough is not that common, only 38.7% citywide. It’s only a majority in Manhattan and a bare majority in two Outer Borough CBs, Brooklyn 7 and 12 (Sunset Park and Borough Park).
Staten Island, which has a strong not-the-rest-of-the-city political identity, relies on the rest of the city’s economy. Only 25.8% of employed residents work within the borough, and 55.6% work in the other four boroughs, the remaining working in the suburbs. Slightly more Staten Island residents work in Manhattan than on Staten Island.
The majority of people working in New York live outside the borough they work in, and this is true even excluding Manhattan, only 45.7% of outer-borough workers living in the borough they work in.
The Bronx CB 2 is on net a job center and not a bedroom community, due to industrial jobs in Hunts Point.
I’ve written five pieces about national and transnational traditions of building urban rail: US, Soviet bloc, UK, France, Germany. I’m about to continue this series with a post about Japan, but yesterday I made a video on Twitch jumping ahead to different national traditions of high-speed rail. The video recording cut two thirds of the way through due to error on my part, so in lieu of an upload, I’m writing it up as a blog post. The traditions to cover are those of Japan, France, Germany, and China; those are the world’s four busiest networks, and the other high-speed rail networks display influences from the first three of those.
The briefest description is that the Shinkansen is treated like a long-range subway, the TGV like an airplane at flight level zero, and the ICE like a regional rail (and not S-Bahn) network. China doesn’t quite fit any of these modes but has aspects of all three, some good, some not.
But this description must be considerably nuanced. For example, one would expect that airplane-like trains would have security theater and a requirement for early arrival. But the TGV has neither; until recently, platforms were completely open, and only recently has SNCF begun gating them, not for security but for ticket checks, with automatic gates and QR codes. Likewise, until recently passengers could get to the train station 2-3 minutes before the train’s departure and get on, and only now is SNCF requiring passengers to show up as long as 5 minutes early.
The Shinkansen network has very little branching. Currently there is none south of Tokyo; a short branch to Nagasaki is in planning but will not open anytime soon. To the north, there is more branching, and the Yamagata and Akita Mini-Shinkansen lines, the only legacy lines with Shinkansen through-service, split trains, with one part of the train continuing onward to Shin-Aomori and Hokkaido and another part splitting off to Yamagata or Akita.
Going south of Tokyo, the off-peak frequency to Shin-Osaka is four express Nozomi trains an hour, at :00, :09, :30, :51 off-peak; two semi-express Hikari, at :03, :33; and one local Kodama, at :57. The 21-minute gaps are ugly, but on a train that takes around 2.5 hours to get to Shin-Osaka, they’re not too onerous. Thus, there is a culture of going to the train station without pre-booking a ticket and just getting on the next Nozomi. The ticketing system reinforces this: there is no dynamic yield management, but instead fixed ticket prices between pairs of station depending on seat class. What yield management there is is static: the Nozomi has a small surcharge, to justify excluding it from the JR Rail Pass and so shunt tourists to the Hikari.
This is not literally the headway-management system seen on some unbranched subway systems, like the Moscow Metro and Paris Métro; Moscow keeps time by distance from the preceding train, and not by a fixed schedule. But this is fine: some subway systems are timetabled, like the U-Bahn in Berlin and the Tokyo subway. Tokyo even manages to mix local and express trains on some two-track subway lines with timed overtakes. To the scheduler, the fixed timetable is of paramount importance. But to the passenger, it isn’t – people don’t time themselves to a specific train.
Another subway-like characteristic includes interior layout, designed around fast egress. Shinkansen cars have two door pairs each and platforms are 1,250 mm high with level boarding, enabling 1 minute dwell times even at very busy stations like Shin-Osaka. Trains make multiple stops in the Tokyo and Osaka regions, and even Nozomi and equivalent fastest-train classes on other lines stop there, to distribute loads. There is no cafe car, and luggage is overhead, to maximize train seating space: a 25 meter car has 18-20 seating rows with 1-meter pitch, which is greater efficiency than is typical in Europe.
Station location decisions, finally, are designed as far as practical to be in city centers. Stations with Shin- before their names are new stations, like Shin-Osaka and Shin-Yokohama, but they tend to be sited close to city centers, at intersections with subway and commuter rail lines.
The main drawback of Japan is that the construction costs are very high. This comes from a political decision to build elevated lines rather than at-grade liens with earthworks, as is common in Europe. This preponderance of els has been exported to South Korea, Taiwan, and China, all of which have high costs relative to the tunneling proportion; the KTX, essentially a Shinkansen adapted to an environment in which the legacy trains are standard-gauge too, is notable for having low tunneling costs, as is common in Korea, but high costs on lines with moderate amounts of tunneling thanks to the high share of construction on bridges.
East Asia has high population density, which lets it get away with high costs since the ridership is high enough to compensate – THSR is at this point returning around 4% on very high costs. But in any other environment, this leads to severe problems. China, with lower incomes and fares than in Japan, Korea, and Taiwan, already has trouble paying interest on lines other than the Beijing-Shanghai system. India, building a turnkey Shinkansen as recommended by Japanese consultants, who were burned by Taiwan’s mix of European and Japanese technology on an operationally-Japanese system, is spending enormous sums of money: the Mumbai-Ahmedabad corridor is around PPP$50.6 billion, for 508 km, $100 million/km on a line that’s only 5% in tunnel and even those tunnels could have been avoided by running on broad gauge and using existing a widened legacy right-of-way in Mumbai.
The TGV as flight-level zero air travel
As detailed in New Departures by Anthony Perl, the history of the TGV differs from that of the Shinkansen in a key aspect: the TGV was built after the postwar decline of rail travel (as was the ICE), whereas the Shinkansen was built before it (as was to some extent CRH). The Shinkansen was built in 1959-64: there was no decline in rail evident yet, with only 12 cars/1,000 people in Tokyo in 1960, and the system was designed to deal with growing ridership. In contrast, the TGV was planned after the 1973 oil crisis, in a then-wealthier and more motorized country than Japan, aiming to woo passengers back to the train from the car and the plane.
Previously, SNCF had been engaging in experiments with high speed and high-voltage electrification, inventing 25 kV 50 Hz electrification in the process, which would be adopted by the Shinkansen and become the global standard for new electrification. It also experimented with running quickly on ballasted track – without modifications, the trains of that era kicked ballast up at high speed, there was so much air resistance. But investment had gone to legacy intercity rail, driving up the average speed of the electrified Mistral to 130 km/h and the Aquitaine to 145 km/h. Nonetheless, competition with air was fierce and air shuttles in that era before security theater attracted many people in competition with four-hour trains from Paris to Lyon and Bordeaux.
The TGV’s real origin is then 1973. The crisis shocked the entire non-oil-exporting world, leading to permanently reduced growth not just in rich countries (by then including Japan) but also non-oil-exporting developing countries, setting up the sequence of slow growth under import substitution and then the transition to neoliberalism. France reacted to the crisis with the slogan “in France, we have ideas,” setting up the nuclearization of French electricity in the 1980s, reduced taxes on diesel to encourage what was then viewed as surplus fuel rather than as a deadly pollutant, and the construction of the electric TGV.
Despite the ongoing growth of the Shinkansen then, there was extensive skepticism of the TGV in the 1970s and early 80s. The state refused to finance it, requiring SNCF to borrow on international markets. The LGV Sud-Est employed cost-cutting techniques including 3.5% grades and high superelevation to avoid tunnels, at-grade construction with cut and fill balancing out to avoid surplus dirt, and land swaps for farms that would be split by the line to avoid needing to build passageways.
Construction costs were only 5.5M€/km in 2021 euros. Unfortunately, costs have risen since and stand at 20M€/km, or even higher on Bordeaux-Toulouse. But the LGV network remains among the least tunneled in the world thanks to the use of high grades; in our database the only less tunneled network, that of Morocco, is a turnkey TGV, built at unusually low cost.
As in Japan, the line was built between the two largest cities: Paris and Lyon. Also as in Japan, Lyon could not be served at the historic center of Perrache, but instead at a near-center location, Part-Dieu, which then became the new central business district, as the LGV Sud-Est was built concurrently with the Lyon Metro and nearby skyscrapers, as is typical for a European city wishing to avoid skyscrapers in historic centers. But everything else was different. There were no real intermediate stops the way that the express Shinkansen have always stopped at Nagoya and Kyoto: the LGV Sud-Est skipped Dijon, which instead was served on a branch, and the two intermediate stops on the line, Le Creusot and Mâcon-Loché, are on the outskirts of minor towns and only see a few trains per day each.
Moreover, relying on France’s use of standard-gauge, there was, from the start, extensive through-service beyond Lyon, toward Marseille, Geneva, Saint-Etienne, and Grenoble. Frequency was for the most part low, measured in trains per day. There was little investment in regional rail outside the capital, unlike in Germany, and therefore there was never any attempt to time the connections from Saint-Etienne and Grenoble to the TGV at Part-Dieu.
At the other end, Paris did not build a central station, unlike German or Japanese cities. The time for such a station was, frustratingly, just a few years before work began on the TGV in earnest: RATP was building the RER starting in the 1960s and early 70s, including a central station at Les Halles, which opened 1977. But this was designed purely for urban and suburban use, and the TGV stayed on the surface. The last opportunity for a Paris central station was gone when SNCF extended the RER D from Gare de Lyon to Les Halles. Thus Paris has four distinct TGV stations – Lyon, Montparnasse, Nord, and Est – with poor connections between them.
This turned the TGV into a point-to-point system. Were there a central station, trains could have gone Lille-Paris-Lyon-Marseille. But there wasn’t, and so for Lille-Lyon service, SNCF built the Interconnexion Est, bypassing Paris and also serving Disneyland and Charles-de-Gaulle Airport. When the LGV Atlantique opened, Tours kept its historic terminal, and thus trains went either Paris-Tours or Paris-Bordeaux bypassing Tours. When the LGV Sud-Est was extended south with the LGVs Rhône-Alpes and Méditerranée, trains did not go via Part-Dieu, even though it had always been configured as a through-station for points south, but rather via a bypass serving Lyon’s airport; trains today go Paris-Lyon, Paris-Marseille, or at lower frequency Lyon-Marseille, but not Paris-Lyon-Marseille.
Of note, Japan’s subway-like characteristic is partly the outcome of its linear geography along the Taiheiyo Belt, making it an ideal comparison also for the Northeast Corridor in the United States. But Lille, Paris, Lyon, and Marseille are collinear, and yet the service plans do not make use of that geography. There is no planning around seat turnover: if a train makes an intermediate stop, it’s one with very low ridership, like Mâcon, with no attempt to have seats occupied by Paris-Lyon passengers and then by Lyon-Marseille ones.
Over time, this led to a creeping airline-ization of the TGV. Airline-style dynamic yield management was introduced, I believe in the 1990s. This was after SNCF had spent the 1980s marketing the TGV as 260 km/h for the same fare as 160 km/h; the overall fares on legacy intercity trains and TGVs are similar per p-km, but TGVs have opaque pricing, and are designed to maximize fares out of Paris-Lyon in particular, where air competition vanished. The executives at SNCF are increasingly drawn from the airline world, and, perhaps out of social memory of the navettes competing with 4-hour trains in the 1970s, they think that trains cannot compete with air travel if they take longer than 3-3.5 hours, even though they do successfully on such city pairs as Paris-Toulon.
Having skipped Germany’s InterCity revolution and its refinements in Switzerland, Austria, and the Netherlands, the TGV network has stagnated in the last decade. Ridership is up since the pre-Great Recession peak but barely, only by around 10%. The frequency is too weak for inter-provincial links, where people mostly drive, and in the 1990s and 2000s the TGV network grew to dominate the Paris-province market; there isn’t much of a remaining market for the current operating paradigm to grow into.
While some regional links are adopting takt timetables, for example some of the Provence TERs, SNCF management has done no such thing. Instead, it has spent the last 15 years pursuing airline strategies, including imitation of low-cost airlines, first iDTGV and then OuiGo. A generalist elites of business analysts believes in market segmentation and price discrimination, which do not work on a mode of travel where a frequent, flexible timetable is so paramount.
Among the countries influenced by France, Spain is notable for realizing that it has a problem with operations. In an interview with Roger Senserrich, ADIF head Isabel Pardo de Vera spoke positively of Spain’s efficient engineering and construction, but centered ADIF and RENFE’s problems, including the poor operations. Like Italy and Belgium, and more recently Morocco, Spain learned the concept of high-speed rail from France; also like Italy and Belgium, it mixed in a few German elements, which in the 1980s meant Germany’s more advanced LZB signaling, but at the time, there was no Switzerland-wide takt yet, and the inferiority of French operations and scheduling was not yet evident. But Spain self-flagellates – this is how it learns – whereas France is just a hair too rich to recognize its weaknesses and far too proud for its elite to Germanize where needed.
The ICE as long-distance regional rail
Germany came into the 1960s with some of the most advanced legacy rail in the world, with technology that would be adopted as a Shinkansen standard. This goes back to the 1920s, when Deutsche Reichsbahn was formed from the merger of the state-level railways in the wake of the post-WW1 German Revolution. The new railway regulation, dating to 1925, promoted new kinds of engineering now completely standard, such as the tangential switch. DRB would also experiment with 200 km/h diesel express trains in the 1930s. Even in the 1960s and early 70s, when the most advanced rail tech was clearly in Japan, Deutsche Bundesbahn kept up with rail tech, much like SNCF, inventing LZB signals.
But unlike Japan and France, Germany never built a complete high-speed rail network. The InterCity network, dating to 1971, was designed around fast legacy trains, at slightly lower speeds than available on the express French legacy trains. The key was that city pairs would be served every two hours, with timed connections at intermediate points boosting many to hourly. This was from the start based on a regular takt and turnover, with more expansive service to smaller cities.
High-speed lines in Germany were delayed, and often built on weird alignments. The most important reason is that in the formative period, from 1971 to 1990, there was no such country as Germany. The country was called West Germany, and, much like Japan, had a fairly linear population distribution from the Ruhr upriver to Cologne, Frankfurt, Mannheim, and finally either Karlsruhe or Stuttgart and Munich; but the largest city proper, Hamburg, lay outside this corridor.
The north-south orientation of West Germany contrasted with the rail network it inherited. Until the post-WW1 German Revolution, the rail networks were run by the states, not by the German Empire, and thus interstate connections were underbuilt. Prussia had an east-west orientation, and therefore north-south lines were relatively underbuilt (see for example the 1896 map), and to top it off most north-south routes crossed the Iron Curtain.
To solve many problems at once, but not to solve any of them well, Germany’s first high-speed line connected Hanover, Göttingen, Kassel, Fulda, and Würzburg. Getting to more substantial cities like Hamburg and Frankfurt requires onward through-service at lower speed. The LGV Sud-Est had a minimum curve radius of 3.2 km, and usually 4 km, and can squeeze 300 km/h out of it now, without any tunnels; the Hanover-Würzburg line has a minimum radius of 5.1 km and a maximum grade of 1.25% and is limited to 280 km/h (service runs at 250 km/h), as it was built as a mixed freight-passenger line.
Subsequent lines have, like Hanover-Würzburg, not been complete connections between major cities. Here the difference with France, Italy, South Korea, and China is evident. All are standard-gauge countries, like Germany, and all employ through-service to various degrees. But France opened a complete Paris-Lyon high-speed line in 1981-3, and only the last 30 km into Paris were on legacy trains (since reduced to 8 km with the Interconnexion Est), and likewise Italian, Chinese, and Korean high-speed lines connect major cities all the way. In contrast, this never happens in Germany at longer distance than Cologne-Frankfurt, a 180 km connection. There are always low- or medium-speed segments in between. The maximum average speed between major cities in Germany is either Cologne-Frankfurt or Berlin-Hamburg, a 230 km/h line with tilting trains, both averaging around 180 km/h; the Tokaido Shinkansen, with legacy 2.5 km curves, squeezes 210 km/h out of the Nozomi, and LGVs routinely average 230-250 km/h between Paris and major secondary cities.
Nor are the lower speeds in Germany saving money. The mixed passenger/freight lines have heavier tunneling than they would need if they had 3.5-4% grades. Hanover-Würzburg cost 36M€/km in 2021 euros thanks to its 37% tunneled alignment. German construction costs are not high relative to the tunneling percentage, unlike Chinese or Taiwanese costs, let alone British ones, but the tunneling percentage is in many cases unnecessarily high. This is thankfully not exported to every Northern European country that learned from the InterCity, but the Netherlands, as NIMBY-ridden as Germany, built an unnecessary tunnel on the HSL Zuid and had very high costs even taking that into account; Italy, with an otherwise-French system, likewise overbuilds, as pointed out by Beria-Albalate-Grimaldi-Bel, with viaducts designed to carry heavy freight trains even where there is no such demand.
So the bad in Germany is that the lines have very shallow grades, forcing heavy tunneling, and the costs are so high that the system is not complete. Is there good? Yes!
The InterCity system’s focus on high frequency enables decent service between major cities. Berlin-Munich trains, compromised by the Erfurt detour and subsequent descoping of much of the line, do the trip in 4.5 hours where they should be taking 3 and even 2.5 hours. But it’s not the same as the 4 hours of the pre-TGV Mistral to Lyon or Aquitaine to Bordeaux, the latter of which averaged the same speed as most Berlin-Munich trains today. The Aquitaine ran as a single daily Bordeaux-Paris-Bordeaux round-trip, and another train, branded the Etendard, ran the same route daily but Paris-Bordeaux-Paris. In contrast, DB today connects Berlin-Munich roughly every hour. It’s far more flexible, and the connections to other intercity trains are better.
And just as the TGV’s inexpensive construction has been perfected in Spain while France has slouched on cost control, so has the interconnected system of Germany been perfected on the margins of its sphere of influence, especially in Switzerland. Swiss connections are never fast: the country is too small for 300 km/h trains to make large differences in door-to-door trip times. The average speed on the workhorse Swiss lines connecting the Zurich-Bern-Basel triangle is around 110-120 km/h. But they run on a half-hourly takt, and other lines run on an hourly takt, and connections at the major cities are timed. European urbanism has a long tail of small cities, unlike American or Asian urbanism, and the Swiss takt connections those small cities to one another through regular timed transfers, with investments to prioritize punctuality.
This leads to a false belief among German rail advocates in a tradeoff between French or Spanish speed and Swiss or Dutch or Austrian connectivity. The latter set of countries have higher rail ridership per capita, and even Germany has recently overtaken France’s intercity rail ridership (though not yet per capita), and thus activists in Germany think investing in high speed is a waste. But what is actually happening is that the countries of Europe that look up to France have built high-speed rail, and the countries that look down on France have not; the Netherlands has HSL Zuid but it’s peripheral to the national network and its system is otherwise rather Swiss. Germany absolutely can and should complete its network. It just needs to understand that in certain aspects, countries it is used to stereotyping as spendthrift have done a more prudent job than it has.
Already, the younger rail advocates I meet, like Felix Thoma, seem interesting in applying the Deutschlandtakt concept to a high-speed rail network, rather than to a medium-speed one as the previous generations called for. But Germany is a NIMBY country. NIMBYs blocked French levels of energy nuclearization in the 1970s and 80s, creating the last generation’s Green Party (current leader, Annalena Baerbock, is 40 and came of age after those fights); NIMBYs sue projects they dislike on frivolous grounds until the politicians lose interest, much as in the US with its government-by-lawsuit, and thus high-speed rail on the Hamburg-Hanover line has been stuck in limbo for a generation.
Besides the political deference to NIMBYs, who as in the US are not as powerful as either they or the state thinks, the main problem then is unwillingness to merge French and German planning insights where they work. I might also add Japanese insights – the Shinkansen is far more efficient with platforms than any European railroad – but they’re less important here or in France than in the UK, which is a ridiculously high-cost version of French planning.
China as a mixture of all modes, some good, some awful
When I started planning this video and now post, I was puzzling over where to slot China. Other systems seemed fairly easy to slot as Japanese, German, or French, with the occasional special feature (insanely high UK costs, HSL Zuid in an otherwise Swiss intercity takt system, Korean standard-gauge adaptations). But China is its own thing. It makes sense: on the eve of corona, China had 2.3 billion annual high-speed rail riders, comfortably more than than the rest of the world put together; Japan, the second busiest network, had 436 million. In Europe, only France has more high-speed rail ridership per capita, by the smallest of margins.
Historically, the system should be viewed as having borrowed liberally from other systems in richer countries that built out their networks earlier. Among the three prior traditions, the one most similar to what CRH has converged on is the Shinkansen, and yet there is significant enough divergence I would not class CRH as a direct Shinkansen influence the way I do the KTX and THSR. This also mirrors the situation for rapid transit: China displays clear Soviet influences but has diverged sufficiently that it must be viewed as a separate tradition now.
The most important feature is that CRH evolved on the cusp of the decline of rail in favor of cars and planes, a decline that has been more complete in Western countries. In the 1980s and early 90s, China was already growing very quickly; this was from a very low base, so it was not noticed in richer countries, but it was enough that there were already motorization and domestic air travel competing with China Railway. This led to a multi-phase speed-up campaign, announced in 1993 and implemented from 1997 to 2007.
At this point, construction was on legacy alignments to legacy stations. In the North China Plain, the railroads were straight thanks to the flat topography, and so what was needed was investment in the quality of the physical plant – the sort of investments figured out in midcentury France and Germany, adapted by the Shinkansen. This was not trivial, not in a then-low-income country like China, but it was not enormously expensive either. At the same time, there was growing electrification in China, using 25 kV 50 Hz, leading to higher and higher train classes, all charging premium fares over the third-world tickets for traditional trains. At the apex was the D class, covering 200 km/h EMUs; the one time I rode a train in China, a day trip from Shanghai to Jiaxing and back in 2009, the way back was on a D class train, which had the comfort level and speed of the Northeast Corridor, topping at 170 km/h and averaging maybe 110. This investment has continued, and as of 2019, 72% of the network is electrified.
But China was already looking for more. In 2008, the Beijing-Tianjin high-speed line opened, as the world’s first 350 km/h line. In the financial crisis’s aftermath, China rapidly built out the network as fiscal stimulus, and by 2011, ridership overtook the Shinkansen’s as the world’s largest. Without legacy considerations, the system is built for 380 km/h, even though trains run at 350 km/h, and express trains average 280-290 km/h.
Like the United States and unlike Japan or most of Western Europe, China has an extensive freight rail network. Its approach is the opposite of Germany’s: high-speed lines are dedicated to passengers, and some are officially called passenger-dedicated lines, or PDLs, to make this clear. Freight trains go on the legacy network. Regional rail in China is very weak; the few lines that exist are new-builds, rather like long-range subways, and frequency is often lacking, the Beijing lines branded as S-Bahn barely running off-peak. With nearly all intercity rail having moved over to CRH, the legacy network is relatively free for freight use, even coal trains, which are slow and care little for reliability improvements for higher-end intermodal cargo.
However, the passenger-only characteristic of CRH’s system does not mean it’s employed French cost-cutting techniques. Rather, lines run almost exclusively on viaducts and have shallow grades, raising construction costs as in the rest of East Asia. Stations are newly-built at high expense: Beijing South cost 7 billion yuan, which in today’s PPP dollars is around $3 billion. There are many tracks and no economization with fast turnarounds as in Japan, and station layouts are comparable to airports, with some security theater.
Beijing South is at least just outside the Second Ring Road. Other stations are farther out. This is not just the beet field stations that characterize TGV service to small cities like Amiens or Metz, but also outlying stations in major centers. Shanghai Station only sees high-speed trains on the local line to Nanjing, providing a dedicated track pair equivalent to Kodama service while Nozomi-equivalent trains continue on to Beijing on their own tracks. The trains to Beijing get a separate Shanghai station, Hongqiao, colocated with the city’s domestic airport. The connecting subways tend to be better than at true beet field stations in France, which miss regional rail connections, but those stations are still well outside city center.
China is moreover exporting the bad more than the good. Chinese-funded projects in Africa are not fast – the average speeds are perhaps midway through China’s speed-up campaign, predating CRH. But they do have oversize, airport-like stations located well outside city centers. This happens even when right-of-way to enter city center exists, as in Nairobi.
On mixing and matching
Understanding these four distinct traditions is important for high-speed rail planning, in those four countries as well as elsewhere, such as in the UK and US. It’s important to understand the tradeoffs that these traditions made, and drawbacks that are not so much tradeoffs as things that didn’t seem important at the time.
Most notably, Britain has oversize stations, spending billions on new terminals such as in Birmingham. This comes from the low efficiency of most European turnaround operations, because most European cities have huge rail terminals from the steam era with a surplus of tracks. When trains need to turn fast, they do: German trains running through Frankfurt, which is a terminal, turn in 3-4 minutes to continue to their onward destination. In Tokyo, where space is at a premium, JR East learned to turn trains in 12 minutes even while giving them a cleaning, and with such tight operations, Britain should be able to fit traffic growth within existing station footprints.
It is also desirable to learn from students who have surpassed their old teachers. Korea has lower construction costs than Japan, Spain has lower construction costs than France and greater understanding of the need to integrate the timetable and infrastructure, Switzerland has perfected the German system to the point that German rail advocacy calls for reimportation of its planning maxims.
In the same way that Taiwan built infrastructure to European specs but is running Japanese trains on it, to its profit and to Japan’s chagrin, it may be advisable to build infrastructure in the French (or, better yet, Spanish) way but then run trains on it the German (or better yet, Swiss) way. But it’s more nuanced than this conclusion, due to important contributions from China and Japan, and due to the focus on having a central station, which France chose not to build in Paris to its detriment.
But in general, I think it behooves countries to learn to implement the following from those four traditions:
Japan: the best rolling stock, high-efficiency turnaround operations, reliable schedules; avoid excessive viaducts and Japan’s increasing demand for turnkey systems.
France: passenger-dedicated infrastructure standards (supplemented by Cologne-Frankfurt), land swap deals for at-grade construction, cost control (in the Spanish version – France is deteriorating); avoid TGV rolling stock and airline-style pricing.
Germany: takt (especially in the Swiss and Dutch versions), open station platforms, integration between timetable and infrastructure, seat turnover, decent rolling stock; avoid empowering NIMBYs and building mixed lines with freight.
China: separation of passenger and freight operations, very high average speeds; avoid airline-style outlying stations and excessive viaducts.
I recently found two presentations, one from 2017, the other from earlier this week, both underscoring the importance of in-house expertise for efficient construction. This is layered on top of interviews Eric and I did for our Boston case study and a few additional interviews I did in other American and European cities. It is my professional opinion that agencies that engage in major capital projects, even if they involve rolling stock acquisition rather than the construction of new lines, ought to hire in-house, and make sure to have long-term capital programs.
The presentations
Both presentations concern rolling stock. The one from 2017 is by Stadler, regarding the challenges of the American market. On slide 32, it mentions that Caltrain was a demanding customer, with all expertise outsourced and yet managers engaging in micromanagement. The micromanagement is in line with what we’ve heard from contractors for other capital expansions, like Second Avenue Subway, especially contractors with experience in both the US, where this practice is common, and Europe, where it isn’t.
The other presentation, from this week, concerns the MBTA’s slow approach to electrifying its commuter rail network. It wishes to begin with a pilot on the already-electrified Providence Line, but is running against the problem of having no in-house expertise, just as Caltrain does not. The presentation on this says, on slide 3, that it takes 6-9 months to onboard consultants, and another 6-9 to develop performance requirements for a kind of vehicle that is completely standard in high-performance regional rail networks in Europe.
Instead of hiring experienced professionals (who must come from Europe or East Asia and not the US), the MBTA plans to piggyback on either the overpriced Caltrain order, or an obsolete-technology order by New Jersey Transit. The Caltrain order, moreover, is stretched for the generous loading gauge of the Western US, but does not fit the catenary height on the East Coast, even though European KISSes would easily and are around 13 cm lower than existing MBTA rolling stock.
Prior Northeastern examples
This combination of political and managerial micromanagement with outsourcing of technical expertise to consultants is common enough in the United States. In the Boston report on the Green Line Extension, we were told by multiple sources that the MBTA only has 5-6 engineers doing design review. Thus, they have the capacity to handle small projects but not large ones.
Small-scale projects like building a new infill station or taking an existing low-platform commuter rail station and converting it to an accessible high-platform one usually have limited cost premium: in Berlin, infill stations are 10 million € outside the Ring, whereas in Boston, infill stations and high-platforming projects (which are very similar in scope) are around $20-25 million – and Boston platforms are longer. This is also the case in Philadelphia, where headline costs are lower because the stations are smaller, but overall the unit costs are comparable to those of Boston.
But large projects are beyond the ability of a 6-person team. The required permanent staffing level is likely in the teens for a team whose job is just to score design and construction contracts. This choked the original Green Line Extension, leading to bottlenecks in design and contributing to the project’s extreme cost. The restarted version is still extremely expensive – it’s getting some good press this week for running slightly under a $2.3 billion/6.3 km budget, but said budget, $360 million/km, is well above the international norm for a subway, let alone trenched light rail. The current project has sunk costs from the previous ones, and a combination of in-house and consultant design about whose efficacy we’ve heard conflicting reports, but the team is much larger now.
In areas that don’t even have the skeletal design review staff of Boston, costs are high even for small projects. Connecticut deserves especial demerit: its department of transportation relies exclusively on consultants for rail design (perhaps also road design but I do not know), and infill stations cost not $20-25 million but $50+ million. The Hartford Line, compromised from the start, even displays this state-by-state difference: the one Massachusetts project, a single high platform in Springfield, cost $10 million/100 meters, a fraction of comparable projects in Connecticut. Larger Connecticut stations, such as those for Metro-North, have seen extreme scope creep, amounting to a $106 million total cost.
Consultants and design
American agencies speak of design-bid-build contracts, in which design and construction are separate, and design-build ones, where they are combined into a single contract. Design-bid-build is superior. But really, contracts in low-cost countries are often neither of those, but just build contracts, with design done mostly in-house. A procurement official in Stockholm explained to me that Swedish contracts tend to be build contracts; design-bid-build can sometimes be used with supplemental consultants helping with design, but it’s not the norm. Moreover, in Oslo, the use of design consultants instead of in-house design has not been good: consultants tend to engage in defensive design because of how Norway structures risk allocation, leading to overbuilding.
In Spain and (I believe) Italy, contracts are design-bid-build. But there’s so much in-house involvement in design that it’s more accurate to call these build contracts. The in-house design teams are not huge but they’re enough to work with private design firms and score proposals for technical merit. In Istanbul, the system is somewhat different: preliminary design at the 60% level is contracted out separately from the combination of final design and construction, which may possibly be called des-bid-ign-build, but the design part is extensively scored on technical merit, at 60-80% of the total weight. The construction contracts in Istanbul are lowest-bid, but contractors can be disqualified, and since Turkey has so much infrastructure construction, contractors know that they need to behave well to get future work.
Unfortunately, American consultants believe the opposite: they believe in the superiority of design-build and are not even aware of pure build, only design-bid-build. Sources from that world that I generally think highly of have told me that directly. But that is because the sort of projects that they are most likely to be involved in are ones that use consultants, which definitionally are not build contracts. The ongoing expansion projects in Stockholm, Madrid, Barcelona, Milan, Rome, and Berlin have no use for international consultants, so international consultants are not familiar with them, and end up knowing only about high-cost examples like London or the occasional medium-cost one like Paris. In effect, to rely on consultants is to ascertain one largely learns worst industry practices, not best ones.
Hire in-house
The alternative to paying consultants is to obtain public-sector expertise. Agencies are obligated to hire sufficient-size teams, and pay them competitively. Engineers in Italy and Spain have a lot of social prestige, much as in France and Germany; even in medium- rather than low-cost countries in Europe, like France, we were told by UITP planners that the people planning metro systems are hired from the engineering elite (in France, this would be Grandes Ecoles graduates), and paid appropriately.
In the US, there is no such prestige. Humanities professors speak of STEM privilege routinely, but by Continental and East Asian standards, the US and UK have no STEM privilege: the elites are generalist and are not expected to know the specific industrial fields they oversee. The public sector thus treats the planner and the engineer as a servant to the political appointee. Senior management routinely ignores the advice of younger planners who are more familiar with present-day research.
The pay, too, is deficient. In absolute numbers, planners at American transit agencies get paid better than their European counterparts – but American white-collar wages are generally higher than European ones. The MBTA pays project managers $106,000 a year as of a few years ago, which is a nice wage, but the Boston private sector pays $140,000 in transportation and more in other fields. The public sector, through budget-cutting officials, sends a clear price signal: we do not want you to work for us.
There is another way, but it requires letting go of the idea that private consultants are better than long-term in-house experts. It is obligatory to hire in-house at competitive wages to grow the design review teams, and listen to them when they say something is desirable, difficult, or impossible. Instead of onboarding consultants, agencies should immediately staff up in-house with plans for long-term investments. Moreover, senior management should back the planners and engineers when they engage in value engineering, even if it annoys politicians and local activists. The role of elected politicians is to review those in-house plans and decide whether there is room in the budget for the megaprojects they recommend, and not to micromanage. This way, and only this way, can the United States shrink its procurement costs to typical Continental European levels.
In New York, the frequency of a bus or subway service is regularly adjusted every three months to fine-tune crowding. Where Berlin has a fixed clockface timetable in which most trains run every 5 minutes all day, New York prefers to make small changes to the frequency of each service throughout the day based on crowding. The New York approach looks more efficient on paper, but is in fact the opposite. It leads to irregular frequencies whenever trains share tracks with other trains, and weakens the system by leading to long waits. But another problem that I learned about recently is that it is unusually inconvenient for labor, and makes the timetabling of trains too difficult.
How does New York timetable trains?
New York City Transit meets every three months to change the frequency of each named (numbered or lettered) subway service and, I believe, also every bus service. The rule is that, off-peak, train loads should be 125% of seated capacity at the most crowded point of the journey. Of note:
This is adjusted by time of day – it’s not one fixed frequency for the entire midday off-peak.
At the peak, the frequency follows the same rule but the guideline allows much more crowding, equal to about 3 times the seated capacity.
When multiple services share the same trunk, the crowding is based on the service, not the trunk. This matters because sometimes there’s a notable difference, for example the 2 is more crowded than the 3 coming in from the Bronx and Harlem.
There is no adjustment for the length of the most crowded point: it could be one 1.5-minute interstation, or a long 20-minute stretch.
The interlining between different services leads to irregular frequencies on each, thus different crowding levels. The frequency guidelines are averaged across different trains of the same service.
There is a minimum frequency of a train every 10 minutes weekdays, every 12 minutes weekends; late at night, all trains run every 20 minutes.
I wrote in 2015 about the negatives of this approach, focusing on the issue of interlining of different services with different frequencies and the seams this creates. Because the system is not trunk-based, the alternation of (say) 2 and 3 trains on the long trunk that they share is not regular. Thus the frequency is irregular and so is crowding. More recently, in 2019 I wrote about the frequency-ridership spiral. The guidelines are based on thinking from an era when nobody thought ridership was endogenous to frequency; direct commute trips without transfers are long compared with frequency, so in that era, the only perceived purpose of frequency was to provide capacity for a fixed ridership. But in reality, 10 minutes is too infrequent for the subway trips people actually take, which average 13.5 minutes without transfers.
Timetabling and labor
The consequence of the constant fidgeting on frequency is that crew timetables are unpredictable. In one period, the system may need more subway drivers reporting to Coney Island Yard, and in another, it may need more at yards in the Bronx and Queens. Bus depots likewise are located all over the city. Naturally, subway yards and bus depots are at peripheral locations, usually accessible only from one subway line in one direction. Commuting there from most spots in the city is difficult.
Moreover, as is typical in the American unionized public sector, workers at New York City Transit pick their schedules in descending order of seniority. The senior workers can make sure to pick work out of depots near where they live. The junior ones spend years having to work out of the Bronx one day and Southern Brooklyn the next. The commute is so bad that the TWU negotiated paid commute time: workers who have long commutes, forced by erratic timetabling, get paid for commute time, rather than just for time they actually work. Car ownership rates among subway workers are high, which is not typical of New York workers.
The erratic scheduling also means that, even independently of the long commutes for train and bus drivers, there is extensive downtime between runs. A prominent peak in the schedule means that split shifts are unavoidable. Split shifts are undesirable to workers, and therefore shift scheduling always includes some compromises, for example paying workers half-time for time between shifts (as in Boston), or scheduling shorter paid gaps between revenue service. In New York, there are some subway train operators who have three uninterrupted hours of paid work in which they do not drive a revenue train.
This is not because New York City drivers are lazy or overpaid. The timetabling is forcing unnecessary pain on them, which allows them to demand higher wages, and also leads to inefficiency due to much downtime and paid commutes. NYCT pays bus and train drivers $85,000 a year in base salary per See Through NY, and there aren’t hordes of people knocking on NYCT’s doors demanding those jobs. Boston pays slightly less, around $80,000, and has some retention problems among bus drivers; private bus companies that attempt to pay much less just can’t find qualified workers. The market pay is high, partly because it’s a genuinely physically tough job, but partly because it’s made tougher by erratic scheduling. In Munich, the richest city in Germany, with average per capita incomes comparable to those of New York, S-Bahn drivers get 38,000-45,000€ a year, and one wage comparison site says 40,800€. Berlin pays less, but Berlin is a poorer city than both Munich and New York.
There is another way
New York should timetable its trains differently. Berlin offers a good paradigm, but is not the only one. As far as reasonably practical, frequency should be on a fixed clockface timetable all day. This cannot be exactly 5 minutes in New York, because it needs more capacity at rush hour, but it should aim to run a fixed peak timetable and match off-peak service to peak service.
One possibility is to run all trunks every 2.5 minutes. In some cases, it may be fine to drop a trunk to every 3 minutes or a bit worse: the L train has to run every 3 minutes due to electrical capacity limits, but should run at this frequency all day; the local Broadway Line trains should probably only run every 3 minutes as they have less demand. But I wouldn’t run the 1 train every 3 minutes as it does today, but rather keep it every 2.5, matching the combined trunk of the 2 and 3, and try to time the cross-platform transfers at 96th Street. Train services that share tracks with other services should thus run every 5 minutes, maybe 6. Last year I called this the six-minute city, in which all buses and trains run every (at worst) 6 minutes all day. In the evening this can drop to a train or bus every 10 minutes, and late at night every 20, but this should be done at consistent times, with consistent quantity of service demanded week in, week out.
There may be still some supplemental peak frequency. Taking 3 minutes as the base on every trunk, some trunks may need 2.5 at the peak, or ideally 2 or less with better signaling. It represents a peak-to-base ratio of 1-1.2, or maybe 1.5 in some extreme cases; Berlin, too, has the odd line with 4-minute peak frequency, for a ratio of 1.25. The employee timetabling is unlikely to be onerous with a ratio of 1.25 rather than the present-day ratio of around 2, and while passengers do drop out of riding trains for short distances if they only come every 10-12 minutes, 6 minutes on branches may be tolerable, even if 5 is slightly better.
It’s a large increase in service. That’s fine. Frequency-ridership spirals work in your favor here. Increases in service require small increases in expenditure, even assuming variable costs rise proportionately – but they in fact do not, since regularizing frequency around a consistent number and reducing the peak-to-base ratio make it possible to extract far more hours out of each train driver, as in Berlin. Net of the increase in revenue coming from better service, such a system is unlikely to cost more in public expenditure.
This remains true even assuming no pay cuts for drivers in exchange for better work conditions. Pay cuts are unlikely anyway, but improving the work conditions for workers, especially junior workers, does make it easy to hire more people as necessary. The greater efficiency of workers under consistent timetabling without constant fidgeting doesn’t translate to lower pay, but to much more service, in effect taking those 550 annual hours and turning them into 900 through much higher off-peak frequency. It may well reduce public expenditure: more service and thus greater revenue from passengers on the same labor force.
What it requires is understanding that frequency is not to be constantly messed with. Gone are the days when frequency was naturally so high that it looked to be just a function of capacity. On a system with so many transfers and so much short ridership, ridership is endogenous to it, and therefore high, consistent frequency is a must for passengers. For workers, it is also a must, to avoid imposing 1.5-hour commutes on people without much notice. Modernization in this case is good for everyone.
Separately, because of Noah Smith’s opinions about high-speed rail, today there is going to be an event featuring me and him in which we are going to discuss the issue in an American context, alongside a presentation of the database and what lessons can be drawn from it. You can register here; it’s at 13:00 Eastern US Time, or 19:00 Berlin time.
A few notes regarding our database, because I’m being asked on Twitter, and also because it’s relevant for our research:
This is a well-studied topic
Literature on comparative HSR costs already exists, and some of our internal cost references are to studies on the subject. This is not like subway costs, where the biggest databases I know of prior to ours are a Flyvbjerg paper and a Spanish analysis each with a number of items in the teens. This should not in a way be surprising: the costs and impact of megaprojects are analyzed more than those of smaller projects, and subways are megaprojects of greater size than surface transit or street reconstruction but HSR is of yet greater size. Thus, subways are significant enough that we have been able to find largely complete costs from trade and mass media and government reports, which task is far harder for bus lanes or bike lanes, whereas with HSR, not only is it possible to find complete costs, but also there is extensive public debate and analysis.
I believe our contribution to the discussion, then, is not the database itself, but two new points:
Contrary to the World Bank report on the subject (see here, starting printed page 39), China does not build HSR especially cheaply. Our findings are not too different from the World Bank’s for lines built up to the publication of the report measured in yuan per km, but we adjust for PPP and therefore the cost in dollars per km is higher, and, moreover, the more recent lines appear to be more expensive. In fact, Chinese costs are higher than European ones. The reason is that China builds its HSR almost entirely on viaduct, whereas in Europe, viaducts are rare, and segments that are not in tunnel are built at-grade or on earthworks.
There is positive correlation between a country’s HSR costs per km, net of tunnels, and its subway construction costs. This is not perfect correlation, but one can see Britain, the Netherlands, and Taiwan perform poorly in both areas. France and Germany are in the middle. Spain is very cheap. The exceptions are notable: Italy has cheap subways and expensive HSR, which Paolo Beria, author of one of our source papers, attributes to overbuilding and overdesign, with extensive tunnels and freight-friendly grades.
We only include under-construction or open lines
This contrasts with lines that are only in early design and may not yet have a cost – for example, Frankfurt-Mannheim will only publish its cost estimate next year, in a parliamentary budget setting in order to decide whether to proceed (for which the answer is certainly yes, as the benefits to the network are intensive). This also contrasts with canceled and indefinitely postponed lines, such as California High-Speed Rail and the Portuguese lines killed during the Great Recession’s austerity. Canceled lines are upward-biased: the state is likelier to cancel or choose not to build a line if it is more expensive than the average, as we can readily see with California, and therefore we do not wish to compare built with unbuilt lines.
The above analysis is equally true of our subway construction costs database – if a line is canceled, it is purged, even if design or even physical construction began. Gateway for example is under active design and engineering and is therefore included, even if they are still seeking funding, but if it is canceled it will be purged (but if it is rebooted, as I hope, then the sunk cost will be included, as with the Green Line Extension in Boston).
The difference is that our HSR cost database is more historic. It is close to complete for France, Germany, Italy, Spain, Belgium, and Korea, and complete for single-line Taiwan and the Netherlands and for the UK. This is because it’s just easier to find historic data for HSR than for subways, where I wish I could get a complete historic series for big cities with big systems like Paris, Madrid, and Berlin, but can’t even find 1970s-80s costs for any of them. Conversely, ongoing projects make it surprisingly difficult at times to find tunnel and viaduct percentages, and the escape path of going on Google Earth and OpenStreetMaps and measuring is not available.
What is included?
As far as possible, costs are for civil infrastructure, systems, stations, and overheads, but not rolling stock or financing charges. Austria’s Koralmbahn has two sets of numbers, differing by a factor of 2, with one source claiming that it is about whether financing is included. It is my belief that, owing to the high profitability of HSR if cost of capital is ignored, it is best to think in terms of returns on investment and not try to incorporate debt or finance charges into the actual cost.
The importance of avoiding viaducts and tunnels
The Asian tendency to build on viaduct where the line is not in tunnel leads to high costs. Likewise, the use of shallow grades and low superelevation for mixed lines or even for some dedicated lines (the Shinkansen, without any track sharing, hews to 1.5% grads) raises construction costs.
Netting out tunnels is still useful when trying to figure out itemized costs and cost control that is not about what to build, for example about labor or procurement. It is also useful when comparing lines in the mountainous terrain of Austria, Japan, Korea, and Switzerland to the easier North European Plain. But at some point, it is necessary to treat the tunnel percentage as endogenous to the planning system. The viaduct percentage, moreover, is absolutely endogenous.
France in this context does well by keeping lines at grade as much as possible. The only country with less tunneling than France is Morocco, which builds its urban and high-speed trains as if it were France, and, thanks to France’s extensive presence in the Maghreb, French contractors are intimately familiar with the local situation and build cheaply. France and Germany have similar unit costs, but Germany tunnels a lot more, less because of the terrain and more because of either politics (that is, the Erfurt detour for Berlin-Munich, forcing the line to go through thicker mountains) or a misguided attempt at building mixed lines in the 1980s and 90s.
The United States’ high projected budgets for proposed lines that never go anywhere thanks to their extreme costs come from overbuilding more than high unit prices. For example, in Baltimore, a two-track tunnel project designed for exclusive electric passenger train usage turned into a four-track tunnel with enough room for double-stacked freight with mechanical ventilation for diesel locomotives. The scope creep raised the projected budget from $750 million in the late 2000s to $4 billion in the mid-2010s.
There’s a report just released by the Grattan Institute called Megabang for Megabucks, talking about high construction costs in Australia. Our transit costs project is quoted as an international comparison, pointing out that Australia is near the global high end. I encourage people to read the report itself, which says interesting things about problems with Australian construction and procurement. I am especially happy to see that the recommendations for the most part accord with what we are learning from other cases – of course, our Boston case is out and the report authors have likely read it, but the recommendations are in line with things we see from yet-unpublished cases, so this is not just me looking at a mirror.
The issue of competition
Australian megaproject contracts have insufficient competition. Only three firms are Tier One, the largest infrastructure contractors in Australia; those get most contracts for the largest infrastructure projects, and when mid-tier firms bid, it’s often in partnership with a Tier One company. Moreover, in the largest size category, higher than $1 billion, even the Tier One firms often partner with one another, leading to monopoly.
International firms do access the Australian market, but it is inconsistent. Australia overweights the importance of local experience, and has some unusual rules, such as requiring firms to engage in more prior design than is typical.
This is consistent with what I’ve seen in Israel. In short, the electrification contract in Israel was won by Spanish contractor SEMI, which had extensive European experience but none in Israel. This was criticized domestically, and some people blamed it for the schedule slips on the electrification project, but such blame is unfair. The bulk of the delays are not the fault of SEMI but come from a lawsuit launched by Alstom, which competed for the contract and lost out on price; Alston employed industrial espionage to create FUD about the bid, and the lawsuit delayed works by three years. Despite this, the costs have not run over much, and the absolute per-km costs remain on the low side, net of extras like Haifa’s demand for a trench. Thus, even in a situation of extensive domestic complaints about the winning bidder’s lack of local experience, said lack did not materially create problems.
This is also consistent with lessons from Turkey. In Turkey, there must be a minimum of three bidders. If there are only one or two, the state or municipal government must rebid. Absolute costs in Turkey are low and so are cost overruns; the extensive competition helps discipline the contractors, as does the political consensus in favor of rapid infrastructure construction, credibly promising firms that there will be more work in the future and if they behave they will get some of it.
Procurement
The study discusses different contracting regimes. It does not talk about the design-build issue; I do not know whether it is as prevalent in Australia as in Canada, and regrettably there is no cost history, thus no way for me to confirm my suspicion that Australia resembles Canada and Singapore in only having had a cost explosion in the last 20 years. However, it does talk about change orders.
Change orders are a notable problem in California. Low bids followed by renegotiation are common there; Tutor Perini is notorious for this behavior. The study goes over strategies to deal with this issue, though it does not talk explicitly about itemization as in Spain and Italy, where the unit prices are public and then if more is needed (e.g. more labor due to slower progress) then the change is already pre-agreed, avoiding litigation. Sweden avoids litigation as well.
Finally, the study talks about rushing. This was an issue in Boston, so this may be me learning from a mirror, but, in brief, American funding for infrastructure encourages agencies to rush the preliminary design to apply for federal funding early. This leads to compromised designs and premature commitment, since there is no ongoing funding for long-term design.
Learning from good examples
I think the one drawback of the study is the list of comparisons. Sourced partly to us and partly to Read-Efron, they say,
The empirical evidence is incomplete, but what there is shows that rail construction costs in Australia are in the top quarter of 27 OECD countries studied. They are higher than in numerous other rich countries: 26 per cent higher than in Canada, 29 per cent higher than in Japan, and more than three times as high as in Spain (Figure 1.2 on the following page). And road and rail tunnels cost more in Australia than elsewhere in the world, according to an international study.
The comparison with Canada has a problem: the Canadian costs in our database go back 15-20 years, and back then, costs were much lower than today. The latest costs do not show an Australian premium over Canada – Toronto is more expensive to build in than Sydney and almost as much as Melbourne. It is critical to understand that high costs are really a pan-Anglosphere phenomenon, and thus Australia should learn from Continental European and East Asian examples (except very high-cost Hong Kong), and not from countries that in the last 10 years have had the same problems as Australia or worse. Spain is always good, as are common features to low-cost Spain, Italy, Turkey, South Korea, and the Nordic countries, and even common features to those and medium-cost countries like France, Germany, China, and Japan.
Now that there’s decent chance of US investment in rail, Randal O’Toole is resurrecting his takes from the early Obama era, warning that high-speed rail is a multi-trillion dollar money sink. It’s not a good analysis, and in particular it gets the reality of European and Asian high-speed rail systems wrong. It displays lack of familiarity with rail practice and rail politics, to the point that most nontrivial assertions about rail in Europe and Asia are incorrect.
More broadly, the way O’Toole gets rail investment here wrong comes from making unexamined American assumptions and substituting them for a European or Japanese reality regarding rail as well as rail politics. If the US can’t do it, he thinks other countries can’t. Unfortunately, he’s even unfamiliar with recent work done on American costs, when he compares the Interstate system positively with recent high-speed rail lines.
High-Speed Rail Profitability: France
I’m currently working on building a database similar to our urban rail costs for high-speed rail. Between this and previous iterations of analyzing the TGV, I’ve been reading a lot of internal French reports about its system. Thankfully, France makes available very good public information about the costs and technical specifications of its system. It helps that I read French, but the gap between what’s available for France and Belgium (see for example lineschemas) is vast. This provides crucial background that O’Toole is missing.
The most important thing to understand is that the TGV network is profitable. The Spinetta report on the fiscal losses of SNCF makes it clear, starting on p. 60, that the TGV network is profitable, and recommends favoring its development over the money-losing legacy networks, especially the branch lines. The report even calls for closing weak branch lines with only a few trains a day, which I called the Spinetta Axe at the time, in analogy with the Beeching Axe. Due to public outcry the state rejected the cuts and only implemented the organizational changes promoted by the report.
Moreover, all lines are very profitable excluding the cost of fixed capital. The Spinetta report’s TGV section says that operating costs average €0.06/seat-km, which is around 0.085€/p-km, despite overstaffing of conductors (8 per conventional 400-car TGV) and extensive travel on legacy track at low speed and higher per-km labor costs. Average TGV fare revenue per an ARAFER report from 2016 is 0.10€/p-km – compare p-km on p. 15 and revenue on p. 26. This is typical for Europe – RENFE and DB charge similar fares, and the nominal fares seem to have been flat over the last decade.
What’s dicier is cost of capital. In all other European countries for which I’m aware of the process, all of which are Northern rather than Southern, this is done with benefit-cost analysis with a fixed behind-the-scenes discount rate. France, in my view wisely, rates lines by their financial and social rates of return instead. A 2014 report about the Bordeaux-Toulouse LGV, recently given the go-ahead for 7.5 billion €, warns that the profitability of LGVs decreases as the system is built out: the LGV Sud-Est returned 15% to SNCF’s finances and 30% to French society (including rider consumer surplus), but subsequent lines only returned 4-7% to SNCF’s finances, and Bordeaux-Toulouse is likely to return less, 6% including social benefits per the study and at this point slightly less since the study assumed it would cost slightly less than the current budget.
The general theme in the French discourse on trains is that the TGV network is an obvious success. There absolutely is criticism, which focuses on the following issues:
Regional rail, that is not intercity rail, is underdeveloped in France outside Paris. The ridership of TER networks is pitiful in comparison with German-speaking and Nordic metropolitan areas of comparable size. For example, sourced to a dead link, Wikipedia claims 64,300 TER PACA trips per day, comprising the metropolitan areas of Marseille (1.8 million), Nice (1), Toulon (0.6), and Avignon (0.5); in Helsinki (1.5) alone, there are 200,000 daily commuter rail trips. But this isn’t really about high-speed rail, since TER planning and subsidies are devolved to regional governments, and not to SNCF.
SNCF has contentious labor relations. In the early 2010s, the unions went on a wave of strikes and got wage concessions that led to the evaporation of SNCF’s 600 million €/year primary surplus. The railway unions in France (“cheminots”) are unpopular, and Macron has been able to pass reforms to SNCF’s governance over their strikes and objections.
Future LGVs are not as strong as past ones. Real costs in France are rising, and the network already links Paris with all major secondary cities in airplane-competitive time save Nice. Interprovincial links on the network are weak, despite the construction of the LGV Rhin-Rhône, and nothing like the Deutschlandtakt is on the horizon enabling everywhere-to-everywhere travel.
SNCF thinks like an airline and not like a railroad. It separates passengers into different buckets as airlines do, has many executives with airline background (and Spinetta is ex-Air France), thinks passengers do not ride trains for longer than 3 hours even though at 4 hours the modal split with air is still better than 50-50, and has poor integration between the TGV and legacy rail.
SNCF still has a lot of accumulated debt from past operating losses, some predating the TGV and the start of regional subsidies for regional rail. It was hoped that TGV profits could cover them, but they can’t. This mirrors the controversy in Japan in the 1980s, where, in the breakup of JNR into the JRs and their privatization, debt from past operating losses was wiped but not debt from Shinkansen construction (see Privatization Best Practices, PDF-p. 106).
However, saying that the existing network is a failure is the domain of cranks and populists. It is unrecognizable from the discussion of transportation investments in France.
What O’Toole says about high-speed rail
O’Toole’s understanding of internal French (or Spanish, or Japanese) issues is weak. This isn’t surprising – Americans to a good approximation never have good insights on the internal issues of any other country, even when it speaks English. The American political sphere, which includes political thinktanks like Cato, is remarkably ignorant globally, and rather incurious. As a result, what he says about the TGV is based on an Americanized understanding. To wit:
Bus-rail competition
The Northeastern United States has a weak rail network: Amtrak averages vintage 1960s speeds and charges 2-4 times the per-km fare of the TGV. As a result, an ecosystem of private intercity buses has developed, starting with unregulated ones like Fung Wah and, as they were shut down, corporate systems like Megabus and Bolt. O’Toole is fond of these buses, with their lower fares and road-like lack of integration between infrastructure and operations.
And thus, he claims, falsely, that European high-speed rail cannibalized profitable buses. This is unrecognizable from within Europe, where intercity buses were underdeveloped until recently. In France, US-style intercity buses are called Macron buses, because the deregulation that brought them into existence passed in the mid-2010s, when Macron was the economy minister. They complement high-speed rail but do not replace it, because trains get me from Paris to the German border in 1:45 and buses don’t.
To be fair, TGV ridership has been stagnant in the last few years. But this stagnation goes back to the financial crisis, and if anything ridership picked up starting 2017 with the opening of the LGV Sud-Europe-Atlantique. So the buses are not even outcompeting the trains – they thrive in the gaps between them, just as historically they did on international routes, where rail fares are considerably higher and ridership lower.
High-speed rail construction costs
O’Toole looks at the most expensive few lines possible:
Britain’s 345‐mile London–Scotland HS2 high‐speed rail line was originally projected to cost £32.7 billion (about $123 million per mile) and is currently expected to cost £106 billion ($400 million per mile).
International comparisons of high-speed rail costs exist, and Britain’s costs are by far the worst. For example, a 2013 Australian comparison looking at the prospects for such a system in Australia finds that High-Speed 1/CTRL, the line linking the Channel Tunnel with London, cost A$134 million/km, and the second costliest line in the dataset was thee 94% tunneled Bologna-Florence line, at A$95 million/km.
French costs up until the LGV Bordeaux-Toulouse stood around $25-30 million per km in 2021 dollars, net of tunnels. German costs are similar, but German lines have far heavier tunneling than France, a range of 26-51% in tunnel compared with 0-6% in France. One reason is topography. But another is that Germany prefers mixed-use passenger-freight lines, which forces higher construction costs as freight requires gentler grades and, since superelevation must be lower, wider curves; France, like Japan and China, builds dedicated passenger lines, and, unlike Japan or China, keeps them largely at-grade to reduce costs.
O’Toole says, without more references, that it would cost $3-4 trillion to build a US-wide high-speed rail network. But the official Obama-era crayon, at 20,000 km, would be $500 billion at tunnel-free European costs, or maybe $600 billion with 5% tunneling, mostly in difficult places like California and across the Appalachians.
Freeway costs
O’Toole proposes more freeways, and says that to build the Interstate system today would cost $530 billion so it’s better than high-speed rail. Here is where his lack of knowledge of the most recent literature on infrastructure costs is a serious drag on his analysis: Brooks-Liscow establish that there was a large real increase in Interstate cost throughout the life of the program, so a budget that’s really a mixture of cheaper early-1960s construction and more expensive construction in the 1970s is not applicable today.
The same issue affects rail costs: the LGV Sud-Est cost, in today’s money, around $8 million/km, which cost would never recur. Brooks-Liscow explain this by greater surplus extraction from citizen voice groups, which demanded detours and route compromises raising costs. This appears true not just diachronically within the US but also synchronically across countries: so far, the low-cost subways we have investigated are all in states with bureaucratic rather than adversarial legalism, while medium-cost Germany is more mixed. Politicized demands leading to more tunneling are well-documented within Germany – the Berlin-Munich line was built through a topographically harder alignment in order to serve Erfurt, at Thuringia’s behest.
So no, today costs from the 1960s are not relevant. Today, urban motorway extensions cost double-digit millions of dollars per lane-km, sometimes more. The I-5 improvement project in Los Angeles is $1.9 billion for I-5 South, a distance of 11 km, adding two lanes (one HOV, one mixed traffic) in each direction. It’s possible to go lower than this – in Madrid this budget would buy a longer 6-lane tunnel – but then in Madrid the construction costs of rail are even lower, for both metros and high-speed lines.
The discourse on profits
In contrast with the basic picture I outlined for the TGV, French media and researchers often point out threats to rail profitability. This can easily be taken to mean that the TGV is unprofitable, and if one has an American mindset, then it’s especially easy to think this. If SNCF officials say that 20% of TGVs lose money, then surely they must be hiding something and the figure is much higher, right? Likewise, if Spinetta says that the TGV network is profitable but not all trains are, then surely the situation is even worse, right?
But no. This is an Americanized interpretation of the debate. In the US, Amtrak is under constant pressure to show book profits, and its very existence is threatened, often by people who cite O’Toole and other libertarians. Thus, as a survival strategy, Amtrak pretends it is more profitable than it really is.
This has no bearing on the behavior of railroads elsewhere, though. SNCF is not so threatened. The biggest threat from the perspective of SNCF management is union demands for higher wages, and therefore, its incentive is to cry poverty. Nobody in France takes out yardsticks of farebox recovery ratios, and therefore, nobody needs to orient their communications around what would satisfy American libertarians.
Energy
Within the European high-speed rail research community, the energy efficiency of high-speed rail is well-understood, and many studies look at real-world examples, for example the metastudy of Hasegawa-Nicholson-Roberts-Schmid. In fact, it’s understood that high-speed rail has lower energy consumption than conventional rail. For example, here is García Álvarez’s paper on the subject. This is counterintuitive, because higher speeds should surely lead to higher energy consumption, as Hasegawa et al demonstrate – but high-speed lines run at a uniform speed of 200 or 250 or 300 or 350 km/h, whereas legacy rail has many cycles of acceleration and deceleration. At speeds of up to about 200 km/h, nearly all electricity consumption is in acceleration and not maintaining constant speed, and even at 300 km/h, a late-model high-speed train consumes only above one third of its maximum power maintaining speed.
Instead of this literature, O’Toole picks out the fact that all else being equal energy consumption rises in speed, which it is not equal. Garcia in fact points out that higher speeds are better for the environment due to better competition with air, in line with environmental consensus that trains are far superior on well-to-wheels emissions to cars and planes. Worse, O’Toole is citing Chester-Horvath’s lifecycle analysis, which is not favorable to California High-Speed Rail’s energy efficiency. The only problem is that this paper’s analysis relies on a unit conversion error between BTUs and kWh, pointed out by Clem Tillier. The paper was eventually corrected, and with the correct figures, high-speed rail looks healthy.
Competition with cars and planes
Where high-speed rail exists, and the distance is within a well-understood range of around 300-800 km, it dominates travel. A 2004 report by Steer Davies Gleave has some profiles of what were then the world’s main networks. For Japan, it includes a graphic from 1998 on PDF-p. 120 of modal splits by distance. In the 500-700 km bucket, a slight majority of trips all over Japan are made by rail; this is because Tokyo-Osaka is within that range, and due to those cities’ size this city pair dominates pairs where rail is weaker, especially inter-island ones. In the 300-500 km bucket more people drive, but the Shinkansen is stronger than this on the Tokyo-Nagoya pair, it’s just that 300-500 includes many more peripheral links with no high-speed rail service. It goes without saying that high-speed rail does not get any ridership where it does not exist.
In France, this was also studied for the LGV PACA. On p. 14, the presentation lists modal splits as of 2009. Paris-Toulon, a city pair where the TGV takes around 4 hours, has an outright majority for the TGV, with 54% of the market, compared with 12% for air and 34% for driving. Paris-Cannes is 34% and Paris-Nice is 30%, both figures on the high side for their 5:00-5:30 train trips. Lyon-Nice, a 3:30 trip with awful frequency thanks to SNCF’s poor interprovincial service, still has a 25% market share for the TGV.
In general, competition with cars is understudied. Competition with planes is much more prominent in the literature, with plenty of reports on air-rail modal splits by train trip length. JR East, Central (PDF-p. 4), and West all report such market shares, omitting road transport. Many European analyses appeared in the 2000s, for example by Steer Davies Gleave again in 2006, but the links have rotted and Eurostat’s link is corrupt.
O’Toole misunderstands this literature. He lumps all air and road links, even on markets where rail is weak, sometimes for geographical factors such as mountains or islands, sometimes for fixable institutional ones like European borders. In fact, at least measured in greenhouse gas emission and not ridership, all air travel growth in Europe since 1990 has been international. International high-speed rail exists in Europe but charges higher fares and the infrastructure for it is often not built, with slowdowns in border zones. This is a good argument for completing the international network in Europe and a terrible one against building any network at all.
Topography
Even at the level of basic topography, O’Toole makes elementary errors. He discusses the Tokaido Shinkansen, pointing out its factor-of-2 cost overrun. But its absolute costs were not high, which he characterizes as,
The Tokyo–Osaka high‐speed rail line supposedly made money, but it was built across fairly flat territory
So, first of all, the “supposedly” bit is painful given how much JR Central prints money. But “fairly flat territory” is equally bad. Japan’s mountainous topography is not an obscure fact. It’s visible from satellite image. Per Japanese Wikipedia, 13% of the route is in tunnel, more than California High-Speed Rail.
The United States can and should do better
The report is on stronger grounds when criticizing specifics of Amtrak and California High-Speed Rail. American rail construction is just bad. However, this is not because rail is bad; it’s because the United States is bad.
And there’s the rub. Americans in politics can’t tell themselves that another country does something better than the US does. If it’s in other countries and the US can’t do it, it must be, as O’Toole calls rail, obsolete. This is especially endemic to libertarians, who are intellectually detached from their European right-liberal counterparts (Dutch VVD, German FDP, etc.) even more than the American center-left is from social democrats here and the right is from the mainline and extreme right here.
So here, faced with not too hard to find evidence that high-speed rail is profitable in Europe and Asia, and in fact intercity rail is profitable here in general (direct subsidies are forbidden by EU law unless the line is classified as regional), unlike in the United States, O’Toole makes up reasons why trains here are unprofitable or unsuccessful. He says things that are not so much wrong as unrecognizable, regarding topography, buses, construction costs, debt, the state of the TGV debate, or greenhouse gas emissions.
O’Toole is aware of our transit costs comparison. I imagine he’s also aware of high-speed rail cost comparisons, which exist in the literature – if he’s not, it’s because he doesn’t want to be so aware. And yet, no matter how loudly the evidence screams “the United States needs to become more like France, Germany, Japan, Spain, etc.,” American libertarians always find excuses why this is bad or unnecessary. And then, when it comes to expanding freeways, suddenly the cost concerns go out the door and they use unrealistically low cost figures.
But figuring out why the US is bad requires way deeper dives. It requires delving into the field and understanding how procurement is done differently, what is wrong with Amtrak, what is wrong with the California High-Speed Rail Authority, how engineering is done in low- and medium-cost countries, various tradeoffs for planning lead time, and so on. It requires turning into the kind of expert that libertarians have spent the last 60 years theorizing why they need not listen to (“public choice”). And it requires a lot of knowledge of internal affairs of successful examples, none of which is in an English-speaking country. So it’s easier to call this obsolete just because incurious Americans can’t do it.
There was a congressional hearing about high-speed rail. Henry Miller in comments here took notes – thanks for this, much appreciated! The overall content was lacking; the politicians seemed like they were spinning their wheels, not because they themselves were bad (Reps. Tom Malinowski, Peter DeFazio, and Seth Moulton all raised interesting issues) but because they were getting ignorant advice from the witnesses, none of whom has any experience in successful high-speed rail networks. Among those, Amtrak deserves the most demerits, and its head, William Flynn, should lose his job purely over that testimony, if the reporting of what he said is accurate.
Flynn, based on both what Henry said in comments and on reporting in Politico Pro, said that Amtrak needs a trust fund on the model of that for American highways – and said that this is “the most important lesson we can learn” from countries with high-speed rail.
The rub is that countries with high-speed rail do not in fact have such trust funds. Financing models vary by country, but do not look like the American highway trust fund. For example, French LGVs are funded line-by-line, with the decision on each specific line taken at the highest level of government, with financing coming either purely from the public sector (as with the LGV Est) or from a higher-cost PPP (as with the LGV Sud-Europe-Atlantique).
To understand why, it’s important to understand the relationship between politics and the civil service in functioning, high-capacity states. Politicians make big decisions on spending priorities, and then the civil service implements those decisions. There is little political input on routing decisions, and the exceptions where there is tend to have the worst, highest-cost programs. So the planning is done by the civil service, which then presents a preliminary design for politicians. But the elected politicians have the final word on the yes-no decision whether to fund, and can also ask for high-level modifications (“reduce the budget,” “give the unions the wage increases they demand,” etc.).
The American highway trust fund inverts this principle. Going back to Thomas MacDonald, federal highway builders had internal sources of money without having to ask elected politicians for regular appropriations. In contrast, politicians exerted considerably petty power over routing. For example, in Twentieth-Century Sprawl, Owen Gutfreund points out that in the early planning for what became the Interstate highways, the FDR administration reduced the scope of roads to be built in Vermont from four planned routes to two in retaliation for its voting Republican in 1936. In The Big Roads, Earl Swift also notes that MacDonald himself did not think the Interstates could pay for themselves through tolls, but, due to pressure by politicians to write a positive report, the resulting report’s coauthor proposed toll-free motorways instead, hence the prohibition on tolling Interstates. MacDonald himself was fired by the Eisenhower administration for expressing concern that the roads were hollowing out the American rail network and proposing cars-and-trains investment instead of cars-only.
And here we have Amtrak’s CEO not only supporting that model, but also lying that this model is how high-speed rail has been built. In reality, no such trust funds exist anywhere with high-speed rail. I don’t know why Flynn says such a thing, which not only is verifiably wrong, but also has no reason to be believed in the first place – there is no grain of truth to it, no trust fund-like model for high-speed rail megaprojects.
As with most such fraud, he is probably lying to himself and not just to the people who pay his salary. Americans, as a collective, are wantonly ignorant of the rest of the world. The only time they interact with the rest of the world, especially countries that don’t speak English, is through intermediaries in international consulting, who get the skewed sample of world projects that invite in international consultants, omitting the bulk of public works built in states with in-house design capacity. Individual Americans can be knowledgeable, but their knowledge is not respected, even by people who profess their interest in state capacity. Thus, no matter how smart individual Americans can get, collectively America remains incurious.
This is the most acute in mainline rail. I suspect that this relates to the rail industry’s highway envy. For a railroader like Flynn, steeped in a culture that is technologically and institutionally reactionary and looks back to its heyday in the first half of the 20th century, the enemy, that is the Interstate system, is the obvious model for how to build. That this model produced severe cost overruns on the highways themselves does not matter; that treating rails institutionally like roads is inappropriate does not matter; that systems that get as much ridership in two days (cf. JR East) as Amtrak gets in an entire year and deliver a profit to their shareholders doing so work differently does not matter. The future, which is not in the United States in this field and hasn’t been in 60 years, is one in which people like Flynn do not even qualify for an internship.
And if Flynn wouldn’t qualify for an internship, why is he allowed to be the CEO? He should lose his job. The people who briefed him should lose their jobs. It is likely that full replacement of Amtrak’s planning staff and possibly the line workers too would be a big win for riders. Even total liquidation could well be a net positive relative to status quo: most Amtrak routes have no social value, and the one route that does, the Northeast Corridor, could well produce a more competent institution from among the ashes.
Without liquidation, it is still advisable to sideline Amtrak until it can be put out of its delayed customers’ misery. The best way forward institutionally is to set up an agency responsible for all Northeastern passenger rail operations, to subsume and replace Amtrak and the commuter rail operators. It will be run by people who can speak to the difference between French, German, and Japanese high-speed rail operating models, and who know how to implement integrated timed transfer networks and intermodal fare integration. It will buy imported equipment if there is no domestic equivalent for a similar price, and use standard European or East Asian methods for track geometry machines, signaling (ACSES is thankfully an Americanized variant of the European standard, ETCS), safety systems, timetabling, and so on. The United States has no shortage of dedicated people who speak Spanish, and secondarily Japanese, Korean, Chinese, Italian, German, or French.
Moreover, since in many cases the knowledge does exist among Americans but isn’t valued, it is important to let American civil servants interview for such an agency. I expect that most would come from an urban transit background, where in my experience the people are more curious than in mainline rail. But American railroaders too could join if they demonstrate sufficient knowledge of advanced-world operations.
That said, under no circumstances should the organizational culture be allowed to turn into anything like present-day American railroading. Current workers who do not qualify for this agency are to be laid off, perhaps with a pro-rated pension for partial service, and told to seek private-sector work. Flynn himself has no role to play in any successful rail agency. He must go, and it’s almost certain that the rest of Amtrak’s management should as well. Every day he stays in his job is a day American railroading plans based on assumptions that can be easily verified to be fraudulent.
There was a conference I got invited to, consisting of three talks, two about state capacity by me and by Tyler Cowen, and one by a Canadian extramural Conservative politician named Ginny Roth (she’s a columnist but her talk was about how Conservatives could use the insights of state capacity to win elections, hence my appellation). It was run by entrepreneurs named Chris and Matt Spoke, doing a series of online meetings trying to introduce fresh ideas to what they hope will be the next crop of Tory leaders; there’s going to be one on housing in the future, and the YIMBY comments I made seemed popular with the crowd.
The organizers are in Toronto, so I didn’t talk too much about the situation in Vancouver. I said a few sentences about how I can see there was a real increase in costs from a difference between the half-elevated Canada Line and the 87% underground Broadway subway under construction, but I didn’t go into the history of the Canada Line’s cut-and-cover method or the cost estimates from the early 2010s, which had the Broadway subway costing C$250 million/km. I talked more about Toronto, where the increase in costs is larger; Vancouver, even with the cost increases, remains North America’s lowest-construction-cost city, since the other cities have had even bigger increases, including Toronto, Los Angeles, and Seattle.
I want to highlight, as I brought up 1.5 years ago, that while Canada has American (i.e. bad) mainline rail, and Americanizing construction costs, it is YIMBYer than both the US and Europe. I worry it won’t last for long, because the style of Canadian redevelopment is at fairly small radius from an arterial or a subway station and those will eventually run out, forcing upzoning of large swaths of single-family land for the benefit of everyone except the handful of aggrieved homeowners who dominate municipal politics. (There was not enough time to talk about the importance of high-level decisionmaking, that is at the provincial level and not the municipal one.)
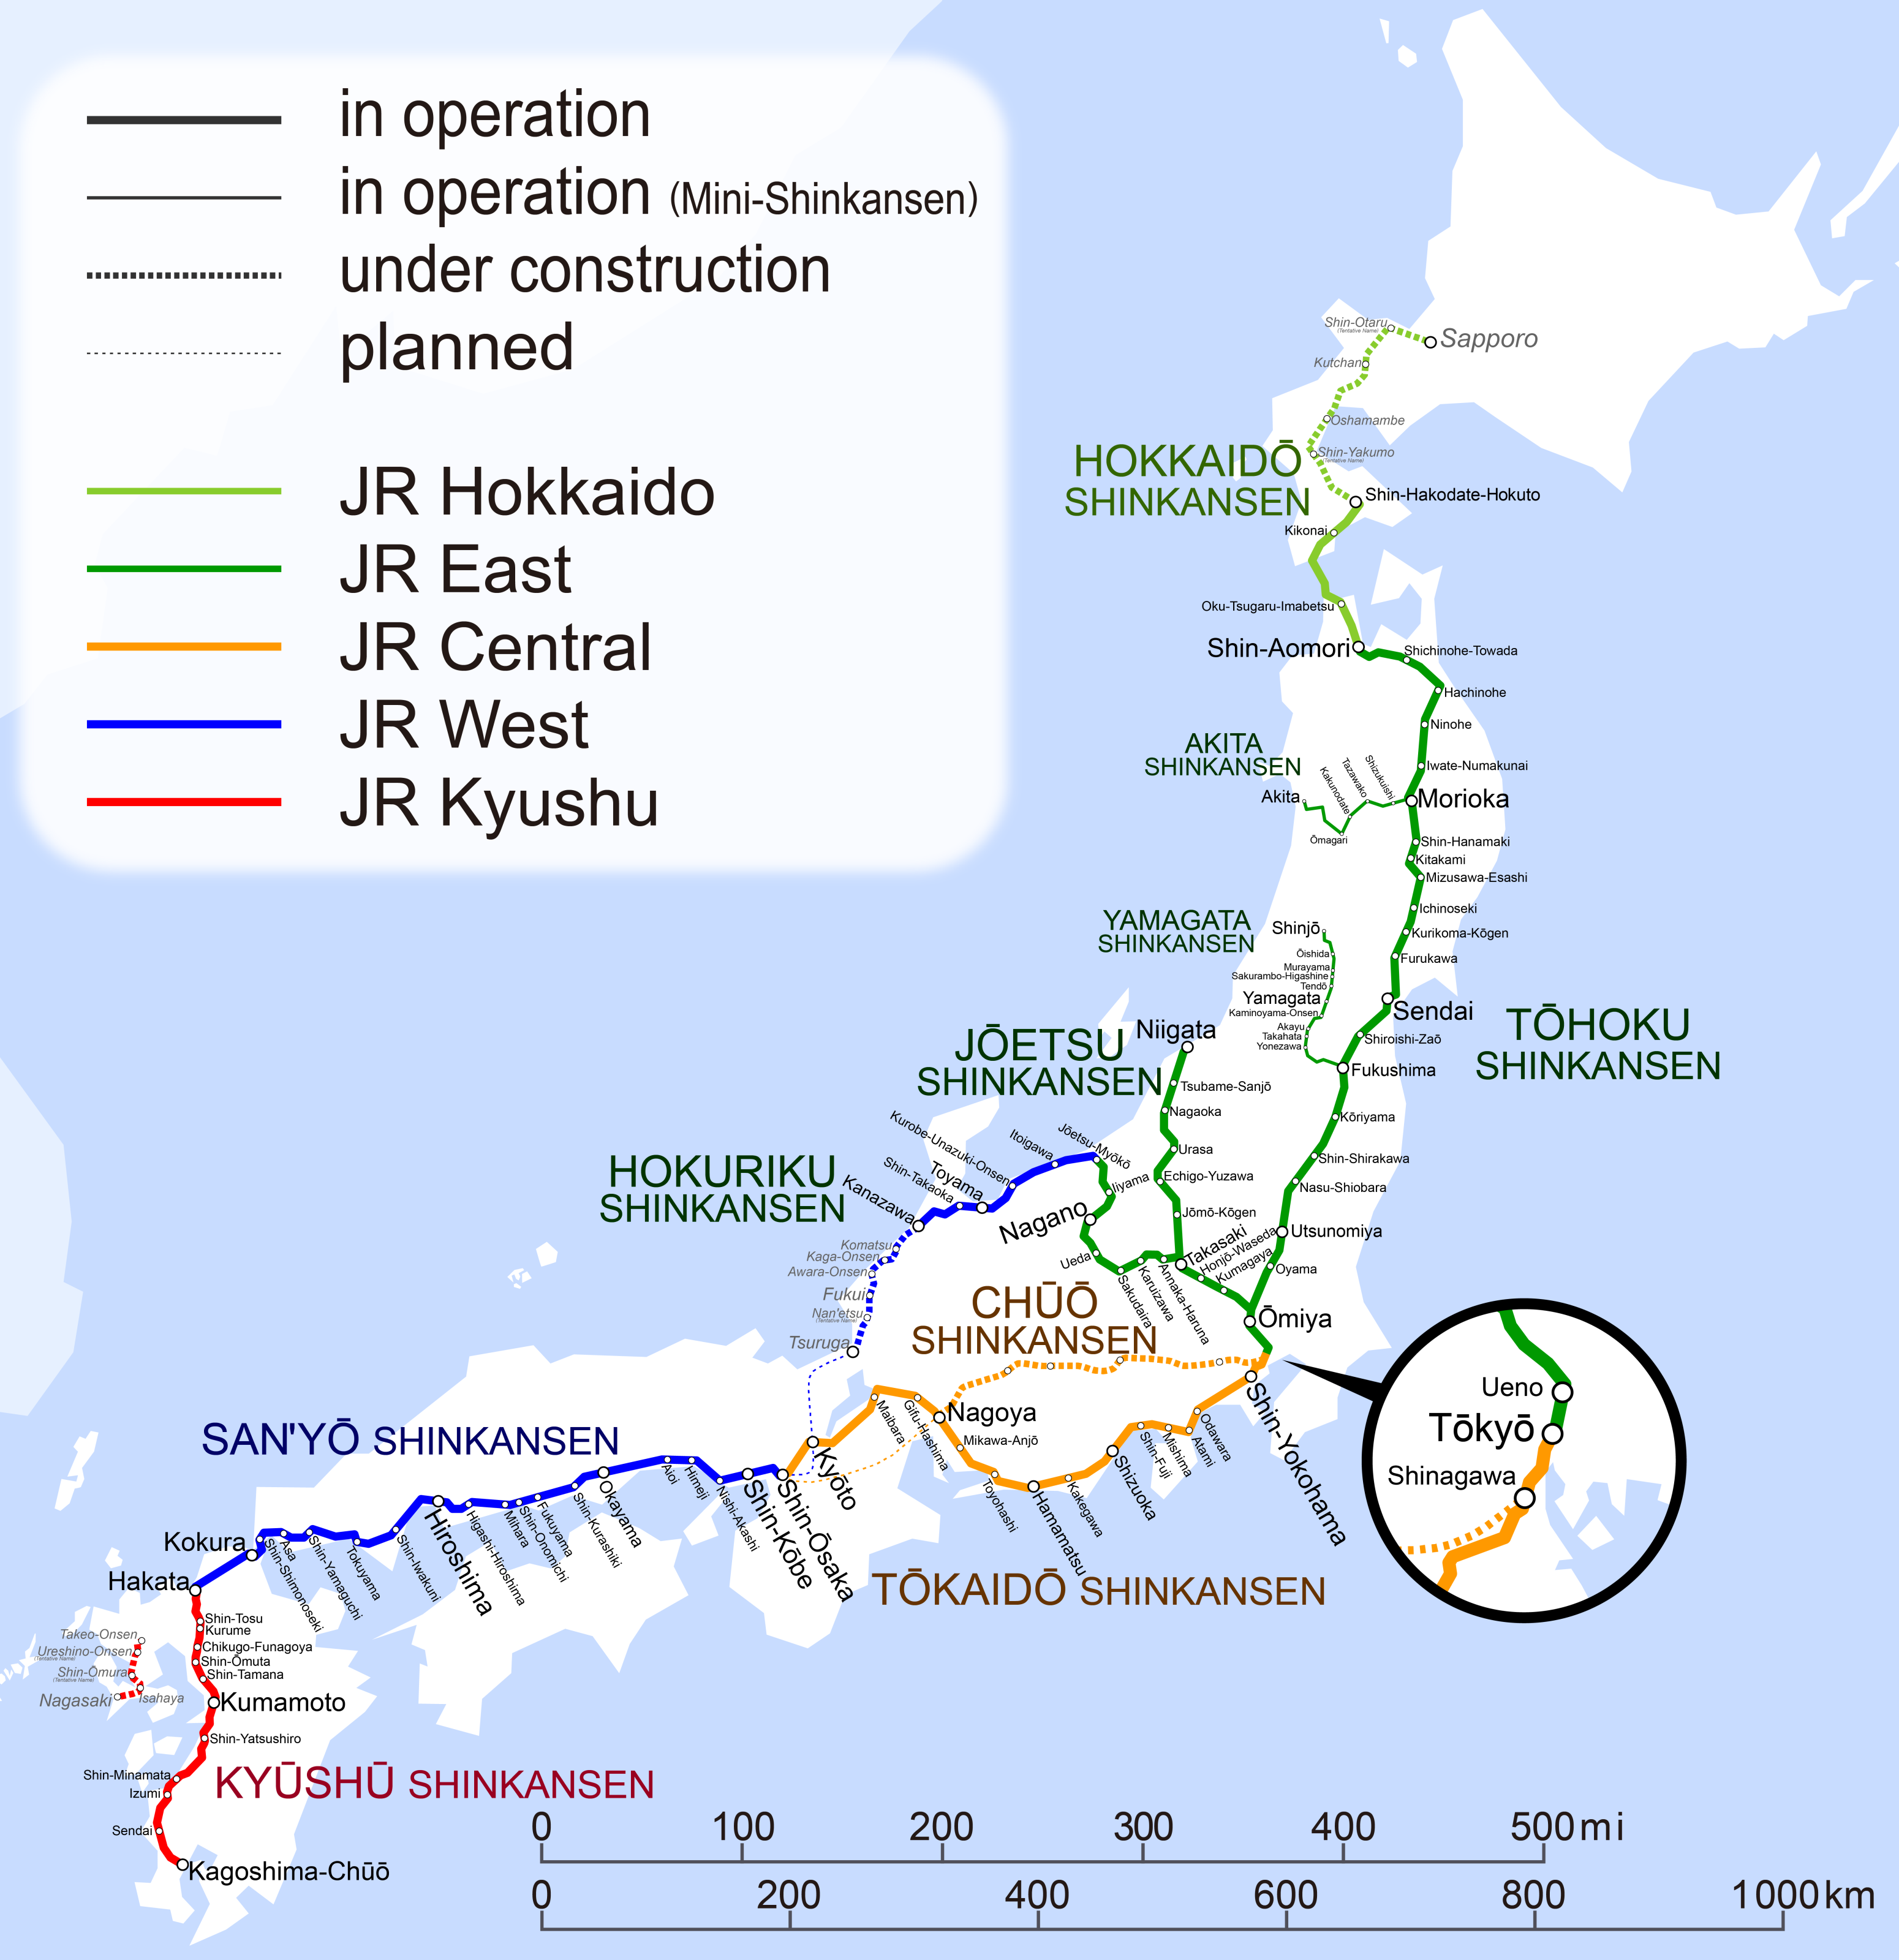
