Infrastructure, Stimulus, and Jobs

I’ve talked before on the subject of infrastructure as stimulus, arguing that it’s ideally used for projects with one-time costs and ongoing benefits. Tonight I want to discuss a specific aspect of this: jobs. American infrastructure projects always talk about how many jobs they will create as a benefit rather than as a cost, and even in Europe, the purpose of the Green Deal investment package is to create jobs. In contrast with this view, I believe it is more correct to view infrastructure stimulus as an unusually bad way of creating jobs to deal with unemployment. The ideal infrastructure package really has to be about the benefits of the projects to users, and not about temporary or permanent employment.

The key question when designing stimulus is, unemployment for whomst?. Unemployment is predominantly a problem of unskilled workers. The OECD has a chart of unemployment by education level, and the rates for people with tertiary education are very low: in 2019, the US and Germany were at 2%, France at 5%, and even Spain only at 8%, all standing around half the overall national unemployment rates.

In theory, this makes infrastructure a good solution, because it employs people in the building trades, who are not university graduates and who have swings in employment rates based on private residential construction. In practice, it is not the case, for two reasons.

First, infrastructure projects have a long lead time, and therefore by the time physical construction happens, the recession has ended: the Green Line Extension in Boston, funded by the Obama-era stimulus, has mostly been under construction at the peak of the current business cycle, with such a shortage of labor that the contractors had to offer workers a full day’s pay with overtime for just five hours of nighttime work to get people to come in.

And second, while the building trades have large swings in employment, they are not good targets for absorbing the mass of laid off workers in recession. It takes years to get certified. This is not the 1930s, when construction was more labor-intensive and less skilled, so that armies of unemployed workers could be put to work building bridges and hydroelectric dams. Construction today is more capital-intensive (how capital-intensive, I can’t tell, since the full capital-labor ratios for the projects we’ve delved into are buried beneath layers of subcontracting), and the workers, while not university-educated, are much higher-skill.

Swings in employment are the most common among unskilled workers who do not have a special qualification. Those are workers in retail, restaurants, sundry small non-essential businesses that depend on the state of the economy for sales. The public sector is rather bad at absorbing them, because the stuff the public sector is or should be doing – the military, police, health care, education, social work, transportation, infrastructure – employs workers who are not so interchangeable. Health care, education, and social work involve massive numbers of people in intermediate professions; the military requires long training and a long commitment and countries that use soldiers as cheap labor for civil infrastructure projects end up weak in both infrastructure and defense; infrastructure uses workers in trades that usually involve years of apprenticeship. The main employers of the workers most at risk of unemployment are private, doing things the state would not be able to provide well.

So if the point is to limit unemployment, it’s best to stimulate private-sector spending through direct cash aid, and not through large state-directed development programs. Those have their place, but in the economic conditions of the 2020s rather than the unfairly romanticized middle of the 20th century, they are not good tools for reducing the impact of business cycle on workers.

And if the point is to build infrastructure, then an infrastructure package is a great tool for this, but it must be built based on maximum value and long-term savings. The number of jobs created should under no circumstances appear in any public communications, to deter groups from extracting surplus by claiming that they provide jobs, and to deter false advertising when in reality the jobs created by public-sector construction tend to be created when the recession is over among groups that do not need stimulus by the. Instead, infrastructure should center the benefits to the public, to be provided at the lowest reasonable price; labor, like concrete and lumber, is in that case a cost, and not a benefit.

Convert Street Parking to Outdoor Seating

It’s in the public interest for cities to convert the parking lanes of their major streets to outdoor seating, with chairs and tables. On the commercial avenue of the modern city, land use at street level is in large part restaurants, bars, and cafes, and some of the remainder of the storefronts could use outdoor seating as well, for example bakeries. In contrast, street parking is of little value – it creates more car traffic.

The main benefit here is that it turns the street into an open-air food court. This has the usual benefits of shopping centers, which at any rate were invented to simulate commercial streets, without the interference of cars. But it has an additional benefit that I have not seen mentioned by urbanists: it pools seating between different cafes and restaurants, in contrast with today’s outdoor seating, where each place has its own few tables according to the width of its storefront.

Pooling seats this way means that people who buy from in-demand establishments can take adjacent seats. I saw this, by chance, during the corona lockdown, in which outdoor dining was technically banned as well as indoor dining, but some restaurants in Mitte near Alexanderplatz had permanent outdoor seating, and people would go there with food from anywhere. Even before the lockdown, when one such place was closed, some people, including myself, would colonize its seating with food from elsewhere. In effect, it reduces the rental costs of the places that make the most in-demand food and drinks, or other products.

This system of pooled seating, at the expense of parking, also has other benefits. It means people can eat different foods together. It distributes demand, which may differ by time of day or day of week, with restaurants most popular at typical lunch and dinner times (and sometimes different restaurants have different peaks), bars at night, and cafes in between. These both increase efficiency, but even at a fixed peak, this has benefits, in letting restaurants compete on food quality.

Taxes, in general, are progressive: the rich pay more than the poor as a proportion of their income. But trying to apply the same logic to small and medium enterprise regulations is wrong. It doesn’t produce any income redistribution to speak of – the redistribution occurs only among the class of business owners, who already skew wealthy, to the detriment of the customers. In the case of storefronts, letting restaurant and cafe patrons sit outside wherever they’d like means not forcing the most desirable businesses to pay more in rent to acquire more seating space; the redistribution involved in the implicit rental tax under the present-day situation is entirely among owners, and to some extent from business owners to landlords. It’s not the same as when I pay higher taxes than a minimum-wage Aldi cashier and lower taxes than a CEO who doesn’t receive lower-taxed stock options.

And then there’s the positive impact on urban transport. City boulevards as a rule have too much car traffic and this includes ones in Berlin or Paris that Americans hold up as positive examples that they compare with noisier American arterial roads. The abundance of parking especially encourages people to drive to errands rather than walking, biking, or using public transportation; the present-day situation is that restaurants sometimes put out seats, reducing sidewalk width and with it the available space for cyclists to use the streets.

So instead, public seating, in lieu of on-street car storage, has the positive effects of distributing seats better as outlined above, while also reducing the space available for people to use cars in a city that needs more quiet and cleaner air.

Stimulus and Non-Critical Projects

The ideal use of a politically-determined, external infusion of funds into public transit is for a capital expansion that is not critical. The service provided should be of great usefulness – otherwise, why fund it? – but it should fundamentally be not a safety-critical package, which should be funded locally on an ongoing basis. The best kind of project is one with a high one-time capital cost and long-term benefits, since a debt-issuing sovereign state can borrow cheaply and obtain the financial and social return on investment without much constraint.

Positive examples

Outside infusions, such as from a stimulus bill or an infrastructure package, are best used on expansion with short-term costs and long-term benefits. This includes visible projects that extend systems but also ones that reduce long-term operating and maintenance costs. For examples:

  • High-speed rail: it’s operationally profitable anywhere I know of, and then the question is whether the ROI justifies the debt. Because a one-time cost turns into a long-term financially sustainable source of revenue, it is attractive for outside investment.
  • Railstitution of a busy bus route, or burial of a busy tramway. This produces a combination of lower operating expenses and better service for passengers. The only reason not to replace every high-ridership city bus with a subway is that subways cost money to build, but once the outside infusion of money comes, it costs less to run a modern rapid transit system, or even a not so modern one, than a bus system with its brigades of drivers.
  • Rail automation.
  • Speed-up of a rail route to higher standards and lower maintenance costs.

The importance of non-critical projects

Critical projects are not good for a stimulus bill. The reason is that they have to be done anyway, and the process of stimulus may delay them unacceptably, as a local government assumes it will get an infusion of funds and does not appropriate its own money for it. The upshot is that a rational federal funding agency should be suspicious of a local or state agency that requests money for critical projects, especially safety-critical ones.

The point here is that the stimulus process is inherently political. It does not involve technical decisions of what the optimal kind of public transportation policy should be. It instead pits infrastructure investments against other budget priorities, like the military, holding down tax rates, or health care. It’s not meant to be predictable to the transportation expert, and only barely to the political insider. It depends on political vagaries, the state of the economy, and petty personal decisions about priorities.

Thus, an agency that asks for stimulus funds for a project sends (at least) one of two messages: “we think this project is great but if it’s not built people aren’t going to literally die,” or “we are run by incompetent hacks.” In the former case, the point of a benefit-cost analysis is that neither the costs nor the benefits are existential: the project is not safety-critical nor critical to the basic existence of the system, but the budget is not existential to the budget either and if it is wasted then the government will not go bankrupt.

Meme Weeding: Polycentricity and High-Speed Rail

There is a common line among German rail advocates that high-speed rail is not a good fit for Germany’s urban geography because the country is more polycentric than Japan or France. Per such advocates, it’s more important to connect small cities to a national network of trains averaging 120 km/h. It’s based on a wrong understanding of what polycentrism really means in the context of an entire country, and I’d like to explain why. A correct understanding would lead to a national effort to complete a high-speed rail program connecting all of the major cities at higher average speeds than 200 km/h, potentially going up to the 230-250 km/h range typical of France.

How Germany and France differ

When Germans speak of the superiority of the German InterCity concept to high-speed rail, the main comparison is France, which Germans are primed to think of as a nation of lazy spendthrifts. So it’s most valuable to compare the urban geographies of these two countries, and only secondarily rely on either other European countries or on Asian examples.

The most glaring difference is that there is no Paris in Germany. Ile-de-France has about 20% of France’s population, and is far and away the richest region, concentrating all the important corporate headquarters, basing its economy not on a specific industry but on its status as France’s primate city. Germany has nothing like this. The largest single-core metropolitan region here is Berlin, which at 5 million people is around 6% of national population. Moreover, cities are somewhat economically specialized, so the wealth of the richest cities is split across Munich’s heavy industry, Frankfurt’s finance, and so on.

Supposedly, this makes high-speed rail a poorer fit for Germany – there’s no Paris to just connect to every other city. But in reality, a high-speed rail network would still connect all the major cities: Berlin, Hamburg, Hanover, Bremen, the Rhine-Ruhr complex, Dresden, Leipzig, Frankfurt, Nuremberg, Mannheim, Munich, Stuttgart, Karlsruhe. Some of the smaller cities, like Erfurt and Fulda, happen to lie on lines between larger cities and are already connected, just not at as high a speed since German high-speed lines almost always have long legacy segments with a top speed of 160 km/h or even less.

And once all the cities are included, Germany turns into better geography for high-speed rail than France. Precise numbers depend on definitions, but around half of the German population lives in the above-listed 13 metropolitan areas of at least 1 million. In France, it’s only one third, and the median French person lives in a metro area of about 350,000; TGVs are thus forced to spend much of their running time on classical lines at low speed to reach cities like Grenoble and Saint-Etienne, and even some larger cities including Nantes, Toulon, Nice, and Toulouse are not on LGVs.

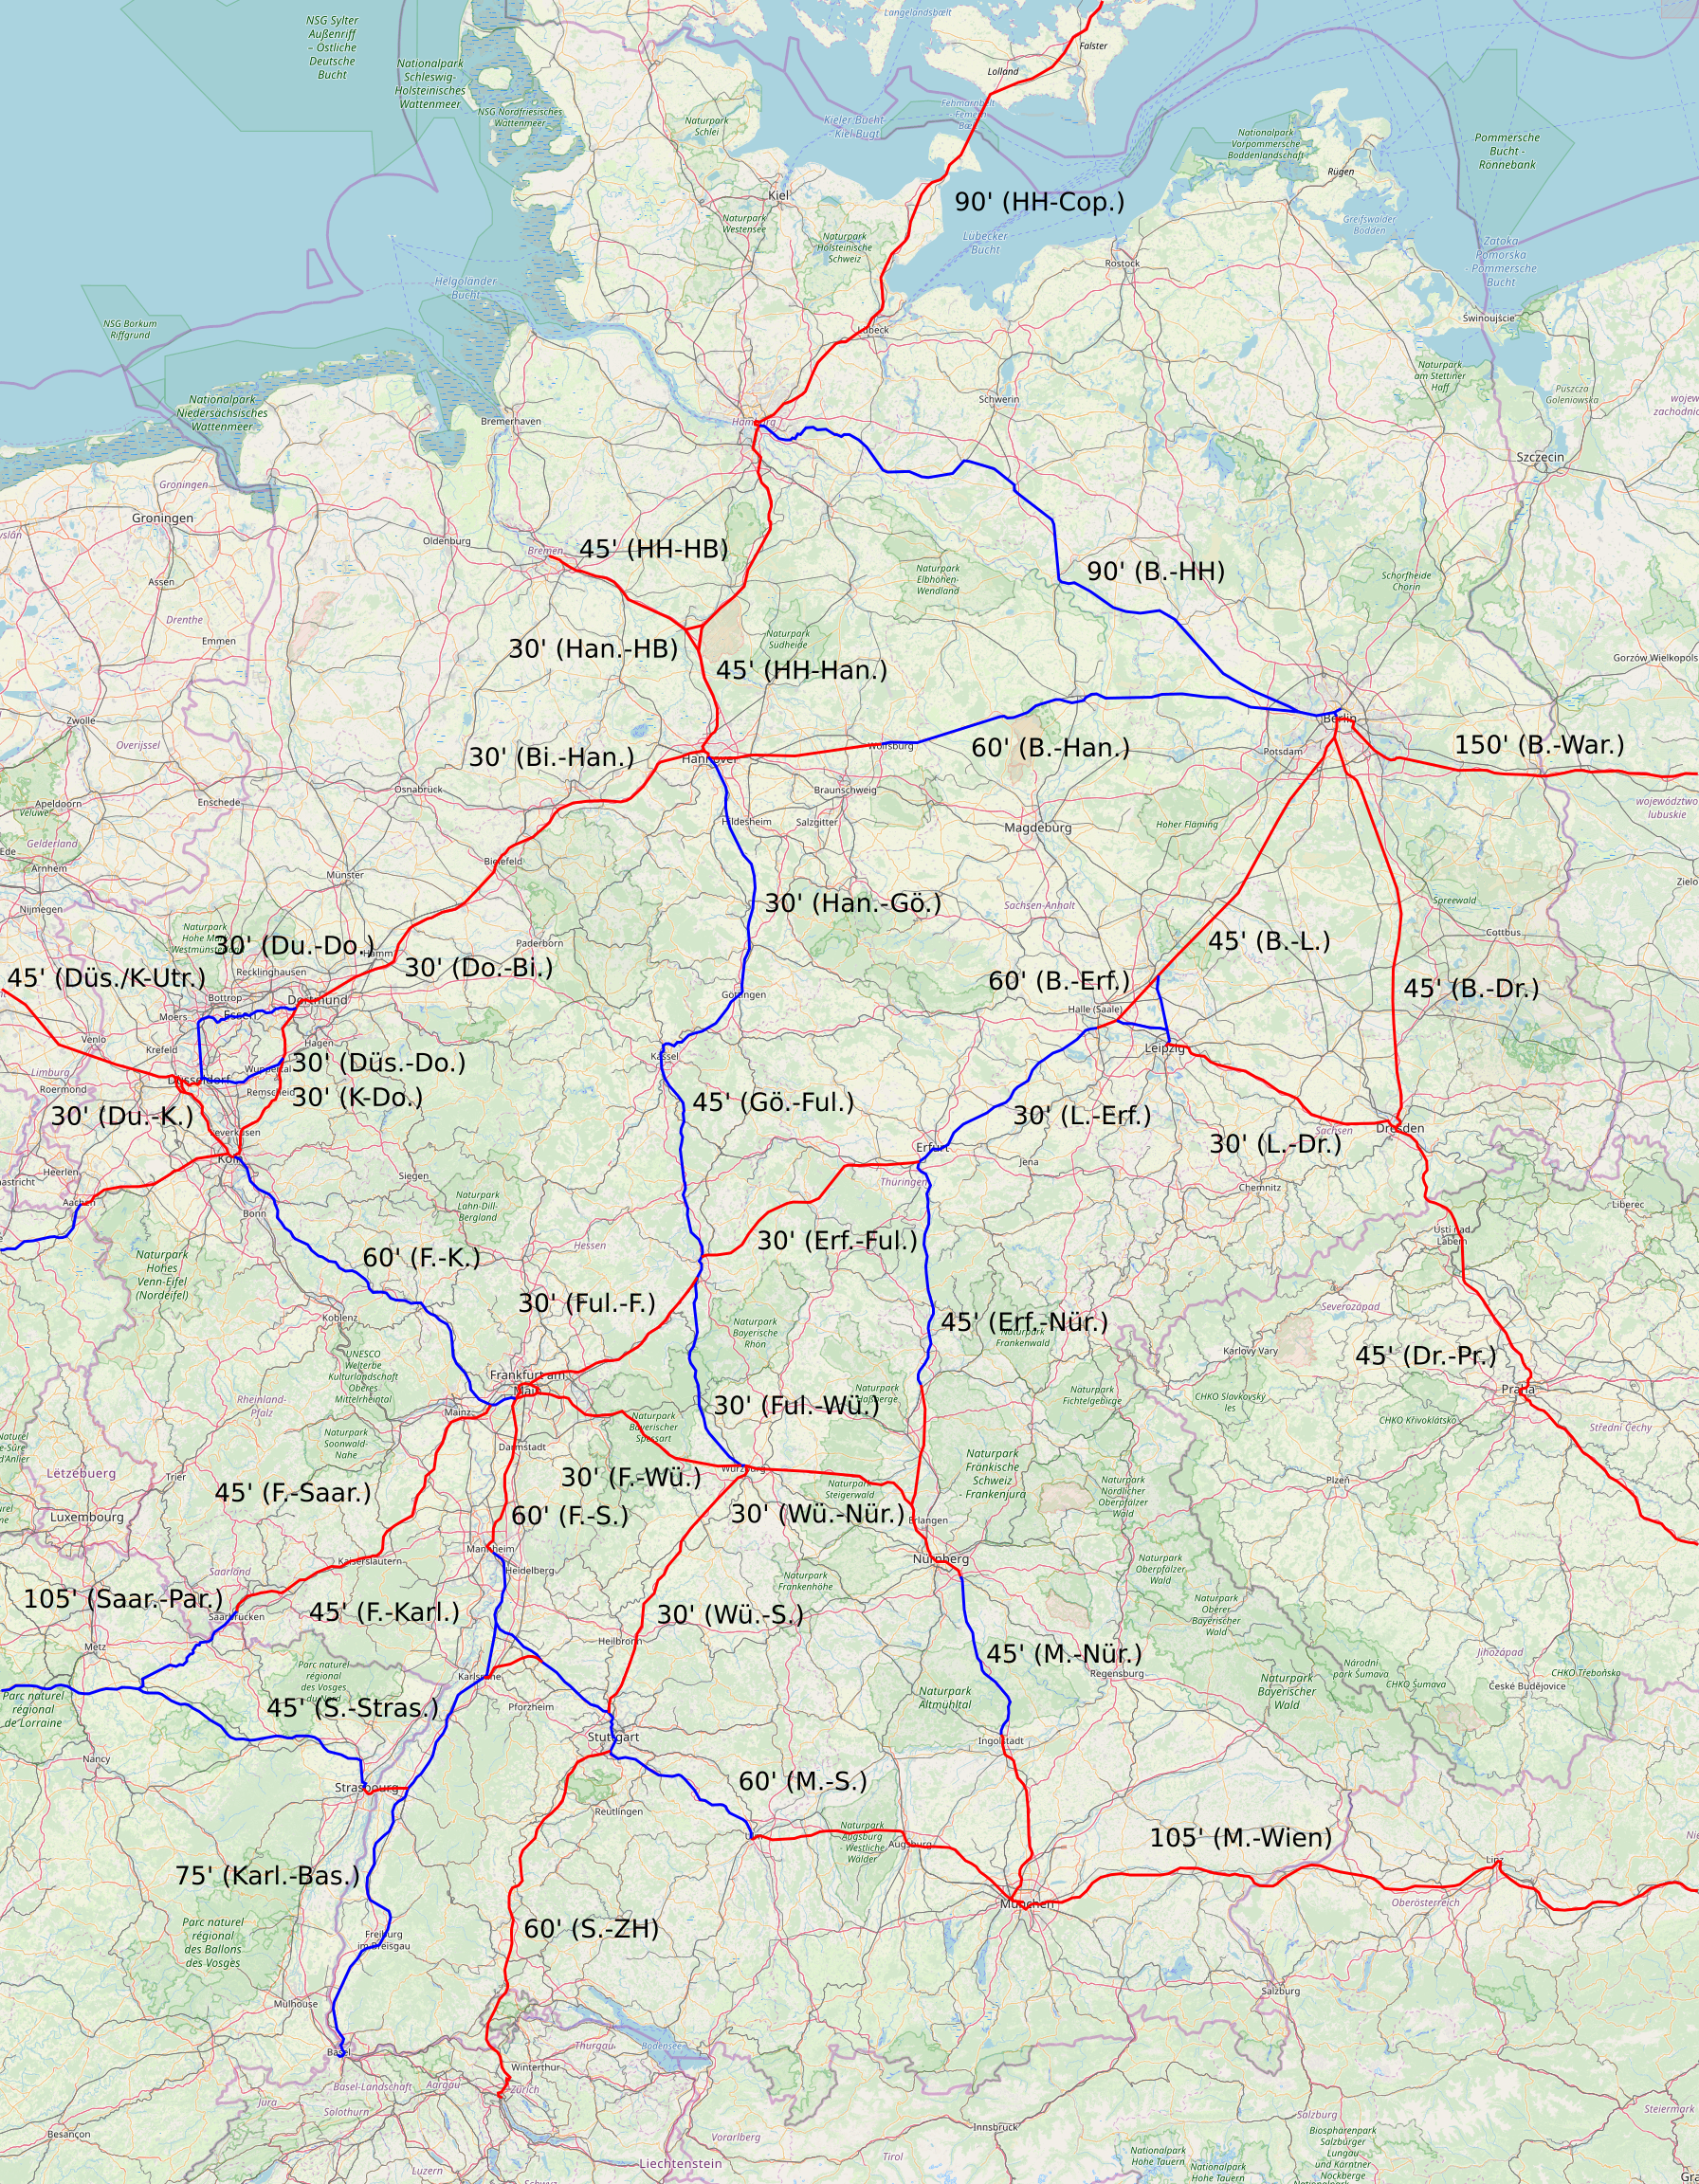
High-speed rail and connectivity

Blue lines preexist or are under construction, red lines should be built new

In the above map, the trip times are very aggressive – Berlin-Hanover in an hour is doable nonstop but barely and the sort of advocates who think train performance levels are still stuck in the 1990s may think it is impossible to do better than 1:30. But the 2020s are not the 1990s, thankfully.

The important thing to note is that not only does it connect all major city pairs, but also there is no alternative that has that feature. The Deutschlandtakt without further investments in speed connects Berlin and Munich in 4 hours, which is borderline for high-speed rail; in Cascetta-Coppola, the elasticity of ridership with respect to travel time in Italy ranges between -2.2 and -1.6, so going from 4 hours to 2.5 more than doubles ridership, for less cost than it’s taken to get to 4 hours so far since Germany has built the hardest segment first and much of what remains is in the pancake-flat North German Plain. With high-speed rail, the longest distance between two major cities, Hamburg-Munich, is 3:45, compared with 5:20 in the D-takt.

This also cascades to the roughly half of Germany that lives outside the metropolitan areas. A smaller city like Rostock, Münster, Regensburg, or Halle gets a connection to the national network either way; the D-takt actually only gives Rostock and Regensburg two-hourly rather than hourly connections to the nearest major node. It takes an hour under the D-takt to get between Regensburg and Nuremberg; the connections between Regensburg and the rest of the country depend primarily on how fast trains are between Nuremberg and the other million-plus urban areas.

Germany benefits from having centrally-located train stations everywhere, making transfers already easier than in France, where Paris has four distinct TGV terminals. Getting between two Parisian stations’ lines requires using a bypass, on which trains run at low frequency, at best stopping at Marne-la-Vallée and CDG, both 30 km from city center. In contrast, Germany train stations are set up for through service except Frankfurt, which is about to get an announcement for a through-service tunnel. To the extent that any bypasses are needed here, they’re because a station’s tracks point the wrong way for some through-service, as in Cologne and (even after through-service opens) Frankfurt; in both cases there’s a convenient near-center station, that is Deutz within walking distance of Cologne Hbf and Frankfurt Airport 10 km from Hbf, and at any rate the lines would have far more demand if speeds between major cities rose to French levels, so the frequency wouldn’t suffer.

Polycentricity and high-speed rail

Polycentricity does not make high-speed rail an inappropriate choice for intercity transportation. It’s neutral, and the urban geography of Germany, in terms of density and city size, is conducive to such a network. The question at this point is not about building a single line like Paris-Lyon, but about completing the half-built system that Germany has, and at that scale, having many major cities is not a problem at all.

So why do German activists keep bringing up polycentricity? I have a few explanations, none legitimate:

  • Germans look down on France, and bring up the most glaring differences to justify not learning. I’ve spent more than a decade watching Americans make up the silliest reasons why they can’t learn from Europe, reasons that are often unrecognizable to a European (“American cities weren’t bombed in WW2” – but neither was Paris). The same is visible internally to Europe, where Germany will not learn from France or Southern Europe.
  • Polycentricity is a convenient excuse to morally elevate rural and pretend-rural life over the big city, a common romantic trope in an arc from 19th-century nationalism to the modern New Left. High-speed rail breaks this pretense: it centers the largest cities, and tells the rest that their participation in national transport comes from their connections to large cities, which the romantics find deeply immoral. For the same reason, the German New Left finds subways less moral than streetcars.
  • Older activists are stuck in the past, when they were younger. In the 1980s, European high-speed rail meant Paris-Lyon, and not the national TGV network. At the scale of Paris-Lyon, Germany’s lack of a Paris indeed weakens high-speed rail. But it’s not the 1980s anymore; at this point the question is about completing fast links like Hamburg-Hanover and Erfurt-Frankfurt, not building the first link. My impression is that younger Greens support high-speed rail more than older ones, who joined the party to express opposition to nuclear power rather than support for immigration.

Looking forward rather than backward, nothing in Germany’s urban geography is an obstacle to a connected high-speed rail network. With central stations and less of the population living in truly isolated rural and small-city communities, Germany can expect to greatly surpass any other Western intercity rail network if it builds high-speed rail, more than reaching DB’s pre-corona 250 million ridership target.

Are the FRA and European Operators Sabotaging Texas Central?

Texas Central is a planned high-speed rail system connecting Dallas with Houston, using turnkey Shinkansen technology and private funding. The trains to be used are lightweight Japanese-made N700s, with extremely good performance, and the operating paradigm is to be based on the Shinkansen, without any interface with legacy rail, even in city centers. However, there may still be some conflict with regulators over this, since American rail regulations, since 2018, have been based on European/UIC standards and not on Japanese ones, which are distinct and incompatible. This is supposed to be okay because there is no track sharing at all, the same model proposed by California High-Speed Rail before US regulations under the supervision of the FRA were realigned with UIC ones. And yet, there may be trouble.

None of this is news – these are documents from 2020. See for example here:

Some commenters asserted that FRA is exempting TCRR from any crashworthiness requirements so that the N700 series trainset technology could be imported. This assertion, however, is not supported by the requirements proposed in the NPRM, as FRA makes clear that its approach is to ensure that the trainset is safe for the environment in which it will operate. To this end, FRA is including additional requirements that are not inherent in the JRC approach to trainset structure design. These requirements include a dynamic collision scenario analysis that is designed to address the residual risks that could potentially exist within the TCRR operating environment.32Of particular note, in this instance, is the inclusion of the steel coil collision scenario outlined in § 299.403(c). Despite the safety record of JRC’s Tokaido Shinkansen system, FRA believes that the North American environment poses unique risks with respect to potential objects that might somehow enter the protected ROW, either by accident or on purpose. In this case, FRA believes that requiring dynamic collision scenario analysis using the 14,000-lbs steel coil scenario derived from existing requirements to protect against risks presented by grade crossings can serve as a conservative surrogate for potential hazards that might be present on the TCRR ROW (e.g., feral hogs, stray livestock, unauthorized disposal of refuse). With the inclusion of this dynamic collision scenario, and adaptations of existing U.S. requirements on emergency systems and fire safety, FRA believes it has reasonably addressed risks unique to the TCRR operating environment in a manner that appropriately considers crashworthiness and occupant protection standards for the operating environment intended, while at the same time keeping intact the service-proven nature of the equipment.

PDF-pp. 34-35

Of note, the FRA speaks of grade crossings on a line that has none, and demands trains to withstand the impact of a 6.35 ton steel ball that may be dropped from overpasses that do not exist.

This is likely malicious more than incompetent; advocates I know out of California suspect a specific unnamed staffer placed by Ed Rendell who is trying to sabotage the project. This may also involve some lobbying by European vendors, which constantly snipe at competitors within the American market, and even by individual consultants. California had a little bit of this, when competitors started spreading rumors that SNCF was a pro-Nazi organization, and even got some state legislators to make a testimonial bill designed to embarrass SNCF.

It’s a real danger of assuming that foreign public companies that behave responsibly at home will behave responsibly in your periphery. SNCF is subject to public pressure within France, which limits its ability to extract surplus out of riders; this pressure vanishes even right next to France, with majority-SNCF-owned services to Britain (Eurostar) and Belgium (Thalys), which charge considerably higher fares, let alone in the US. The same is true of the other vendors, really, and thus in Britain, franchises owned by EU state-owned railroads like SNCF, DB, and NS are unpopular. Outsourcing the state even to vendors with a track record of responsibility at home will not lead to responsible results, because such outsourcing is an admission that the American state is not capable of adequately overseeing such a project itself and therefore will not notice extravaganza.

Consultants and Railroaders Turn New Haven Line Investment Into Shelf Art

The state of Connecticut announced that a new report concerning investment in the New Haven Line is out. The report is damning to most involved, chief of all the Connecticut Department of Transportation for having such poor maintenance practices and high construction costs, and secondarily consultant AECOM for not finding more efficient construction methods and operating patterns, even though many readily exist in Europe.

What started out as an ambitious 30-30-30 proposal to reduce the New York-New Haven trip time to an hour, which is feasible without construction outside the right-of-way, turned into an $8-10 billion proposal to reduce trip times from today’s 2 hours by 25 minutes by 2035. This is shelf art: the costs are high enough and the benefits low enough that it’s unlikely the report will lead to any actionable improvement, and will thus adorn the shelves of CTDOT, AECOM, and the governor’s office. It goes without saying that people should be losing their jobs over this, especially CTDOT managers, who have a track record of ignorance and incuriosity. Instead of a consultant-driven process with few in-house planners, who aren’t even good at their jobs, CTDOT should staff up in-house, hiring people with a track record of success, which does not exist in the United States and thus requires reaching out to European, Japanese, and Korean agencies.

Maintenance costs and the state of good repair racket

I have a video I uploaded just before the report came out, explaining why the state of good repair (SOGR) concept has, since the late 1990s, been a racket permitting agencies to spend vast sums of money with nothing to show for it. The report inadvertently confirms this. The New Haven Line is four-track, but since the late 1990s it has never had all four tracks in service at the same time, as maintenance is done during the daytime with flagging rules slowing down the trains. Despite decades of work, the backlog does not shrink, and the slow zones are never removed, only replaced (see PDF-p. 7 of the report). The report in fact states (PDF-p. 8),

To accommodate regular maintenance as well as state-of-good-repair and normal replacement improvements, much of the four-track NHL typically operates with only three tracks.

Moreover, on PDF-p. 26, the overall renewal costs are stated as $700-900 million a year in the 2017-21 period. This includes rolling stock replacement, but the share of that is small, as it only includes 66 new M8 cars, a less than second-order item. It also includes track upgrades for CTRail, a program to run trains up to Hartford and Springfield, but those tracks preexist and renewal costs there are not too high. In effect, CTDOT is spending around $700 million annually on a system that, within the state, includes 385 single-track-km for Metro-North service and another 288 single-track-km on lines owned by Amtrak.

This is an insane renewal cost. In Germany, the Hanover-Würzburg NBS cost 640 million euros to do 30-year track renewal on, over a segment of 532 single-track-km – and the line is overall about 30% in tunnel. This includes new rails, concrete ties, and switches. The entire work is a 4-year project done in a few tranches of a few months each to limit the slowdowns, which are around 40 minutes, punctuated by periods of full service. In other words, CTDOT is likely spending more annually per track-km on a never-ending renewal program than DB is on a one-time program to be done once per generation.

A competent CTDOT would self-abnegate and become German (or Japanese, Spanish, French, Italian, etc.). It could for a few hundred million dollars renew the entirety of the New Haven Line and its branches, with track geometry machines setting the tracks to be fully superelevated and setting the ballast grade so as to improve drainage. With turnout replacement, all speed limits not coming from right-of-way geometry could be lifted, with the possible exception of some light limits on the movable bridges. With a rebuild of the Grand Central ladder tracks and turnouts for perhaps $250,000 per switch (see e.g. Neustadt switches), trains could do New York-New Haven in about 1:03 making Amtrak stops and 1:27 making all present-day local stops from Stamford east.

Infrastructure-schedule integration

The incompetence of CTDOT and its consultants is not limited to capital planning. Operations are lacking as well. The best industry practice, coming from Switzerland, is to integrate the timetable with infrastructure and rolling stock planning. This is not done in this case.

On the contrary: the report recommends buying expensive dual-mode diesel locomotives for through-service from the unelectrified branches instead of electrifying them, which could be done for maybe $150 million (the Danbury Branch was once electrified and still has masts, but no wires). The lifecycle costs of electric trains are half those of diesel trains, and this is especially important when there is a long electrified trunk line with branches coming out of it. Dual-mode locomotives are a pantomime of low electrification operating costs, since they have high acquisition costs and poor performance even in electric mode as they are not multiple-units. Without electrification, the best long-term recommendation is to shut down service on these two branches, in light of high maintenance and operating costs.

The choice of coaches is equally bad. The report looks at bilevels, which are a bad idea in general, but then adds to the badness by proposing expensive catenary modifications (PDF-p. 35). In fact, bilevel European trains exist that clear the lowest bridge, such as the KISS, and those are legal on American tracks now, even if Metro-North is unaware.

The schedule pattern is erratic as well. Penn Station Access will soon permit service to both Grand Central and Penn Station. And yet, there is no attempt to have a clean schedule to both. There is no thought given to timed transfers at New Rochelle, connecting local and express trains going east with trains to Grand Central and Penn Station going west, in whichever cross-platform pattern is preferred.

The express patterns proposed are especially bad. The proposal for through-running to Philadelphia and Harrisburg (“NYX”) is neat, but it’s so poorly integrated with everything else it might as well not exist. Schedules are quoted in trains per day, for the NYX option and the GCX one to Grand Central, and in neither case do they run as frequently as hourly (PDF-p. 26). There is no specific schedule to the minute that the interested passenger may look at, nor any attempt at an off-peak clockface pattern.

Throw it in the trash

The desired rail investment plan for Connecticut, setting aside high-speed rail, is full electrification, plus track renewal to permit the elimination of non-geometric speed limits. It should cost around $1 billion one-time; the movable bridge replacements should be postponed as they are nice to have but not necessary, their proposed budgets are excessive, and some of their engineering depends on whether high-speed rail is built. The works on the New Haven Line are doable in a year or not much more – the four-year timeline on Hanover-Würzburg is intended to space out the flagging delays, but the existing New Haven Line is already on a permanent flagging delay. The trains should be entirely EMUs, initially the existing and under-order M8 fleet, and eventually new lightweight single-level trains. The schedule should have very few patterns, similar to today’s off-peak local and express trains with some of one (or both) pattern diverting to Penn Station; the express commuter trains should take around 1:30 and intercity trains perhaps 1:05. This is a straightforward project.

Instead, AECOM produced a proposal that costs 10 times as much, takes 10 times as long, and produces half the time savings. Throw it in the trash. It is bad, and the retired and working agency executives who are responsible for all of the underlying operating and capital assumptions should be dismissed for incompetence. The people who worked on the report and their sources who misinformed them should be ashamed for producing such a shoddy plan. Even mid-level planners in much of Europe could design a far better project, leaving the most experienced and senior engineers for truly difficult projects such as high-speed rail.

Quick Note: Deterioration of Speed

A regrettable feature of rail transport is that often, the speed of a line deteriorates over time after it opens or finishes a major upgrade. This can come from deferred maintenance or from proper maintenance that includes stricter speed limits or more timetable padding; in either case, it’s because maintaining the original schedule is not seen as a priority, and thus over time service degrades. In some cases, this can also include a deterioration of frequency over time, usually due to inattention.

This is not excusable behavior. The networks where this feature exists, including the US, France, and Germany, are not better-run than the Shinkansen, where I have not seen any such deterioration of Shinkansen speed in many years of poking around timetables on Hyperdia, or the system in Switzerland. Switzerland’s timed transfers make it impossible for gradual deterioration of speed to accumulate – trains are scheduled to just make connections to other trains at major nodes, and so if they slow down too much then they can’t make the transfers and the entire network degrades.

I wish I could say degradation is a purely American phenomenon. It’s very common in the United States, certainly – on the subway in New York the deterioration made citywide news in 2017 (including one piece by me), on the trains between New York and New Haven the schedule is visibly slower now than it was in the late 2000s, on Amtrak the Northeast Corridor has degraded since the 2000s. Speed is not viewed as a priority in the US, and so there are always little excuses that add up, whether they’re flagging, the never ending State of Good Repair program on the New Haven Line under which at no point in the last 20-25 years have all four tracks been in service at the same time, or just inattention to reliability.

But no. France and Germany have had this as well. The TGV used to run between Paris and Marseille in 3:03 every two hours and in 3:06 every other hour; today I see a 3:04 itinerary every four hours and the rest start at 3:11. And here, the Berlin-Hamburg trains were timetabled at 1:30 in the mid-2000s, giving an average speed of 189 km/h, the highest in Germany even though the top speed is only 230 and not 300; the fastest itinerary I can find right now is 1:43, averaging only 165 km/h.

I stress that such deterioration does not have any benefits. It’s an illusory tradeoff. When New York chose to slow down the L trains’ braking rate as part of CBTC installation, this was not seen in reduced systemwide maintenance costs; speed just wasn’t a priority, so the brakes were derated. The 7 train, as I understand it, will instead speed up when CBTC comes online, a decision made under Andy Byford’s program to speed up service.

Nor has France saved anything out of the incremental slowdowns in TGV service. Operating costs are up, not down. The savings from slowdowns are on the illusory to microscopic spectrum, always trumped by increases in cost from other sources, for example the large increases in wages in the 2010s due to the cheminot strikes.

By far the greatest cost of speed is during construction. During operations, faster service means lower crew costs per km. This is where the Swiss maxim of running trains as fast as necessary comes from. This isn’t about derating trains’ acceleration – on the contrary, Switzerland procures high-performance trains. It’s about building the least amount of physical infrastructure required to maintain a desired timetable, and once the infrastructure is built, running that timetable.

Data is Overrated

Ten years ago I blogged that smartphones would not have a revolutionary effect on public transportation. I think the trend since then has vindicated me – routing apps have not had visible impact on ridership, whereas traditional investments in better service have. I bring this up because a brief conversation with an Israeli public transportation activist reminded me of how the British and American focus on data corrupts institutions elsewhere, to the point that people culturally cringe toward the generally wealthy UK and US and learn from them even on matters where they fail, that is public transportation.

What is data?

Data, in the context of transportation, is any information about how people travel or could travel. It is mostly collected through personal surveillance, whether by smartcard giving the agency exact origin and destination data linked to a specific person, or by a smartphone app doing same. It can also be collected from census data on travel, but the trend is to seek non-census sources and prefer surveillance apps for more granular information.

What are the uses of data?

Data can be used to plan networks more precisely. For examples, granular origin-destination data can be used to plan bus networks, time of day data can be used for schedule planning, and demographic crosstabs can be used to see whether there are patterns in ridership that require addressing (maybe people who don’t speak the language struggle with monthly passes?).

This can also be done in public, hence the fascination with open data. The idea behind open data is to some extent about transparency, but it’s adopted far more widely in places with poor general transparency, like the UK and US, than in places with good transparency, like Sweden. The justification in the US at least is less about informing the public and more about creating a pool of open data, like GTFS, that can be used for third-party apps, such include trip planners and next-bus apps, as well as for data visualization. The same data can also be used analytically, and thus for example TransitCenter has the Equity Dashboard showing unequal access by various demographic categories.

Has this worked?

Not really. An app showing me that the bus in Boston will not arrive for another 17 minutes is not going to make me ride the bus (I took a taxi that time; the public bus tracker was down but there was some dodgy third-party app). A schedule in which the bus shows up every 6 minutes without variation is.

Unsurprisingly to me, apps have made no difference in modal choice or in overall travel numbers. What visible effects there are come from the growth of TNCs, and even they have had a very small effect on overall mass transit ridership. This was surprising to other people – that post I wrote 10 years ago got a lot of criticism, and Reihan Salam dubbed it “bad Alon – backward-looking, dismissive – rather than good Alon – analytical.” But to me, it wasn’t even a particularly controversial claim. Innovating in an industry requires a lot of knowledge about where its current technological frontier is, and the sort of people pushing open data as the solution are, with few exceptions, incurious about recent success cases.

So that’s for apps. What about open data’s use for planning? That, too, is limited. I think Uday’s work showing how the Fairmount Line in Boston does provide as good job access as the subway is really good illustration of Boston’s transport planning failures. But it is less important to illustrate failure than to fix it. The planners who moved the Orange Line from black Roxbury to white Jamaica Plain didn’t need data; they needed to be fired for racism and replaced with people who don’t bustitute service to black neighborhoods. The Fairmount situation is likewise much less about data and more about a combination of racial sensitivity and understanding global (i.e. non-North American) best practices regarding mainline rail frequency.

Okay, so data is insufficient, but perhaps it’s necessary?

Nope. Important aspects of planning require either very coarse information, readily available not just from conventional present-day census sources but often also from the state of data analysis of the 1920s and 30s.

If anything, more recent (say, post-1970s) innovations in public transportation planning have made granular data less important rather than more important. The frequency-ridership spiral, not yet understood in the postwar era back when trips were CBD-centric and preexisting frequency was so high small cuts didn’t spiral, means that frequency must depend on minimum guidelines and not on granular time-of-day travel data. Changes in the nature of work also mean that split shifts are harder to sustain for the labor force now than then, which makes flat schedules better. In effect, how first-world rail transit works today is that costs depend almost entirely on the peak, and midday off-peak service is almost free to provide up to the point where it matches the peak.

Bus network redesigns have had a similar effect. Carlos Daganzo was adamant on not relying on current travel data in network redesign, because it only reveals how people travel today, not how people would travel on a redesigned network. It’s of course useful to know the major activity nodes, population density levels, etc., but matching origins to destinations is not useful.

At regional and intercity scale, the growth of integrated timed transfer networks is telling as well. The Swiss planner has no need for detailed surveillance app data to figure out how to precisely match where trains from St. Gallen, Biel, or Zug go and at what time. Instead, the national ITT system means trains run hourly with timed connections to everywhere; the decision of where the one-seat rides goes can be based on special patterns, but it’s a second-order effect. It’s not how Flixbus plans its service, but the modal splits of Switzerland are not achieved elsewhere in Europe, let alone in app-oriented North America.

Learning worst-industry practices

Britain and the US are complex, wealthy societies. London and New York also have high mass transit ridership, by virtue of size, and are globally familiar, especially given that they use English. It’s very easy to overlearn from them, to look at TfL’s open data and say “we want that,” even when the impact of such learning is limited. It’s harder to synthesize the real innovations in scheduling, signaling, fare payment, and construction.

It’s fortunate that there are parts of the world that don’t automatically think everything done in the core Anglosphere is the bee’s knees. Israel is among them – its idea of a normal country is pan-Western European – but even there it’s so easy to err and adopt worst industry practices just because of the cultural cachet of London and New York.

Best Practices Civil Service

I propose that transportation agencies hire people whose job is to keep abreast of global developments in the field and report on best practices.

Which agencies should do it?

Ideally, all urban ones. Very small ones should piggyback on large ones, or participate in metropolitan planning to increase the scale. National agencies could aid this by having their own larger offices, but each urban or metropolitan agency should keep a best practices expert for issues relevant to the specific local context.

How big should the team be?

Normally, only one person is required. A larger team may be necessary for language coverage. In Germany, one English-speaking person could interface with every agency in Europe – even in relatively monolingual places like Spain and Italy, enough experts speak English that it’s possible to work without learning the local language. However, East Asia is largely monolingual, and interfacing with experts in Japan, South Korea, Taiwan, and China is harder in English. Moreover, reading local debates and contracts should be done in the local language even in multilingual countries like the Netherlands and Sweden.

So since language coverage is needed, larger agencies should keep teams of sufficient size. It’s not possible to have full coverage, but, again, English is decent in a pinch. A team of about 5 should be fine, especially if the language coverage is random enough that nearby agencies are likely to only partially overlap; for example, if Berlin’s team includes a Japanese speaker and Hamburg’s includes a Chinese speaker, they can learn secondarily.

No large internal hierarchy is required. Not counting language issues, one person could do this. With full language accounting, as required for agencies the size of NYCT, TfL, or RATP, the team may have a director and a few reports, but the reports should still be paid as experienced professionals and have direct access to agency managers.

What are the team’s responsibilities?

  1. Keep abreast of global developments through reading trade publications, following media in relevant countries so as to know whether a proposed solution is locally considered a success or not, and keeping track of how relevant agencies introduce new technology.
  2. Go to international conferences to form horizontal relationships with peers and acquire more detailed knowledge of new methods, and follow up to discuss specifics with them.
  3. Connect local decisionmakers with peers elsewhere in order to discuss how to adapt outside innovations to the local social and political context.

Who should be hired?

People who are likely to have the required knowledge. Horizontal hiring from other agencies is especially valuable, especially agencies from other cultures, where existing hiring is less likely to happen. American agencies occasionally hire Brits and Canadians, so it’s valuable to hire people with Asian, Continental European, or Latin American agency experience for this team.

Such people tend to be mobile, and if they leave to another agency, that’s fine. Often, the most valuable thing is a person who one can email and ask “in Barcelona, how do you do maintenance on the Cercanías?” (and that’s a high-level question, there are more detailed questions at lower zoom level than our work on costs). A former employee who moved on to another agency is always going to remain such a point contact, provided they left on good terms.

To the extent high-wage countries underlearn from lower-wage ones, they have an easier time hiring this way. Junior engineers in Italy earn less than 2,000€/month after taxes; Northern European and American agencies can poach them with better pay.

What City of Neighborhoods?

Here is a table of New York community boards, with their employed resident and job counts, broken down by how many people live and work in the same community board and how many in the same borough:

BoroughCBEmp. res.In same borough%In CB%JobsFrom same borough%From CB %
Manhattan1386422940976.11%722118.69%3551536061817.07%2.03%
Manhattan2482673586574.31%572511.86%1831154159622.72%3.13%
Manhattan3754414964865.81%53717.12%574461286022.39%9.35%
Manhattan4662435086076.78%749411.31%2267474999622.05%3.31%
Manhattan5355392735076.96%1577044.37%104884223703622.60%1.50%
Manhattan6738205639076.39%807310.94%2175284579221.05%3.71%
Manhattan7988887288073.70%64736.55%807732183227.03%8.01%
Manhattan81033607774975.22%1149411.12%1509753592123.79%7.61%
Manhattan9503263245064.48%613312.19%564372055836.43%10.87%
Manhattan10598083703061.91%19213.21%27069658224.32%7.10%
Manhattan11544613298960.57%34656.36%597851385923.18%5.80%
Manhattan12887565399460.83%55856.29%422151119126.51%13.23%
Brooklyn1938582377125.33%1166912.43%950394370145.98%12.28%
Brooklyn2658431260519.14%48157.31%1681836106336.31%2.86%
Brooklyn3755502212429.28%24373.23%303751497149.29%8.02%
Brooklyn4530471336525.19%20373.84%20681880042.55%9.85%
Brooklyn5801842622432.70%41355.16%366921553742.34%11.27%
Brooklyn6596201285921.57%30605.13%446652382553.34%6.85%
Brooklyn7539122756051.12%41057.61%519851824135.09%7.90%
Brooklyn8501341332126.57%10172.03%14092787555.88%7.22%
Brooklyn9507981757534.60%24374.80%218751213455.47%11.14%
Brooklyn10601782108435.04%45647.58%268911471054.70%16.97%
Brooklyn11761933326843.66%65348.58%413842349156.76%15.79%
Brooklyn12674533535252.41%1492922.13%822745021261.03%18.15%
Brooklyn13418412041548.79%36858.81%311891757856.36%11.82%
Brooklyn14769183183741.39%42875.57%371032210859.59%11.55%
Brooklyn15675273280548.58%890913.19%513033266463.67%17.37%
Brooklyn16381471309934.34%8892.33%16258793248.79%5.47%
Brooklyn17746782978839.89%19932.67%231331154749.92%8.62%
Brooklyn18960694000941.65%51245.33%380472121355.75%13.47%
Queens11012881899118.75%70316.94%750982766736.84%9.36%
Queens2649751222918.82%34895.37%987293155531.96%3.53%
Queens3666031909828.67%29304.40%243031173748.29%12.06%
Queens4680521922128.24%27224.00%343471452042.27%7.93%
Queens5890742293725.75%59696.70%417151776742.59%14.31%
Queens6592481419423.96%42037.09%514132306244.86%8.17%
Queens71114243937235.34%1885616.92%961044940051.40%19.62%
Queens8662092103731.77%34135.15%372001773547.67%9.17%
Queens9683502217132.44%35435.18%360751664446.14%9.82%
Queens10570421939934.01%28555.01%18793939850.01%15.19%
Queens11518701760533.94%31456.06%326471620149.62%9.63%
Queens121026523666435.72%59915.84%416691987247.69%14.38%
Queens13955512813429.44%42324.43%468511848439.45%9.03%
Queens14463681253827.04%483710.43%20989974446.42%23.05%
Bronx140292882221.90%21515.34%381601507939.52%5.64%
Bronx220271491224.23%13956.88%286311171340.91%4.87%
Bronx331085743823.93%8362.69%16020646940.38%5.22%
Bronx4622331261920.28%20103.23%22887849137.10%8.78%
Bronx5526391130821.48%16883.21%18509860846.51%9.12%
Bronx632209781124.25%12573.90%21646853439.43%5.81%
Bronx7567701325623.35%28124.95%370471532841.37%7.59%
Bronx844353909320.50%27736.25%22587914340.48%12.28%
Bronx9715621674923.40%28463.98%23935993141.49%11.89%
Bronx10520051281324.64%28765.53%329781345640.80%8.72%
Bronx11479661321327.55%34767.25%414111859044.89%8.39%
Bronx12675971749925.89%27174.02%21584886241.06%12.59%
SI1801162048525.57%971912.13%408701872245.81%23.78%
SI2604861449823.97%754812.48%481362291547.60%15.68%
SI3722081987127.52%753210.43%253381322752.20%29.73%

Notes:

  1. The data uses the all-jobs filter on OnTheMap, which assigns a lot of public-sector jobs in the city to City Hall or Brooklyn Borough Hall. The actual number of workers in Brooklyn CB 2 is lower than stated, by perhaps 60,000. The definition of CBs also excludes a few parts of the city with jobs, including the airports. Finally, Marble Hill is in Manhattan but is in the Bronx CB 8; it is counted in Manhattan throughout in same-borough job counts but as part of the Bronx CB 8 in CB job and resident counts.
  2. Very few people work in the same community board they live in. Citywide, it’s 7.8%. The numbers are only high in Manhattan CB 5, which consists of Midtown and is so expensive to live in that people live there if they’re high-income commuters choosing a short walking commute. And yet, local politics is dominated by those 7.8%, who think owning a business near where they live makes them more moral than the rest of the city.
  3. Even working and living in the same borough is not that common, only 38.7% citywide. It’s only a majority in Manhattan and a bare majority in two Outer Borough CBs, Brooklyn 7 and 12 (Sunset Park and Borough Park).
  4. Staten Island, which has a strong not-the-rest-of-the-city political identity, relies on the rest of the city’s economy. Only 25.8% of employed residents work within the borough, and 55.6% work in the other four boroughs, the remaining working in the suburbs. Slightly more Staten Island residents work in Manhattan than on Staten Island.
  5. The majority of people working in New York live outside the borough they work in, and this is true even excluding Manhattan, only 45.7% of outer-borough workers living in the borough they work in.
  6. The Bronx CB 2 is on net a job center and not a bedroom community, due to industrial jobs in Hunts Point.