Category: New York
Penn Station Tracks
In 2015, I argued that New York Penn Station should be replaced with a hole in the ground, and such a station would have sufficient capacity. I will defend those posts: in the 21st century, elaborate stations are not required for high-quality rail service, and it’s more important to have good passenger egress and intermodal connections than a signature station. The topic of this post is more niche: which rail lines should connect to Penn Station?
The three-line system
In all writing I’ve done on the subject since around 2010, I’ve assumed that Penn Station should be a three-line stations. In blog posts about regional rail for New York I’ve consistently called them Lines 1, 2, and 3; one map can be found in this post, with slightly less expansive version on Google Maps, and, consistently, Line 1 (red) is the existing Northeast Corridor, Line 2 (green) runs along the same route but uses the Gateway tunnel across the Hudson and then goes via Grand Central, and Line 3 (orange) connects the Empire Connection to the LIRR via a slightly realigned approach, otherwise using existing tracks.
At the station, their order from south to north is 2, 1, 3; the numbers are chronological (1 preexists, 2 is a higher priority to build than 3). Gateway is to enter Penn Station south of the existing tunnel and the room for a Grand Central connection is to the south (31st Street), forcing that line to be the southernmost. The East River Tunnels go under 32nd and 33rd, each as a track pair going in opposite directions rather than 32nd running eastbound and 33rd westbound, and the track pair under 33rd has a better connection to the LIRR while that under 32nd has a better connection across the Hudson; the Empire Connection loops under the Hudson tunnel to connect to southern tracks, but that’s a single-track link and needs to be doubled anyway, so it might as well be realigned.
With three lines and six approach tracks, Penn Station should have 12 platform tracks: each approach track should split into two and the two tracks should serve the same platform, a solution used for the expensive but operationally sound Stuttgart 21 project. There should not be any flexibility, save perhaps some emergency crossovers at the station, not to be used in service: the required throughput is so extensive that such flexibility is fake, reducing capacity by almost as much as the full closure of a track.
The footprint of the station looks around 155 meters wide gross, or around 145 net, corresponding to 24 per platform. The total width of the tracks is 1.7 (track center to platform) plus 4.5 (distance between track centers; Shinkansen regulations say 4.3) plus around 2 if a safety zone between each track pair is desired, which is a total of about 8 meters. The platform width is then 24 – 8 = 16. If a heavy column between two tracks adjacent to different platforms is required, this adds about another meter to maintain the safety zones, for a total of 9, resulting in 15-meter platforms.
15-meter platforms are extremely wide. Châtelet-Les Halles’s RER A and B platforms are 17 meters, and are wider than necessary; they in contrast have insufficient vertical circulation at rush hour. At 15 meters, there’s room for six escalators per access point and possibly also a staircase; at 16, there’s definitely room for the staircase. Six escalators can run without any rush hour variation, always three up and three down, and would still clear a full train with many standees in a minute. I do not foresee any capacity problems at the station if it is built this way.
But this leads to the question: since the platforms are so oversize, perhaps it is useful to have more of them at lower width?
The four-line system
Penn Station could potentially serve not three lines but four. Right now it only has infrastructure for a line and a half, and with Gateway it would have one and two halves; even three looks like a generational project. But there’s good cause to think even farther ahead and make room for a fourth line: a dedicated intercity railway. The four-line system would maintain Lines 1, 2, and 3 as above, but then add an unnumbered line with no regional trains, only intercity train.
This comes out of my ridership model for high-speed rail for the United States: at full buildout, the system would be difficult to fit into an approach track with regional trains, and regional trains would only be able to run every 5 minutes or even worse, rather than every 2 or 2.5. Moreover, once high-speed rail exists on the Northeast Corridor, the return on investment on extensions is so great that it is likely that such extensions will happen. Politics make such extensions even more favorable: high-profile investment in the Northeast’s intercity rail and in New York is likely to lead to demand for such investment in other regions, regardless of the business case, and it is fortunate that the business case for such extensions is strong independently of the politics.
I presume that, from south to north, the platform order should be Line 2 eastbound, Line 2 westbound, intercity eastbound, Line 1 eastbound, Line 1 westbound, intercity westbound, Line 3 eastbound, Line 3 westbound. The problem here is that Penn Station’s footprint is only adjacent to three east-west streets, not four, and so the intercity tunnels have to duck under private property, and the best place for them going east is to act as 31.5th and 32.5th Streets. Using the existing tunnels and then displacing regional rail to new tunnels is also possible, but less desirable: the existing tunnels have small diameter, and so it’s easier to keep them lower-speed while the new tunnels get to be bigger and support 200 km/h while maintaining enough free air to avoid creating pressure problems in passengers’ ears.
Under this system, the existing footprint of Penn Station is wide enough for 18 meters gross per each of the eight platforms, or 10 meters net. This is not out of the question, and would ordinarily be completely fine: it’s enough for four escalators per access point, or three and a staircase. At Penn Station I am slightly squeamish purely because on Lines 1 and 3 it’s the only city center station, and thus more crowded than the usual for a regional train station.
But it’s possible to slightly widen the footprint. Under no circumstances should there be any digging past the footprint of 31st and 33rd Streets: the cost of construction under existing buildings is too high. Plans for demolishing the block between 30th and 31st Streets (Block 780) are in an advanced stage, related to both a real estate deal with Vornado and plans for Penn Station South expansion, but they are extraordinarily expensive (around $10 billion at this point), and redevelopment of the block is easier on firma than over rail tracks. For all intents and purposes, the maximum usable footprint is between the lot lines of 31st and 33rd, which is 175 meters gross, perhaps 160 net with some distance between the dig and the lot line.
With 160 net meters, there are 20 meters per platform with tracks, or 12 per platform alone. This is wide enough for anything: four escalators and a staircase fit, which has enough capacity (albeit with some compromises) with permanent escalator directionality and more than enough if escalators run three-and-one at rush hour.
The benefits of creating about two extra meters per platform should be weighed against the cost of adding to the footprint of Penn Station, which is not $10 billion but also not zero, and I don’t want to make pronouncements without seeing a reliable estimate. This also depends on the difficulty of building intercity rail tunnels under private property.
Coordinated planning
A coordinated Penn Station rebuild plan should be considered together with some plan for how to use those tracks. Infrastructure investment must always come with a precise service plan, with sample timetables to the minute shared with the public for democratic review.
The upshot is that Penn Station rebuild must come with a good idea of how much service the region expects to run. A high-speed rail plan argues in favor of the four-line system, provided the cost of the extra tunnels is reasonable (low-to-mid single-digit billions; $10 billion is far too high). Otherwise, the three-line system is better.
Radial Metro Design on Rivers
The most common and most useful design paradigm for an urban metro system is radial. Subway lines should be running across the city, passing through city center with transfers to other radial lines; larger cities can also support a circumferential line, or for the largest megacities (like Moscow) two, and unless there are multiple circumferentials, every pair of lines should intersect with a transfer. For example, here is Prague:

There are three lines, meeting in a Soviet triangle, running from one side of city center to the other. Together with an intact tramway network, this boosts Prague’s annual urban rail ridership to around 830 million a year, which is 310/capita, a figure that isn’t far lower than Tokyo’s and is higher than anywhere else I can think of.
But in some cities – but not Prague – there’s a kink in the radial design. For example, here’s Kyiv, with planned expansion:

The three existing lines form a perfect Soviet triangle. Line 4, Podilsko-Vyhurivska, is under construction and radial as well. And then there is the under-construction eastern extension of Line 3, Syretsko-Pecherska, looping back to meet Line 1 at Darnytsia. This is not standard radial design. But it’s fully understandable given the situation of Kyiv.
Kyiv has a division into left-bank and right-bank Kyiv. The Dnipro is, with islets included, 1-2 km wide, one of the widest rivers of Europe. There are few bridges. The main of the city is on the right bank, but left-bank Kyiv has its own independent center around Darnytsia, encouraged by the city’s development plan precisely because the river is such an obstacle.
The river division is not universal. Prague doesn’t quite have it – the Vltava is 160-200 m wide and there are many bridge crossings, so even though city center grew along the right bank, much of the near-center is on the left bank. The city is also hilly enough that there’s no coherent left- vs. right-bank identity, and the streetcar system is sufficient to connect left-bank neighborhoods with each other without passing through city center.
Conversely, London does have this division. Bank terms are not used there – one says North and South London – but the situation is the same, even though the Thames at 250 meters is not much wider than the Vltava, and has many crossings as well. Nonetheless, a South London identity exists, defined by paucity of river crossings to East London (but not to Central or West London), and by its own centers at Waterloo and London Bridge.
As a result, the radial Underground network forms a coherent sub-network in South London. Just as the Kyiv Metro is planned to feature a loop back on Line 3 in left-bank Kyiv starting 2023, London built the Victoria line to swerve east to cross each trunk of the Northern line twice, once in North London and once in South London, and the crossing with the main line at Stockwell is even cross-platform. Unfortunately, the South London crossing with the Battersea extension is without a transfer, a deliberate design decision made to reduce ridership and perhaps reduce crowding on the Vic.
Finally, New York should think explicitly in terms of right- and wrong-side parts of the city, the right side referring to city center, that is Manhattan. New York’s subway network is not radial, but the same principles apply just the same. There is a strong wrong-side identity for Brooklyn, and historically Downtown Brooklyn was a very large business center; today it remains near-tied with Long Island City for largest job center in the region outside Manhattan. Early-20th century designers did not think in such comparative terms but they understood that it was valuable to connect Brooklyn homes with Brooklyn jobs, and thus most subway lines in Brooklyn converge on Downtown Brooklyn, and only the J/M/Z and the L go directly from Williamsburg to Manhattan.
By a fluke, all four subway lines in Queens connect to Manhattan via Long Island City, the nearest neighborhood to Midtown. Thus, a business center emerged there, growing to rival Downtown Brooklyn; just as the city’s geography can create a subway network, the subway network can create the city’s geography.
Why is Princeton Trying to Downgrade the Dinky?
Regular users of the Northeast Corridor in New Jersey know that there is a short branch off the line serving Princeton. Mainline trains do not use it – they continue between New York and Trenton – but a two-car shuttle, affectionately called the Dinky, connects the city with the train station. Historically, this is because the Northeast Corridor in New Jersey is a then-high-speed rail cutoff from 1863, which cut off Princeton from the old line. Trains run back and forth, with timed connections between New York (but not Trenton) and Princeton.
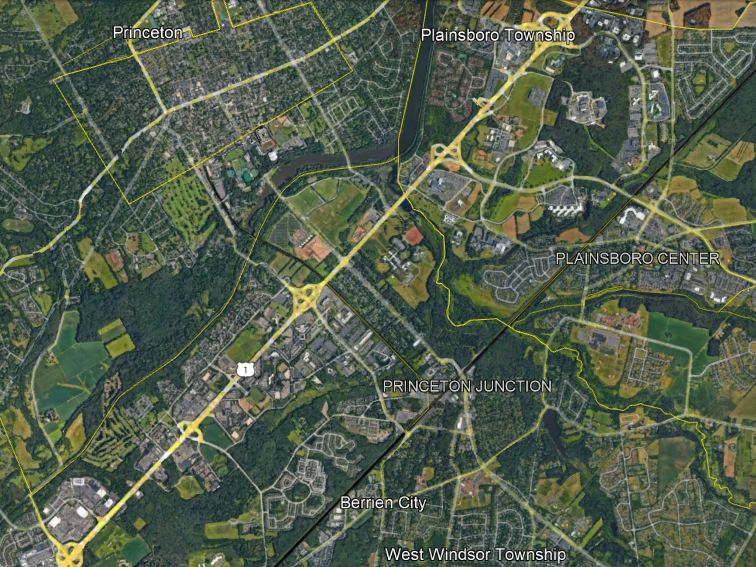
The Princeton stop on the Dinky, as can be seen in the satellite image, lies just outside the historic municipal limits of Princeton (since merged with the surrounding township). It serves the university fairly well, but is 800 meters at closest approach to the town’s main street, Nassau Street. So there has been a study for what to do to improve city access, in which a tram-train option was studied, looked good, and was dropped anyway. There are two options left: status quo, and a downgrade of the right-of-way to light rail with buses using the same corridor.
Unfortunately, transit advocates I respect, like Sandy Johnston, think the downgrade is an upgrade. So let me explain why in fact the light rail and bus option is inferior to current commuter rail operations.
The current use of the Dinky is as a connector to the Northeast Corridor. There is approximately nothing else at Princeton Junction: it’s one of the two busiest suburban stations in New Jersey, but like the other top station, Metropark, it’s a park-and-ride, designed exclusively for car-train interface. People who ride the Dinky do so to get to New York.
This means that the timed transfer with the mainline trains is critical. Frequency on the Dinky is irrelevant: all ridership from Princeton Junction into the town is going to be on the first train or bus after the mainline trains arrive, and almost all ridership to the junction is going to be on the last train that makes the connection. While frequency is not important except insofar as it matches that of the mainline, on-train capacity is important. My 2015 recollection is that off-peak ridership on the Dinky is maybe enough to fill an articulated bus (which New Jersey Transit only runs in Newark), maybe enough for a standard bus, depending on time of day – standees are likely, and standing on a bus is an awful passenger experience. At rush hour, the Dinky runs three-car trains (update 2022-2-18: no, it’s two-car trains) and they’re full.
The timed transfer is so important that the discussion of how to improve service must center how to make the transfer more efficient. The ideal improvement should be to regularize the timetable on the mainline commuter trains, and ensure that trains in opposite directions serve Princeton Junction around the same time (this is called a knot) so that the Dinky can connect to Trenton too, and even to Philadelphia with another timed transfer at Trenton or even through-service if that fits the New Jersey Transit and SEPTA schedules.
Sandy points out to me that while the Dinky only connects Princeton with the mainline, the right-of-way of the Dinky can serve more destinations – namely, the Route 1 job cluster, visible on the map as a line of office parks.
However, bus service from town to Route 1 is unlikely to succeed. It’s going to struggle to run sufficient frequency for what it needs, even as lower-frequency rail is sufficient for the Dinky’s current role:
- Route 1 is not on the way between town and the station – there would have to be separate buses to Route 1 from the service to the train station (which I presume will stay on rail even if the downgrade is picked). This means there’s no bundling of destinations – the buses to Route 1 have to live off of Princeton-Route 1 trips.
- Route 1 is a freeway with destinations located somewhat away, at automobile scale. Buses can stop on the side of the road but the walk is not great on the same side of the road and hostile and unsafe if crossing the road is required. A more pleasant experience is only possible if buses turn onto side roads, splitting frequency or increasing trip times.
- Route 1 is not a large job center. OnTheMap says that between the route of the Dinky and the junction with I-295 beyond the above satellite image, which ends at Quakerbridge Road, there are 21,000 jobs. The origins of those jobs are dispersed – only 5,000 come from within the county, and only 368 come from within Princeton.
- Conversely, the short distance traveled means that high frequency is crucial. A one-way trip from the townhouses just north of Nassau Street to the center of the Route 1 cluster along the right-of-way of the Dinky is 5.5 km, which at BRT and freeway speed is around 10 minutes one-way; a bus running less than once every 10 minutes might as well not run – but there is no chance for such a bus to fill at current demand.
Of course, the analysis of Route 1 assumes current development patterns stay with no or moderate change. A bigger change, such as greater development along Route 1 with sprawl repair, can make this option pencil out; O&D volumes need to rise by a factor of 3 assuming 100% transit modal split, or more if modal split is lower (which it invariably is, Route 1 is not Manhattan).
But then that raises the question – why engage in development in sprawl around a plan to downgrade a rail service?
If sprawl repair is plausible, then make Princeton more bikable and then set up bike lanes on Route 1 so that people can cycle to Route 1 jobs. The same bike lanes can also connect to the Dinky, with bike parking at the station, or even potentially at Princeton Junction if it’s faster to bike those 4 km than to ride a train and transfer. In the long run, all buses are going to have to be replaced by bikes anyway – bus operating costs are only going to go up.
And if redevelopment is plausible, look again at the satellite image and see what the land use at the existing train stations is like. Princeton is one of the most expensive places in the United States, and the Dinky station has a golf course on one side; that’s 0.5 km^2 of land, or, as I prefer to think of it, 50,000 housing units. Another 0.05 km^2 consists of parking lots right near the station, and can and should be redeveloped as a town center extension for a population that can swamp the existing town population by a factor of 4. The parking lots at Princeton Junction and the undeveloped land between them are another 0.4 km^2 of prime real estate.
In general, I cannot think of any railway where service would be improved by a downgrade from mainline rail to bus. But the Dinky has specific issues making such a downgrade especially deleterious for current users, namely the need for a timed connection, while the proposed source of new trips, namely Route 1, is too weak to be worth much. Thankfully, a no-build option keeping the status quo is still under consideration, and I hope that the region chooses it and invests in making the Dinky better rather than in replacing it.
The Interborough Study
I was excited about the idea of Interborough Express (IBX) as announced by New York Governor Kathy Hochul, and then last week her office released a preliminary report about the alternatives for it, and I got less excited. But it’s not that the study is bad, or that Hochul is bad. Rather, the study is a by the numbers alternatives analysis, shorter than the usual in a good way; its shortcomings are the shortcomings of all American planning.
The main rub is that the report looks at various options for the IBX route, broken down by mode. There’s a commuter rail option, which bakes in the usual bad assumption about commuter rail operations, including heavier trains (lighter trains are legal on US tracks as of 2018) and longer dwell times that are explained as a product of the heavier trains (dwell times have nothing to do with train mass). That’s par for the course – as we saw yesterday, everything that touches mainline rail in North America becomes stupid even in an otherwise understandable report.
But even excluding commuter rail, the study classifies the options by mode, focusing on bus rapid transit and light rail (and no subway, for some reason). It compares those two options and commuter rail on various measures like expected ridership and trip times. This is normal for American alternatives analyses for new corridors like IBX: they look at different modes as the main decision point.
This is also extraordinarily bad governance. There are some fundamental questions that are treated as afterthoughts, either not studied at all or mentioned briefly as 1-2 sentences:
- How far north should the line go? The IBX plan is to only go from Jackson Heights to the south, in contrast with older Triboro proposals going into the Bronx.
- What should the stop spacing be? The stops can be widely spaced, as in the current proposal, which stops mainly at intersection points with other lines, or more closely spaced, like an ordinary subway line.
- Under a light rail option, should the line be elevated where the trench is too narrow or at-grade?
- Should freight service be retained? What are the benefits of retaining freight rail service on the Bay Ridge Branch and what are the incremental costs of keeping it versus taking over the right-of-way?
- How large should the stations be?
- How frequent should the trains be? If freight service is retained, what frequencies are compatible with running freight on the same tracks for part or all of the line?
A better study must focus on these questions. Some of them, moreover, must be decided early: urban planning depends on whether the line goes into the Bronx or not; and industrial planning depends on what is done with freight service along the corridor.
Those questions, moreover, are more difficult than the modal question. A BRT option on a rail corridor without closely parallel arterial roads should be dismissed with the same ease that the study dismisses options not studied, and then the question of what kind of rail service to run is much less important than the scope of the project.
But American planning is obsessed with comparing public transit by mode rather than by corridor, scope, or any other aspect. Canadian planning has the same misfeature – the studies for the Broadway SkyTrain extension looked at various BRT and light rail options throughout, even though it was clear the answer was going to be SkyTrain, and omitted more fundamental questions regarding the cost-construction disruption tradeoff or even the scope of the project (the original studies from 2012 did not look at truncating to Arbutus, an option that had been talked about before and that would eventually happen due to cost overruns).
So overall, the IBX study is bad. But it is interestingly bad. Andrew Cuomo was a despicable governor who belongs in prison for his crimes. Less criminal and yet similarly loathsome people exist in American public transit. And yet, Hochul and her office are not like that, at all. This is not a sandbag, or a corrupt deal. It’s utterly ordinary in its failure; with all the unique failures of the Cuomo era stripped, what is left is standard American practice, written more clearly than is usual, and it just isn’t up to par as an analysis.
Hochul has been moving on this project very quickly, and good transit advocates should laud this. It should not take long to publish a report comparing alternatives on more fundamental questions than mode, such as scope, the role of freight, and the extent of civil infrastructure to be used. The costs and benefits of IBX heavily depend on the decisions made on such matters; they should not be brushed aside.
New York Publishes a Bad Benchmarking Report
I’ve grown to intensely dislike benchmarking reports. It’s not that the idea of benchmarking bad. It’s that they omit crucial information – namely, the name of the system that one is compared with. The indicators always have a wide variety of values, and not being able to match them with systems makes it impossible to do sanity-checks, such as noticing if systems with high costs per car-km are consistently ones that run shorter trains. This way, those anonymized reports turn into tools of obfuscation and excusemongering.
The MTA in New York recently published such a report, including both US-wide and international benchmarking for the subway as well as commuter rail. The US benchmarking is with comparable American systems – exactly the ones I’d compare, with the systems listed by name as NTD data is wisely not anonymized. The international benchmarking for the subway is with CoMET, which includes most of the larger global systems as well as a handful of smaller ones, like Vancouver; for commuter rail, it’s with ISBeRG, which has an odd list of systems, omitting the RER (which is counted in CoMET), all of Japan except JR East, and any S-Bahn, skipping down to Australian systems, Cape Town, and Barcelona.
That, by itself, makes much of the international benchmarking worthless. The standard metric for operating costs is per car-km. This is covered in pp. 8-9, showing that New York has fairly average costs excluding maintenance, but the second highest maintenance costs. But here’s the problem: I’m seeing a comparison to an undifferentiated mass of other systems. One of them is an outlier in maintenance costs, even ahead of New York, but I do not know which it is, which means that I cannot look at it and see what it does wrong – perhaps it has an unusually old fleet, perhaps it is small and lacks scale, perhaps it is domestically viewed as scandal-ridden.
Far more useful is to look at complete data by name. For example, JICA has complete operating cost data for Japanese metro systems. Its tables are complete enough that we can see, for example, that overall operating costs are around $5/car-km for all systems, regardless of scale; so scale should not be too important, or perhaps Tokyo’s wealth exactly cancels out the scale effect. There are, on table 2.37 on PDF-p. 117, headcounts for most systems from which we can impute labor efficiency directly, using train-km data on PDF-p. 254; Yokohama gets 1,072 train-hours a year per driver at 35 km/h (the rough average speed I get from Hyperdia).
And here’s the thing: without the ability to fill in missing data like average speed, or to look at things the report didn’t emphasize, the report is not useful to me, or to other independent researchers. It’s a statement of excuses for New York’s elevated operating and maintenance cost, with officious proclamations and intimidating numbers.
For example, here’s the excuse for high maintenance costs:
High maintenance costs for NYCT are largely attributable to 24-hour service. Most COMET peer agencies shut down every night, allowing for four hours of continuous daily maintenance. In comparison, NYCT subway’s 24-hour service requires maintenance to occur within 20-minute windows between late night trains, reducing work efficiencies. Additionally, maintenance costs for NYCT have risen recently to support the improvements as part of the Subway Action Plan, which have led to a significant improvement to on-time performance year over year since inception.
Okay, so here we’re seeing what starts like a reasonable explanation – New York doesn’t have regular nighttime maintenance windows. But the other American systems studied do and they’d be above global average too; Boston has regular nighttime work windows but still can’t consign all track maintenance to them, and has almost the same maintenance cost per car-km as New York. Moreover, track maintenance costs per car-km should feature extensive scale effects – only at freight rail loads is the marginal track wear caused by each additional car significant – and New York runs long trains.
Then there is the Subway Action Plan line, which is a pure excuse. Other systems do preventive maintenance too, thank you very much. New York is not unusually reliable by global standards, and the benchmarking report doesn’t investigate questions like mean distance between failures or some measure of the presence of slow restrictions – and because it is anonymized, independent researchers can’t use what it does have and get answers from other sources.
The study has a section on labor costs, showing New York’s are much higher than those of some peer cities. Thankfully, that part is not anonymized, which means I can look at the cities with overall labor costs that are comparable to New York’s, like London, and ignore the rest; New York’s construction labor costs are higher than London’s by a factor of about 2, despite roughly even regionwide average wages. Unfortunately, a key attribute is missing: labor efficiency. The JICA study does better, by listing precise headcounts; but here the information is not given, which means that drawing any conclusion that is not within the purview of MTA’s endless cold war on its unions is not possible. As it happens, I know that New York is overstaffed, but only from other sources, never anonymized.
It’s worse with commuter rail. First of all, at the level of benchmarking, the study’s list of comparisons is so incomplete and so skewed (three Australian systems, again) that nothing it shows can be relevant. And second, commuter rail in North America comes with its own internal backward-looking culture of insularity and incompetence.
The report even kneecaps itself by saying,
While it is true that benchmarking provides useful insights, it is also important to acknowledge that significant differences exist among the railroads that pose challenges for drawing apples-to-apples conclusions, particularly when it comes to comparisons with international peers. Differing local economies, prevailing wages and collective bargaining agreement provisions can have dramatic impacts on respective labor costs. Government mandates, including safety regulations, vary widely, and each railroad exists in a unique operating environment, often with different service schedules, geographic layouts and protocols. Together these factors have also have a significant impact on relative cost structures.
To translate from bureaucratic to plain English, what they’re saying is that American (and Canadian) practices for commuter rail are uniquely bad, but controlling for them, everything is fine. The report then lists the following excuses, all of which are wrong:
• Hours of Operation: LIRR provides 24 hours of service 7 days per week, and MNR provides 20-22 hours of service 7 days a week
• Ungated System: Neither LIRR nor MNR operate gated systems, therefore they require onboard fare validation/collection
• Branch Service: Both LIRR and MNR run service to and from a central business district (New York City) and do not have ability to offer through-running service
• Electrification: Both LIRR and MNR operate over both electrified and non-electrified territory, thereby requiring both electric and diesel fleets
It’s impressive how much fraud – or, more likely, wanton indifference and incuriosity – can fit into just four bullet points. Metro-North’s hours of service are long, but so are those of the JR East commuter lines; the Yamanote Line runs 20 hours a day, which means the nighttime maintenance window is shorter. Ungated systems use proof-of-payment ticketing throughout Europe – I don’t know if Rodalies de Catalunya runs driver-only trains, but the partly-gated RER and the ungated S-Bahns in the German-speaking world do. Through-running is a nice efficiency but not all systems have it, and in particular Melbourne has a one-way loop system akin to that of the Chicago L instead of through-running. Finally, electrification on the LIRR and Metro-North is extensive and while their diesel tails are very expensive, they also sometimes exist in Europe, including in London on a line that’s partly shared with the Underground, though I don’t know if they do in the report’s comparison cases.
The report does not question any of the usual assumptions of American mainline rail: that it must run unusually heavy vehicles, that it run with ticket-punching conductors, etc.
For a much more useful benchmarking, without anonymization, let’s look at German S-Bahns briefly. There is a list of the five largest systems – Berlin, Munich, Hamburg, Frankfurt, Stuttgart – with ridership and headcounts; some more detail about Berlin can be found here. Those five systems total 6,200 employees; the LIRR has 7,671 and Metro-North 6,773. With 2,875 employees, the Berlin S-Bahn has more train-hours than the LIRR, Metro-North, and New Jersey Transit combined; about as many car-km pro-rated to car length as the LIRR times 1.5; and more ridership than all American commuter rail systems combined. The LIRR in other words has more workers than the largest five German S-Bahns combined while the Berlin S-Bahn has more riders than all American commuter rail systems combined.
The excuses in the report highlight some of the reasons why – the US sticks to ticket-punching and buys high-maintenance trains compliant with obsolete regulations – but omits many more, including poor maintenance practices and inefficient scheduling of both trains and crew. But those are not justifications; they are a list of core practices of North American commuter rail that need to be eliminated, and if the workers and managers cannot part with them, then they should be laid off immediately.
Platform Edge Doors
In New York, a well-publicized homicide by pushing the victim onto the subway tracks created a conversation about platform edge doors, or PEDs; A Train of Thought even mentions this New York context, with photos from Singapore.

In Paris, the ongoing automation of the system involves installing PEDs. This is for a combination of safety and precision. For safety, unattended trains do not have drivers who would notice if a passenger fell onto the track. For precision, the same technology that lets trains run with a high level of automation, which includes driverless operations but not just, can also let the train arrive with meter-scale precision so that PEDs are viable. This means that we have a ready comparison for how much PEDs should cost.
The cost of M4 PEDs is 106 M€ for 29 stations, or 3.7M€ per station. The platforms are 90 meters long; New York’s are mostly twice as long, but some (on the 1-6) are only 70% longer. So, pro-rated to Parisian length, this should be around $10 million per station with two platform faces. Based on Vanshnook’s track map, there are 204 pairs of platform faces on the IRT, 187 on the IND (including the entire Culver Line), and 165 on the BMT (including Second Avenue Subway). So this should be about $5.5 billion, systemwide.
Here is what the MTA thinks it should cost. It projects $55 million per station – but the study is notable in looking for excuses not to do it. Instead of talking about PEDs, it talks about how they are infeasible, categorizing stations by what the excuse is. At the largest group, it is accessibility; PEDs improve accessibility, but such a big station project voids the grandfather clause in the Americans with Disabilities Act that permits New York to keep its system inaccessible (Berlin, of similar age, is approaching 100% accessible), and therefore the MTA does not do major station upgrades until it can extort ADA funding for them.
Then there is the excuse of pre-cast platforms. These are supposed to be structurally incapable of hosting PEDs; in reality, PEDs are present on a variety of platforms, including legacy ones that are similar to those of New York, for example in Paris. (Singapore was the first full-size heavy rail system to have PEDs – in fact it has full-height platform screen doors, or PSDs, at the underground stations – but there are later retrofits in Singapore, Paris, Shanghai, and other cities.)
The trains in New York do not have consistent door placement. The study surprisingly does not mention that as a major impediment, only a minor one – but at any rate, there are vertical doors for such situations.
So there is a solution to subway falls and suicides; it improves accessibility because of accidental falls, and full-height PSDs also reduce air cooling costs at stations. Unfortunately, for a combination of extreme construction costs and an agency that doesn’t really want to build things with its $50 billion capital plans, it will not happen while the agency and its political leaders remain as they are.
The New Triboro/Interboro Plan
Governor Kathy Hochul announced a policy package for New York, and, in between freeway widening projects, there is an item about the Triboro subway line, renamed Interboro and shortened to exclude the Bronx. The item is brief and leaves some important questions unanswered, and this is good – technical analysis should not be encumbered by prior political commitments made ex cathedra. Good transit advocates should support the program as it currently stands and push for swift design work to nail down the details of the project and ensure the decisions are sound.
What is Triboro?
The Bronx Times has a good overview, with maps. The original idea, from the RPA’s Third Regional Plan in the 1990s, was to use various disused or barely-used freight lines, such as the Bay Ridge Branch, to cobble together an orbital subway from Bay Ridge via East New York and Jackson Heights to Yankee Stadium. Only about a kilometer of greenfield tunnel would be needed, at the northern end.
In the Fourth Plan from the 2010s, this changed. The Fourth Plan Triboro was like PennDesign’s Crossboro idea, differing from the Third Plan Triboro in three ways: first, the stop spacing would be wider; second, the technology used would be commuter rail for mainline compatibility and not subway; and third, the Bronx routing would not follow disused tunnels (by then sealed) to Yankee Stadium but go along the Northeast Corridor to Coop City. Years ago, I’ve said that the Fourth Plan Triboro is worse than the Third Plan.
Unlike the RPA Triboro plans, Hochul’s Interboro plan only connects Brooklyn and Queens, running from Jackson Heights to the south. I do not know why, but believe this has to do with right-of-way constraints further north. The Queens-Bronx connection is on Hell Gate Bridge, which has three tracks and room for a fourth (which historically existed), of which Amtrak uses two and CSX uses one; having the service run to the Bronx is valuable but requires figuring out what to do about CSX and track-sharing. The Third Plan version ignored this, which is harder now, in part because freight traffic has increased from effectively zero in the 1990s to light today.
Stop spacing
The stop spacing in the governor’s plan appears to be more express, as in the Fourth Regional Plan, where the service is to run mostly nonstop between subway connections. In contrast, the Third Regional Plan called for regular stop spacing of 800 meters, in line with subway guidelines for new lines, including Second Avenue Subway.
I’m of two minds on this. We can look at formulas derived here in previous years for optimal stop spacing; the formulas are most commonly applied to buses (see here and follow first paragraph links), which can change their stop pattern more readily, but can equally be used for a subway.
The line’s circumferential characteristic gives it two special features, which argue in opposite directions on the issue of stop spacing. On the one hand, trips are likely to be short, because many people are going to use the line as a way of connecting between two subway spokes and those are for the most part placed relatively close to one another; farther-away connections such as end-to-end can be done on a radial line. But on the other hand, trips are not isotropic, because most riders are going to connect to a line, and the stronger the distinguished nodes are on a line, the longer the optimal interstation is.
On this, further research is required and multiple options should be studied. My suspicion is that on balance the longer stop spacing will prove correct, but it’s plausible that the shorter one is better. A hybrid may well be good too, especially in conjunction with a bus redesign ensuring the stops on the new rail link are aligned with bus trunks.
The issue of frequency
The line’s short-hop characteristic has an unambiguous implication about service: it must be very frequent. The average trip length along the line is likely to be short enough, on the order of 15 minutes, that even 10-minute waits are a drag on ridership. Nor is it possible to set up some system of timed transfers to 10-minute subway lines, first of all because the subway does not run on a clockface timetable, and second because the only transfers that could be cross-platform are to the L train.
This means that all-day frequency must be very high, on the order of a train every 5 minutes. This complicates any track-sharing arrangement, because the upper limit of frequency on shared track with trains that run any other pattern is a bit worse than this. The North London Line runs every 10 minutes and shares track with freight, and I believe there are some short shared segments in Switzerland up to a train every 7.5 minutes.
The upshot is that freight can’t run during normal operations. This is mostly fine, there are only 2-4 freight trains a day on the Bay Ridge Branch, where there are segments of the right-of-way that are only wide enough for two tracks, not four. This means if freight is to be retained, it has to run during light periods, such as 5 in the morning or 11 at night, when it’s more acceptable to run passenger trains every 10 minutes and not 5.
Institutional Issues: Dealing with Technological and Social Change
I’ve covered issues of procurement, professional oversight, transparency, and proactive regulations so far. Today I’m going to cover a related institutional issue, regarding sensitivity to change. It’s imperative for the state to solve the problems of tomorrow using the tools that it expects to have, rather than wallowing in the world of yesterday. To do this, the civil service and the political system both have to be sensitive to ongoing social, economic, and technological changes and change their focus accordingly.
Most of this is not directly relevant to construction costs, except when changes favor or disfavor certain engineering methods. Rather, sensitivity to change is useful for making better projects, running public transit on the alignments where demand is or will soon be high using tools that make it work optimally for the travel of today and tomorrow. Sometimes, it’s the same as what would have worked for the world of the middle of the 20th century; other times, it’s not, and then it’s important not to get too attached to nostalgia.
Yesterday’s problems
Bad institutions often produce governments that, through slowness and stasis, focus on solving yesterday’s problems. Good institutions do the opposite. This problem is muted on issues that do not change much from decade to decade, like the political debate over overall government spending levels on socioeconomic programs. But wherever technology or some important social aspect changes quickly, this problem can grow to the point that outdated governance looks ridiculous.
Climate change is a good example, because the relative magnitudes of its various components have shifted in the last 20 years. Across the developed world, transportation emissions are rising while electricity generation emissions are falling. In electricity generation, the costs of renewable energy have cratered to the point of being competitive from scratch with just the operating costs of fossil and nuclear power. Within renewable energy, the revolution has been in wind (more onshore than offshore) and utility-scale solar, not the rooftop panels beloved by the greens of last generation; compare Northern Europe’s wind installation rates with what seemed obvious just 10 years ago.
I bring this up because in the United States today, the left’s greatest effort is spent on the Build Back Better Act, which they portray as making the difference between climate catastrophe and a green future, and which focuses on the largely solved problem of electricity. Transportation, which overtook electricity as the United States’ largest source of emissions in the late 2010s, is shrugged off in the BBB, because the political system of 2021 relitigates the battles of 2009.
This slowness cascades to smaller technical issues and to the civil service. A slow civil service may mandate equity analyses that assume that the needs of discriminated-against groups are geographic – more transit service to black or working-class neighborhoods – because they were generations ago. Today, the situation is different, and the needs are non-geographic, but not all civil service systems are good at recognizing this.
The issue of TOD
Even when the problem is static, for example how to improve public transit, the solutions may change based on social and technological changes.
The most important today is the need to integrate transportation planning with land use planning better. Historically, this wasn’t done much – Metro-land is an important counterexample, but in general, before mass motorization, developers built apartments wherever the trains went and there was no need for public supervision. The situation changed in the middle of the 20th century with mass competition with the automobile, and thence the biggest successes involved some kind of transit-oriented development (TOD), built by the state like the Swedish Million Program projects in Stockholm County or by private developer-railroads like those of Japan. Today, the default system is TOD built by private developers on land released for high-density redevelopment near publicly-built subways.
Some of the details of TOD are themselves subject to technological and social change:
- Deindustrialization means that city centers are nice, and waterfronts are desirable residential areas. There is little difference between working- and middle-class destinations, except that city center jobs are somewhat disproportionately middle-class.
- Secondary centers have slowly been erased; in New York, examples of declining job centers include Newark, Downtown Brooklyn, and Jamaica.
- Conversely, there is job spillover from city center to near-center areas, which means that it’s important to allow for commercialization of near-center residential neighborhoods; Europe does this better than the United States, which is why at scale larger than a few blocks, European cities are more centralized than American ones, despite the prominent lack of supertall office towers. Positive New York examples include Long Island City and the Jersey City waterfront, both among the most pro-development parts of the region.
- Residential TOD tends to be spiky: very tall buildings near subway stations, shorter ones farther away. Historic construction was more uniformly mid-rise. I encourage the reader to go on some Google Earth or Streetview tourism of a late-20th century city like Tokyo or Taipei and compare its central residential areas with those of an early-20th century one like Paris or Berlin.
The ideal civil service on this issue is an amalgamation of things seen in democratic East Asia, much of Western and Central Europe, and even Canada. Paris and Stockholm are both pretty good about integrating development with public transit, but only in the suburbs, where they build tens of thousands of housing units near subway stations. In their central areas, they are too nostalgic to redevelop buildings or build high-rises even on undeveloped land. Tokyo, Seoul, and Taipei are better and more forward-looking.
Public transit for the future
Besides the issue of TOD, there are details of how public transportation is built and operated that change with the times. The changes are necessarily subtle – this is mature technology, and VC-funded businesspeople who think they’re going to disrupt the industry invariably fail. This makes the technology ideal for treatment by a civil service that evolves toward the future – but it has to evolve. The following failures are regrettably common:
- Overfocus on lines that were promised long ago. Some of those lines remain useful today, and some are underrated (like Berlin’s U8 extension to Märkisches Viertel, constantly put behind higher cost-per-rider extensions in the city’s priorities). But some exist out of pure inertia, like Second Avenue Subway phases 3-4, which violates two principles of good network design.
- Proposals that are pure nostalgia, like Amtrak-style intercity trains running 1-3 times per day at average speeds that would shame most of Eastern Europe. Such proposals try to fit to the urban geography of the world of yesterday. In Germany, the coalition’s opposition to investment in high-speed rail misses how in the 21st century, German urban geography is majority-big city, where a high-speed rail network would go.
- Indifference to recent news relevant to the technology. Much of the BART to San Jose cost blowout can still be avoided if the agency throws away the large-diameter single-bore solution, proposed years ago by people who had heard of its implementation in Barcelona on L9 but perhaps not of L9’s cost overruns, making it by far Spain’s most expensive subway. In Germany, the design of intercity rail around the capabilities of the trains of 25 years ago falls in this category as well; technology moves on and the ongoing investments here work much better if new trains are acquired based on the technology of the 2020s.
- Delay in implementation of easy technological fixes that have been demonstrated elsewhere. In a world with automatic train-mounted gap fillers, there is no excuse anywhere for gaps between trains and platforms that do not permit a wheelchair user to board the train unaided.
- Slow reaction time to academic research on best practices, which can cover issues from timetabling to construction methods to pricing to bus shelter.
Probably the most fundamental issue of sensitivity to social change is that of bus versus rail modal choice. Buses are labor-intensive and therefore lose value as the economy grows; the high-frequency grid of 1960s Toronto could not work at modern wages, hence the need to shift public transit from bus to rail as soon as possible. This in turn intersects with TOD, because TOD for short-stop surface transit looks uniformly mid-rise rather than spiky. The state needs to recognize this and think about bus-to-rail modal shift as a long-term goal based on the wages of the 21st century.
The swift state
In my Niskanen piece from earlier this year, I used the expression building back, quickly, and made references to acting swiftly and the swift state. I brought up the issue of speeding up the planning lead time, such as the environmental reviews, as a necessary component for improving infrastructure. This is one component of the swift state, alongside others:
- Fast reaction to new trends, in technology, where people travel, etc. Even in deeply NIMBY areas like most of the United States, change in urban geography is rapid: job centers shift, new cities that are less NIMBY grow (Nashville’s growth rates should matter to high-speed rail planning), and connections change over time.
- Fast rulemaking to solve problems as they emerge. This means that there should be fewer layers of review; a civil servant should be empowered to make small decisions, and even the largest decisions should be delegated to a small expert team, intersecting with my previous posts about civil service empowerment.
- Fast response time to civil complaints. It’s fine to ignore a nag who thinks their property values deserve state protection, but if people complain about noise, delays, slow service, poor UI, crime, or sexism or racism, take them seriously. Look for solutions immediately instead of expecting them to engage in complex nonprofit proof-of-work schemes to show that they are serious. The state works for the people, and not the other way around.
- Constant amendment of priorities based on changes in the rest of society. A state that wishes to fight climate change must be sensitive to what the most pressing sources of emissions are and deal with them. If you’re in a mature urban or national economy, and you’re not frustrating nostalgics who show you plans from the 1950s, you’re probably doing something wrong.
In all cases, it is critical to build using the methods of the world of today, aiming to serve the needs of the world of tomorrow. Those needs are fairly predictable, because public transit is not biotech and changes therein are nowhere near as revolutionary as mRNA and viral vector vaccines. But they are not the same as the needs of 60 years ago, and good institutions recognize this and base their budgetary and regulatory focus on what is relevant now and not what was relevant when color TVs were new.
Institutional Issues: Procurement
This is the start of a multi-post series, of undecided length, focusing on institutional, managerial, and sociopolitical issues that govern the quality of infrastructure. I expect much of the content to also appear in our upcoming construction costs report, with more examples, but this is a collation of the issues that I think are most pertinent at the current state of our work.
Moreover, in this and many posts in the series, the issues covered affect both price and quality. These are not in conflict: the same institutions that produce low construction costs also produce rigorous quality of infrastructure. The tradeoffs between cost and quality are elsewhere, in some (not all) aspects of engineering and planning.
The common theme of much (but not all) of this runs through procurement. It’s not as exciting as engineering or architecture or timetables – how many railfans write contracts and contracting regulations for fun? – but it’s fundamental to a large fraction of the difference in construction costs between different countries. Some of the subheadings in this post deserve full treatments by themselves later, and thus this writeup is best viewed as an introductory overview of how things tie together.
What is procurement?
Procurement covers all issues of how the state contracts with providers of goods and services. In the case of public transportation, these goods and services may include consulting services, planning, design, engineering, construction services, equipment, materials, and operating concessions. The providers are almost always private-sector, but they can also be public companies in some cases – for example, Milan Metro provides consulting services for other Italian cities and Delhi Metro does for other Indian ones, and state-owned companies like RATP, SNCF/Keolis, and DB/Arriva sometimes bid on private contracts abroad.
The contracting process can be efficient, or it can introduce inefficiencies into the system. In the worst case I know of, that of New York, procurement problems alone can double the cost of a contract, independently of any other issue of engineering, utilities, labor, or management quality. In contrast, low-cost examples lack any such inefficiencies in construction.
The issue of oversight
On the list of services that are procured, some are more commonly contracted out than others. Construction is as far as I can tell always bid out to private-sector competition, including equipment (nobody makes their own trains), materials, and physical construction. Design and engineering may be contracted out to consultants, depending on the system. Planning never is anywhere I know of, except some unusually high-cost American examples in which public-sector planning has been hollowed out.
The best practice from Southern Europe as well as Scandinavia is that planning and oversight always stay with the public sector. Even with highly privatized contracts, there’s active in-house oversight over the entire process.
The issue of competition
It is necessary to ensure there’s healthy competition between contractors. This requires casting as wide a net as possible. This is easier to do in environments where there is already extensive private- and public-sector construction going on: Turkey builds about 1 million dwellings a year and many bridges, highways, and rail lines, and therefore has a thick domestic market. In Turkish law, it is required that every public megaproject procurement get at least three distinct bids, or else it must be rebid. This rule is generally easy to satisfy in the domestic market.
But if the domestic market is not enough, it is necessary to go elsewhere. This is fine – foreign bidders are common where they are allowed to participate, always with local oversight. Turkish contractors in Northern Europe are increasingly common, following all of the local labor laws, often partnering with a domestic firm.
Old boy networks, in which contractors are required to have a preexisting relationship with the client, are destructive. They lead to groupthink and stagnation. A Turkish contractor held an Android in front of me and, describing work in Sweden, said, “If a Swede said it’s an iPhone, the Swedes would accept that it’s an iPhone, but if I did, they’d check, and see it’s an Android.” In Sweden at least the domestic system is functional, but in a high-cost environment, it is critical to look elsewhere and let foreigners outcompete domestic business.
It is even more important to make sure the experience of bidding on public contracts is positive. A competent contractor has a choice of clients, and a nightmare client will soon lose its business. Such a loss is triple. First, the contractor would have done a good job at an affordable price. Second, the negative experience, such as micromanagement or stalling, is likely to increase costs and reduce the quality of work. And third, the loss of any contractor reduces competition. In the United States, we have repeatedly heard this complaint from contractors and their representatives, that they always have to deal with the “agency factor,” where the agency can be the MTA or any other transit agency, making things difficult and leading to higher bids.
Good client-contractor relations
The issue of avoiding being a nightmare client deserves special scrutiny. It is critical for agencies to make sure to be pleasant clients. This includes any of the following principles:
- Do not change important regulations midway through the project. In Stockholm, the otherwise-good Nya Tunnelbana project has had cost overruns due to new environmental regulations that required disposal of waste rock to the standards of toxic waste, introducing new costs of transportation.
- Avoid difficult change order process (see below for more details on itemization). It should be everyone against the project, not the agency against the contractors or one contractor against another.
- Avoid any weird process or requirements. The RFPs should look like what successful international contractors are used to; this has been a recent problem of American rolling stock procurement, which has excessively long RFPs defining what a train is, rather than the most standard documents used in Europe. This rule is especially important for peripheral markets, such as the entire United States – the contractor knows what they’re doing better than you, so you should adapt to them.
- Require some experience and track record to evaluate a bid, but do not require local experience. A contractor with extensive foreign experience may still be valuable: Israel’s rail electrification went to such a contractor, SEMI, and the results are positive in the sense that the bid was well below expectations and the only problems stem from a nuisance lawsuit launched by a competitor that bid higher and felt entitled to the contract.
- For a complex contract, the best practice here is to have an in-house team score every proposal for technical merit and make that the primary determinant of the final score, not cost. Across most of the low- and medium-cost examples we have looked at, the technical score is 50-70% of the total and cost 30-50%.
- Do not micromanage. New York’s lowest bid rules lead to a thick book of regulations that force the bids to be as similar to one another as possible in quantity and type of goods, to the point of telling contractors what materials they are allowed to use. This is bad practice. Oversight should always be done with flexibility and competent in-house engineers working in conversation with the stakeholders and never with a long checklist of rules.
Flexibility
Contracts should permit as much flexibility as practical, to allow contractors to take advantage of circumstances for everyone’s benefits and get around problems. This is especially important for underground construction and for construction in a constrained city, where geotechnical surprises are inevitable.
Most of the English-speaking world, and some parts of the rest (Copenhagen, to some extent Grand Paris Express) interpret flexibility to mean design-build (DB) contracts, in which the same firm is given a large contract to both design a project and then build it. However, DB is not used in the lowest-cost examples I know of, and rarely in medium-cost ones. If design is contracted out, then there are almost always two contracts, in what is called design-bid-build (DBB). Sources in Sweden say they use single build contracts, but they often use consultants for supplementary engineering and thus they are in practice DBB; Italy is DBB; Turkish sources claim to do design-build, but in reality there are two contracts, one for 60% design and another for going to 100% and then doing construction.
The Turkish system is a good example of how to ensure flexibility. Because the construction contractor is responsible for the finalized (but not most) design, it is possible to make little changes as needed based on market or in-the-ground conditions. In Italy and Spain, the DBB system is traditional, but the building contractor is allowed to propose changes and the in-house oversight team will generally approve them; this is also how the more functional American DBB contracts work, typically for small projects such as individual train stations, which are within the oversight capacity of the existing in-house teams.
DBB can be done inflexibly – that is, wrong – and often when this happens, everyone gets a bitter taste and comes out with the impression that DB is superior. If the building contractor has to go through onerous process to vary from the design, or is excessively incentivized to follow the design to the letter, then problems will occur.
One example of inflexibility comes from Norway. Norwegian construction costs are generally low, but the Fornebu Line’s cost is around $200 million/km, which is not as low as some other Nordic lines. Norway uses DBB, but its liability system incentivizes rigidly adhering to the design: any defect in the construction is deemed to be the designer’s fault if the builder followed the design exactly but the builder’s fault if the builder made any variation. This means small changes do not occur, and then the design consultants engage in defensive design, rather than letting the building contractor see later what risks are likely based on meter-scale geology.
Itemization and change orders
Change orders, and defensive design therefor, are a huge source of cost overruns and acrimony. Moreover, because of the risks involved, any cost overruns are transmitted back into the overall budget – that is, every attempt to clamp down on overruns will just increase absolute costs, as bidders demand more money in risk compensation. California is infamous for the way change orders drive up costs. New York only avoids that by imposing large and growing risk on the bidders (including, recently, a counterproductive blacklisting system called disbarment, a misplaced effort by Andrew Cuomo to rein in cost overruns); the bidders respond by bidding much higher.
Instead of the above morass, contracts should be itemized rather than lump-sum. The costs of materials are determined by the global, national, and local markets, and the contractor has little control over them; in fact, one of the examples an American source gave me of functional change orders in a DBB system is that the bench at a train station can be made of wood, metal, or another material, depending on what costs the least when physical construction happens.
Labor costs depend on large-scale factors as well, including market conditions and union agreements. The use of union labor ensures that the wages and benefits of the workers are known in advance and therefore unit costs can be written into the contract easily. Spain essentially turns contracts into cost-plus: costs depend on items as bid and as required by inevitable changes, and there is a fixed profit rate based on a large amount of competition between different construction firms.
The upshot is that itemized costs prevent the need to individually negotiate changes. If difficult ground conditions or unexpected utilities slow down the work, the wages of the workers during the longer construction period are already known. It is especially important to avoid litigation and the threat thereof – questions of engineering should be resolved by engineers, not lawyers.
Here, our results, based on qualitative interviews with industry experts, mirror some quantitative work in economics, including Ryan and Bolotnyy-Vasserman. Itemization reduces risk because it pre-decides some of the disputes that may arise, and therefore the required profit rate to break even net of risk is lower, reducing overall cost.
The impact of bad procurement practices
One of our sources told us that procurement problems add up to a factor of 2 increase in New York construction costs. Five specific problems of roughly equal magnitude were identified:
- A regulation for minority- and woman-owned businesses (MWB), which none of the pre-qualified contractors in the old boy network is.
- The MTA factor.
- Change order risk.
- Disbarment risk.
- Profit in a low-competition environment.
MWB and disbarment are New York-specific, but the other three appear US-wide. In California, the change order risk is if anything worse, judging by routine cost overruns coming from change orders. California, moreover, is very rigid whenever a contractor suggests design improvements, as Dragados did for its share of California High-Speed Rail, even while giving contracts to contractors that engage in nuisance change orders like Tutor Perini.
Aligning American procurement practice with best practice is therefore likely to halve construction costs across the board, and substantially reduce equipment costs due to better competition and easier contractor-client relations.
The Other People’s Money Problem
I did a poll on Patreon about cost issues to write about. This is the winning option, with 12 votes; project- vs. budget-driven plans came second with 11 and I will blog about it soon, whereas neighborhood empowerment got 8.
OPM, or other people’s money, is a big impediment to cost reform. In this context, OPM refers to any external infusion of money, typically from a higher-level government from that controlling an agency. Any municipal or otherwise local agency, not able or willing to raise local taxes to fund itself, will look for external grants, for example in a federal budget. The situation then is that the federal grantor gives money but isn’t involved in the design of where the money goes to, leading to high costs.
OPM at ground level
Local and regional advocates love OPM. Whenever they want something, OPM lets them have it without thinking in terms of tradeoffs. Want a new piece of infrastructure, including everything the local community groups want, with labor-intensive methods that also pay the wages the unions hop for? OPM is for you.
This was a big problem for the Green Line Extension’s first iteration. Somerville made ridiculous demands for signature stations and even a bike path (“Somerville Community Path”) thrown in – and all of these weren’t jut extra scope but also especially expensive, since the funding came from elsewhere. The Community Path, a 3 km bike path, was budgeted at $100 million. The common refrain on this is “we don’t care, it’s federally funded.” Once there’s an outside infusion of money, there is no incentive to spend it prudently.
OPM modifying projects
In capital construction, OPM can furthermore lead to worse projects, designed to maximize OPM rather than benefits. Thus, not only are costs high, but also the results are deficient. In my experience talking to New Englanders, this takes the form of trying to vaguely connect to a politician’s set of petty priorities. If a politician wants something, the groups will try pitching a plan that is related to that something as a sales pitch. The system thus encourages advocates and local agencies to invest in buying politicians rather than in providing good service.
This kind of behavior can persist past the petty politician’s shelf life. To argue their cases, advocates sometimes claim that their pet project is a necessary component of the petty politician’s own priority. Then the petty politician leaves and is replaced by another, but by now, the two projects have been wedded in the public discourse, and woe betide any advocate or civil servant who suggests separating them. With a succession of petty politicians, each expressing interest in something else, an entire ecosystem of extras can develop, compromising design at every step while also raising costs.
The issue of efficiency
In the 1960s, the Toronto Transit Commission backed keeping a law requiring it to fund its operations out of fares. The reason was fear of surplus extraction: if it could receive subsidies, workers could use this as an excuse to demand higher wages and employment levels, and thus the subsidy would not go to more service. As it is, by 1971 this was untenable and the TTC started getting subsidies anyway, as rising market wages required it to keep up.
In New York, the outcome of the cycle of more subsidies and less efficiency is clearer. Kyle Kirschling’s thesis points out on PDF-p. 106 that New York City Transit’s predecessors, the IRT and BMT, had higher productivity measured in revenue car-km per employee in the 1930s than the subway has today. The system’s productivity fell from the late 1930s to 1980, and has risen since 1980 but (as of 2010) not yet to the 1930s peak. The city is one of a handful where subway trains have conductors; maintenance productivity is very low as well.
Instead of demanding efficiency, American transit advocates tend to demand even more OPM. Federal funding only goes to capital construction, not operations – but the people who run advocacy organizations today keep calling for federal funding to operations, indifferent to the impact OPM would have on any effort to increase efficiency and make organizations leaner. A well-meaning but harmful bill to break this dam has been proposed in the Senate; it should be withdrawn as soon as possible.
The difference between nudging and planning
I am soon going to go over this in more details, but, in brief, the disconnect between funding and oversight is not a universal feature of state funding of local priorities. In all unitary states we’ve investigated, there is state funding, and in Sweden it’s normal to mix state, county, and municipal funding. In that way, the US is not unique, despite its federal system (which at any case has far more federal involvement in transportation than Canada has).
Where the US is unique is that the Washington political establishment doesn’t really view itself as doing concrete planning. It instead opts for government by nudge. A federal agency makes some metrics, knowing that local and state bodies will game them, creating a competition for who can game the other side better. Active planning is shunned – the idea that the FTA should have engineers who can help design subways for New York is unthinkable. Federal plans for high-speed rail are created by hiring an external consultant to cobble together local demands rather than the publicly-driven top-down planning necessary for rail.
The same political advocates who want more money and care little for technical details also care little for oversight. They say “regulations are needed” or “we’ll come up with standards,” but never point to anything concrete: “money for bus shelter,” “money for subway accessibility,” “money for subway automation,” etc. Instead, in this mentality the role of federal funding is to be an open tab, in which every leakage and every abnormal cost is justified because it employed inherently-moral $80,000/year tradesmen or build something that organized groups of third-generation homeowners in an expensive city want. The politics is the project.
