Category: New York
Costs Per Rider and Willingness to Build
At the Transit Costs Project, we study the costs of urban rail lines per kilometer. This, with our usual controls, is a rough indicator of how efficient a city’s infrastructure construction program is. However, cost-effectiveness is different from efficiency, and is better measured not by just the cost but also the benefits, which are measured by ridership. Thus, cost-effectiveness is best measured by the cost of each project per rider. So what does it mean to compare different cities by their costs per rider, rather than per kilometer?
The answer is, “not much,” at least not as far as efficiency or good decisionmaking. In fact, while some projects persistently have costs per rider that are too high to be cost-effective (for example, it’s endemic to airport extensions), some cities have costs per rider that are too low, such as Berlin. The issue here is that if municipal or state decisionmaking is healthy, it will build cost-effective lines; if a line under discussion has a very high benefit-cost ratio, or equivalently a very low cost per rider, it means it should have been built long ago, and it speaks poorly to the local decisionmaking that it hasn’t been built already, as is unfortunately the case in Berlin.
Cost per rider and cost-effectiveness
As always, let’s start with Second Avenue Subway Phase 1, the project that launched my interest in construction costs and the Transit Costs Project writ large. The projected daily ridership is 202,000; the line came close to it in 2019, reaching about 163,000 (see data here; I’m taking boardings for the three new stations, adding the growth in ridership at Lexington/63rd, and multiplying by two to account for disembarkings), and would have likely reached projection by now but for the pandemic. The cost, in 2023 dollars, was $6.23 billion, or about $31,000 per projected weekday trip.
For another anchoring number, let’s use the Stockholm Metro’s entire construction from the 1940s to the 1970s. This is useful because in addition to costs per rider, there is a published ex post benefit-cost ratio, thanks to the work of Maria Börjesson. The cost of that system, in 2023 PPP dollars, was $3.7 billion, with a ridership of 1,265,900 per workday in 2019, or $2,900/rider, while the benefit-cost ratio is 6 without taking agglomeration into account, or 8.5 with. This does not mean that the value of a rider is only about $24,900; this was the value in the economic situation of postwar Sweden, a country that was substantially poorer than the Sweden of today. In 2023 PPP terms, Sweden’s GDP per capita in 1965, about midway through the opening of the original system, was about $19,400; today, Sweden is 3.5 times richer, and the US is 17% richer than Sweden.
The benefits of urban travel are largely proportional to GDP per capita. The economic benefits of agglomeration are proportional to the value of the economy writ large, and so are the benefits of reduced travel time, which in benefit-cost analyses are usually taken to be proportional to the average hourly wage. Conversely, the ability of a government to spend money on desired outcomes is proportional to its tax base, i.e. the size of its economy. All of this is approximate, but all we’re doing is first-order approximate analysis anyway, and so correcting for GDP per capita is valuable.
As it is, the difference between American and Swedish GDP per capita boils down entirely to working hours. Swedes work shorter hours than Americans, as they, like nearly everyone else in Europe, get much longer vacation time; as of 2022, Sweden’s GDP per hour worked was, by a rounding error, slightly higher than the US’s. However, at the same time, the daily ridership numbers for Sweden are specifically drawn from winter workday ridership, to avoid reporting figures from when ridership is lower during the summer vacation season, and the same is true for daily ridership counts in France. If we give Sweden and France credit by looking at ridership when people aren’t on vacation, we must compare the cost per rider with GDP per capita and not GDP per hour.
The upshot is that countries should be building metros up to a maximum capital cost per rider that’s about as large as their GDP per capita. The $24,900 computation for 1960s’ Sweden is ex post, and usually the ex ante benefit-cost ratio must be at least 1.2 or 1.3 for the project to go ahead due to risk. For light rail the allowable cost should be lower, and for bus projects it should be lower still, due to the higher lifetime operating costs; but for metros and metro-like urban rail projects (such as largely grade-separated light rail, or commuter rail tunnels like Citybanan), this analysis should hold. Second Avenue Subway Phase 1, which opened in a United States with a GDP of $73,300/capita in 2023 prices, is thus very cost-effective; Phase 2, budgeted at something like $70,000/rider in today’s prices, is marginal but makes it (in 2022, US GDP per capita in 2023 prices was $80,300).
Some more costs per rider
Our database of construction costs per km is largely complete, but we don’t have much ridership data. Worse, the costs per rider we do have have some biases. We have better information for the US and Canada than elsewhere, and for Europe than the rest of the non-North American world. Costs are also likeliest to be reported for megaprojects with notable delays or cost overruns and thus an incomplete database will be biased upward; large, international cities have better reporting in English than the rest and this introduces another upward bias in incomplete data (these are typically wealthy and therefore capable of affording a high cost per rider).
With that in mind, here are some (again, incomplete) examples:
- Crossrail cost $24 billion in 2023 PPP terms; ridership in late 2023 was 4.3 million a week, which is usually about 700,000/weekday, said to be above projections, with long-term projections rising to a million/weekday; on current ridership it’s $34,000/rider, and on future projections it’s $24,000.
- Paris Métro Line 14’s original section, opened by 2007, cost $2.44 billion in 2023 PPP terms; ridership in 2019, before more recent extensions and before corona, was 92 million, so around 320,000 per workday, which is $7,600/rider.
- Grand Paris Express was projected in 2021 to cost (in 2023 PPP dollars) around $65 billion, with a ridership projection of 2 million/day from 2022, and 2.3-2.4 million/day from 2012, for around $32,000/rider, or $28,000 if the older ridership projection is used.
- Milan Metro Line 5 cost $2.2 billion in 2023 PPP terms to date, and was said to carry 180,000 daily passengers in 2019, for $12,000/rider.
- Milan Metro Line 4 cost $2.63 billion, and was expected to carry 235,000 riders per day when complete, which would be $11,000/rider; it will be completed this year, but ridership so far is for only the half of the line that has opened so far ans is also still somewhat suffering from corona.
- The U-Bahn extensions in Berlin that are currently in development hell include U8 to Märkisches Viertel projected at 13,160€/rider (around $21,000 in 2023 PPP terms), a U6 extension to the former Tegel Airport projected at 27,200€/rider (around $43,000), and a U7 extension to the current BER airport projected at 23,000€/rider (around $36,000), among others brought up by the new coalition.
Willingness to build and Berlin’s problem
The above numbers should not be taken to mean that Italy and Germany are more cost-effective about metro construction. To the contrary, they indicate that they are leaving value on the table by not building.
Germany has a GDP per capita of $66,000 in PPP terms. The benefit-cost ratios of the U-Bahn extensions in Berlin that are being discussed but not actually brought forward and built are very high, and the U8 extension to Märkisches Viertel is scratching a ratio of 4. It is irresponsible that there isn’t a massive construction plan not just under discussion but in design and soon physical construction. This must include not just those lines but also others to be added until the benefit-cost ratio of the marginal line falls to slightly more than the minimum that deserves funding.
Italy has the same problem. No matter how pessimistic one’s view of the future of the economy of Italy is, the metro lines it is currently building, at least in Milan, are so cost-effective that there have to be more of them. In the 2010s, Italy was in a budget crunch and ended up using public-private partnerships to keep debt off-books, at very high implied interest rate based on the rate of payment to the concessionaire, about 8%. Today, fundamentally, even a stagnant economy with a GDP per capita of $55,000, which may finally overtake its 2007 peak this year, should be building more if the current extensive margin of Milan Metro construction is not even in the teens of thousands of dollars. Perhaps the benefit-cost ratios for Sweden rely not just on Sweden’s GDP per capita of the 1960s but on that of today, after 60 years of growth; but then even absent any of this growth, 55/3.5 > 12.
Paris showcases a healthier situation: the success of M14 endeared the region to driverless metros with longer interstations than the older metro lines but shorter ones than the RER, and with further growth in the region, the state decided to build the 200 km Grand Paris Express to improve circumferential rail service and add more fast radial connections from the suburbs to the city not along the RER. France’s GDP per capita is around $58,000 in PPP dollars; some elements of GPE may be marginal, but the project writ large has a solid benefit-cost-ratio starting with a 2.
Spain is like France in that when it can build, as it could before the Great Recession and as it can now after having recovered, it does. This is the right way to do it: low costs per km should translate to massive subway expansion. If you’re Madrid, you can build lines that would be completely ridiculous anywhere else in terms of land use, like MetroSur, because it’s cheap.
A Paris or Berlin cannot be so profligate as Madrid. Building a line like MetroSur here, which in the Spanish context looks silly but does pass cost-effectiveness muster, would be an economic albatross. But medium-cost cities can still cover most of the built-up area with subway and commuter rail lines; Paris is doing so but Berlin is not.
The problem for Berlin is not quite austerity, which afflicted Southern Europe last decade, producing negative economic growth. In the last coalition, it was the two most left-wing parties, the Greens and Die Linke, which opposed U-Bahn construction. In their view, trams are preferable; they complain about the high construction costs of subways, but don’t meaningfully engage with why they’re still necessary for fast urban transport beyond the range of the handful of inner neighborhoods where people vote for the Greens.
That said, in the current coalition, there’s no real political left. SPD is in it, but under an atypically conservative leader in Franziska Giffey, and the more left-wing faction in the party, including the youth league Jusos, is sidelined. Both parties in the coalition, CDU and SPD, are committed to building those U-Bahn extensions. But then nothing is happening; Giffey is not competent enough to do it, and CDU is too wrapped up in anti-environmental populism to do something that pisses off some environmentalists but makes others happy.
This way, the low costs per rider projected for Berlin U-Bahn expansion are not a testimony to cost-effectiveness. They’re a testimony to political unwillingness to build, for largely petty reasons. It is wasteful to build a subway line with a very high projected cost per rider relative to the country’s wealth, but it is equally wasteful not to build one with a low projected cost per rider, and the latter is what is happening in Berlin, unfortunately.
The Need for Ample Zoning Capacity
An article by Vishaan Chakrabarti in last month’s New York Times about how to make room for a million more people in New York reminded me of something that YIMBY blogs a decade ago were talking about, regarding zoning capacity. Chakrabarti has an outline of where it’s possible to add housing under the constraints that it must be within walking distance of the subway, commuter rail, or Staten Island Railway, and that it must be of similar height to the preexisting character of the neighborhood. With these constraints, it’s possible to find empty lots, parking lots, disused industrial sites, and (in near-Midtown Manhattan) office buildings for conversion, allowing adding about half a million dwellings in the city. It’s a good exercise – and it’s a great explanation for why those constraints, together, make it impossible to add a meaningful quantity of housing. Transit-oriented development successes go far beyond these constraints and build to much higher density than is typical in their local areas, which can be mid-rise (in Europe) or high-rise (in Canada and Asia).
The issue with the proposal is that in practice, not all developable sites get developed. The reasons for this can include any of the following:
- The parcel owner can’t secure capital because of market conditions or because of the owner’s particular situation.
- The parcel is underdeveloped but not empty, and the owner chooses not to redevelop, for a personal or other reason.
- The area is not in demand, as is likely the case near the Staten Island Railway or commuter rail stations in Eastern Queens, or in much of the Bronx.
- The area is so auto-oriented, even if it is technically near a station, that prospective buyers (and banks) demand parking, reducing density.
New York has, on 2020 census numbers, 8.8 million people; 1 million additional New Yorkers is 11% more people. Cities that permit a lot of housing have an envelope for much more than 11% extra population. In New York’s history, it was computed in 1956 that under the then-current 1916 zoning code, the city’s zoned capacity was 55 million people, but under the proposed code that would be enacted in 1961, the zoned capacity would fall to 12 million. In Los Angeles, The Homeowner Revolution makes the point (on PDF-page 19) that in 1960, zoned capacity was 10 million in the city proper, four times the city’s population, but by 1990 it fell to 3.9 million, 11% more than the city’s population.

Technically, the same extra zoned capacity that Chakrabarti finds for New York has existed in Los Angeles for a generation. In practice, for all the above reasons why development never reaches 100% of capacity even in expensive areas, Los Angeles builds very little housing, and rents are very high, perhaps comparable to those of New York even as wages are much lower.
What this means is that the way forward for any transit-oriented development plan has to get out of the mentality that the buildings need to be of similar size to the existing character of the neighborhood. This constraint is too strict, and not at all observed in any successful example that I know of.
To Americans, the most accessible example of transit-oriented development success is Vancouver; some sections of the Washington suburbs (especially Arlington) qualify as well, but the extent there is much less than in Canada, and consequently ridership on Washington Metro has lagged that of its Canadian counterparts. In Vancouver, the rule that Chakrabarti imposes that the preexisting parcels must be empty or nonresidential is largely observed – as far as I can tell, the city has not upzoned low-density residential areas near SkyTrain, and even in Burnaby, the bulk of redevelopment has been in nonresidential areas.
The redevelopment in Vancouver proper looks like this:

And here is Metrotown, Burnaby:

The surface parking may look obnoxious to urbanists, but the area has more jobs, retail, and housing than the parking lots can admit, and the modal split is very high.
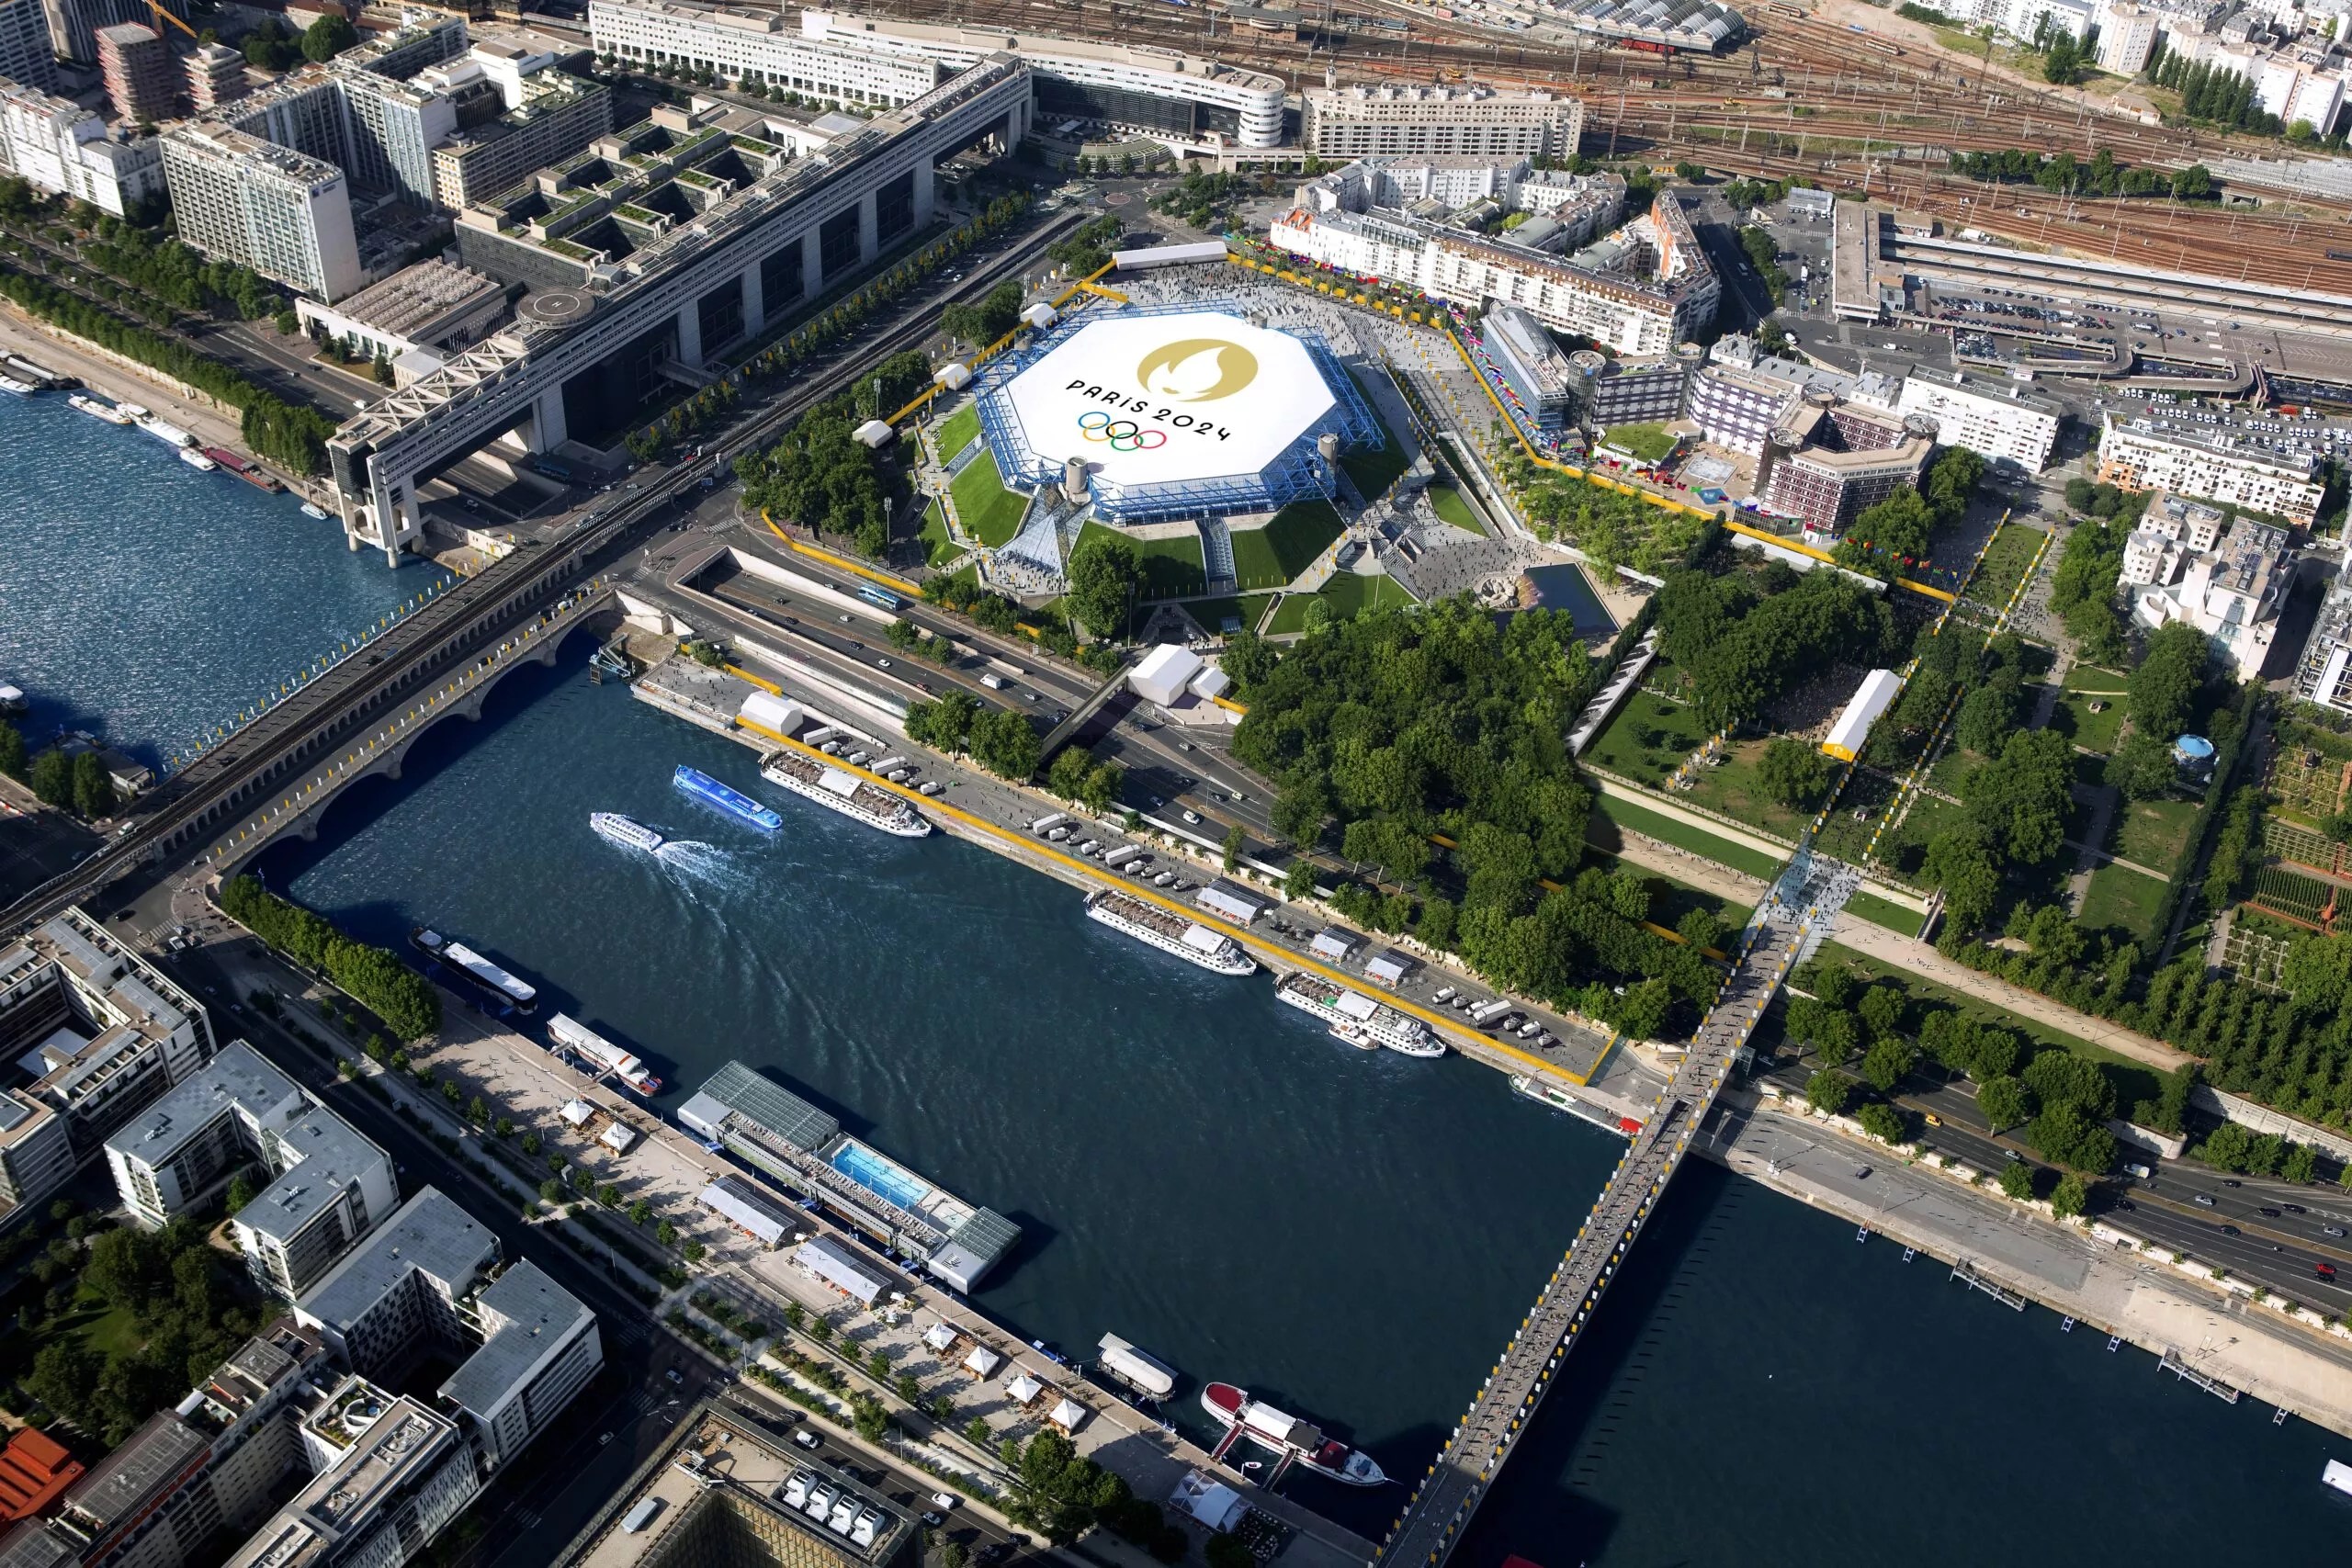
European transit-oriented development is squatter – the buildings are generally less tall, and they’re spread over a larger contiguous area, so that beyond the resolution of a few blocks the density is high as well. But it, too, often grows well beyond tradition. For example, here is Bercy, a redevelopment of the steam-era railyards at Gare de Lyon, no longer necessary with modern rail technology:
In the future, a New York that wants to make more room will need to do what Vancouver and Paris did. There is no other way.
Janno Lieber Lies to New York About Costs and Regulations
After being criticized about the excessive size of subway stations designed on his watch, MTA head Janno Lieber fired back defending the agency’s costs. In a conversation with the Manhattan Institute, he said about us, “They’re not wrong that the stations are where the MTA stations add cost. But they are wrong about how they compare us – the cost per mile is misleading” (see discussion on social media here). Then he blamed labor and the fire code. Blaming labor is a small but real part of the story; this is common among the white-collar managers Eric and I have talked to, and deserves a separate explanation for why this concern is overblown. But the issue of the fire code is fraud, all the way.
I’ve previously seen some journalists and advocates who write about American construction costs talk about fire safety, which is mentioned occasionally as a reason designs cannot be changed. It’s not at all what’s going on, for two separate reasons, each of which, alone, should be grounds to dismiss Lieber and ensure he never works for the state again.
The first reason is that the fire safety regulation in the United States for train stations, NFPA 130, has been exported to a number of other countries, none of which has American costs or the specific American tradition of overbuilding stations. China uses NFPA 130. So does Turkey. Spain uses a modification. We can look at their designs and see that they do not build oversize stations. I’ve seen an environmental impact analysis in Shanghai, with the help of a Chinese student studying this issue who explained the main planning concerns there. I could write an entire blog post about China (not a 10,000-word case report, of course), but suffice is to say, if the train is projected to be 160 m long, the station dig will be that plus a few meters – and Chinese stations have mezzanines as I understand it. Spanish and Turkish stations have little overage as well; building a dig twice as long as the station’s platforms to house back-of-the-house spaces is unique to most (not all) of the Anglosphere, as design consultants copy bad ideas from one another.
Even the claim that NFPA 130 requires full-length mezzanines is suspect. It requires stations to be built so that passengers can evacuate in four minutes in emergency conditions, rising to six minutes counting stragglers (technically, the throughput needs to be enough to evacuate in four minutes, but with latency it can go up to six). The four minute requirement can be satisfied on the lettered lines of the subway in New York with no mezzanines and just an access point at each end of the platform, but it’s close and there’s a case for another access point in the middle; no full-length mezzanine is required either way. If the stations are any shorter, as on the numbered lines or in other North American cities, two escalators and a wide staircase at the end of each platform are more than enough, and yet the extensive overage is common in those smaller systems too (for example, in Vancouver, the Broadway extension is planned with 128 m long digs for 75 m trains, per p. 9 here).
“Fire safety” is used as an excuse by people with neither engineering background nor respect for anything quantitative or technical. Lieber is such a person: his background is in law and he seems incurious about technical issues (and this is also true of his successor at MTA Capital Construction, public policy grad Jamie Torres-Springer).
Perhaps due to this lazy incuriosity, Lieber didn’t notice that the MTA has extensive influence on the text of NFPA 130, bringing us to the second reason his claim is fraudulent. NFPA 130 is not to blame – again, it’s the same code as in a number of low- and medium-cost countries – but Nilo Cobau explains that the NFPA process is such that big agencies have considerable input, since there aren’t many places in the US that build subways. Nolan Hicks pointed out in the same thread, all linked in the lede paragraph, that the MTA has a voting member and two alternates on the board that determines NFPA 130 and hasn’t requested changes – and that Montreal, subject to the same codes, built a station with little overage (he says 160 m digs for 150 m platforms).
The handwaving of a fire code that isn’t even different from that of cheaper places is there for one purpose only: to deflect blame. It was a struggle to get Lieber and other New York leaders to even admit they have high costs, so now they try to make it the fault of anyone but themselves: fire safety regulations, organized labor, what have you.
Labor is a real issue, unlike fire safety, but it’s overblown by managers who look down on line workers and have generally never been line workers. Lieber graduated law school, was hired by USDOT at either junior-appointed or mid-level civil servant role, I can’t tell which, and then did managerial jobs; his successor as head of MTA Construction and Development, Jamie Torres-Springer, graduated public policy. These aren’t people who worked themselves up from doing engineering, architecture, planning, or ethnographic work; add the general hostility American white-collar workers have toward blue-collar workers, and soon people in that milieu come to believe that just because their top 5%er wages are much higher than they could earn anywhere else in the world, the sandhogs also earn much more than they could anywhere else in the world, when in truth New York sandhog and Stockholm miner wages and benefits are very close.
Occasionally the point that it’s not wages but labor productivity seeps in. There, at last, we see a real problem with labor. Eric and I found that about a third of the sandhogs on Second Avenue Subway didn’t really need to be there. Further cuts could be achieved through the use of more labor-efficient techniques, which the MTA is uninterested in implementing. The rest of the American labor premium comes from excessive staffing of white-collar supervisors, including representatives from each utility, which insists that the MTA pay for the privilege of having such representatives tell them what they can and cannot do in lieu of mapping the utilities and sending over the blueprints. All included, labor was around 50% of the cost of Second Avenue Subway, where the norm in Italy, Turkey, and Sweden is around 25% (note how higher-wage Sweden is the same as lower-wage Italy and much lower-wage Turkey); excessive labor costs contributed a factor of 1.5 premium to the project, but the other factor of 6 came from excessive station size, deep mining of stations (which thankfully will not happen at 106th and 116th Street; it will at 125th but that’s unavoidable), lack of system standardization, and a litany of project delivery problems that are generally getting worse with every iteration. Lieber personally takes credit for some of the privatization of planning to design-build consultancies, though to be fair to him, the project delivery problems predate him, he just made things slightly worse.
A New York that wants to build will not have incompetent political appointees in charge. It will instead hire professionals with a track record of success; as no such people exist within the American infrastructure construction milieu, it should use its own size and prestige to find someone from a low-cost city to hire, who will speak English with an accent and know more engineering than American legal hermeneutics. And it will not reward people who defraud the public about the state of regulations just because they’re too lazy to know better.
The MTA Sticks to Its Oversize Stations
In our construction costs report, we highlighted the vast size of the station digs for Second Avenue Subway Phase 1 as one of the primary reasons for the project’s extreme costs. The project’s three new stations cost about three times as much as they should have, even keeping all other issues equal: 96th Street’s dig is about three times as long as necessary based on the trains’ length, and 72nd and 86th Street’s are about twice as long but the stations were mined rather than built cut-and-cover, raising their costs to match that of 96th each. In most comparable cases we’ve found, including Paris, Istanbul, Rome, Stockholm, and (to some extent) Berlin, station digs are barely longer than the minimum necessary for the train platform.
MTA Construction and Development has chosen to keep building oversize stations for Second Avenue Subway Phase 2, a project that despite being for the most part easier than the already-open Phase 1, is projected to cost slightly more per kilometer. Nolan Hicks at the New York Post just published a profile diagram:

The enormous size of 125th Street Station is not going to be a grand civic space. As the diagram indicates, the length of the dig past the platforms will not be accessible to passengers. Instead, it will be used for staff and mechanical rooms. Each department wants its own dedicated space, and at no point has MTA leadership told them no.
Worse, this is the station that has to be mined, since it goes under the Lexington Avenue Line. A high-cost construction technique here is unavoidable, which means that the value of avoiding extra costs is higher than at a shallow cut-and-cover dig like those of 106th and 116th Streets. Hence, the $1 billion hard cost of a single station. This is an understandable cost for a commuter rail station mined under a city center, with four tracks and long trains; on a subway, even one with trains the length of those of the New York City Subway, it is not excusable.
When we researched the case report on Phase 1, one of the things we were told is that the reason for the large size of the stations is that within the MTA, New York City Transit is the prestige agency and gets to call the shots; Capital Construction, now Construction and Development, is smaller and lacks the power to tell NYCT no, and from NYCT’s perspective, giving each department its own break rooms is free money from outside. One of the potential solutions we considered was changing the organizational chart of the agency so that C&D would be grouped with general public works and infrastructure agencies and not with NYCT.
But now the head of the MTA is Janno Lieber, who came from C&D. He knows about our report. So does C&D head Jamie Torres-Springer. When one of Torres-Springer’s staffers said a year ago that of course Second Avenue Subway needs more circulation space than Citybanan in Stockholm, since it has higher ridership (in fact, in 2019 the ridership at each of the two Citybana stations, e.g. pp. 39 and 41, was higher than at each of the three Second Avenue Subway stations), the Stockholm reference wasn’t random. They no longer make that false claim. But they stick to the conclusion that is based on this and similar false claims – namely, that it’s normal to build underground urban rail stations with digs that are twice as long as the platform.
When I call for removing Lieber and Torres-Springer from their positions, publicly, and without a soft landing, this is what I mean. They waste money, and so far, they’ve been rewarded: Phase 2 has received a Full Funding Grant Agreement (FFGA) from the United States Department of Transportation, giving federal imprimatur to the transparently overly expensive design. When they retire, their successors will get to see that incompetence and multi-billion dollar waste is rewarded, and will aim to imitate that. If, in contrast, the governor does the right thing and replaces Lieber and Torres-Springer with people who are not incurious hacks – people who don’t come from the usual milieu of political appointments in the United States but have a track record of success (which, in construction, means not hiring someone from an English-speaking country) – then the message will be the exact opposite: do a good job or else.
Reverse- and Through-Commute Trends
I poked around some comparable data for commuting around New York for 2007 and 2019 the other day, using OnTheMap. The motivation is that I’d made two graphics of through-commutes in the region, one in 2017 (see link here, I can’t find the original article anymore) and one this year for the ETA report (see here, go to section 2B). The nicer second graphic was made by Kara Fischer, not by me, but also has about twice the volume of through-commutes, partly due to a switch in source to the more precise OnTheMap, partly due to growth. It’s the issue of growth I’d like to go over in this post.
In all cases, I’m going to compare data from 2007 and 2019. This is because these years were both business cycle peaks, and this is the best way to compare data from different years. The topline result is that commutes of all kinds are up – the US had economic growth in 2007-19 and New York participated in it – but cross-regional commutes grew much more than commutes to Manhattan. New Jersey especially grew as a residential place, thanks to its faster housing growth, to the point that by 2019, commute volumes from the state to Manhattan matched those of all east-of-Hudson suburbs combined. The analysis counts all jobs, including secondary jobs.
For the purposes of the tables below, Long Island comprises Nassau and Suffolk Counties, and Metro-North territory comprises Westchester, Putnam, and Duchess Counties and all of Connecticut.
2007 data
| From\To | Manhattan | Brooklyn | Queens | Bronx | Staten Island | Long Island | Metro-North | New Jersey |
| Manhattan | 449,308 | 30,716 | 22,028 | 17,746 | 1,974 | 17,574 | 20,281 | 29,031 |
| Brooklyn | 385,943 | 299,056 | 76,499 | 16,121 | 9,288 | 40,847 | 17,175 | 25,887 |
| Queens | 328,785 | 89,982 | 216,988 | 19,227 | 4,350 | 107,634 | 21,737 | 18,555 |
| Bronx | 184,594 | 35,994 | 29,818 | 97,397 | 2,337 | 20,200 | 41,316 | 15,467 |
| Staten Island | 59,572 | 30,241 | 7,223 | 2,326 | 49,679 | 7,514 | 3,655 | 17,919 |
| Long Island | 163,988 | 45,121 | 77,337 | 12,724 | 5,103 | 926,912 | 32,806 | 12,557 |
| Metro-North | 124,952 | 12,606 | 14,228 | 24,131 | 1,962 | 29,344 | 1,897,392 | 15,413 |
| New Jersey | 245,373 | 23,455 | 17,496 | 11,022 | 8,109 | 17,460 | 22,073 | 3,523,860 |
2019 data
| From\To | Manhattan | Brooklyn | Queens | Bronx | Staten Island | Long Island | Metro-North | New Jersey |
| Manhattan | 570,321 | 56,019 | 44,063 | 31,947 | 4,000 | 20,678 | 22,146 | 35,243 |
| Brooklyn | 486,757 | 429,234 | 119,588 | 26,192 | 17,073 | 43,410 | 18,301 | 33,119 |
| Queens | 384,186 | 134,063 | 308,903 | 36,339 | 7,640 | 121,194 | 25,216 | 22,863 |
| Bronx | 224,583 | 62,377 | 58,124 | 135,288 | 4,364 | 26,172 | 45,347 | 17,387 |
| Staten Island | 59,778 | 40,994 | 13,971 | 5,218 | 56,953 | 9,877 | 3,510 | 19,442 |
| Long Island | 191,239 | 59,241 | 102,939 | 23,246 | 8,132 | 971,193 | 40,130 | 14,724 |
| Metro-North | 153,482 | 21,283 | 23,498 | 37,147 | 3,179 | 40,586 | 1,874,618 | 20,819 |
| New Jersey | 345,551 | 40,397 | 29,523 | 17,467 | 14,134 | 23,439 | 29,755 | 3,614,386 |
Growth
| From\To | Manhattan | Brooklyn | Queens | Bronx | Staten Island | Long Island | Metro-North | New Jersey |
| Manhattan | 26.93% | 82.38% | 100.03% | 80.02% | 102.63% | 17.66% | 9.20% | 21.40% |
| Brooklyn | 26.12% | 43.53% | 56.33% | 62.47% | 83.82% | 6.27% | 6.56% | 27.94% |
| Queens | 16.85% | 48.99% | 42.36% | 89.00% | 75.63% | 12.60% | 16.00% | 23.22% |
| Bronx | 21.66% | 73.30% | 94.93% | 38.90% | 86.74% | 29.56% | 9.76% | 12.41% |
| Staten Island | 0.35% | 35.56% | 93.42% | 124.33% | 14.64% | 31.45% | -3.97% | 8.50% |
| Long Island | 16.62% | 31.29% | 33.10% | 82.69% | 59.36% | 4.78% | 22.33% | 17.26% |
| Metro-North | 22.83% | 68.83% | 65.15% | 53.94% | 62.03% | 38.31% | -1.20% | 35.07% |
| New Jersey | 40.83% | 72.23% | 68.74% | 58.47% | 74.30% | 34.24% | 34.80% | 2.57% |
Some patterns
Commutes to Manhattan are up 24.37% over the entire period. This is actually higher than the rise in all commutes in the table combined, because of the weight of intra-suburban commutes (internal to New Jersey, Metro-North territory, or Long Island), which stagnated over this period. However, the rise in all commutes that are not to Manhattan and are also not internal to one of the three suburban zones is much greater, 41.11%.
This 41.11% growth was uneven over this period. Every group of commuters to the suburbs did worse than this. On net, commutes to New Jersey, Metro-North territory, and Long Island, each excluding internal commutes, grew 21.34%, 15.95%, and 18.62%, all underperforming commutes to Manhattan. Some subgroups did somewhat better – commutes from New Jersey and Metro-North to the rest of suburbia grew healthily (they’re the top four among the cells describing commutes to the suburbs) – but overall, this isn’t really about suburban job growth, which lagged in this period.
In contrast, commutes to the Outer Boroughs grew at a collective rate of 50.31%. All four intra-borough numbers (five if we include Manhattan) did worse than this; rather, people commuted between Outer Boroughs at skyrocketing rates in this period, and many suburbanites started commuting to the Outer Boroughs too. Among these, the cis-Manhattan commutes – Long Island to Brooklyn and Queens, and Metro-North territory to the Bronx – grew less rapidly (31.29%, 33.1%, 53.94% respectively), while the trans-Manhattan commutes grew very rapidly, New Jersey-Brooklyn growing 72.23%.
New Jersey had especially high growth rates as an origin. Not counting intra-state commutes, commutes as an origin grew 45% (Long Island: 25.75%; Metro-North territory: 34.75%), due to the relatively high rate of housing construction in the state. By 2019, commutes from New Jersey to Manhattan grew to be about equal in volumes to commutes from the two east-of-Hudson suburban regions combined.
Overall, trans-Hudson through-commutes – those between New Jersey and anywhere in the table except Manhattan and Staten Island – grew from 179,385 to 249,493, 39% in total, with New Jersey growing much faster as an origin than a destination for such commutes (53.63% vs. 23.93%); through-commutes between the Bronx or Metro-North territory and Brooklyn grew 56.48%, reaching 128,153 people, with Brooklyn growing 72.13% as a destination for such commutes and 33.63% as an origin.
What this means for commuter rail
Increasingly, through-running isn’t about unlocking new markets, although I think that better through-service is bound to increase the size of the overall commute volume. Rather, it’s about serving commutes that exist, or at least did on the eve of the pandemic. About half of the through-commutes are to Brooklyn, the Bronx, or Queens; the other half are to the suburbs (largely to New Jersey).
The comparison must be with reverse-commutes. Those are also traditionally ignored by commuter rail, but Metro-North made a serious effort to accommodate the high-end ones from the city to edge cities including White Plains, Greenwich, and Stamford, where consequently transit commuters outearn drivers in workplace geography. The LIRR, which long ran its Main Line one-way at rush hour to maintain express service on the two-track line, sold the third track project as opening new reverse-commutes. But none of these markets is growing much, and the only cis-Manhattan one that’s large is Queens to Long Island, which has an extremely diffuse job geography. In contrast, the larger and faster-growing through-markets are ignored.
Short (cis-Manhattan) trips are growing healthily too. They are eclipsed by some through-commutes, but Long Island to Queens and Brooklyn and Metro-North territory to the Bronx all grew very fast, and at least for the first two, the work destinations are fairly clustered near the LIRR (but the Bronx jobs are not at all clustered near Metro-North).
The fast job growth in all four Outer Boroughs means that it’s better to think of commuter rail as linking the suburbs with the city than just linking the suburbs with Penn Station or Grand Central. There isn’t much suburban job growth, but New Jersey has residential growth (the other two suburban regions don’t), and the city has job growth, with increasing complexity as more job centers emerge outside Manhattan and as people travel between them and not just to Manhattan.
We Gave a Talk About New York Commuter Rail Modernization
Blair Lorenzo and I gave the talk yesterday, as advertised. The slide deck was much more in her style than in mine – more pictures, fewer words – so it may not be exactly clear what we said.
Beyond the written report itself (now up in web form, not just a PDF), we talked about some low-hanging fruit. What we’re asking for is not a lot of money – the total capital cost of electrification and high platforms everywhere and the surface bottlenecks we talk about like Hunter Junction is around $6 billion, of which $800 million for Portal Bridge need to happen regardless of anything else; Penn Reconstruction is $7 billion and the eminently cancelable Penn Expansion is $17 billion. However, it is a lot of coordination, of different agencies, of capital and operations, and so on. So it’s useful to talk about how to, in a way, fail gracefully – that is, how to propose something that, if it’s reduced to a pilot program, will still be useful.
The absolute wrong thing to do in a pilot program situation is to just do small things all over, like adding a few midday trains. That would achieve little. There is already alternation between hourly and half-hourly commuter trains in most of the New York region; this doesn’t do much when the subway or a subway + suburban bus combination runs every 10-12 minutes (and should be running every six). The same can be said for CityTicket, which incrementally reduces fares on commuter rail within New York City but doesn’t integrate fares with the subway and therefore produces little ridership increase.
Instead, the right thing to do is focus on one strong corridor. We propose this for phase 1, turning New Brunswick-Stamford or New Brunswick-New Rochelle into a through-line running every 10 minutes all day, as soon as Penn Station Access opens. But there are other alternatives that I think fall into the low-hanging fruit category.
One is the junction fixes, like Hunter as mentioned above (estimated at $300 million), or similar-complexity Shell in New Rochelle, which is most likely necessary for any decent intercity rail upgrade on the Northeast Corridor. It costs money, but not a lot of it by the standards of what’s being funded through federal grants, including BIL money for the Northeast Corridor, which is relevant to both Hunter and Shell.
The other is Queens bus redesign. I hope that as our program at Marron grows, we’ll be able to work on a Queens bus redesign that assumes that it’s possible to connect to the LIRR with fare integration and high frequency; buses would not need to all divert to Flushing or Jamaica, but could run straight north-south, leaving the east-west Manhattan-bound traffic to faster, more efficient trains.
I’m Giving a Talk in New York About Commuter Rail
At the Effective Transit Alliance, we’re about to unveil a report explaining how to modernize New York’s commuter rail system (update 10-31: see link to PDF here). The individual elements should not surprise regular readers of this blog, but we go into more detail about things I haven’t written before about peakiness, and combine everything together to propose some early action items.
To that effect, we will present this in person on Wednesday November 1st, at 1 pm. The event will take place at Marron, in Room 1201 of 370 Jay Street; due to NYU access control, signing up is mandatory using this form, but it can be done anytime until the morning of (or even later, but security will be grumpy). At the minimum, Blair Lorenzo and I will talk about commuter rail and what to do to improve it and take questions from the audience; we intend to be there for two hours, but people can break afterward and still talk, potentially.
I’m Giving a Talk About Regional Rail in Boston
I haven’t been as active here lately; I think people know why and ask that you find other things to comment on.
I’m in Boston this week (and in New York next week), meeting with friends and TransitMatters people; in particular, I’m giving a talk at the Elephant and Castle on Wednesday at 6 pm to discuss regional rail and related reforms for Boston:

What I keep finding on these trips is that public transportation in the US is always worse than I remember. In Boston, I had a short wait on the Red Line from South Station to where I’m staying in Cambridge, but the next train was 13 minutes afterward, midday on a weekday. The trip from South Station to Porter Square took 24 minutes over a distance of 7.7 km covering seven stops; TransitMatters has a slow zone dashboard, there are so many. A line segment with an interstation a little longer than a kilometer has a lower average speed than any Paris Métro line, even those with 400 meter interstations; in Berlin, which averages 780 meters, the average speed is 30 km/h.
In New York, the frequency is okay, but there’s a new distraction: subway announcements now say “we have over 100 accessible stations,” giving no information except advertising that the MTA hates disabled people and thinks that only 30% of the system should be accessible to wheelchair users. There are still billboards on the subway advertising OMNY, a strictly inferior way of paying for the system than the older prepaid cards – it’s a weekly cap at the same rate as the unlimited weekly, but it’s only available Monday to Sunday rather than in any seven-day period (update 10-24: I’m told it’s fixed and now it’s exactly the same product as prepaying if you know you’ll hit the cap), and the monthly fare is still just a bit cheaper than getting weeklies or weekly caps.
The MTA 20 Year Needs Assessment Reminds Us They Can’t Build
The much-anticipated 20 Year Needs Assessment was released 2.5 days ago. It’s embarrassingly bad, and the reason is that the MTA can’t build, and is run by people who even by Northeastern US standards – not just other metro areas but also New Jersey – can’t build and propose reforms that make it even harder to build.
I see people discuss the slate of expansion projects in the assessment – things like Empire Connection restoration, a subway under Utica, extensions of Second Avenue Subway, and various infill stations. On the surface of it, the list of expansion projects is decent; there are quibbles, but in theory it’s not a bad list. But in practice, it’s not intended seriously. The best way to describe this list is if the average poster on a crayon forum got free reins to design something on the fly and then an NGO with a large budget made it into a glossy presentation. The costs are insane, for example $2.5 billion for an elevated extension of the 3 to Spring Creek of about 1.5 km (good idea, horrific cost), and $15.9 billion for a 6.8 km Utica subway (see maps here); this is in 2027 dollars, but the inescapable conclusion here is that the MTA thinks that to build an elevated extension in East New York should cost almost as much as it did to build a subway in Manhattan, where it used the density and complexity of the terrain as an argument for why things cost as much as they did.
To make sure people don’t say “well, $16 billion is a lot but Utica is worth it,” the report also lowballs the benefits in some places. Utica is presented as having three alternatives: subway, BRT, and subway part of the way and BRT the rest of the way; the subway alternative has the lowest projected ridership of the three, estimated at 55,600 riders/weekday, not many more than ride the bus today, and fewer than ride the combination of all three buses in the area today (B46 on Utica, B44 on Nostrand, B41 on Flatbush). For comparison, where the M15 on First and Second Avenues had about 50,000 weekday trips before Second Avenue Subway opened, the two-way ridership at the three new stations plus the increase in ridership at 63rd Street was 160,000 on the eve of corona, and that’s over just a quarter of the route; the projection for the phase that opened is 200,000 (and is likely to be achieved if the system gets back to pre-corona ridership), and that for the entire route from Harlem to Lower Manhattan is 560,000. On a more reasonable estimate, based on bus ridership and gains from faster speeds and saving the subway transfer, Utica should get around twice the ridership of the buses and so should Nostrand (not included in the plan), on the order of 150,000 and 100,000 respectively.
Nothing there is truly designed to optimize how to improve in a place that can’t build. London can’t build either, even if its costs are a fraction of New York’s (which fraction seems to be falling since New York’s costs seem to be rising faster); to compensate, TfL has run some very good operations, squeezing 36 trains per hour out of some of its lines, and making plans to invest in signaling and route design to allow similar throughput levels on other lines. The 20 Year Needs Assessment mentions signaling, but doesn’t at all promise any higher throughput, and instead talks about state of good repair: if it fails to improve throughput much, there’s no paper trail that they ever promised more than mid-20s trains per hour; the L’s Communications-Based Train Control (CBTC) signals permit 26 tph in theory but electrical capacity limits the line to 20, and the 7 still runs about 24 peak tph. London reacted to its inability to build by, in effect, operating so well that each line can do the work of 1.5 lines in New York; New York has little interest.
The things in there that the MTA does intend to build are slow in ways that cross the line from an embarrassment to an atrocity. There’s an ongoing investment plan in elevator accessibility on the subway. The assessment trumpets that “90% of ridership” will be at accessible stations in 2045, and 95% of stations (not weighted by ridership) will be accessible by 2055. Berlin has a two years older subway network than New York; here, 146 out of 175 stations have an elevator or ramp, for which the media has attacked the agency for its slow rollout of systemwide accessibility, after promises to retrofit the entire system by about this year were dashed.
The sheer hate of disabled people that drips from every MTA document about its accessibility installation is, frankly, disgusting, and makes a mockery of accessibility laws. Berlin has made stations accessible for about 2 million € apiece, and in Madrid the cost is about 10 million € (Madrid usually builds much more cheaply than Berlin, but first of all its side platforms and fare barriers mean it needs more elevators than Berlin, and second it builds more elevators than the minimum because at its low costs it can afford to do so). In New York, the costs nowadays start at $50 million and go up from there; the average for the current slate of stations is around $70 million.
And the reason for this inability to build is decisions made by current MTA leadership, on an ongoing basis. The norm in low- and medium-cost countries is that designs are made in-house, or by consultants who are directly supervised by in-house civil service engineers who have sufficient team size to make decisions. In New York, as in the rest of the US, the norms is that not only is design done with consultants, but also the consultants are supervised by another layer of consultants. The generalist leadership at the MTA doesn’t know enough to supervise them: the civil service is small and constantly bullied by the political appointees, and the political appointees have no background in planning or engineering and have little respect for experts who do. Thus, they tell the consultants “study everything” and give no guidance; the consultants dutifully study literally everything and can’t use their own expertise for how to prune the search tree, leading to very high design costs.
Procurement, likewise, is done on the principle that the MTA civil service can’t do anything. Thus, the political appointees build more and more layers of intermediaries. MTA head Janno Lieber takes credit for the design-build law from 2019, in which it’s legalized (and in some cases mandated) to have some merger of design and construction, but now there’s impetus to merge even more, in what is called progressive design-build (in short: New York’s definition of design-build is similar to what is used in Turkey and what we call des-bid-ign-build in our report – two contracts, but the design contract is incomplete and the build contract includes completing the design; progressive design-build means doing a single contract). Low- and medium-cost countries don’t do any of this, with the exception of Nordic examples, which have seen a sharp rise in costs from low to medium in conjunction with doing this.
And MTA leadership likes this. So do the contractors, since the civil service in New York is so enfeebled – scourged by the likes of Lieber, denied any flexibility to make decisions – that it can’t properly supervise design-bid-build projects (and still the transition to design-build is raising costs a bit). Layers of consultants, insulated from public scrutiny over why exactly the MTA can’t make its stations accessible or extend the subway, are exactly what incompetent political appointees (but I repeat myself) want.
Hence, the assessment. Other than the repulsively slow timeline on accessibility, this is not intended to be built. It’s not even intended as a “what if.” It’s barely even speculation. It’s kayfabe. It’s mimicry of a real plan. It’s a list of things that everyone agrees should be there plus a few things some planners wanted, mostly solidly, complete with numbers that say “oh well, we can’t, let’s move on.” And this will not end while current leadership stays there. They can’t build, and they don’t want to be able to build; this is the result.
Our Webinar, and Penn Reconstruction
Our webinar about the train station 3D model went off successfully. I was on video for a little more than two hours, Michael a little less; the recording is on YouTube, and I can upload the auto-captioning if people are okay with some truly bad subtitles.
I might even do more webinars as a substitute for Twitch streams, just because Zoom samples video at similar quality to Twitch for my purposes but at far smaller file size; every time I upload a Zoom video I’m reminded that it takes half an hour to upload a two-hour video whereas on Twitch it is two hours when I’m in Germany. (Internet service in other countries I visit is much better.)
The questions, as expected, were mostly not about the 3D model, but about through-running and Penn Station in general. Joe Clift was asking a bunch of questions about the Hudson Tunnel Project (HTP) and its own issues, and he and others were asking about commuter rail frequency. A lot of what we talked about is a preview of a long proposal, currently 19,000, by the Effective Transit Alliance; the short version can be found here. For example, I briefly mentioned on video that Penn Expansion, the plan to demolish a Manhattan block south of Penn Station to add more tracks at a cost of $17 billion, provides no benefits whatsoever, even if it doesn’t incorporate through-running. The explanation is that the required capacity can be accommodated on four to five tracks with best American practices for train turnaround times and with average non-US practices, 10 minutes to turn; the LIRR and New Jersey Transit think they need 18-22 minutes.
There weren’t questions about Penn Reconstruction, the separate (and much better) $7 billion plan to rebuild the station in place. The plan is not bad – it includes extra staircases and escalators, extra space on the lower concourse, and extra exits. But Reinvent Albany just found an agreement between the various users of Penn Station for how to do Penn Reconstruction, and it enshrines some really bad practices: heavy use of consultants, and a choice of one of four project delivery methods all of which involve privatization of the state; state-built construction is not on the menu.
In light of that, it may make sense to delay Penn Reconstruction. The plan as it is locks in bad procurement practices, which mean the costs are necessarily going to be a multiple of what they could be. It’s better to expand in-house construction capacity for the HTP and then deploy it for other projects as the agency gains expertise; France is doing this with Grand Paris Express, using its delivery vehicle Société du Grand Paris as the agency for building RER systems in secondary French cities, rather than letting the accumulated state capacity dissipate when Grand Paris Express is done.
This is separate from the issue of what to even do about Penn Station – Reconstruction in effect snipes all the reimaginings, not just ours but also ones that got more established traction like Vishaan Chakrabarti’s. But even then it’s not necessarily a bad project; it just really isn’t worth $7 billion, and the agreement makes it clear that it is possible to do better if the agencies in question learn what good procurement practices are (which I doubt – the MTA is very bought in to design-build failure).
