Category: Politics and Society
Massachusetts Sandbags the North-South Rail Link
Boston has two main train stations: South Station, and North Station. Both are terminals, about 2 km apart, each serving its own set of suburbs; as a result, over the last few decades there have been calls to unify the system with a regional rail tunnel connecting the two systems. This tunnel, called the North-South Rail Link, or NSRL, would have been part of the Big Dig if its costs hadn’t run over; as it were, the Big Dig reserved space deep underground for two large bores, in which there is clean dirt with no archeological or geotechnical surprises. The NSRL project had languished due to Massachusetts’ unwillingness to spend the money on it, always understood to be in the billions, but in the last few years the pressure to build it intensified, and the state agreed to fund a small feasibility study.
A presentation of the draft study came out two days ago, and is hogwash. It claims on flimsy pretext that NSRL would cost $17 billion for the tunnel alone. It also makes assumptions on service patterns (such as manual door opening) that are decades out of date not just in Europe and East Asia but also in New York. The Fiscal and Management Control Board, or FMCB, discusses it here; there’s a livestream as well as a link to a presentation of the draft study.
The content of the study is so weak that it has to have been deliberate. The governor does not want it built because of its complexity, no matter how high its benefits. Thus, the state produced a report that sandbags a project it doesn’t want to build. People should be fired over this, starting with planners at the state’s Office of Transportation Planning, which was responsible for the study. The way forward remains full regional rail modernization. As for the cost estimate, an independent study by researchers at Harvard’s Kennedy School of Government estimates it at about $5 billion in today’s money; the new study provides no evidence it would be higher. I urge good transit activists in Massachusetts, Rhode Island, and New Hampshire to demand better of their civil servants.
Tunneling costs
The study says that the cost of a four-track NSRL tunnel under the Big Dig would be $17 billion in 2028 dollars. In today’s money, this is $12 billion (the study assumes 3.5% annual cost escalation rather than inflation-rate cost escalation). It claims to be based on best practices, listing several comparable tunnels, both proposed and existing:
- California High-Speed Rail tunnels (average estimated cost about $125 million per km, not including overheads and contingency)
- Crossrail (see below on costs)
- The M-30 highway tunnel in Madrid (average cost about $125 million per km of bored tunnel in the mid-2000s, or around $150 million/km in today’s money)
- The canceled I-710 tunnel in California (at 7.2 km and $5.6 billion, $780 million per km
- The Spoortunnel Pannerdensch Kanaal (around $200 million in today’s money for 1.6 km of bore, or $125 million per km)
Unlike the other tunnels on the list, Crossrail has stations frustrating any simple per km cost analysis. The headline cost of Crossrail is £15 billion; however, I received data from a freedom of information request showing that the central (i.e. underground) portion is only £11.6 billion and the rest is surface improvements, and of this cost the big items are £2.2 billion for tunneling, £4.1 billion for stations, £1 billion for tracks and systems, and £2.7 billion for overheads and land acquisition. The tunneling itself is thus around $150 million per km, exclusive of overheads and land (which add 30% to the rest of the project). All of this is consistent with what I’ve found in New York: tunneling is for the most part cheap.
With the exception of Crossrail, the above projects consist of two large-diameter bores. The mainline rail tunnels (California HSR and Pannerdensch Kanaal) are sized to provide plenty of free air around the train in order to improve aerodynamics, a feature that is desirable at high speed but is a luxury in a constrained, low-speed urban rail tunnel. The highway tunnels have two large-diameter bores in order to permit many lanes in each direction. The plan for NSRL has always been two 12-meter bores, allowing four tracks; at the per-km boring cost of the above projects, this 5 kilometer project should cost perhaps a billion dollars for tunneling alone.
The stations are typically the hard part. However, NSRL has always been intended to use large-diameter tunnels, which can incorporate the platforms within the bore, reducing their cost. Frequent commenter Ant6n describes how Barcelona used such a tunnel to build Metro Lines 9 and 10, going underneath the older lines; the cost of the entire project is around $170 million per km, including a cost overrun by a factor of more than 3. Vertical access is likely to be more difficult in Boston under the Big Dig than in Barcelona, but slant shafts for escalators are still possible. At the worst case scenario, Crossrail’s station costs are of an order of magnitude of many hundreds of millions of dollars each, and two especially complex ones on Crossrail 2 are £1.4 billion each; this cost may be reasonable for Central Station at Aquarium, but not at South Station or North Station, where there is room for vertical and slant shafts.
It’s possible that the study made a factor-of-two error, assuming that since the mainline rail comparison projects have two tracks, their infrastructure is sized for two urban rail tracks, where in reality a small increase in tunnel diameter would permit four.
Researchers at the Harvard Kennedy School of Government came up with an estimate of $5.9 billion in 2025 dollars for a four-track, three-station NSRL option, which is about $5 billion today. Their methodology involves looking at comparable tunneling projects around the world, and averaging several averages, one coming from American cost methodology plus 50% contingency, and two coming from looking at real-world cost ranges (one American, one incorporating American as well as rest-of-world tunnels). Their list of comparable projects includes some high-cost ones such as Second Avenue Subway, but also cheaper ones like Citybanan, which goes deep underneath Central Stockholm with mined tunnels under T-Centralen and Odenplan, at $350 million per km in today’s money.
But the MassDOT study disregarded the expertise of the Kennedy School researchers, saying,
Note: The Harvard Study did not include cost for the tunnel boring machine launch pit and only accounted for 2.7 miles of tunneling (the MassDOT studies both accounted for 5 miles of tunneling), and no contingency for risk.
This claim is fraudulent. The Kennedy School study looks at real-world costs (thus, including contingency and launch pit costs) as well as at itemized costs plus 50% contingency. Moreover, the length of the NSRL tunnel, just under 5 km, is the same either way; the MassDOT study seems to be doubling the cost because the project has four tracks, an assumption that is already taken into account in the Kennedy School study. This, again, is consistent with a factor-of-two error.
Moreover, the brazenness of the claim that a study that explicitly includes contingency does not do so suggests that MassDOT deliberately sabotaged NSRL, making it look more expensive than it is, since the top political brass does not want it. Governor Baker said NSRL looks expensive, and Secretary of Transportation Stephanie Pollack is hostile as well; most likely, facing implicit pressure from above, MassDOT’s overburdened Office of Transportation Planning scrubbed the bottom of the barrel to find evidence of absurdly high costs.
Electrification costs
Massachusetts really does not want or understand electrification. Even some NSRL supporters believe electrification to be an expensive frill that would sink the entire project and think that dual-mode locomotives are an acceptable way to run trains in a developed country in the 2010s.
In fact, dual-mode locomotives’ weak performance serves to raise tunneling costs. Struggling to accelerate at 0.3 m/s^2 (or 0.03 g), they cannot climb steep grades: both the Kennedy School and MassDOT studies assume maximum 3% grades, whereas electric multiple units, with initial acceleration of 1.2 m/s^2, can easily climb 4% and even steeper grades (in theory even 10%, in practice the highest I know of is 7%, and even 5% is rare), permitting shorter and less constrained tunnels.
As a result of its allergy to electrification, MassDOT is only proposing wiring between North Station and the next station on each of the four North Side lines, a total of 22.5 route-km. This choice of which inner segments to electrify excludes the Fairmount Line, an 8-stop 15 km mostly self-contained line through low-income, asthma-riven city neighborhoods (source, PDF-pp. 182 and 230). Even the electrification the study does agree to, consisting of about 30 km of the above surface lines plus the tunnels themselves, is projected to cost $600 million. Nowhere in the world is electrification so expensive; the only projects I know of that are even half as expensive are a pair of disasters, one coming from a botched automation attempt on the Great Western Main Line and one coming from poor industry practices on Caltrain.
A more reasonable American budget, based on Amtrak electrification costs from the 1990s, would be somewhat less than $2 billion for the entire MBTA excluding the already-wired Providence Line; this is the most familiar electrification scheme to the Bostonian reader or planner. At French or Israeli costs, the entire MBTA commuter rail system could be wired for less than a billion dollars.
Another necessary element is conversion to an all-EMU fleet, to increase performance and reduce operating costs. Railway Gazette reports that a Dutch benchmarking study found that the lifecycle costs of EMUs are half as high as those of diesel multiple units. As the MBTA needs to replace its fleet soon anyway, the incremental cost of electrification of rolling stock is negative, and yet the study tacks in $2.4 billion on top of the $17 billion for tunneling for vehicles.
A miscellany of incompetence
In addition to the sandbagged costs, the study indicates that the people involved in the process do not understand modern railroad operations in several other ways.
First, door opening. While practically everywhere else in the first world doors are automatic and opened with the push of a button, the MBTA insists on manual door opening. The MassDOT study gives no thought to high platforms and automatic doors (indeed, the Old Colony Lines are already entirely high-platform, but some of their rolling stock still employs manual door opening), and assumes manual door opening will persist even through the NSRL tunnels. Each train would need a squad of conductors to unload in Downtown Boston, and the labor costs would frustrate any attempt to run frequently (the study itself suggests hourly off-peak frequency; in Paris, RER lines run every 10-20 minutes off-peak).
Second, capacity. The study says a two-track NSRL would permit 17 trains per hour in each direction at the peak, and a four-track NSRL would permit 21. The MBTA commuter rail network is highly branched, but not more so than the Munich S-Bahn (which runs 30 at the peak on two tracks) and less so than the Zurich S-Bahn (which before the Durchmesserlinie opened ran either 20 or 24 tph through the two-track tunnel, I’m not sure which).
Worse, the FMCB itself is dumbfounded by the proposed peak frequency – in the wrong direction. While FMCB chair Joe Aiello tried explaining how modern regional rail in Tokyo works, other members didn’t get it; one member dared ask whether 17 tph is even possible on positive train control-equipped tracks. My expectations of Americans are low enough that I am not surprised they are unaware that many lines here and in Japan have automatic train protection systems (ETCS here, various flavors of ATC in Japan) that meet American PTC standards and have shorter minimum headways than every 3-4 minutes. But the North River Tunnels run 24-25 peak tph into Manhattan, using ASCES signaling, the PTC system Amtrak uses on the Northeast Corridor; the capacity problems at Penn Station are well-known to even casual observers of American infrastructure politics.
A state in which the FMCB members didn’t really get what their chair was saying about modern operations is going to propose poor operating practices going forward. MassDOT’s study assumes low frequency, and, because there is no line-wide electrification except on the Providence Line and eventually South Coast Rail (where electrification is required for wetland remediation), very low performance. MassDOT’s conception of NSRL has no infill stops, and thus no service to the bulk of the contiguous built-up area of Boston. Without electrification or high platforms, it cannot achieve high enough speeds to beat cars except in rush hour traffic. Limiting the stop penalty is paramount on urban rail, and level boarding, wide doors, and EMU acceleration combine to a stop penalty of about 55 seconds at 100 km/h and 75 seconds at 160 km/h; in contrast, the MBTA’s lumbering diesel locomotives, tugging coaches with narrow car-end doors with several steps, have a stop penalty of about 2.5 minutes at 100 km/h.
Going forward
The presentation makes it very clear what the value of MassDOT’s NSRL study is: at best none, at worst negative value through muddying the conversation with fraudulent numbers. The Office of Transportation Planning is swamped and could not produce a good study. The actual control was political: Governor Baker and Secretary of Transportation Pollack do not want NSRL, and both the private consultant that produced the study and the staff that oversaw it did what the politicians expected of them.
Heads have to roll if Massachusetts is to plan good public transportation. The most important person good transit activists should fight to remove is the governor; however, he is going to be easily reelected, and replacing the secretary of transportation with someone who does not lie to the public about costs is an uphill fight as well. Replacing incompetent civil servants elsewhere is desirable, but the fish rots from the head.
Activists in Rhode Island may have an easier time, as the state is less hostile to rail, despite the flop of Wickford Junction; they may wish to demand the state take lead on improving service levels on the Providence Line, with an eye toward forcing future NSRL plans to incorporate good regional rail practices. In New Hampshire, provided the state government became less hostile to public investment, activists could likewise demand high-quality commuter rail service, with an eye toward later connecting a North Station-Nashua-Manchester line to the South Side lines.
But no matter what, good transit activists cannot take the study seriously as a planning study. It is a political document, designed to sandbag a rail project that has high costs and even higher benefits that the governor does not wish to manage. Its cost estimates are not only outlandish but brazenly so, and its insistence that the Kennedy School study does not include contingency is so obviously incorrect that it must be considered fraud rather than a mistake. Nothing it says has any merit, not should it be taken seriously. It does not represent the world of transportation planning, but rather the fantasies of a political system that does not understand public transportation.
Process for the Sake of Process
A Patreon poll in April asked about political blogging, offering three options: policy certainty in housing, process for the sake of process, and lawsuits and corruption of process. The second option won.
The year is about 2008. A wee grad student and former political blogger in New York is getting interested in transportation policy, and through past connections to political bloggers gets acquainted with a progressive local thinktank called Drum Major Institute, which advocates for all the right priorities of the center-left. One of these priorities is densification and urban growth. The relevant DMI fellow talks about the need to upzone in the city to permit smart growth. The wee grad student asks, why even have zoning at all? Why not let developers build to any density they’d like? The DMI fellow says that zoning is necessary in order to permit planners to have control over where development goes, and doesn’t explain what this control is useful for in the first place.
Fast forward to this decade. Cities install infrastructure for livable streets. Bikeshare revolutionizes cycling, first via the docked systems of Paris, Wuhan, and Hangzhou, and subsequently via the dockless systems developed in the largest Chinese cities. Simultaneously, all over the developed world cities reallocate space away from cars, whether it’s via bus lanes, bike lanes, wider sidewalks, or freeway removal. This trend has generally earned the support of people who support livable streets or are generally progressive. There may be individual pieces of criticism: for example, East Harlem railed against New York’s original decision not to extend bike lanes on First and Second Avenues to its community, and thankfully the city listened after a few years and did extend them. But these criticisms tend to be specific to one issue and constructive.
But then there are the NIMBYs, whose rallying cry is “they didn’t ask us.” In San Francisco, the Mission left-wing community activist group Calle 24 attacked the city for extending bikeshare to the Mission, on grounds that include gentrification but also the process line: “we weren’t consulted.”
There are many defenses of process that do justify its importance. I interviewed Aaron Ritz and Waffiyah Murray at Indego, Philadelphia’s publicly-run docked bikeshare system, which has somewhat better reach to low-income and black residents than systems like Chicago’s Divvy and Washington’s Capital Bikeshare. They gave me concrete examples of how Indego’s community outreach was helpful: it gave the planners tips on the best station siting (e.g. where the community centers are) as well as on different ways different socioeconomic groups use bikeshare (e.g. black Philadelphians are likelier to think of cycling as fun rather than transportation and thus prefer station locations near recreational trails).
But simultaneously there are defenses of process for its own sake. Zoning is the biggest example: the actually useful aspects of urban zoning are so few and far between, and so disconnected from current practice, that there is no coherent defense of the existence of zoning boards. The common arguments used by neighborhood groups (overdevelopment, infrastructure, gentrification, etc.) range from manifestly false to manifestly selfish (property values).
On various YIMBY message boards, there has been a discussion of an alternative zoning code to standard low-density zoning. People discussed form-based codes or transit-oriented development regimes like that of SB 827 in California, and as a first stab I proposed the following at Open New York:
1. Land is residential, commercial, or industrial. Industrial gets set by regional or statewide commission taking into account manufacturing jobs, prevailing winds, etc., and is distinguished in having looser pollution controls. Residential is allowed in commercial zones by right; doctors’ offices, lawyers’ offices, and other independent personal services are allowed in residential areas, as are hotels.
2. Retail is allowed in all commercial zones. Office is allowed in commercial zones that are specifically for office.
3. Commercial zones are allowed to encroach on adjacent residential land: residential land within a certain distance from majority-commercial uses gets automatically reclassified as commercial, and if the commercial uses are mostly offices then the land gets reclassified as office and not just retail.
4. Density is regulated based on distance from high-quality transit, which for the purposes of this discussion does not include buses that run every 15 minutes. The lowest category is not single-family and doesn’t have parking minimums, but allows around floor area ratio 1. The highest one has residential FAR 12, the maximum allowed by New York State, and is within very short distance from rapid transit (say, 500 meters intra muros, 200 extra muros). Everything within a kilometer of a train station is at least FAR 4.
I got “but what about ___?” responses re parking and what New York calls a sky exposure plane. This is a YIMBY group, and even there some people were uncomfortable that a proposed code was not exact enough so as to say exactly who is allowed to do what, instead going for the principle that what’s not forbidden is permitted. Even this attempt at a compromise didn’t win much support (what I actually believe is that if urban land is developable based on scientific understanding of environmental protection it should be developable for any purpose and at any density its owner sees fit).
Outside the YIMBY world, the pushback against such a loose code would be severe, because it would not offer local activists the control over their neighbors’ lives that they crave. San Francisco’s affordable housing community was against SB 827, partly because of misguided fears of gentrification, but also partly because the byzantine process in the city allows community groups to extort benefits by threatening to withhold project approval. In comments on my post about free trade in rolling stock, Adam points out that the California Environmental Quality Act was so weaponized by unions, who demanded that a new plant be unionized as a condition for dropping an environmental lawsuit. When corrupt local groups benefit from the ad hoc nature of the process, they will defend it for its own sake, regardless of whether it achieves its stated purpose (affordable housing, environmental protection, etc.).
But corruption alone can’t explain why outside groups like DMI think zoning is valuable for its own sake. My suspicion is that this is ideological: every regulation must have some purpose, so while revising regulations is fine, getting rid of them entirely reeks of free market libertarianism. Since the right attacks the civil service as bloated and parasitic, the left and center-left reflexively defend the civil service no matter what and, by extension, justify its mission. This pattern flips when it comes to the police, but that’s a narrow issue of criminal justice equality, not even affecting the fire department, which is socially similar to the police but gets no hate from the left. A regulator who decides who gets to build what and where does not have the reputation of a brutal cop or border control agent, and can expect sympathy for the left even if the zoning mission serves no useful purpose and creates problems for left-wing goals of affordable housing.
Zoning and Commercialization
YIMBY is a movement that calls for liberalizing land use in order to produce more housing. However, its take on non-residential development is more complicated. I’d always assumed that San Francisco YIMBY was not calling for more commercial development because the Bay Area already builds a lot of office space because of California’s tax incentives, which let municipalities raise taxes on sales but not residential property; however, as a check on this hypothesis I asked YIMBYs in New York, but they too said that office upzoning wasn’t really a priority and only cited mixed projects to me. This approach is usually harmless, but in a few places it creates serious long-term problems, and one of them is the center of SF YIMBY, the South of Market (“SoMa”) area, and the reason is commercialization of near-CBD neighborhoods.
A few months ago I wrote about job sprawl in the US vs. in Europe. In Europe, hostility to high-rise office buildings in most historic city centers has caused jobs to spread to neighborhoods near the CBD, often in the direction of the favored quarter; in the US, CBDs have office towers, but everything right outside them is usually strictly zoned, so jobs sprawl to suburban office parks. Both situations have a number of exceptions (e.g. Kista and La Defense are both examples of high-rise edge cities independent of the CBDs, while Kendall Square and Back Bay are contiguous extensions of the Boston CBD), but for the most part they apply in their respective areas.
In the same way that on a wider scale building more housing in New York and San Francisco would reduce the demand for housing in the places to which these cities’ working and lower middle classes have been pushed out, building more office space in city centers would reduce the demand for suburban office parks. Permitting jobs to move back from suburban edge and edgeless cities to city centers is a good thing, both for urbanism and for transit: for urbanism, the CBD is accessible from all directions (which is why it’s so valuable to begin with), and for transit, congested CBDs tend to maintain decent transit mode shares even in otherwise completely auto-dominated cities.
The political problem is that this requires replacing residential development with commercial development. It’s questionable but possible in European zoning regimes. In the US it’s harder, for several reasons:
- Near-CBD neighborhoods are as far as I can tell never middle or lower middle class. They’re either very poor (though by now they’ve all been urban-renewed) or rich. The greater extent of local empowerment in the US makes it harder to permit office development in rich areas over NIMBY objections.
- American residential zoning is stricter than at least German residential zoning, and as far as I can tell is also stricter than French residential zoning, in that it permits no commercial uses at all, except ground-floor retail on main streets. In particular, doctors, lawyers, and accountants’ offices must go in designated commercial zones in the US.
- American cities are more likely to have low-density neighborhoods in desirable near-downtown areas (for example, Georgetown) and defend their character fiercely through single-family zoning.
While all three factors seem important, the biggest examples of American near-CBD NIMBYism trigger only the first factor. In New York, the main example right now is the Meatpacking District, where there is extensive commercial demand (Google is located there and so do some other tech firms), which already has fairly high residential density, but the residents are rich homeowners who have successfully fought off attempts to build more office space. Historically, Midtown arose this way – rich areas around Fifth Avenue commercialized until the city’s 1916 zoning code put a stop to the practice.
And this brings me back to this post’s motivating example – SoMa. Located right next to the Financial District, with equally good access as the Financial District to the BART and Muni subway spine on Market Street, and better access to Caltrain’s 4th and King terminal, SoMa is a prime target for commercialization. Unfortunately, SF YIMBY opposes this process, saying the city’s zoning plan should add housing there and not office space. The argument is that permitting mostly office space in SoMa would create more demand for housing elsewhere in the Bay Area, exporting San Francisco’s high rents to Oakland and other East Bay cities. Unwittingly, SF YIMBY has turned into a NIMBY group when it comes to the highest and best use in the neighborhood in which it is the strongest.
To SF YIMBY’s credit, it recognizes the similarity between today’s tech workers (who form the vanguard of YIMBY) and last generation’s (who bought houses when they were cheaper than today and form one of several vanguards of area NIMBYism) and is pursuing preemption laws that reduce its own ability to object to growth. But, as preemption is not yet the law, SF YIMBY is opposed to commercialization in its own back yard.
The more specific argument SF YIMBY uses is about jobs-to-bedrooms ratio. Per YIMBY, zoning should have a maximum jobs-to-bedrooms ratio within a neighborhood or city, to prevent creating too much housing demand in other Bay Area cities. Right now, the Proposition 13 regime is such that municipalities derive tax revenues from commercial development but not so much residential development, and so they favor office space. But in reality, the only jobs-to-employed-residents ratio that’s sustainable this way is 1, a ratio that’s far too low for a city that has suburbs, let alone a central neighborhood such as SoMa. The consensus SF YIMBY proposes – an even balance between residential and commercial development everywhere, achieved through preference for housing in areas that are net recipients of inbound commuters – is thus untenable in a major metro area.
The proposed SF YIMBY consensus also does nothing to unseat the current consensus in favor of sprawl. Contrary to the narrative of selfish suburbs that add office space but no housing, the Silicon Valley suburbs are fiercely NIMBY toward high-density office development. Google could never hope to build a supertall skyscraper on top of Mountain View’s train station; it can’t even get permission to build a bridge to let the Googleplex expand to a nearby office park.
The selfish suburbs’ preference is not just office but also sprawl, and blocking commercial development in San Francisco increases sprawl in two distinct ways. First, the tech companies that would like to expand in SoMa – Uber, Slack, Airbnb, and so on – would, if not permitted to build more office space, open more back offices in sprawling areas, in or outside the Bay Area. And second, office development in the suburbs is only accessible to people from one wedge of the metro area, which encourages people to move to exurbs on the outer side, for example Gilroy for development in San Jose.
To counteract the tendency of hyperlocal planning to produce sprawl and replace the single-family housing consensus, the consensus YIMBY should seek is not about managing office-to-residential space ratios, but about letting places densify in whatever ways the market deems to have the highest and best use. In a high-demand place like San Francisco or New York, this means a consensus in favor of a bigger, faster-growing city, using its high productivity to add more people, offices, and apartments, rather than to increase the property values of the incumbents. Plan for long-term growth and long-term changes in zoning rules and don’t play the demand suppression game that NIMBYs love.
Why Free Trade in Rolling Stock is Good
Classical economics asserts that if two countries freely trade, then both gain relative to a baseline in which they don’t trade. The classical theory of comparative advantage hinges on reciprocal free trade. But more recently, economists have begun to push for entirely domestic support for free trade, arguing that reducing trade barriers is good even without reciprocation. The arguments involve corruption and misallocation of capital coming from protectionism. Whatever criticism there may be of this neoliberal conception of trade, rolling stock appears to be an example in which this conception is right.
I have previously criticized informal French protectionism in high-prestige procurement for blowing up Parisian rolling stock costs by a factor of almost 2. In Paris, my example of what could be done with the money Ile-de-France Mobilités is wasting on rolling stock was infrastructure construction, justified by the city’s very low construction costs relative to ridership (if not relative to route-length). But there’s an even better set of examples of high costs in the United States, justified on labor grounds and yet involving wastes of money disproportionate to the number of jobs created.
Last month, The American Prospect published an article about a union push to have more US rolling stock made in America, by unionized workers. The TAP article talks about a light rail vehicle order in Los Angeles for $890 million, for what the article says is 175 cars and what manufacturer Kinki Sharyo and other industry sources say is 235 cars, built at a dedicated factory in the Los Angeles exurbs. The purpose of the article is to advocate for more protectionism for the sake of American union members, so it details the wages the workers are making (about $20 an hour, up from $11 for unskilled jobs elsewhere) but does not delve into comparative costs. It’s worth asking if the costs are competitive, and the answer is that they are not.
The cost of LACMTA’s Kinki Sharyo order is $3.8 million per car; these cars are 27 meters long, so this translates to $140,000 per meter of train length. In contrast, the average cost in Europe appears to be just under $100,000 per meter, across a variety of cities and models:
- In Bordeaux, a recent Citadis tram order cost $80,000 per meter.
- In Strasbourg, the Citadis cost $95,000 per meter.
- In Avignon, the Citadis Compact cost $95,000 per meter.
- In Aubagne, the Citadis Compact cost $100,000 per meter.
- In Budapest, an order for Urbos trams cost $95,000 per meter.
- In Birmingham, the launch customer for the Urbos, they cost £2 million per unit, and at 33 meters per car, it’s around $90,000 per meter.
- In Luxembourg, the Urbos cost €3.95 million per unit, each at 45 meters, or $110,000 per meter, and include catenary-free operation.
- In Munich, the launch customer for the Avenio, the trams cost $120,000 per meter.
- In the Hague, the Avenio cost $90,000 per meter.
The shortest trains on this list (the Citadis Compact orders, at 22-24 meters) are in the middle of the pack, so it’s unlikely there’s any nonlinearity in cost; moreover, the Compact is slightly shorter than the Kinki Sharyo trains, so no extrapolation is required, only interpolation.
The LACMTA order follows another premium-priced light rail order in the same state: as I wrote in the Bay City Beacon last year, Muni Metro’s Siemens LRV order cost about $4 million per 23-meter car, about $170,000 per meter of train length. The trains are being built at a new plant in Sacramento.
The United States has federal Buy America laws, requiring federally-funded contracts to buy domestic products provided they cost no more than 25% more than equivalent imports. However, there is no in-state purchase requirement. Owing to large New York City Subway orders, some vendors have long-established plants near New York (Kawasaki and Alstom are in-state, Bombardier is in Vermont). However, under informal pressure from activists within California to provide good local jobs, LACMTA asked bidders to open local factories. Moreover, Siemens most likely placed its plant in Sacramento rather than in lower-cost states in order to curry favor with state-funded orders.
We even see the same problem in Massachusetts, where CRRC opened a plant in Springfield for an MBTA Red and Orange Line car order. The order itself does not come at a premium – according to Metro Report the base order is about $100,000 per meter of train length and the option is $115,000, and the range of per-meter costs for subway trains is the same as that for LRVs – but it’s possibly a loss leader to help establish CRRC as a player in the American market. Even before Trump’s election, Congress investigated the order, which beat the competitors by a large margin; the competing bids were about $135,000 per meter for the base order. It says a lot about Massachusetts’ broken procurement that it takes a loss leader just to get costs down to their international levels. Nonetheless, the US premium does appear to be smaller for large subway orders than for small and medium-size LRV orders, since the extra costs of siting and setting up a factory are spread across more units.
The explicit goal of local content requirements is to create jobs. This is usually justified in terms of inequality and bleak prospects for unskilled workers. However, there is no cost-benefit calculation involved in this. According to TAP, the LACMTA order is creating 250 jobs manufacturing the trains; it doesn’t say how long they will last, but the duration of the contract is about 6 years. But the premium, about $300 million, works out to $1.2 million per job, a large multiple of total compensation to the workers. The Springfield plant has 200 jobs paying $50,000-60,000 per year, lasting 7 years across more than just the Boston contract; pro-rating to the Boston contract’s share of orders from the plant, the jobs will last around 5 years. Adding back the premium charged by the competing vendors raises the cost to $1 million per job, again a multiple of total working-class compensation.
There are two reasons why labor protectionism costs so much compared with its direct impact on working-class hiring. The first is leakage: much of the premium goes to management, including factory design and construction, or is just wasted on inefficiency (CRRC is opening a second American plant, in Chicago, instead of building everything at one plant). Some of the money goes to foreign consultants with the vendor and some stays domestic, but the domestic leakage goes to sitework and not to direct hiring.
The second reason is corruption and degradation of institutions. When the goal of public procurement is not just to buy the best product in terms of cost and quality, lobbyists make demands, like local hiring, that corrupt the process. A city that signals that the only things that matter are cost and quality will attract vendors who make the best bids in terms of cost and quality; a city that signals that the process depends on local political needs will attract vendors who make bids in order to satisfy local political actors, who as a rule don’t give a damn about good transit. Thus American agencies buy trains at a premium well beyond Buy America’s 25% limit, just because they think of cost and quality as just two of several political priorities and not as the sole legitimate bases of choosing a bidder.
The United States leads the world in higher education costs. The unsubsidized cost of a college degree at a good public university is about $100,000; at CUNY, which provides a good quality of degrees even if it’s so underfunded that classrooms aren’t supplied with chalk, it’s about $75,000. Stipends at the level of a good graduate program add another $30,000 or so per year. For around $200,000 per person, California could send low-income workers to college and pay for their living expenses for the duration of the degree, whereupon they will be able to get unsubsidized jobs paying much more than $20 per hour. For workers who can’t go to college, trade school is another option, offering decently-paying jobs for much lower cost since they take much less time. There is no need to lade the transit capital budget with what should be state or federal retraining grants; given the massive difference in cost, even the loss of matching funds (i.e. other people’s money) can leave the state or the city better off.
The problem is that there is no political incentive to think in such terms. Part of it is the corruption of institutions, as I mentioned already: labor groups see an opportunity to create jobs from a budget that from a local perspective is other people’s money. Another part is political prestige: romantics like old jobs (farmer, builder, truck driver, coal miner, baker, factory worker), which have had enough time to percolate into the national psyche, and since these jobs are old, they’re likely to be at the low end of the value-added ladder.
Absent very strong rules forbidding protectionism in procurement, this corruption will continue: evidently, Paris insists on buying expensive bespoke trains and somehow manages to get them manufactured within France, even though EU rules against interstate dumping are much stronger than US rules. Rules at the highest level are required to discourage such behavior (although Paris might still waste money on bespoke trains, just ones that can be made in Poland). Congress can and should stop funding any local or state agency that takes in-state content into account in procurement; the US is one democratic country, not fifty mercantile fiefdoms, and should use its status as a superstate with a large internal market to universalize good governance.
Consumption Theory and Gentrification
I recently saw an article about location decisions by education in the Netherlands. The article discusses the impact of rail investment on different social classes, and claims that,
A recent study by Teulings et al. (2018) uses microdata to quantify the differences in the willingness to pay for particular locations between the high and low educated (omitting the medium education level) (Figure 2). It shows willingness to pay for the job availability (based on the locally available transport infrastructure to commute to these jobs) and urban amenities such as parks and historic scenery at the location. The highly educated (right panel) are very sensitive to the quality of a location.
The claim is that educated people prefer central cities, in this case Amsterdam, because of their consumption amenities. This is the consumption theory of gentrification, which holds that the process of gentrification is caused by a middle-class taste for urban amenities. However, this theory appears incorrect, on several levels. The references cited in the paper for location decisions do not really bear out consumption theory. Moreover, the history of gentrification strongly suggests that, if consumption amenities are at all involved, then they have been stable for at least a hundred years.
Instead of consumption theory, the best explanation is that location decisions are about jobs. Certain cities have higher production amenities, especially for the middle class, leading the middle class to preferentially move to them to obtain higher-income jobs. The choice of neighborhood is then driven by access to skilled jobs, usually in the CBD but sometimes also in new job clusters. If there’s gentrification, the cause is insufficient housing in closer-in areas, leading to spillover to adjacent neighborhoods.
The references
The internal reference cited for it in the paper, the work of Coen Teulings, Ioulia Ossokina, and Henri de Groot, breaks down willingness to pay higher rents in expensive cities (i.e. Amsterdam) based on job access and several consumption amenities. The paper’s headline numbers superficially bear out consumption theory: table 7 on page 23 says that job availability is only responsible for 38% of low-education people’s variance in willingness to live in expensive cities and 28% of high-education people’s variance; the rest comes from amenities. However, a closer reading suggests that this is not really about consumption amenities.
First, that 28% of middle-class location choice comes from job access does not mean 72% comes from amenities. Observed consumption amenities are only 18% (and only 14% for low-education workers); the rest is unobserved amenities (30%), which are a residual rather than any identified amenities, and covariances between jobs and amenities.
Moreover, the consumption amenities listed are proximity to restaurants, monuments, parks, and a university. Is a university really a consumption amenity for the middle class? This is unlikely. Graduates don’t really have the same consumption basket as students. Instead, what’s more likely is that universities provide skilled employment for a particular set of high-education workers (namely, academics and other researchers), who are willing to pay extra to be near work; academic job markets are so specialized that access to non-academic high-education work isn’t as important. Of course, universities also have extensive working-class employment, but a university janitor can get a similar job at a non-academic environment, and therefore has no reason to locate specifically near a university rather than another source of work, such as a hospital or office building.
Finally, there is a second reference in the article, reinforcing its claims about location decisions with American data. This is a paper by David Albouy, Gabriel Ehrlich, and Yingyi Liu. Albouy, Ehrlich, and Liu’s text does not endorse consumption theory – on the contrary, their discussion blames “policies and regulations that raise rents by creating artificial shortages in housing supply” (pp. 28-29). On the question of consumption theory, the results of the study are inconclusive. They do not look directly at amenities that critics of gentrification typically implicate in causing the middle class to displace the poor; the amenities they consider include mild climate, clean air, and a sea view.
The history of gentrification
The word “gentrification” was coined in 1964 to describe the process in Islington. However, Stephen Smith has argued from looking at historical rents that the process goes much further back. He finds evidence of gentrification in Greenwich Village in the 1910s and 20s. Already then, the middle class was beginning to move into the Village, previously a working-class district. Jane Jacobs moved in in 1935. She was income-poor, as were many other people in the Depression, but on any marker of class, she was solidly comfortable: her father was a doctor, she herself was a high school graduate and had some college education at a time when most Americans had never gone to high school, and her job was in journalism, at the time a middle-class career path.
In the 1950s and 60s, this process continued in full swing, in the Village and other inner neighborhoods of New York, such as the Upper West Side, which unlike the Upper East Side was originally rowdy (West Side Story is set there). Developers were building taller buildings, to Jacobs’ consternation, to house the growing middle-class demand.
I focus on early gentrification in New York and not London, because in this era, the American middle class was fleeing cities. In the 1950s New York was poorer than its suburbs. The wealthiest strata of the city had decamped to Westchester and Fairfield Counties starting in the 1910s and 20s (in 1930 Westchester had 520,000 people, more than half of today’s level, and more than Long Island). Then in the 1950s and 60s this process spread to the entire white middle class, causing a population surge on Long Island, in New Jersey, and in the parts of Westchester and Fairfield that the rich hadn’t already settled in. Moreover, companies were moving out of city centers, often to be closer to the CEO’s home, including General Electric (which moved to the town of Fairfield in 1974) and IBM (which moved to Armonk in 1964). Middle-class taste at the time was firmly suburban.
A better explanation for the early history of gentrification in New York concerns the subway. Before the subway opened, the working class had to live right next to the Lower Manhattan CBD and commute on foot. The els did provide some options for living farther uptown, but they were slow and noisy (they were only electrified around the time the subway opened) and until the early 20th century the working class could not afford the 5-cent fare. This led to extreme levels of overcrowding just outside the CBD, most infamously on the Lower East Side. In 1900, most of Manhattan was open to the middle class but only the Lower East and West Sides were open to the working class. By 1920, the fast subway and the 5-cent fare (held down despite post-WW1 inflation) made all of Manhattan open to everyone, making it easier for the middle class to outbid the poor for housing in the Village.
Production theory
The paper cited at the beginning of this post does not profess consumption theory; it claims that both production and consumption amenities explain gentrification. However, the actual work within the paper leans heavily toward production. It looks at the effect of opening a new rail line from the suburbs to Amsterdam, and finds that this leads to middle-class displacement of lower-education residents, who have less use for the train service. This is also consistent with what working-class residents of some Parisian banlieues think: a newspaper article I can no longer find cites people within Seine-Saint-Denis complaining that all Grand Paris Express will do is raise their rents.
In addition to being more consistent with Dutch and American evidence and American history, production theory benefits from not relying on special local explanations for a global trend. A process that began at similar development levels in the US and Western Europe is unlikely to be about American race relations. Even Tokyo is seeing gentrification in the sense that industrial waterfront areas are redeveloped, if not in the sense of mass displacement seen in New York, London, and other cities with stricter zoning.
There is no burning middle-class desire to live near poor people – quite the opposite, in fact. When the middle class does begin gentrifying a neighborhood, it’s because it offers convenient access to jobs. The same is true on the level of an entire city: San Francisco did not magically become a nicer place to live in when the current tech boom began – if anything, rising rents have led to a homelessness problem, which makes professional workers uncomfortable. A city that wishes to forestall gentrification will make it easy to build housing in the areas with the best job access, in order to encourage people to have short commutes rather than seeking increasingly marginal neighborhoods to move to.
Do Rich and Poor People Work in Different Neighborhoods?
There are workplaces where most employees are high-income, for example office towers (or office parks) hosting tech firms, law firms, or banks. There are workplaces where most employees are working-class, for example factories, warehouses, and farms. Does this lead to a difference in commuting patterns by class? I fired up OnTheMap two days ago and investigated. This is American data, so it stratifies workers by income, education, industry, or race rather than by job class. I generated maps for New York and saw the following:
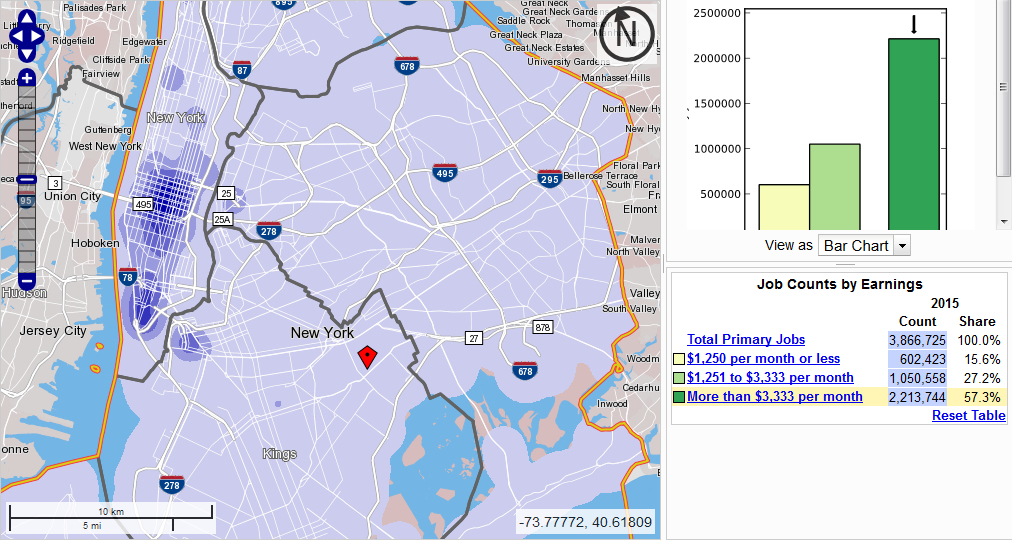
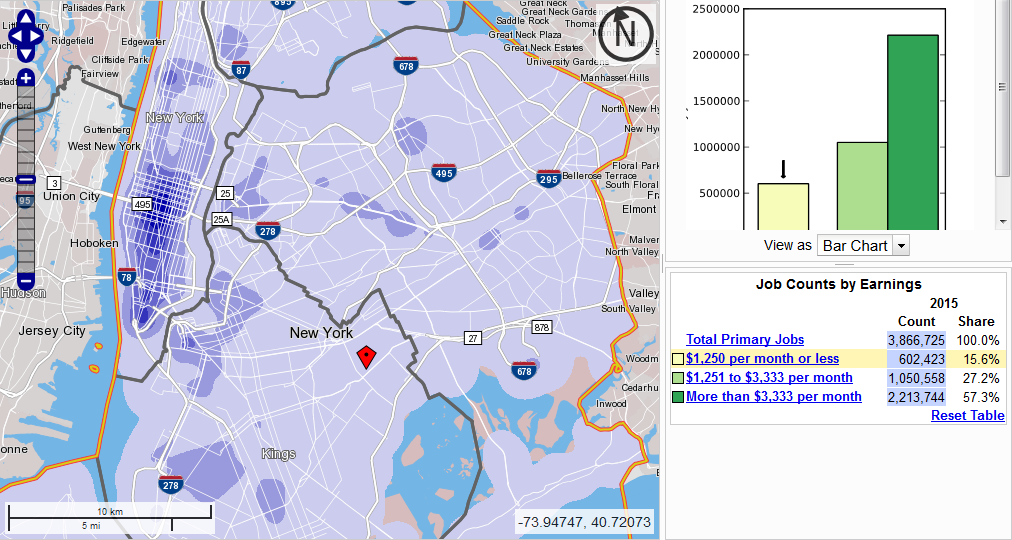
There are three income classes available, and I looked at the bottom and top ones, but the middle one, still skewed toward the working class, looks the same as the bottom class. The biggest observation is that Midtown is dominant regardless of income, but is more dominant for middle-class workers (more than $40,000 a year) than for low-income ones (up to $15,000, or for that matter $15,000-40,000).
The colors are relative, and the deepest shade of blue represents much more density for middle-class workers, even taking into account the fact that they outnumber under-$15,000 workers almost four to one. Among the lowest-income workers we see more work on Queens Boulevard and in Williamsburg, Flushing, and the Hub, but these remain tertiary workplaces at most. The only place outside Midtown, Lower Manhattan, or Downtown Brooklyn (which includes all city workers in Brooklyn due to how the tool works, so it looks denser than it is) that has even the third out of five colors for low-income workers is Columbia, where the low-income job density is one-third that of Midtown, and where there is also a concentration of middle-class workers.
The same pattern – job centers are basically the same, but there’s more concentration within the CBD for the rich – also appears if we look at individual neighborhoods. Here is the Upper East Side versus East Harlem:
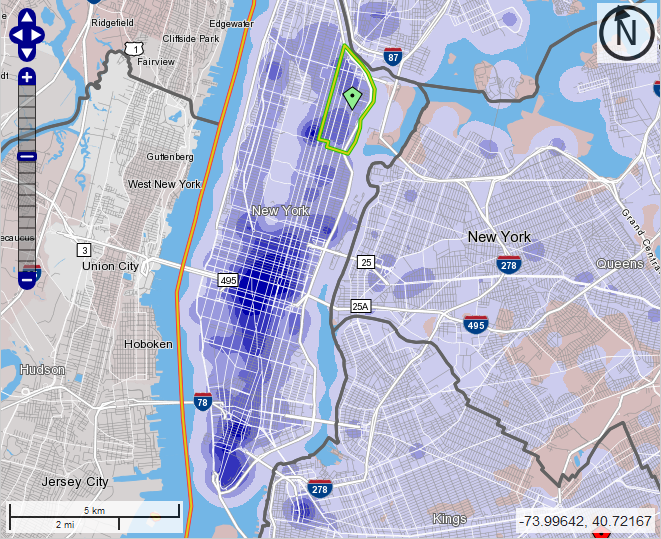
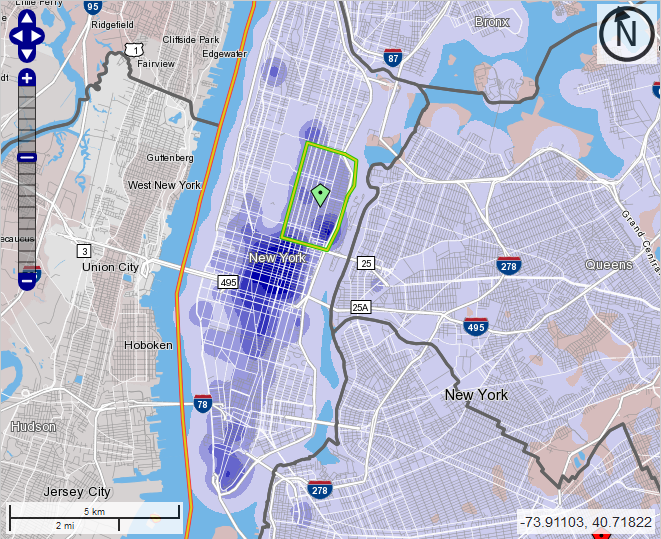
I chose these two neighborhoods to compare because they exhibit very large differences in average income and are on the same subway line. Potentially there could be a difference between where East Siders and West Siders work due to the difficulty of crosstown commuting, so I thought it would be best to compare different socioeconomic classes of people on the same line. With the East Side-only restriction, we see two Uptown job centers eclipse Columbia: Weill-Cornell Medical Center in Lenox Hill at the southeast corner of the Upper East Side, and Mount Sinai Hospital at the northwest corner.
One place where there is a bigger difference is the definition of Midtown. Looking at the general job distribution I’d always defined Midtown to range between 34th and 59th Street. However, there are noticeable differences by income:
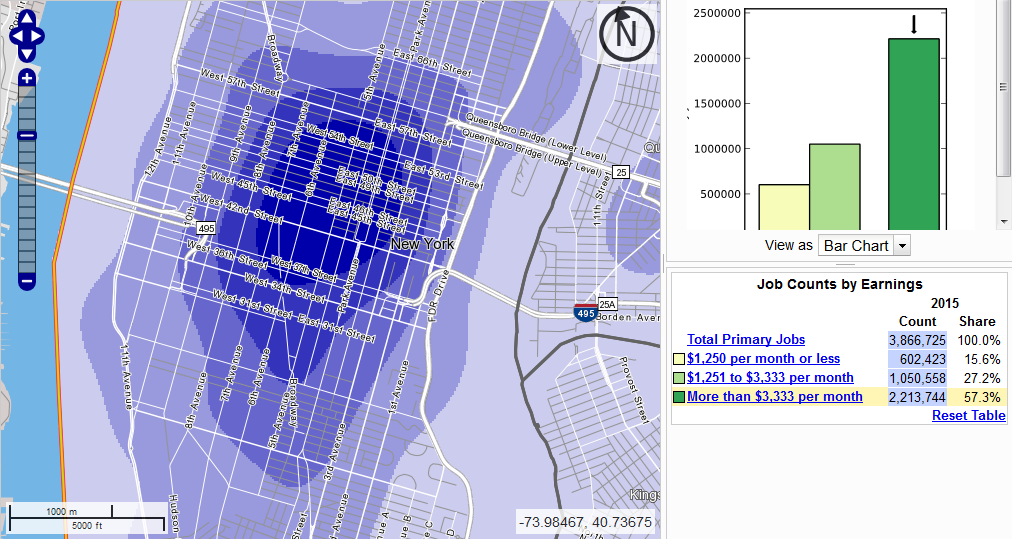
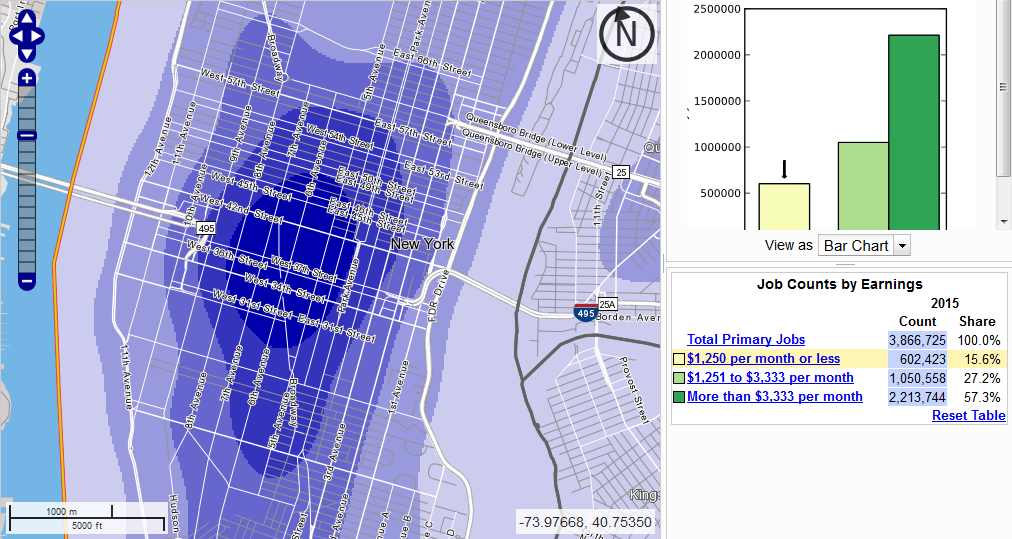
For the middle class, Midtown ranges from 34th to 57th Street and peaks around 47th. For the lowest-income workers, it ranges from 28th to 49th and peaks in the high 30s. My best explanation for this is that Midtown South and Union Square are more retail hubs than office hubs, featuring department stores and shopping centers, where the rich spend money rather than earning it.
In a deindustrialized country like the US or France, the working class no longer works in manufacturing or logistics. There are a lot of truck drivers today – 3.5 million in the US – but in 1920 the American railroad industry peaked at 2.1 million employees (source, PDF-p. 15), nine times today’s total, in a country with one third the population it has today and much less mobility. Manufacturing has plummeted as a share of employment, and is decreasing even in industrial exporters like Germany and Sweden. Instead, most poor people work at places that also employ many high-skill, high-income workers, such as hospitals and universities, or at places where they serve high-income consumption, such as retail and airports.
Since the working class works right next to the middle class, the nature of bosses’ demands of workers has also changed. Low-skill works now involves far more emotional labor; in Singapore, which makes the modern-day boss-worker relationships more explicit than the Anglosphere proper, there are signs all over the airport reminding workers to smile more. Nobody cares if auto workers smile, but they’re no longer a large fraction of the working class.
With the working class employed right next to the middle class, there is also less difference in commuting. For the most part, the same transportation services that serve middle-class jobs also serve working-class jobs and vice versa. This remains true even across racially segregated communities. The patterns of white New York employment are similar to those of middle-class New York employment, and those of black, Hispanic, and Asian employment are similar to those of the working class, with small differences (Asians are somewhat more concentrated in Flushing, and blacks in Downtown Brooklyn, reflecting the fact that blacks are overrepresented in public employment in the US and all city workers in Brooklyn are counted at Court Square).
This is true provided that opportunities for transportation are available without class segregation. This is not the situation in New York today. Commuter rail actually serves working-class jobs better than middle-class jobs, since Penn Station is closer to the department stores of 34th Street than to the office towers in the 50s. However, it’s priced for the middle class, forcing the working class to take slower buses and subway trains.
When I posted the above maps on Twitter, Stephen Smith chimed in saying that, look, the poor are less likely to work in the CBD than the middle class, so everywhere-to-everywhere public transportation is especially useful for them. While Stephen’s conclusion is correct, it is not supported by this specific data. In the $40,000 and up category, 57% of city jobs are in Manhattan south of 60th Street, compared with 37% in the $15,000-40,000 and under-$15,000 categories. It’s a noticeable difference, but not an enormous one. The reason Stephen is correct about how rides crosstown transit is different: people who can afford cars are very likely to drive if the transit option is not good (which it isn’t today), whereas people who can’t are stuck riding slow crosstown buses; in contrast, for CBD-bound commutes, the subway and commuter rail work reasonably well (especially at rush hour) and driving is awful.
Instead of trying to look specifically at low-income and middle- and high-income job centers, it’s better to just plan transit based on general commute patterns, and let anyone take any train or bus. This doesn’t mean business as usual, since it requires transitioning to full fare integration. Nor does this mean ignoring residential segregation by income, which in some cases can lead to transit segregation even in the face of fare integration (for example, the crosstown buses between the Upper East Side and Upper West Side have mostly white, mostly middle-class riders). Finally, this doesn’t mean relying on middle-class transit use patterns as a universal use case, since the middle class drives in the off-hours or to off-CBD locations; it means that relying on middle-class transportation needs could be reasonable. It just means that the rich and poor have substantially the same destinations.
An even bigger implication relates to questions of redevelopment. There have been periodic complaints from the left about gentrification of jobs, in which working-class job sites are turned over to high-end office and retail complexes. For example, Canary Wharf used to be the West India Docks. In New York, Jane Jacobs’ last piece of writing before she died was a criticism of Greenpoint rezoning, in which she specifically talked up the importance of keeping industrial jobs for the working class. But since the big deindustrialization wave, developments brought about by urban renewal, gentrification, and industrial redevelopment have not had any bias against providing employment for the poor. It’s not the factory jobs that the unionized working class still culturally defines itself by, but it’s industries that are hungry for low-skill work, and in many cases are serious target of unionization drives (such as universities).
Buses in Brooklyn: Frequency is Freedom, but 15 Minutes isn’t Frequency
I’ve recently started working part-time on a project for the Marron Institute at NYU about bus restructuring in Brooklyn; at the end of this summer, I expect to release a proposal for service upgrades and a new map. I’m working on this with Marron scholar Eric Goldwyn, who is funded by the TWU, which is worried that ridership collapse may lead to service cuts and job losses, but I’m funded directly by Marron and not by the union.
Some of what’s likely to appear in the final report should be familiar to regular readers of this blog, or of Human Transit, or of the work TransitCenter has been doing. As I wrote in Curbed earlier this year, bus operating costs in New York are unusually high because the buses are slow, as the main operating costs of buses scale with service-hours and not service-km. Thus, it’s important to speed up the buses, which allows either providing higher frequency at the same cost or the same frequency at lower cost. A bus speedup should include systemwide off-board fare collection and all-door boarding (common in the German-speaking world but also in San Francisco), wider stop spacing, dedicated lanes wherever there is room, and signal priority at intersections; the TWU is an enthusiastic proponent of off-board fare collection, for reasons of driver safety rather than bus speed.
While bus speedups are critical, their impact is not as Earth-shattering as it might appear on paper. New York’s SBS routes have all of the above features except signal priority, and do save considerable time, but are still slow city buses at the end of the day. Brooklyn has two SBS routes: the B44 on Nostrand, averaging 15 km/h (local B44: 11.3), and the B46 on Utica, averaging 13.7 (local B46 on the shared stretch: 10.8). Their speed premiums over the local routes are toward the high end citywide, but are still 30%, not the 200% speed premium the subway enjoys. Moreover, the speed premium over non-SBS limited routes is 15-20%; put another way, between a third and a half of the speed premium comes purely from skipping some stops.
I mentioned in my last post that I met Carlos Daganzo at Berkeley. Daganzo was responsible for the Barcelona bus redesign, Nova Xarxa; you can read some details on Human Transit and follow links to the papers from there. The guiding principles, based on my conversation with Daganzo and on reading his papers on the subject, are,
- Barcelona has high, relatively uniform density of people and jobs, so there’s no need for buses to hit one CBD. Brooklyn has about the same average residential density as Barcelona, but has a prominent CBD at one corner, but as this CBD is amply served by the subway, it’s fine for buses to form a mesh within the subway’s gaps.
- Nova Xarxa involved widening the stop spacing in Barcelona from less than 200 meters to three stops per km, or a stop every 300-350 meters; Daganzo recommends even wider stop spacing.
- While Barcelona’s street network is strictly gridded, the buses don’t run straight along the grid, but rather detour to serve key destinations such as metro stops. This is an important consideration for Brooklyn, where there are several distinct grids, and where subway stops don’t always serve the same cross street, unlike in Manhattan, where crosstown routes on most two-way streets are assured to intersect every north-south subway line.
- The percentage of transfers skyrocketed after the network was implemented, standing at 26% at the end of 2015, with the model predicting eventual growth to 44%, up from 11% before the redesign.
- The network was simplified to have 28 trunk routes, the least frequent running every 8 minutes off-peak.
The high off-peak frequency in Barcelona is a notable departure from Jarrett Walker’s American network redesigns; the evidence in Houston appears mixed – ridership is about flat, compared with declines elsewhere in the country – but the percentage of transfers does not seem to have risen. Jarrett says in his book that having a bus come every 10 minutes means “almost show-up-and-go frequency” with no need to look at schedules, but his work in Houston and more recently in San Jose involves routes running every 15 minutes.
Moreover, unreliable traffic in these car-dominated cities, in which giving buses dedicated lanes is politically too difficult, means that the buses can’t reliably run on a schedule, so the buses do not run on a clockface schedule, instead aiming to maintain relatively even headways. (In contrast, in Vancouver, a less congested street network, with priority for all traffic on the east-west main streets on the West Side, ensures that the buses on Broadway and 4th Avenue do run on a fixed schedule, and the 4th Avenue buses have a 12-minute takt that I still remember four years after having left the city.)
I’ve talked about the importance of radial networks in my posts about scale-variant transit. I specifically mentioned the problem with the 15-minute standard as too loose; given a choice between an untimed 15-minute network and a timed 30-minute network, the latter may well be more flexible. However, if the buses come every 5 minutes, the situation changes profoundly. Daganzo’s ridership models have no transfer penalty or waiting penalty, since the buses come so frequently. The models the MTA uses in New York have a linear penalty, with passengers perceiving waiting or transferring time on the subway as equivalent to 1.75 times in-motion time; bus waiting is likely to be worse, since bus stops are exposed to the elements, but if the average wait time is 2.5 minutes then even with a hefty penalty it’s secondary to in-vehicle travel time (about 18 minutes on the average unlinked bus trip in New York).
Unfortunately, that high frequently does not exist on even a single bus line in Brooklyn. Here is a table I created from NYCT ridership figures and timetables, listing peak, reverse-peak, and midday frequencies. Five routes have better than 10-minute midday frequency: the B12, the B6 and B35 limited buses, and the B44 and B46 SBSes, running every 7, 7.5, 8, 8, and 6 minutes respectively. In addition, the B41 limited and B103 have a bus every 9 and 7.5 minutes respectively on their trunks, but the B41 branches on its outer end with 18-minute frequencies per branch and the B103 short-turns half the buses. Another 14 routes run every 10 minutes off-peak, counting locals and limiteds separately.
The problem comes from the split into local and limited runs on the busiest buses. The mixture of stopping patterns makes it impossible to have even headways; at the limited stops, the expected headway in the worst case is that of the more frequent of the two routes, often about 10 minutes. The average ridership-weighted speed of Brooklyn buses is 10.75 km/h. An able-bodied passenger walking at 6 km/h with a 10-minute head start over a bus can walk 2.25 km before being overtaken, which can easily grow to 3 km taking into account walking time to and from bus stops. To prevent such situations, it’s important to run buses much more frequently than every 10 minutes, with consistent stopping patterns.
This does not mean that NYCT should stop running limited buses. On the contrary: it should stop running locals. The SBS stop spacing, every 800 meters on the B44 and B46, is too wide, missing some crossing buses such as the B100 (see map). However, the spacing on the B35 limited is every 400 meters, enough to hit crossing buses even when they run on one-way pairs on widely-spaced avenues. The question of how much time is saved by skipping a stop is difficult – not only do different Brooklyn buses give different answers, all lower than in Manhattan, but also the B35 gives different answers in different directions. A time cost of 30 seconds per stop appears like a good placeholder, but is at the higher end for Brooklyn.
The question of how many stops to add to SBS on the B44 and B46 has several potential answers, at the tight end going down to 400 meters between stops. At 400 meters between stops, the B44 would average 13 km/h and the B46 12 km/h. At the wide end, the B44 and B46 would gain stops at major intersections: on the B44 this means Avenue Z, R, J, Beverly, Eastern Parkway, Dean, Halsey, and Myrtle, for an average interstation of 570 meters and an average speed of 14 km/h, and on the B46 this means Avenue U, Fillmore, St. John’s, and Dean, for an average interstation of 610 meters an average speed of 13 km/h. Consolidating all buses into the same stopping pattern permits about a bus every 2.5 minutes peak and every 4 minutes off-peak on both routes.
On the other routes, consolidating local and limited routes required tradeoffs and cannibalizing some peak frequency to serve the off-peak. While it may seem dangerous to limit peak capacity, there are two big banks that can be used to boost off-peak frequency: time savings from faster trips, and greater regularity from consolidating stop patterns. The B82 is an extremely peaky route, running 7 limited and 10 local buses at the peak and just 6 buses (all local) for a four-hour midday period; but there is a prolonged afternoon shoulder starting shortly after noon with another 6 limited buses. Some peak buses have to be more crowded than others just because of schedule irregularity coming from having two distinct stop patterns. Consolidating to about 15 buses per hour peak and 10 off-peak, cannibalizing some frequency from the peak and some from the shoulders, should be about neutral on service-hours without any additional increase in speed.
The sixth post on this blog, in 2011, linked to frequent maps of Brooklyn, Manhattan, and Bronx buses, using a 10-minute standard. There has been some movement in the top buses since 2011 – for one, the B41 route, once in the top 10 citywide, has crashed and is now 16th – but not so much that the old map is obsolete. A good place to start would be to get the top routes from a 10-minute standard to a 6-minute standard or better, using speed increases, rationalization of the edges of the network, and cannibalization of weak or subway-duplicating buses to boost frequency.
Joe Lhota Admits Defrauding the Public About Costs
The Wall Street Journal is reporting a bombshell story about New York’s subway station renovation program. The MTA had a budget of $936 million for renovating 32 subway stations, but nearly the entire budget is exhausted after the MTA has spent it on only 19 stations. These renovations do not include accessibility, which New York is lagging on. I’m interviewing people in the disability rights community about New York’s problems in this area, but the smoking gun about Lhota is not that issue, on which he is no worse than anyone else. Rather, it’s that Lhota hid the fact of the cost overrun from the MTA board. Per the Journal:
On Monday, Carl Weisbrod, a commissioner who represents New York City, said the program was “ill-conceived,” and that he is glad it has come to an end.
“I don’t know when the MTA management realized that the program had run out of money but it would’ve been helpful to have informed the board when this matter was under discussion,” he said.
Mr. Lhota said he was aware of the increased costs last year, but he chose not to mention it until now. “I didn’t think it was relevant to the debate,” he said.
An alternative way to phrase Lhota’s own words is that he is concealing critical information from the public relevant to public spending priorities. In other words, he is defrauding the public when it comes to costs. Previously he had been merely making excuses for high construction costs (e.g. saying New York, founded in the 17th century, is old, and thus naturally has higher costs than cities founded in the Middle Ages or even in Antiquity). But now it turns out that he’s not only trying to deflect criticism, but is actively putting obstacles in front of board members, journalists, and ordinary citizens who want to discuss MTA capital expansion.
Absent democratic mechanisms for oversight of the state, the state will not engage in cost-effective projects. We know this, because the part of public policy most insulated from public criticism, the military and security in general, is the most bloated. The US is wasting a trillion and a half dollars on the F-35, and allies like Israel are wasting money buying this jet from the US military industry. It’s hard to question the costs when overconfident military commanders say “this is necessary for national security.” The intelligence community is even worse, with self-serving slogans like “our successes are private and our failures are public.”
Evidently, facing criticism over costs, domestic agencies portray their projects as necessary rather than useful, hence the weak claims that Gateway is required to avoid shutting down rail service across the Hudson. My specific criticism of the argument that Gateway is required is that the study recommending long-term shutdowns of the existing tunnels did not even attempt to provide a comparative cost of maintaining the tunnels on nights and weekends as is done today. An informed public can more easily demand an end to bad investments, and specific interest groups can highlight how they are harmed by bad spending: the Journal article mentions disability rights advocates demanding that the MTA instead spend money on putting elevators at stations to make them accessible to people in wheelchairs.
The station renovations are especially at risk of being canceled if an informed public finds their costs offensive. The benefits include better maintenance standards, but those are almost self-evidently useful but not necessary. Activists can complain about costs or demand that the money be spent elsewhere.
In Astoria, activists complain that the MTA is renovating stations at a cost of $40 million per station without even installing elevators for accessibility. In London, the cost of the Step-Free Access program is £200 million for 13 stations, or about $20 million per station, and in Paris, where only Metro Line 14 and the RER A and B are accessible, disability rights activists estimate the cost of making the remaining 300 stations accessible at €4-6 billion. This is profoundly different from the situation with tunneling costs, where London has a large premium over Paris and New York has a large premium over London. It is likely that New York can install elevators at the same cost of its top two European peers if it puts its mind to it.
However, such investments are not possible under the current leadership. If a hack like Lhota stays in charge of the MTA, there is not going to be transparency about contracting and about costs, which means that small overruns can blow out of proportion before anyone notices. In such an environment, high costs are not surprising. If New York State is interested in good, cost-effective transit, it will get rid of Lhota and replace him with an experienced transit manager with a good history regarding cost control and respect for the democratic process.
New York-Area Governments to Form a Coordinated Transportation Planning Agency
Governors Andrew Cuomo (D-NY) and Phil Murphy (D-NJ) announced that they would cooperate to form a Lower Hudson Transportation Association, or LHTA, to supersede what they described as antiquated 20th-century thinking and bring the region’s transportation into the 21st century. LHTA would absorb the transportation functions of Port Authority, which senior New York state officials speaking on condition of anonymity called “irredeemably corrupt,” and coordinate planning across the region. Negotiations with the state of Connecticut are ongoing; according to planners in New Jersey, the timing for the announcement was intended to reassure people that despite the lack of federal funding for Gateway, a lower-cost modified version of the project would go forward.
But the first order of business for LHTA is not Gateway. The governors’ announcement mentioned that LHTA would begin by integrating the schedules and fares throughout the region. By 2019, passengers will be able to transfer between the New York City Subway and PATH for free, and connect from the subway to the AirTrain JFK paying only incremental fare. Engineering studies for removing the false walls between PATH and F and M subway platforms are about to begin.
Commuter rail fare integration is also on the table. Currently, the fare on the subway is a flat $2.75. On commuter rail, it is higher even within New York City: a trip between Jamaica Station and New York Penn Station, both served by the E line of the subway, is $10.25 peak or $7.50 off-peak on the Long Island Railroad (LIRR). The governors announced that they would follow the lead of European transportation associations, such as Ile-de-France Mobilités in Paris, and eliminate this discrepancy under LHTA governance, which also includes revenue sharing across agencies. Detailed studies are ongoing, but in 2019, LHTA will cut commuter rail fares within New York City and several inner cities within New Jersey, including Newark, to be the same as the subway fare, with free transfers.
Simultaneously, LHTA will develop a plan for schedule integration, coordinating New Jersey Transit, the LIRR, Metro-North, and suburban bus agencies. In order to make it easier for suburban passengers to reach commuter rail stations, the suburban buses will be timed to just meet the commuter trains, with a single ticket valid for the entire journey. Today most passengers in the suburbs drive to the commuter rail stations, but the most desirable park-and-rides are full. Moreover, the states would like to redevelop some of the park-and-rides as transit-oriented development, building dense housing and retail right next to the stations in order to encourage more ridership.
Moreover, the LIRR and New Jersey Transit’s commuter trains currently stub-end at Penn Station in opposite directions. LHTA is studying French and German models for through-running, in which trains from one suburb run through to the other instead of terminating at city center. Planners within several agencies explain that the systems on the Long Island and New Jersey side are currently incompatible – for example, LIRR trains are electrified with a third rail whereas New Jersey Transit trains are electrified with high-voltage catenary – but reorganizing these systems for compatibility can be done in a few years, well before the Gateway project opens.
In response to a question about the cost of this reorganization, one of the planners cited the Swiss slogan, “electronics before concrete.” Per the planner, electronics include systems, electrification, and software, all of which are quite cheap to install, whereas pouring concrete on new tunnels and viaducts is costly. The planner gave the example of resignaling on the subway: the New York Times pegged the cost of modernizing subway signals at $20 billion, and this could increase capacity on most lines by 25 to 50 percent. But the cost of building the entire subway from scratch at today’s costs in New York is likely to run up to $200 billion.
But while the immediate priorities involve fare and schedule integration, LHTA’s main focus is the Gateway project. There are only two commuter rail tracks between New Jersey and Penn Station, and they are full, running a train every 2.5 minutes at rush hour. The Gateway project would add two more tracks, doubling capacity. The currently projected cost for the tunnel is $13 billion, but sources within New York said that this number can be brought down significantly through better coordination between the agencies involved. This way, it could be funded entirely out of local and state contributions, which add up to $5.5 billion. When pressed on this matter, officials and planners refused to say outright whether they expect $5.5 billion to be enough to cover the tunnel, but some made remarks suggesting it would be plausible.
Previous estimates for the costs of Gateway adding up to $30 billion include substantial extra scope that is not necessary. Sources on both sides of the Hudson report that the main impetus for the formation of LHTA was to coordinate schedules in a way that would make this extra scope no longer necessary. “With last decade’s ARC, there was a cavern under Penn Station to let trains reverse direction and go back to New Jersey,” explains one of the planners; ARC was a separate attempt to add tracks to the Hudson rail crossing to Penn Station, which Republican Governor Chris Christie canceled in 2010 shortly after his election. “With Gateway, there was the plan for Penn Station South, condemning an entire Manhattan block for the station for $7 billion. With the plans we’re developing with LHTA we don’t need either Penn South or a cavern to let trains run between stations.”
Moreover, some planners suggested reactivating plans to connect Penn Station and Grand Central as part of Gateway. They refused to name a cost estimate, but suggested that at the low end it could be funded out of already-committed state money. Under this plan, there would be through-running between not just New Jersey Transit and the LIRR but also Metro-North, serving the northern suburbs of New York and Connecticut. Sources at the Connecticut Department of Transportation said they are studying the plan and have reservations but are overall positive about it, matching the reports of sources within New York, who believe that Connecticut DOT will join LHTA within six months.
Officials are optimistic about the effects of LHTA on the region both privately and publicly. The joint press release referred to the metro area as “a single region, in which decisions made in far apart areas of New York nonetheless affect people in New Jersey and vice versa.” Planners in both states cited examples of friends and family in the other state who they would visit more often if transportation options were better. With better regional rail integration, they said, people would take more trips, improving regional connectivity, and take fewer trips by car, reducing traffic congestion and pollution.
New Hudson Tunnels Are Canceled. Again.
Amtrak’s Gateway project, spending $30 billion on new tunnels from New Jersey to Penn Station, just got its federal funding yanked. Previously the agreement was to split funding as 25% New York, 25% New Jersey, 50% federal; the states had committed to $5.5 billion, which with a federal match would build the bare tunnels but not some of the ancillary infrastructure (some useful, some not).
When Chris Christie canceled ARC in 2010, then estimated at $10-13 billion, I cheered. I linked to a YouTube video of the song Celebration in Aaron Renn‘s comments. ARC was a bad project, and at the beginning Gateway seemed better, in the sense that it connected the new tunnels to the existing station tracks and not to a deep cavern. But some elements (namely, Penn Station South) were questionable from the start, and the cost estimate was even then higher than that of ARC, which I attributed to both Amtrak’s incompetence and likely cost overruns on ARC independent of who managed it.
But I’m of two minds about to what extent good transit advocates should cheer Gateway’s impending demise. The argument for cheering is a straightforward cost-benefit calculation. The extra ridership coming from Gateway absent regional rail modernization is probably around 170,000 per weekday, a first-order estimate based on doubling current New Jersey Transit ridership into Penn Station. At $40,000 per weekday rider, this justifies $7 billion in construction costs, maybe a little more if Gateway makes it cheaper to do maintenance on the old tunnels. Gateway is $30 billion, so the cost is too high and the tunnel should not be built.
Moreover, it’s difficult to raise the benefits of Gateway using regional rail modernization. On the New Jersey side, population density thins fast, so the benefits of regional rail that do not rely on through-running (high frequency, fare integration, etc.) are limited. The main benefits require through-running, to improve access on Newark-Queens and other through-Manhattan origin-destination pairs. Gateway doesn’t include provisions for through-running – Penn Station South involves demolishing a Manhattan block to add terminal tracks. Even within the existing Penn Station footprint, constructing a new tunnel eastward to allow through-running becomes much harder if the New Jersey Transit tracks have heavy terminating traffic, which means Gateway would make future through-running tunnels more expensive.
But on the other hand, the bare tunnels are not a bad project in the sense of building along the wrong alignment or using the wrong techniques. They’re just extremely expensive: counting minor shoring up on the old tunnels, they cost $13 billion for 5 km of tunnel. Moreover, sequencing Gateway to start with the tunnels alone allows dropping Penn South, and might make it possible to add a new tunnel for through-running mid-project. So it’s really a question of how to reduce costs.
The underground tunneling portion of Second Avenue Subway is $150 million per km, and that of East Side Access is $200 million (link, PDF-p. 7). Both figures exclude systems, which add $110 million per km on Second Avenue Subway, and overheads, which add 37%. These are all high figures – in Paris tunneling is $90 million per km, systems $35 million, and overhead a premium of 18% – but added up they remain affordable. A station-free tunnel should cost $350 million per km, which has implications to the cost of connecting Penn Station with Grand Central. Gateway is instead around $2 billion per km.
Is Gateway expensive because it’s underwater? The answer is probably negative. Gateway is only one third underwater. If its underwater character alone justifies a factor of six cost premium over Second Avenue Subway, then other underwater tunnels should also exhibit very high costs by local standards. There aren’t a lot of examples of urban rail tunnels going under a body of water as wide as the Hudson, but there are enough to know that there is not such a large cost premium.
In the 1960s, one source, giving construction costs per track-foot, finds that the Transbay Tube cost 40% more than the bored segments of BART; including systems and overheads, which the source excludes, BART’s history gives a cost of $180 million, equivalent to $1.38 billion today, or $230 million per km. The Transbay Tube is an immersed tube and not a bored tunnel, and immersed tubes are overall cheaper, but a report by Transport Scotland says on p. 12 that immersed tubes actually cost more per linear meter and are only overall cheaper because they require shorter approaches, which suggests their overall cost advantage is small.
Today, Stockholm is extending the T-bana outward in three direction. A cost breakdown per line extension is available: excluding the depot and rolling stock, the suburban tunnel to Barkarby is $100 million per km, the outer-urban tunnel to Arenastaden in Solna is $138 million per km, and the part-inner urban, part-suburban tunnel to Nacka is $150 million per km. The tunnel to Nacka is a total of 11.5 km, of which about 1 is underwater, broken down into chunks using Skeppsholmen, with the longest continuous underwater segment about 650 meters long. A 9% underwater line with 9% cost premium over an underground line is not by itself proof of much, but it does indicate that the underwater premium is most likely low.
Based on the suggestive evidence of BART and the T-bana, proposing that bare Hudson tunnels should cost about $2-2.5 billion is not preposterous. With an onward connection to Grand Central, the total cost should be $2.5-3 billion. Note that this cost figure does not assume that New York can build anything as cheaply as Stockholm, only that it can build Gateway for the same unit cost as Second Avenue Subway. The project management does not have to be good – it merely has to be as bad as that of Second Avenue Subway, rather than far worse, most likely due to the influence of Amtrak.
The best scenario coming out of canceling Gateway is to attempt a third tunnel project, this time under a government agency that is not poisoned by the existing problems of either Amtrak or Port Authority. The MTA could potentially do it; among the agencies building things in the New York area it seems by far the least incompetent.
If Gateway stays as is, just without federal funding, then the solution is for Amtrak to invest in its own project management capacity. The cost of the Green Line Extension in Boston was reduced from $3 billion to $2.3 billion, of which only $1.1 billion is actual construction and the rest is a combination of equipment and sunk cost on the botched start of the project; MBTA insiders attribute this to the hiring of a new, more experienced project manager. If Gateway can be built for even the same unit cost as Second Avenue Subway, then the existing state commitments are enough to build it to Grand Central and still have about half the budget left for additional tunnels.

