Category: Transportation
Local and Intercity Rail are Complements
An argument in my comments section is reminding me of a discussion by American transit advocates 15 years ago, I think by The Overhead Wire, about the tension between funding local transit and high-speed rail. I forget who it was – probably Jeff Wood himself – pointing out that the argument in 2008-9 about whether the priority was local transit or intercity rail didn’t make much sense. There are separate questions of how to allocate funding for intercity transportation and how to do the same for local transportation, and in both cases the same group of activists can push for a more favorable rail : car funding ratio. Jeff was talking about this in the sense of political activism; the purpose of this post is to explain the same concept from the point of view of public transportation connectivity and network effects. This is not an obvious observation, judging by how many people argue to the contrary – years ago I had a debate with Noah Smith about this, in which he said the US shouldn’t build high-speed rail like the Shinkansen before building urban rail systems like those of Japanese cities (see my side here and here).
I’ve written about related issues before, namely, in 2022 when I recommended that countries invest against type. For example, France with its TGV-centric investment strategy should invest in connecting regional lines, whereas Germany with its hourly regional train connections should invest in completing its high-speed rail network. It’s also worthwhile to reread what I wrote about Metcalfe’s law for high-speed rail in 2020, here and here. Metcalfe’s law is an abstract rule about how the value of a network with n nodes is proportional to 

The combined point is that whenever two forms of local, regional, or intercity public transportation connect, investments in one strengthen the case for investments in the other.
In some edge cases, those investments can even be the same thing. I’ve been arguing for maybe 12 years that MBTA electrification complements Northeast Corridor high-speed rail investment, because running fast electric multiple units (EMUs) on the Providence Line and its branches instead of slow diesel locomotive-hauled trains means intercity trains wouldn’t get stuck behind commuter trains. Similarly, I blogged five years ago, and have been doing much more serious analysis recently with Devin Wilkins, that coordinating commuter rail and intercity rail schedules on the New Haven Line would produce very large speed gains, on the order of 40-45 minutes, for both intercity and commuter trains.
But those are edge cases, borne of exceptionally poor management and operations by Amtrak and the commuter railroads in the Northeast. Usually, investments clearly are mostly about one thing and not another – building a subway line is not an intercity rail project, and building greenfield high-speed rail is not a local or regional rail project.
And yet, they remain complements. The time savings that better operations and maintenance can produce on the New Haven Line are also present on other commuter lines in New York, for example on the LIRR (see also here, here, and here); they don’t speed up intercity trains, but do mean that people originating in the suburbs have much faster effective trips to where they’d take intercity rail. The same is true for physical investments in concrete: the North-South Rail Link in Boston and a Penn Station-Grand Central connection in New York both make it easier for passengers to connect to intercity trains, in addition to benefits for local and regional travel, and conversely, fast intercity trains strengthen the case for these two projects since they’d connect passengers to better intercity service.
Concretely, let’s take two New York-area commuter lines, of which one will definitely never have to interface with intercity rail and one probably will not either. The definitely line is the Morristown Line: right now it enters New York via the same North River Tunnels as all other trains from points west, intercity or regional, but the plan for the Gateway Tunnel is to segregate service so that the Morris and Essex Lines use the new tunnel and the Northeast Corridor intercity and commuter trains use the old tunnel, and so in the future they are not planned to interact. The probably line is the LIRR Main Line, which currently doesn’t interface with intercity trains as I explain in my post about the LIRR and Northeast Corridor, and which should keep not interfacing, but there are Amtrak plans to send a few daily intercities onto it.
Currently, the trip time from Morristown to New York is around 1:09 off-peak, with some peak-only express trains doing it in 1:01. With better operations and maintenance, it should take 0:47. The upshot is that passengers traveling from Morristown to Boston today have to do the trip in 1:09 plus 3:42-3:49 (Acela) or 4:15-4:35 (Regional). The commuter rail improvements, which other than Gateway and about one unfunded tie-in do not involve significant investment in concrete, turn the 4:51 plus transfer time trip to 4:29 plus transfer time – say 5 hours with the transfer, since the intercities run hourly and the transfers are untimed and, given the number of different branches coming in from New Jersey, cannot be timed. High-speed rail, say doing New York-Boston in 2 hours flat (which involves an I-95 bypass from New Haven to Kingston but no other significant deviations from the right-of-way), would make it 2:47 with a transfer time capped at 10 minutes, so maximum 2:57. In effect, these two investments combine to give people from Morristown an effective 41% reduction in trip time to Boston, which increases trip generation by a factor of 2.87. Of course, far more people from Morristown are interested in traveling to New York than to Boston, but the point is that in the presence of cheap interventions to rationalize and speed up commuter rail, intercity rail looks better.
The same is true from the other direction, from the LIRR Main Line. The two busiest suburban stations in the United States are on 2000s and 10s numbers Ronkonkoma and Hicksville, each with about 10,000 weekday boardings. Ronkonkoma-Penn Station is 1:18 and Hicksville-Penn Station is 0:42 off-peak; a few peak express trains per day do the trip a few minutes faster from Ronkonkoma by skipping Hicksville, but the fastest looks like 1:15. If the schedule is rationalized, Ronkonkoma is about 0:57 from New York and Hicksville 0:31, on trains making more stops than today. I don’t have to-the-minute New York-Washington schedules with high-speed rail yet, but I suspect 1:50 plus or minus 10 minutes is about right, down from 2:53-3:01 on the Acela and 3:17-3:38 on the Regional. So the current timetable for Ronkonkoma-Washington is, with a half-hour transfer time, around 4:45 today and 2:57 in the future, which is a 38% reduction in time and a factor of 2.59 increase in the propensity to travel. From Hicksville, the corresponding reduction is from 4:09 to 2:31, a 39% reduction and a factor of 2.72 increase in trip generation. Again, Long Islanders are far more interested in traveling to Manhattan than to Washington, but a factor of 2.59-2.72 increase in trip generation is nothing to scoff at.
The issue here is that once the cheap upgrades are done, the expensive ones start making more sense – and this is true for both intercity and regional trains. The New York-Boston timetable assumes an I-95 bypass between New Haven and Kingston, saving trains around 24 minutes, at a cost of maybe $5 billion; those 24 minutes matter more when they cut the trip time from 2:24 to 2:00 than when the current trip time is about 3:45 and the capacity on the line is so limited any increase in underlying demand has to go to higher fares, not more throughput. For suburban travelers, the gains are smaller, but still, going from 5:00 to 4:36 matters less than going from 3:21 to 2:57.
Conversely, the expensive upgrades for regional trains – by which I mean multi-billion dollars tunnels, not $300 million junction grade separations like Hunter or the few tens of millions of dollars on upgrading the junction and railyard at Summit – work better in a better-operated system. Electronics before concrete, not instead of concrete – in fact, good operations (i.e. good electronics) create more demand for megaprojects.
At no point are these really in competition, not just because flashy commuter rail projects complement intercity rail through mutual feeding, but also because the benefits for non-connecting passengers are so different that different funding mechanisms make sense. The North-South Rail Link has some benefits to intercity travel, as part of the same program with high-speed rail on the Northeast Corridor, and as such, it could be studied as part of the same program, if there is enough money in the budget for it, which there is not. Conversely, it has very strong local benefits, ideal for a funding partnership between the federal government and Massachusetts; similarly, New York commuter rail improvements are ideal for a funding partnership between the federal government, New York State, New Jersey, and very occasionally Connecticut.
In contrast, intercity rail benefits people who are far away from where construction is done: extensive bypasses built in Connecticut would create a small number of jobs in Connecticut temporarily, but the bigger benefits would accrue not just to residents of the state (through better New Haven-Boston and perhaps New Haven-New York trip times) but mostly to residents of neighboring states traveling through Connecticut. This is why there’s generally more national coordination of intercity rail planning than of regional rail planning: the German federal government, too, partly funds S-Bahn projects in major German cities, but isn’t involved in planning S21 S15 or the second S-Bahn trunk in Munich, whereas it is very involved in decisions on building high-speed rail lines. The situation in France is similar – the state is involved in decisions on LGVs and on Parisian transit but not on provincial transit, though it helps fund the latter; despite the similarity in the broad outlines of the funding structure, the outcomes are different, which should mean that the differences between France and Germany do not boil down to funding mechanisms or to inherent competition between intercity rail funds and regional rail funds.
The United States Has Too Few Road Tunnels
The Francis Scott Key Bridge in Baltimore collapsed after a drifting freighter hit one of its supports; so far, six people are presumed dead. Immediately after the disaster, people were asking if it could be prevented, and it became clear that it is not possible to build a bridge anchor that can withstand the impact of a modern ship, even at low speed. However, it was then pointed out to me on Mastodon that it’s not normal in Europe to have such a bridge over a shipping channel; instead, roads go in tunnel. I started looking, and got to a place that connects my interest in construction costs with that of cross-cultural learning. Europe has far more road tunneling than the US does, thanks to the lower construction costs here; it also has better harmonization of regulations of what can go in tunnels and what cannot. The bridge collapse is a corner case of where the American system fails – it’s a once in several decades event – but it does showcase deep problems with building infrastructure.
Road tunnels
The United States has very little road tunneling for its size. This list has a lot of dead links and out of date numbers, but in the US, the FHWA has a current database in which the tunnels sum to 220 km. Germany had 150 km in 1999, and has tendered about 170 km of new tunnel since 2000 of which only 48 are still under construction. France has 238 km of road tunnel; the two longest and the 10th longest, totaling 28 km, cross the Alpine border with Italy, but even excluding those, 210 is almost as much as the US on one fifth the population. Italy of course has more tunneling, as can be expected from its topography, but France (ex-borders) and Germany are not more mountainous than the US, do not have fjords and skerries like Norway, and don’t even have rias like Chesapeake Bay and the Lower Hudson. Japan, with its mountainous island geography, has around 5,000 km of road tunnel.
The United States builds so few tunnels that it’s hard to create any large database of American road tunnels and their costs. Moreover, it has even fewer urban road tunnels, and the few it does have, like the Big Dig and more recently the Alaskan Way Viaduct replacement tunnel, have become bywords for extreme costs, creating distaste even among pro-highway urban politicians for more and leading to project cancellations. With that in mind, the State Route 99 tunnel replacing the Alaskan Way Viaduct is 3 km long and cost $2.15 billion in 2009-19, which is $2.77 billion in 2023 dollars and $920 million/km, with just four lanes, two in each direction.
In Europe, this is not at all an exhaustive database; it represents where I’ve lived and what I’ve studied, but these are all complex urban tunnels in dense environments:
- Stockholm: the six-lane Förbifart Stockholm project to build long bypass roads in Stockholm using congestion pricing money, after acrimonious political debates over how to allocate the money between roads and public transport, comprises 17 km of tunnel (plus 4 km above-ground) including underwater segments, for an updated cost of 51.5 billion kronor in 2021 prices, or $6.97 billion in 2023 PPPs, or $410 million/km. The project is well underway and its current cost represents a large overrun over the original estimate.
- Paris: the four-lane A86 ring road was completed in 2011 with 15.5 km of new tunnel, including 10 in a duplex tunnel, at a cost of 2.2 billion €. I’ve seen sources saying that the cost applies only to the duplex section, but the EIB claims 1.7 billion € for the duplex. Physical construction was done 2005-7; deflating from 2006 prices, this is $4.18 billion in 2023 PPPs, or $270 million/km. This is a tunnel with atypically restricted clearances – commercial vehicles are entirely banned, as are vehicles running on compressed natural gas, due to fire concerns after the Mont-Blanc Tunnel fire.
- Berlin: the four-lane 2.4 km long Tunnel Tiergarten Spreebogen (TTS) project was dug 2002-4, for 390 million €, or $790 million in 2023 PPPs and $330 million/km. This tunnel goes under the river and under the contemporarily built Berlin Hauptbahnhof urban renewal but also under a park. The controversial A100 17th segment plan comprises 4.1 km of which 2.7 are to be in tunnel, officially for 800 million € but that estimate is out of date and a rougher but more current estimate is 1 billion €. The exchange rate value of the euro today belies how much stronger it is in PPP terms: this is $1.45 billion, or $537 million/km if we assume the above-ground section is free, somewhat less if we cost it too. The 17th segment tunnel is, I believe, to have six lanes; the under-construction 16th segment has six lanes.
Crossing shipping channels
The busiest container ports in Europe are, by far, Rotterdam, Antwerp, and Hamburg, in this order. Rotterdam and Antwerp do not, as far as I’ve been able to tell from Google Earth tourism, have any road bridge over the shipping channels. Hamburg has one, the Köhlbrandbrücke (anchored on land, not water), on the way to one of the container berths, and some movable bridges like the Kattwykbrücke on the way to other berths – and there are plans to replace this with a new crossing, by bridge, with higher clearance below, with a tunnel elsewhere on the route. The next tranche of European ports are generally coastal – Le Havre, Bremerhaven, Valencia, Algeciras, Piraeus, Constanța – so it is not surprising the shipping channels are bridge-free; but Rotterdam, Antwerp, and Hamburg, are all on rivers, crossed by tunnel.
American ports usually have bridges over shipping channels, even when they are next to the ocean, as at the Ports of Los Angeles and Long Beach. This is not universal – crossings in Hampton Roads have tunnels – but it’s the trend. Of note, the US does occasionally tunnel under deep channels (again, Hampton Roads); that the Netherlands tunnels in Rotterdam is especially remarkable given how Holland is a floodplain with very difficult tunnel construction in alluvial soil.
Hazardous material regulations
Tunnels do not permit all traffic, due to fire risk. For example, the Mont-Blanc Tunnel requires vehicles heavier than 3.5 tons to undergo a safety inspection before entering to ensure they don’t carry prohibited dangerous goods. In Europe, this is governed by the ADR; all European countries are party to it, even ones not in the EU, and so are some non-European ones. Tunnels can be classified locally between A (no restrictions) and E (most restrictive).
The United States is not party to the ADR. It has its own set of regulations for transportation of hazardous materials (hazmat), with different classifications – and those differ by state. Here are the rules in Maryland. They’re restrictive enough that significant road freight had to use the Key Bridge, because the alternative routes have tunnels that it is banned from entering. Port Authority has different rules, permitting certain hazmat through the Lincoln Tunnel with an official escort. Somehow, the rules are not uniform in the United States even though it is a country and Europe is not; Russia and Ukraine may be at war with each other, but they have the same transportation of dangerous goods regulations.
Subway-Intercity Rail Connections
Something Onux said in comments on yesterday’s post, about connecting Brooklyn to intercity rail, got me thinking more about how metro lines and intercity rail can connect better. This matters for mature cities that build little infrastructure like New York or Berlin, but also for developing-world cities with large construction programs ahead of them. For the most part, a better subway system is automatically one that can also serve the train station better – the train station is usually an important destination for urban travel and therefore, usually the same things that make for a stronger subway system also make for better subway-intercity rail connections.
Subways and commuter trains
Like gender, transit mode is a spectrum. There are extensive systems that are clearly metro and ones that are clearly commuter rail, but also things in between, like the RER A, and by this schema, the Tokyo and Seoul subways are fairly modequeer.
The scope of this post is generally pure subway systems – even the most metro-like commuter lines, like the RER A and the Berlin S-Bahn, use mainline rail rights-of-way and usually naturally come to connect with intercity train stations. Of note, RER A planning, as soon as SNCF got involved, was modified to ensure the line would connect with Gare de Lyon and Gare Saint-Lazare; previous RATP-only plans had the line serving Bastille and not Gare de Lyon, and Concorde and not Auber. So here, the first rule is that metro (and metro-like commuter rail) plans should, when possible, be modified to have the lines serve mainline train stations.
Which train stations?
A city designing a subway system should ensure to serve the train station. This involves nontrivial questions about which train stations exactly.
On the one hand, opening more train stations allows for more opportunities for metro connections. In Boston, all intercity trains serve South Station and Back Bay, with connections to the Red and Orange Lines respectively. In Berlin, north-south intercity trains call not just at Hauptbahnhof, which connects to the Stadtbahn and (since 2020) U5, but also Gesundbrunnen and Südkreuz, which connect to the northern and southern legs of the Ringbahn and to the North-South Tunnel; Gesunbrunnen also has a U8 connection. In contrast, trains into Paris only call at the main terminal, and intercity trains in New York only stop at Penn Station.
On the other hand, extra stations like Back Bay and delay trains. The questions that need to be answered when deciding whether to add stations on an intercity line are,
- How constructible is the new station? In New York, this question rules out additional stops; some of the through-running plans involve a Penn Station-Grand Central connection to be used by intercity trains, but there are other reasons to keep it commuter rail-only (for example, it would make track-sharing on the Harlem Line even harder).
- How fast is the line around the new station? More stations are acceptable in already slow zones (reducing the stop penalty), on lines where most trips take a long time (reducing the impact of a given stop penalty). Back Bay and Südkreuz are in slow areas; Gesundbrunnen is north of Hauptbahnhof where nearly passengers are going south of Berlin, so it’s free from the perspective of passengers’ time.
- How valuable are the connections? This depends on factors like the ease of internal subway transfers, but mostly on which subway lines the line can connect to. Parisian train terminals should in theory get subsidiary stations because internal Métro transfers are so annoying, but there’s not much to connect to – just the M2/M6 ring, generally with no stations over the tracks.
Subway operations
In general, most things that improve subway operations in general also improve connectivity to the train station. For example, in New York, speeding up the trains would be noticeable enough to induce more ridership for all trips, including access to Penn Station; this could be done through reducing flagging restrictions (which we briefly mention at ETA), among other things. The same is true of reliability, frequency, and other common demands of transit advocates.
Also in New York, deinterlining would generally be an unalloyed good for Penn Station-bound passengers. The reason is that the north-south trunk lines in Manhattan, other than the 4/5/6, either serve Penn Station or get to Herald Square one long block away. The most critical place to deinterline is at DeKalb Avenue in Brooklyn, where the B/D/N/Q switch from a pattern in which the B and D share one track pair and the N and Q share another to one in which the B and Q share a pair and the D and N share a pair; the current situation is so delicate that trains are delayed two minutes just at this junction. The B/D and N/Q trunk lines in Manhattan are generally very close to each other, so that the drawback of deinterlining is reduced, but when it comes to serving Penn Station, the drawback is entirely eliminated, since both lines serve Herald Square.
If anything, it’s faster to list areas where subway service quality and subway service quality to the train station specifically are not the same than to list areas where they are:
- The train station is in city center, and so circumferential transit, generally important, doesn’t generally connect to the station; exceptions like the Ringbahn exist but are uncommon.
- If too many lines connect to the one station, then the station may become overloaded. Three lines are probably fine – Stockholm has all three T-bana lines serving T-Centralen, adjacent to the mainline Stockholm Central Station, and there is considerable but not dangerous crowding. But beyond that, metro networks need to start spreading out.
- Some American Sunbelt cities if anything have a subway connection to the train station, for example Los Angeles, without having good service in general. In Los Angeles, the one heavy rail trunk connects to Union Station and so does one branch of the Regional Connector; the city’s problems with subway-intercity rail connections are that it doesn’t really have a subway and that it doesn’t really have intercity rail either.
Intercity Trains and Long Island
Amtrak wants to extend three daily Northeast Corridor trains to Long Island. It’s a bad idea – for one, if the timetable can accommodate three daily trains, it can accommodate an hourly train – but beyond the frequency point, this is for fairly deep reasons, and it took me years of studying timetabling on the corridor to understand why. In short, the timetabling introduces too many points of failure, and meanwhile, the alternative of sending all trains that arrive in New York from Philadelphia and Washington onward to New Haven is appealing. To be clear, there are benefits to the Long Island routing, they’re just smaller than the operational costs; there’s a reason this post is notably not tagged “incompetence.”
How to connect the Northeast Corridor with Long Island

The Northeast Corridor has asymmetric demand on its two halves. North of New York, it connects the city with Boston. But south of New York, it connects to both Philadelphia and Washington. As a result, the line can always expect to have more traffic south of New York than north of it; today, this difference is magnified by the lower average speed of the northern half, due to the slowness of the line in Connecticut. Today, many trains terminate in New York and don’t run farther north; in the last 20 years, Amtrak has also gone back and forth on whether some trains should divert north at New Haven and run to Springfield or whether such service should only be provided with shuttle trains with a timed connection. Extending service to Long Island is one way to resolve the asymmetry of demand.
Such an extension would stop at the major stattions on the LIRR Main Line. The most important is Jamaica, with a connection to JFK; then, in the suburbs, it would be interesting to stop at least at Mineola and Hicksville and probably also go as far as Ronkonkoma, the end of the line depicted on the map. Amtrak’s proposed service makes exactly these stops plus one, Deer Park between Hicksville and Ronkonkoma.
The entire Main Line is electrified, but with third rail, not catenary. The trains for it therefore would need to be dual-voltage. This requires a dedicated fleet, but it’s not too hard to procure – it’s easier to go from AC to DC than in the opposite direction, and Amtrak and the LIRR already have dual-mode diesel locomotives with third rail shoes, so they could ask for shoes on catenary electric locomotives (or on EMUs).
The main benefit of doing this, as opposed to short-turning surplus Northeast Corridor trains in New York, is that it provides direct service to Long Island. In theory, this provides access to the 2.9 million people living on Long Island. In practice, the shed is somewhat smaller, because people living near LIRR branches that are not the Main Line would be connecting by train anyway and then the difference between connecting at Jamaica and connecting at Penn Station is not material; that said, Ronkonkoma has a large parking lot accessible from all of Suffolk County, and between it and significant parts of Nassau County near the Main Line, this is still 2 million people. There aren’t many destinations on Long Island, which has atypically little job sprawl for an American suburb, but 2 million originating passengers plus people boarding at Jamaica plus people going to Jamaica for JFK is a significant benefit. (How significant I can’t tell you – the tools I have for ridership estimation aren’t granular enough to detect the LIRR-Amtrak transfer penalty at Penn Station.)
My early Northeast Corridor ideas did include such service, for the above reasons. However, there are two serious drawbacks, detailed below.
Timetabling considerations
Under current plans, there is little interaction between the LIRR and the Northeast Corridor. There are two separate routes into Penn Station from the east, one via 32nd Street (“southern tunnels”) and one via 33rd (“northern tunnels”), each a two-track line with one track in each direction. The North River Tunnels, connecting Penn Station with New Jersey and the rest of the United States, face the southern tunnels; the Gateway tunnels under construction to double trans-Hudson capacity are not planned to pair with the northern tunnels, but rather to connect to stub-end tracks facing 31st Street. For this reason, Amtrak always or almost always enters Penn Station from the east using the southern tunnels; the northern tunnels do have some station tracks that connect to them and still allow through-service to the west, but the moves through the station interlocking are more complex and more constrained.
As seen on the map, east of Penn Station, the Northeast Corridor is to the north of the LIRR. Thus, Amtrak has to transition from being south of the LIRR to being north of it. This used to be done at-grade, with conflict with same-direction trains (but not opposite-direction ones); it has since been grade-separated, at excessive cost. With much LIRR service diverted to Grand Central via the East Side Access tunnel, current traffic can be divided so that LIRR Main Line service exclusively uses the northern tunnels and Northeast Corridor (Amtrak or commuter rail under the soon to open Penn Station Access project) service exclusively uses the southern tunnels; the one LIRR branch not going through Jamaica, the Port Washington Branch, can use the southern tunnels as if it is a Penn Station Access branch. This is not too far from how current service is organized anyway, with the LIRR preferring the northern (high-numbered) tracks at Penn Station, Amtrak the middle ones, and New Jersey Transit the southern ones with the stub end:

The status quo, including any modification thereto that keeps the LIRR (except the Port Washington Branch) separate from the Northeast Corridor, means that all timetabling complexity on the LIRR is localized to the LIRR. LIRR timetabling has to deal with all of the following issues today:
- There are many different branches, all of which want to go to Manhattan rather than to Brooklyn, and to a large extent they also want to go on the express tracks between Jamaica and Manhattan rather than the local tracks.
- There are two Manhattan terminals and no place to transfer between trains to different ones except Jamaica; an infill station at Sunnyside Yards, permitting trains from the LIRR going to Grand Central to exchange passengers with Penn Station Access trains, would be helpful, but does not currently exist.
- The outer Port Jefferson Branch is unelectrified and single-track and yet has fairly high ridership, so that isolating it with shuttle trains is infeasible except in the extreme short run pending electrification.
- All junctions east of Jamaica are flat.
- The Main Line has three tracks east of Floral Park, the third recently opened at very high cost, purely for peak-direction express trains, but cannot easily schedule express trains in both directions.
There are solutions to all of these problems, involving timetable simplification, reduction of express patterns with time saved through much reduced schedule padding, and targeted infrastructure interventions such as electrifying and double-tracking the entire Port Jefferson Branch.
However, Amtrak service throws multiple wrenches in this system. First, it requires a vigorous all-day express service between New York and Hicksville if not Ronkonkoma. Between Floral Park and Hicksville, there are three tracks. Right now the local demand is weak, but this is only because there is little local service, and instead the schedule encourages passengers to drive to Hicksville or Mineola and park there. Any stable timetable has to provide much stronger local service, and this means express trains have to awkwardly use the middle track as a single track. This isn’t impossible – it’s about 15 km of fast tracks with only one intermediate station, Mineola – but it’s constraining. Then the constraint propagates east of Hicksville, where there are only two tracks, and so those express trains have to share tracks with the locals and be timetabled not to conflict.
And second, all these additional conflict points would be transmitted to the entire Northeast Corridor. A delay in Deer Park would propagate to Philadelphia and Washington. Even without delays, the timetabling of the trains in New Jersey would be affected by constraints on Long Island; then the New Jersey timetabling constraints would be transmitted east to Connecticut and Massachusetts. All of this is doable, but at the price of worse schedule padding. I suspect that this is why the proposed Amtrak trip time for New York-Ronkonkoma is 1:25, where off-peak LIRR trains do it in 1:18 making all eight local stops between Ronkonkoma and Hicksville, Mineola, Jamaica, and Woodside. With low padding, which can only be done with more separated out timetables, they could do it in 1:08, making four more net stops.
Trains to New Haven
The other reason I’ve come to believe Northeast Corridor trains shouldn’t go to Jamaica and Long Island is that more trains need to go to Stamford and New Haven. This is for a number of different reasons.
The impact of higher average speed
The higher the average speed of the train, the more significant Boston-Philadelphia and Boston-Washington ridership is. This, in turn, reduces the difference in ridership north and south of New York somewhat, to the point that closer to one train in three doesn’t need to go to Boston than one train in two.
Springfield
Hartford and Springfield can expect significant ridership to New York if there is better service. Right now the line is unelectrified and runs haphazard schedules, but it could be electrified and trains could run through; moreover, any improvement to the New York-Boston line automatically also means New York-Springfield trains get faster, producing more ridership.
New Haven-New York trips
If we break my gravity model of ridership not into larger combined statistical areas but into smaller metropolitan statistical areas, separating out New Haven and Stamford from New York, then we see significant trips between Connecticut and New York. The model, which is purely intercity, at this point projects only 15% less traffic density in the Stamford-New York section than in the New York-Trenton section, counting the impact of Springfield and higher average speed as well.
Commutes from north of New York
There is some reason to believe that there will be much more ridership into New York from the nearby points – New Haven, Stamford, Newark, Trenton (if it has a stop), and Philadelphia – than the model predicts. The model doesn’t take commute trips into account; thus, it projects about 7.78 million annual trips between New York and either Stamford or New Haven, where in fact the New Haven Line was getting 125,000 weekday passengers and 39 million annual passengers in the 2010s, mostly from Connecticut and not Westchester County suburbs. Commute trips, in turn, accrete fairly symmetrically around the main city, reducing the difference in ridership between New York-Philadelphia and New York-New Haven, even though Philadelphia is the much larger city.
Combining everything
With largely symmetric ridership around New York in the core, it’s best to schedule the Northeast Corridor with the same number of trains immediately north and immediately south of it. At New Haven, trains should branch. The gravity model projects a 3:1 ratio between the ridership to Boston and to Springfield. Thus, if there are eight trains per hour between New Haven and Washington, then six should go to Boston and two to Springfield; this is not even that aggressive of an assumption, it’s just hard to timetable without additional bypasses. If there are six trains per hour south of New Haven, which is more delicate to timetable but can be done with much less concrete, then two should still go to Springfield, and they’ll be less full but over this short a section it’s probably worth it, given how important frequency is (hourly vs. half-hourly) for trips that are on the order of an hour and a half to New York.
Trains on the Moon
The US government is contracting defense contractor Northrop Grumman to develop a concept for passenger and freight rail on the Moon, the idea being to use this to transport resources and perhaps build rockets for travel to the rest of the Solar System. Upon seeing this, I immediately set to try figuring out design standards, and it looks like such a railway would have a much harder time developing an alignment than on Earth, because of the impact of low gravity.
The issue is that lunar gravity is 1.6 m/s^2, and not 9.8 as on Earth. This turns out to affect how vehicles can round corners. The formula connecting speed, lateral acceleration, and the curve radius is the same everywhere:

The value of a is measured in the horizontal plane; curves are normally banked (canted/superelevated), so that gravity countermands centrifugal force, but normally, trains are run faster than the perfect balancing speed, since some lateral acceleration in the plane of the body of the train is acceptable. For much more detail, see old of posts of mine here and here.
In rail engineering, lateral acceleration is usually measured not in units of acceleration, but in units of distance, corresponding to how far the track is canted vertically (cant), and to how much the track would need to be canted further to achieve perfect balancing speed (cant deficiency). These units follow the formula

Here, e is total equivalent cant (cant plus cant deficiency), k is the track gauge from the middle of the rail to middle of the rail (around 60 mm more than the usual value of track gauge, which is measured from inner rail to inner rail), and g is gravitational acceleration. On Earth, on standard-gauge railways, this reduces to the formula that 1 m/s^2 of lateral acceleration is equal to 150 mm of total equivalent cant.
The issue with all of this is that the safety limits of both cant and cant deficiency are better expressed in units of distance rather than acceleration, as gravitational acceleration changes; equivalently, the limit value of a is proportional to g. The reason is that cant deficiency is limited by the ability of the train to round the curve safely, without toppling; if the combined force vector of weight and centrifugal force points too far off-center, then the swaying of the train can lead to derailment and catastrophic damage, including deaths. Thus, the limit value of acceleration in the plane of the tracks is best expressed as a proportion of gravitational acceleration, rather than in absolute units. The limit value of cant, in turn, is related to the safety limit of the ability of the train to stand still on canted track in an emergency.
This analysis can be seen in two distinct places in existing rail design standards and speed limits:
- When the train rounds a vertical curve, there is a minimum curve radius too, governed by both safety and passenger comfort. The minimum curve radius is higher on a crest than on a sag, because on a crest the train’s vertical acceleration slightly countermands gravity, and thus the train does not grip the tracks so well, whereas on a sag the vertical acceleration adds to gravity.
- The maximum values of cant and cant deficiency are usually fairly close for a given train. Two notable exceptions are high-speed rail, and tilting trains. High-speed rail has higher maximum cant than cant deficiency – German standards are 180 and 130 mm respectively – because cant deficiency is a limiting factor when the train is moving at 300 km/h (and thus potentially sways more) whereas cant is a limiting factor when the train sits still. Tilting trains are the exact opposite: the maximum cant deficiency is very high, reaching 270 mm on some high-maintenance Pendolino sets designed to be light enough and have low enough center of mass to be able to round corners safely, because when the train sits still on canted track the tilt system is assumed not to be working.
The upshot is that a standard-gauge railway on the Moon can expect to have a maximum total equivalent cant of 300 mm or somewhat more, same as on Earth – but that is compatible with a value of a of 0.33 m/s^2. In effect, curve radii have to be six times wider, assuming equal technology. The viaducts required to build such a straight right-of-way are easier to build on the Moon, since they don’t need to support as much weight for a given mass, but more and taller viaducts are still needed, and going around obstacles is not easy.
Land Use Around the Interborough Express
Eric and Elif are working on a project to analyze land use around the corridor of the planned Interborough Express line in New York. The current land use is mostly residential, and a fascinating mix of densities. This leads to work on pedestrian, car, and transit connectedness, and on modal split. As might be expected, car ownership is fairly high along the corridor, especially near the stations that are not at all served by the subway today, as opposed to ones that are only served by radial lines. Elif gave a seminar talk about the subject together with João Paulouro Neves, and I’d like to share some highlights.
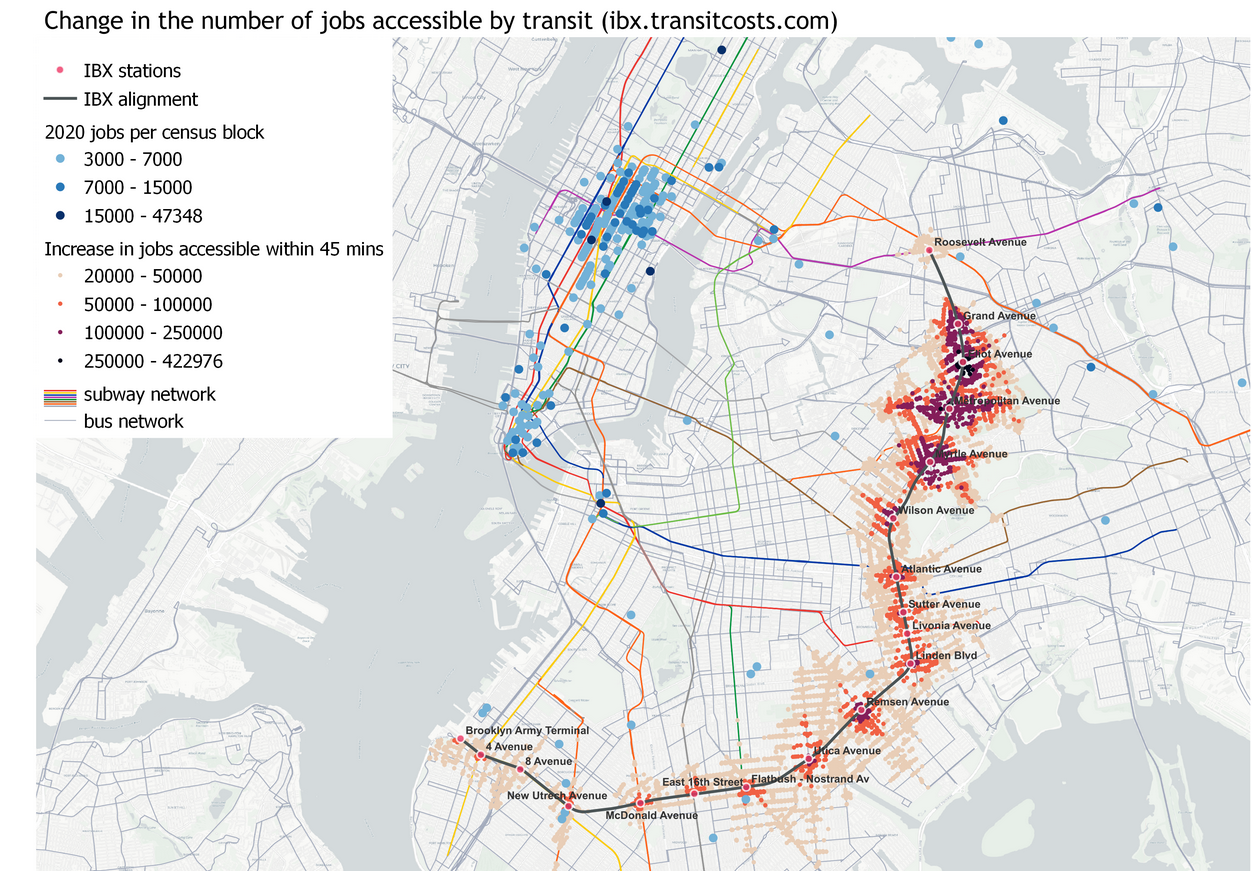
The increase in transit accessibility in the above map is not too surprising, I don’t think. Stations at both ends of the line gain relatively little; the stations that gain the most are ones without subway service today, but Metropolitan Avenue, currently only on the M, gains dramatically from the short trip to Roosevelt with its better accessibility to Midtown.
More interesting than this, at least to me, is the role of the line as a way to gradually push out the boundary between the transit- and auto-oriented sections of the city. For this, we should look at a density map together with a modal split map.

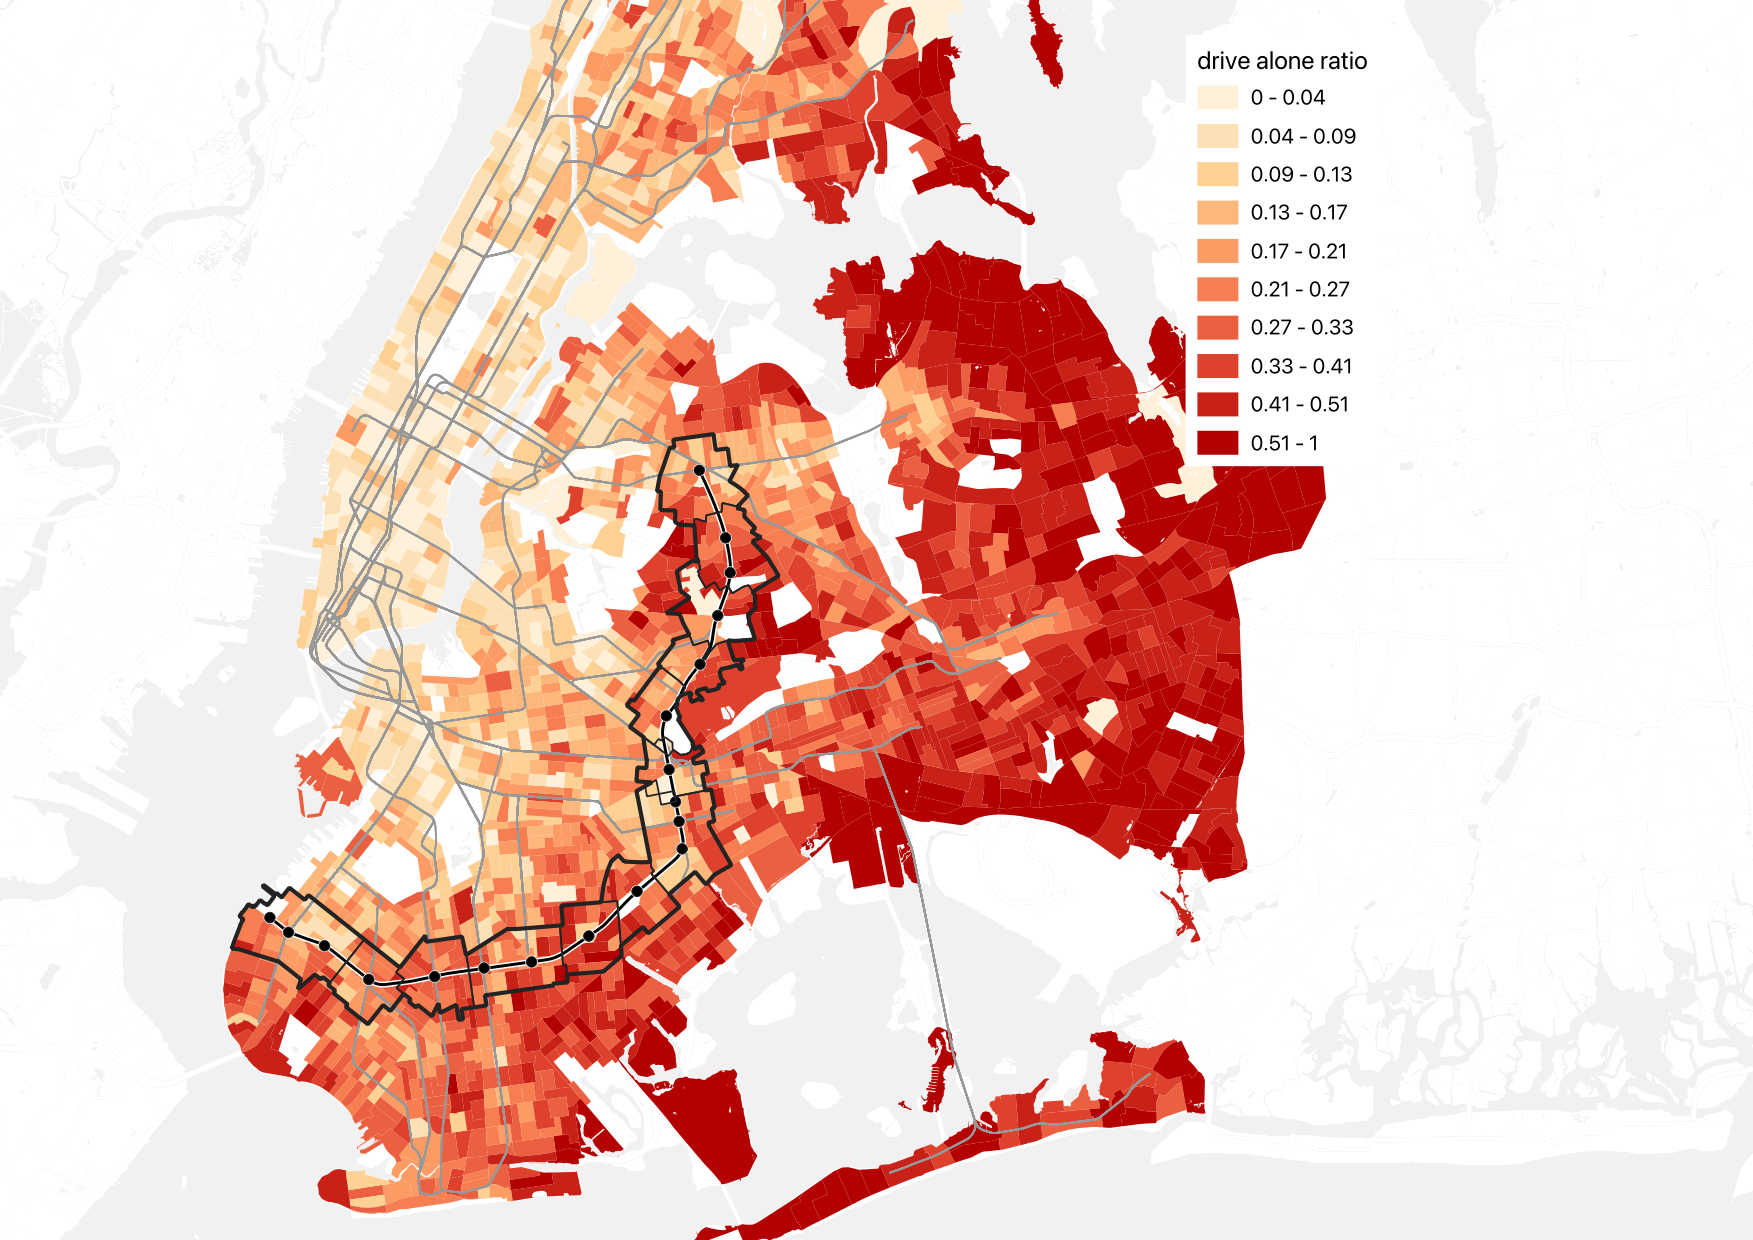
At the seminar talk, Elif described IBX as roughly delineating the boundary between the auto- and transit-oriented parts of the city, at least in Brooklyn. (In Queens, the model is much spikier, with ribbons of density and transit ridership along subway lines.) This isn’t quite visible in population density, but is glaring on the second map, of modal split.
Now, to be clear, it’s not that the IBX route itself is a boundary. The route is not a formidable barrier to pedestrian circulation: there are two freight trains per day in each direction, I believe, which means that people can cross the trench without worrying about noise the way they do when crossing a freeway. Rather, it’s a transitional zone, with more line density to the north and less to the south.
The upshot is that IBX is likely to push this transitional zone farther out. There is exceptionally poor crosstown access today – the street network is slow, and while some of the crosstown Brooklyn buses are very busy, they are also painfully slow, with the B35 on Church Avenue, perennially a top 10 route in citywide ridership, winning the borough-wide Pokey Award for its slowness. So we’re seeing strong latent demand for crosstown access in Brooklyn with how much ridership these buses have, and yet IBX is likely to greatly surpass them, because of the grade-separated right-of-way. With such a line in place, it’s likely that people living close to the line will learn to conceive of the subway system plus the IBX route as capable of connecting them in multiple directions: the subway would go toward and away from Manhattan, and IBX orthogonally, providing enough transit accessibility to incentivize people to rely on modes of travel other than the car.
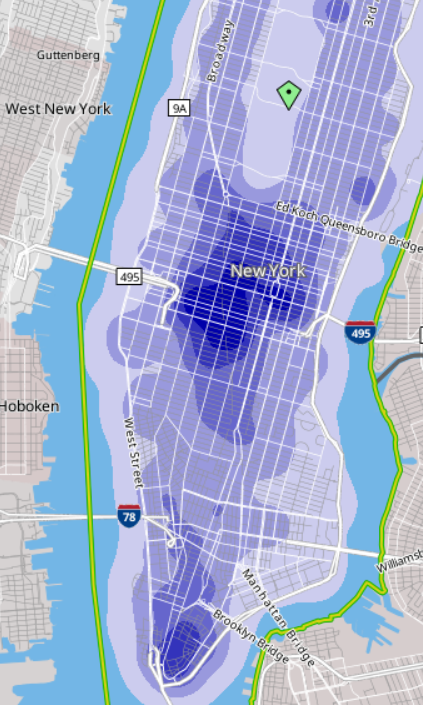
This is especially important since the city’s street network looks differently by mode. Here is pedestrian integration by street:

And here is auto integration:

The auto integration map is not strongly centered the way the pedestrian map is. Quite a lot of the IBX route is in the highest-integration zone, that is with the best access for cars, but the there isn’t really a single continuous patch of high integration the way Midtown Manhattan is the center of the pedestrian map. East Williamsburg has high car integration and is not at all an auto-oriented area; I suspect it has such high integration because of the proximity to the Williamsburg and Kosciuszko Bridges but also to Grand Street and Metropolitan Avenue toward Queens, and while the freeways are zones of pedestrian hostility, Grand and Metropolitan are not.
What this means is that the red color of so many streets along the IBX should not by itself mean the area will remain auto-oriented. More likely, the presence of the line will encourage people to move to the area if they intend to commute by train, and I suspect this will happen even at stations that already have service to Manhattan and even among people who work in Manhattan. The mechanism here is that a subway commuter chooses where to live based on commuter convenience but also access to other amenities, and being able to take the train (for example) from Eastern Brooklyn to Jackson Heights matters. It’s a secondary effect, but it’s not zero. And then for people commuting to Brooklyn College or intending to live at one of the new stops (or at Metropolitan, which has Midtown access today but not great access), it’s a much larger effect.
The snag is that transit-oriented development is required. To some extent, the secondary effect of people intending to commute by train coming to the neighborhood to commute from it can generate ridership by itself; in the United States, all ridership estimates assume no change in zoning, due to federal requirements (the Federal Transit Administration has been burned before by cities promising upzoning to get funding for lines and then not delivering). But then transit-oriented development can make it much more, and much of the goal of the project is to recommend best practices in that direction: how to increase density, improve pedestrian accessibility to ensure the areas of effect become more rather than less walkable, encourage mixed uses, and so on.
Is There Room for Optimism About New York Construction Costs?
This year, there have been some positive signs about things changing in New York on subway construction – and yet, I’m uncertain about them. There are some signs that construction costs for Second Avenue Subway Phase 2 are coming under control. The New York Post broke in January that the MTA is eying smaller station designs, to reduce costs, to the tun of $300 million; an article released a few hours ago adds that there may be another $600 million in potential savings. So, in theory, costs are going down, and they’re going down as the MTA implements something we’ve been screaming about at the Transit Costs Project, so we should be happy.
And yet, I’m uncertain – not negative, but still somewhat pessimistic about whether this portends an era in which New York can finally build more subways. The main reason isn’t even some mistrust in the MTA at this point – the reduction in station footprints is a genuinely good thing, and to the extent it’s incomplete, it’s because it’s a longstanding project with older designs. Rather, it’s a combination of what this means for future projects, and how it interacts with federal funding. In brief, federal funding is at the level of the project rather than agency, and this makes it hard for cost savings to be plugged into the most straightforward benefit – namely, being able to build more on the same budget.
How is the money being saved?
The New York Post is relying on an MTA presentation from January that defends the cost structure but talks about how to reduce station costs through reducing back-of-house space. Phase 1 of Second Avenue Subway built two deep-mined intermediate stations, at 72nd and 86th Streets; the platforms are 610′ (187 meters) long, and there are no serious prospects of ever running longer trains since the line is an extension of older lines, but the station caverns are, respectively, 398 and 295 meters long, where the norm in the European comparison cases we’ve seen is that the station dig is 3-15% longer than the platforms, not twice as long.
Both stations have extensive back-of-house space, which New York City Transit demanded so that each department using the station would have its own space; 72nd also has a crossover inherited from older designs that would have permitted some trains from the south to terminate there on a third station track, which was later removed from scope to reduce costs. (The terminal station, the cut-and-cover 96th Street, is a 485 meter long dig, but that’s an artifact of block-level geology: the northern end had to go as far as 99th in order to connect with an older tunnel built in the 1970s, whereas the southern end had to go as far as 92nd because the underground geology changes abruptly there and it was easier to start boring at 92nd than at 96th.)
The plan for Phase 2 initially included much longer digs than the platform, for the same reason. However, it has since changed, and now the digs are substantially reduced. The MTA’s presentation looks like the overage at 125th Street is reduced from somewhat more than 100% in the 2004 plan to about 40-50% in the 2023 plan, and the overage at 106th and 116th is somewhat less than that, maybe 30-40%. While the 125th Street station dig is still as deep as in prior plans, the deep-mined station will also extend less far up, reducing the extent of space required to be outfit with systems.
The MTA could shrink the stations’ footprint further and save more money, but it’s fairly late in the design, and thus the opportunity to take full benefit of this improvement is for future projects. If this establishes precedent for future station construction, then it’s an unmixed blessing.
Money is saved. So what?
The broader issue is that the savings from shrinking the stations’ footprint – totaling potentially $1 billion out of a budget of $7 billion – don’t have much to go. The rub is that the project already has a Full Funding Grant Agreement. If the MTA manages to do it for less, then the most obvious, and most pessimistic, answer to where the money goes is “preventing future overruns.” The savings, in the worst case, then transfer waste from one basket, namely oversize stations, to other baskets, which could be future conflict with contractors, last-minute design changes, or betterments to the neighborhood.
That said, there are plans to spend it on something useful. But the problem is that this is limited by the scope of the project itself. Second Avenue Subway in its current iteration dates to the 1990s, and is reusing some infrastructure from the 1970s. The intention in the 1990s was to do the entire thing, or at least Phases 1 and 2, together, and the project was only chopped into four phases due to high costs. There was design work done 20 years ago or more, and the environmental impact statement is roughly that old.
I suspect the reason the cost saving from shrinking the stations is $1 billion and not much more – we estimated that Phase 1’s cost would have been halved if the stations had been only as long as the platforms – is that the designs are already spoken for, with 20 years of optimization involved. Thus the change is reducing the hard costs of construction, but not the soft costs. It will not surprise me if a postmortem will reveal an elevated ratio of soft to hard costs, purely because the cost savings are happening at such a late stage; in this case, and only in this case, it is important to forgive a high ratio of soft to hard costs, since it portends that future designs will be cheaper, and future cost savings larger. Normally, a high soft-to-hard cost ratio suggests red tape and waste involving consultants, but in this one case, it would suggest something else; I highlight this so that watchdogs for government waste, including the New York Post, realize what is going on and avoid hitting the project if it turns out to indeed have a high soft-to-hard cost ratio as I expect.
Current plans include potentially continuing the tunnel boring under 125th Street. Governor Hochul expressed some interest in a subway extension under 125th Street, extending Phase 2 from 125th/Lexington to the Hudson, with stops at the intersections with the subway lines, at Lenox (2/3), St. Nicholas (A/B/C/D), and Broadway (1 and also potential commuter rail). Such an extension was long on the wishlist of New York-area railfans, and an operations planner mentioned it to me as a future desire more than 10 years ago, unprompted. But there is no way to just reallocate $1 billion to this line; that’s not how federal funding works. At best, it will be possible to continue boring the tunnel all the way to the west, and leave the systems and stations to a future project.
My pessimism is that the cost figure given for the 125th Street extension is $7.6 billion, around $3.3 billion per kilometer. Even taking into account future inflation, it’s costlier than Second Avenue Subway Phases 1 and 2. Now, this is an early number, one that hasn’t really made it into any plans. I hope that the current cost savings are then plugged into the 125th Street extension plan, and that this project is pursued seriously at a much lower cost figure; since all stations would have to be complex digs underneath older north-south subway lines, the benefits of shrinking station footprint are especially large. But I worry that this will not happen; I’ve had hopes dashed before – for example, FRA reform did not lead American commuter rail agencies to start buying alt-compliant vehicles. We’ll see what happens if there’s more detailed work on the 125th Street extension proposal.
Funding projects vs. funding agencies
The current way federal funding works for public transportation in the United States is that the government funds specific capital projects. The MTA can ask for funding for big-ticket items like Second Avenue Subway Phase 1, Phase 2, a future 125th Street subway, the Interborough Express, or any similar such line. It can also ask for a rolling program of improvements, for example installing elevators at stations to make them accessible in line with the Americans with Disabilities Act. But the federal government does not make it easy to move money between such projects.
Phase 2 is just one project, but imagine that there are three subway lines funded concurrently: Phase 2, a subway extension under Nostrand, and a subway extension under Utica. If the MTA finds 25% cost savings, it can’t easily flex the money to a fourth line, say under 125th. It would need to start the planning process early, which is so cumbersome and expensive that it wouldn’t do so for a project it wasn’t certain it wanted to do; there is no shelf of subway extensions that are approved and are just waiting for money.
This makes the incentives for cost savings uncertain: cost savings could be used to establish the agency’s bona fides with a distrustful public, or to establish a warchest guarding against future cost overruns, or to trial new ways of working that could lead to bigger cost savings in the future, but the most straightforward benefit of cost savings – building more infrastructure on the same budget – is not generally available. For Phase 2, the best that can happen is, again, continuing boring the tunnel to the western end of 125th Street, which could be connected with the current project because the geology under the street is the same from Second Avenue to Broadway so might as well future-proof it.
And unfortunately, in the United States, the current examples of funding agencies rather than projects have been lacking. The programs in Los Angeles and Seattle, funded by sales taxes, in effect fund the agencies. There are long lists of projects in both metro areas that are funded from them, but they come from the same pool of money in each region. The situation in Los Angeles is that there’s a decided priority list, with money allocated through the end of the 2050s; if Los Angeles figures out how to cut costs significantly, all of the opening dates will be moved closer and additional lines could be planned and built with the money (the planning and environmental review process takes years, not decades, so by 2050 they will have reviews for the additional subways they could build).
And yet, the same process that’s produced lush agency-level funding in both regions has also led to bad prioritization. New York may have the world’s highest construction costs, but at least what it’s building is what it should be building: Second Avenue Subway Phase 2 is indeed the highest priority right now, and among the next priorities, the Interborough Express and 125th Street are solid choices, according to most area rail advocates two of the top five, and potentially even the top two (the other three are Nostrand, Utica, and an elevated extension of the Astoria Line to LaGuardia). In contrast, Los Angeles is prioritizing the wrong projects. The same ballot proposition process there that produces agency-level funding also requires the agency to bribe local actors who care little for public transportation or for ideological politics with lines to their own subregions of the county, not because they or their constituents will ride the trains, but because they will be able to tell their constituents “I managed to force the county to give us infrastructure money.” This way, each region of the county gets a light rail extension, no matter how lightly-ridden, while the core of the system receives little investment: while the busiest bus corridor in Los Angeles, Wilshire, is getting a subway in the D (Purple) Line Extension, the next two busiest, Vermont and Western, are not getting any rail through the 2050s, despite calls from advocates to built a line on Vermont to turn the B (Red) Line into a north-south line rather than a branch with the Purple Line.
Incentives for the future
The MTA is clearly capable of saving money. The question is now how to incentivize doing more of it. First of all, I urge New York-area advocates to pursue the 125th Street extension, and demand that the cost savings identified for Phase 2 apply to it too. The savings may even potentially be relevant to the Interborough Express, though with at-grade and above-ground stations, the impact is greatly reduced. The Phase 2 savings are reactive; applying them to future lines is proactive.
Second, I urge both the MTA and advocates to look for cost savings in areas where it is easier to flex money – namely, ADA accessibility. Being able to make a station accessible not for the current budget of about $70 million per station with contingency but the $25 million of Boston or $10 million of Madrid would enable New York to have an all-accessible subway system not in the 2050s but in the early 2030s.
Finally, at the federal level, it is useful to figure out how to fund agencies with a positive track record and not just specific projects. Potentially, agencies could be encouraged to submit wishlists of future projects that may be cleared in case money becomes available on short notice; this is useful not just in the case of cost savings, but also in the case of an unexpected infrastructure stimulus – neither the scope of the 2009 stimulus in the early Obama era nor that of 2021 under Biden had been telegraphed until shortly before, and so agencies have not always been able to take maximum advantage of the additional funds.
Northeast Corridor Travel Markets and Fares
I’m optimistic about the ability of fast trains on the Northeast Corridor to generate healthy ridership at all times of day. This is not just a statement about the overall size of the travel market, which is naturally large since the line connects three pretty big metro areas and one very big one. Rather, it’s also a statement about how the various travel markets on the corridor fit atypically well together, creating demand that is fairly consistent throughout the day, permitting trains with a fixed all-day schedule to still have high occupancy – but only if the trains are fast. Today, we’re barely seeing glimpses of that, and instead there are prominent peak times on the corridor, due to a combination of fares and slowness.
Who travels by high-speed rail?
High-speed intercity rail can expect to fill all of the following travel markets:
- Business trips
- Tourism and other recreational trips (including visits to friends and family)
- Commute trips
The key here is that the first two kinds of trips can be either day trips or multiday trips. I day-tripped to the Joint Mathematics Meeting in 2012 when I lived in Providence and the conference was in Boston, about an hour away by commuter rail, but when there was an AMS sectional conference in Worcester in 2011 (from which my blog’s name comes – I found Worcester unwalkable and uploaded an album to Facebook with the name “pedestrian observations from Worcester”) I took trains. I probably would have taken trains from New York to Worcester for the weekend rather than day-tripped even if they were fast – fast trains would still be doing it in around 2:30, which isn’t a comfortable day trip for work.
Non-work trips are the same – they can be day trips or not. Usually recreational day trips are uncommon because train travel is expensive, especially at current Amtrak pricing – the Regional costs twice as much per passenger-km as the TGV and ICE, and the Acela costs three times as much. But there are some corner cases: I moved to Providence with a combination of day trips (including two to view apartments and one to pick up keys) and multiday trips. Then, at commuter rail range, there are more recreational day trips – I’ve both done this and invited others to do so on Boston-Providence and New York-New Haven. Recreational rail trips, regardless of length, are more often taken by individuals and not groups, since car travel costs are flat in the number of passengers and train costs are linear, but even groups sometimes ride trains.
We can turn this into a two-dimensional table of the various kinds of trips, classified by purpose and whether they are day trips or multiday trips:
| Purpose | Day trip | Multiday trip |
| Business | Work trips between city centers, usually in professional services or other high-value added firms, such as lawyers traveling between New York and Washington, or tech workers between New York and Boston; academic seminar trips | Conference trips, more intensive work trips often involving an entire team, and likely all business trips between Boston and Washington or Boston and Philadelphia |
| Tourism | Trips to a specific amenity, which could be urban, such as going to a specific museum in New York or Washington or walking around a historic town like Plymouth, or not, such as taking the train to connect to a beach or hiking trail | Long trips to a specific city or region, stringing many amenities at once |
| Other non-work | College visits, especially close to the train stations; meetings with friends within short range (such as New York-Philadelphia); advocacy groups meeting on topics of interest; apartment viewings; some trips to concerts and sports games | Visits to friends and family; some moving trips; some trips to concerts and sports games |
| Commute | Long-range commutes | — |
Day trips and different peaks
The different trips detailed in the above table peak at different times. The commute trips peak at the usual commute times: into the big cities at 9 in the morning, out of them at 5 in the afternoon. But the rest have different peaks.
In particular, multiday tourism trips peak on weekends – out on Friday, back on Sunday night – while multiday business trips peak during the week. This is consistent enough that airlines use this to discriminate in prices between different travelers: trips are cheaper if booked as roundtrips over Saturday nights, because such trips are likely to be taken by more price-sensitive leisure travelers rather than by less price-sensitive business travelers.
Nonetheless, even with this combination of patterns, the most common pattern I am aware of on intercity rail, at the very least on the Northeast Corridor and on the TGV network, is that the trains are busier during the weekend leisure peak than during the weekday business peaks (except during commute times). Regardless of the distribution of business and leisure trips, leisure trips have a narrow peak, leaving within a window just a few hours long on Friday, whereas business trips may occur on any combination of weekdays; for this reason, leisure-dominated railroads, such as any future service to Las Vegas, are likely to have to deal with very prominent peaking, reducing their efficiency (capacity has to be built for all hours of the week).
But then day trips introduce additional trip types. The leisure day trip is unlikely to be undertaken on a Friday – the traveler who is free during the weekend but not the week might as well travel for the entire weekend. Rather, it’s either a Saturday or Sunday trip, or a weekday trip for the traveler who can take a day off, is not in the workforce, or is in the region on a leisure trip from outside the Northeast and is stringing multiple Northeastern cities on one trip. This day trip then misses the leisure peak, and usually also misses the commuter peak.
The business day trip is likely to be undertaken during the week, probably outside the peak commute time – rather, it’s a trip internal to the workday, to be taken midday and in the afternoon. It may overlap the afternoon peak somewhat – the jobs that I think are likeliest to take such trips, including law, academia, and tech, typically begin and end their workdays somewhat later than 9-to-5 – but the worst peak crowding is usually in the morning and not the afternoon, since the morning peak is narrower, in the same manner that the Friday afternoon peak for leisure travel is narrower than other peaks.
The day trips are rare today; I’ve done them even at the New York-Providence range, but only for the purpose of moving to Providence, and other times I visited New York or even New Haven for a few days at a time. However, the possibility of getting between New York and Providence in 1:20 changes everything. The upshot is that high-speed rail on the Northeast Corridor is certain to massively boost demand on all kinds of trips, but stands to disproportionately increase the demand for non-peak travel, making train capacity more efficient – running the same service all day would incur less waste in seat-km.
The issue of fares
All of this analysis depends on fares. These are not too relevant to business trips, and I suspect even to business day trips – if you’re the kind of person who could conceivably day trip between New York and Washington on a train taking 1:45 each way to (say) meet with congressional staffers, you’re probably doing this even if the fares are as high as they are today. But they are very relevant to all other trips.
In particular, non-work day trips are most likely not occurring during any regular peak travel time. Thus, the fare system should not attempt to discourage such trips. Even commute trips, with their usual peak, can be folded into this system, since pure intercity trips peak outside the morning commute period.
The upshot is that it is likely good to sell intercity and commuter rail tickets between the same pair of stations for the same fare. This means that people traveling on sections currently served by both intercity and commuter rail, like Boston-Providence, New York-New Haven, New York-Trenton, and Baltimore-Washington, would all be taking the faster intercity trains. This is not a problem from the point of view of capacity – intercity trains are longer (they serve fewer stations, so the few stations on the corridor not long enough for 16-car trains can be lengthened), and, again, the travel peaks for multiday trips are distinct from the commute peak. Commuter trains on the corridor would be serving more local trips, and help feed the intercity trains, with through-ticketing and fare integration throughout.
Serving Metro-North Fordham Station
In the Bronx, the Metro-North Harlem Line runs north-south, west of the 2/5 subway lines on White Plains Road and east of the 4 on Jerome Avenue and the B/D on Grand Concourse. It makes multiple stops, all served rather infrequently, currently about every half hour, with some hourly midday gaps, at premium fare. The north-south bus lines most directly parallel to the line, the Bx15 and Bx41, ranked #20 and #24 respectively in ridership on the New York City Transit system in 2019, though both have lost considerable ground since the pandemic. Overall, there is serious if not extremely high demand for service at those stations. There is already a fair amount of reverse-peak ridership: while those half-hourly frequencies can’t compete with the subway for service to Manhattan, they are the only non-car option for reverse-peak service to White Plains, and Fordham gets additional frequencies as well as some trains to Stamford. A city report from 2011 says that Fordham has 51 inbound passengers and 3,055 outbound ones boarding per weekday on Metro-North. Figuring out how to improve service in the Bronx requires a paradigm shift in how commuter rail is conceived in North America. Fordham’s reverse-peak service is a genuinely hard scheduling question, which we’re having to wrestle with as we’re proposing a (much) faster and smoother set of timetables for Northeast Corridor trains. Together, they make for a nontrivial exercise in tradeoffs on a busy commuter line, in which all options leave something to be desired.
Harlem Line local service
The bulk of demand from Fordham is local service, mostly toward Manhattan. The area is a bedroom community: within 1 km of the station at Park and Fordham there are 35,338 employed residents and only 22,515 jobs as of 2019; the largest destination is Manhattan (12,734 commuters), followed by the Bronx (7,744), then the rest of the city (8,069 across three boroughs), and only then Westchester (2,207), Long Island (1,660), and Connecticut (220). But to an extent, the station’s shed is larger for reverse-commute service, because people can connect from the Bx12 bus, which ranked second in the city behind the M15 in both 2019 and 2022; in contrast, Manhattan-bound commuters are taking the subway if they live well east or west of the station along Fordham. Nonetheless, the dominance of commutes to city destinations means that the most important service is to the rest of the city.
Indeed, the nearest subway stations have high subway ridership. The city report linked in the lede cites ridership of 11,521 on the B/D and another 12,560 on the 4 every weekday, as of 2012; both stations saw declines by 2019. The West Bronx’s hilly terrain makes these stations imperfect substitutes for each other and for the Metro-North station, despite the overlap in the walk sheds – along Fordham, Park is 600 meters from the Concourse and 950 from Jerome. Nonetheless, “roughly the same as either of the Fordham stations on the subway” should be a first-order estimate for the ridership potential; better Metro-North service would provide a much faster option to East Harlem and Grand Central, but conversely require an awkward transfer to get to points south, which predominate among destinations of workers from the area, who tilt working-class and therefore peak in Midtown South and not in the 50s:
Adding up all the Bronx stations on the line – Wakefield, Woodlawn, Williams Bridge, Botanical Garden, Fordham, Tremont, Melrose – we get 170,049 employed residents (as always, as of 2019), of whom 62,837 work in Manhattan. The line is overall in a subway desert, close to the 4 and B/D but along hills, and not so close to the 2/5 to the east; several tens of thousands of boardings are plausible if service is improved. For comparison, the combination of Westchester, Putnam, and Dutchess Counties has 115,185 Manhattan-bound commuters, split across the Harlem Line, the Hudson Line, and the inner New Haven Line. The Bronx is thus likely to take a majority of Manhattan-bound ridership on the Harlem Line, though not an overwhelming one.
To serve all this latent demand, it is obligatory to run more local service. A minimum service frequency of a train every 10 minutes is required. The current outbound schedule is 20 minutes from Grand Central to Fordham, and about four of those are a slowdown in the Grand Central throat that can be waived (the current speed limit is 10 miles per hour for the last mile; the infrastructure can largely fit trains running three times that fast almost all the way to the bumpers). Lower frequency than this would not really make use of the line’s speed.
Moreover, using the track chart as of 2015 and current (derated) M7 technical performance, the technical trip time is 18 minutes, over which 20 minutes is not too onerously padded; but removing the derating and the four gratuitous minutes crawling into and out of Grand Central, this is about 14 minutes, with some pad. The speed zones can be further increased by using modern values of cant and cant deficiency on curves, but the difference isn’t very large, only 40 seconds, since this is a section with frequent stops. It’s fast, and to reinforce this, even higher frequency may be warranted, a train every 7.5 or 6 or even 5 minutes.
There is room on the tracks for all of this. The issue is that this requires dedicating the local tracks on the Harlem Line in the Bronx to local service, instead of having trains pass the platforms without stopping. This, in turn, requires slowing down some trains from Westchester to make more local stops. Current peak traffic on the Harlem Line is 15 trains per hour, of which 14 run past Mount Vernon West, the current northern limit of the four-track section, and 13 don’t stop in the Bronx at all. The line has three tracks through past Crestwood, and the stations are set up with room for a fourth track, but a full 10 trains per hour, including one that stops in the Bronx, run past Crestwood. In theory it’s possible to run 12 trains per hour to Mount Vernon West making all stops, and 12 trains past it skipping Bronx stops; this slows down the express trains from White Plains, which currently skip seven stops south of White Plains to Mount Vernon West inclusive, but higher speeds in the Bronx, speeding up the Grand Central throat, higher frequency, and lower schedule padding would together lead to improvements in trip times. However, this introduces a new set of problems, for which we need to consider the New Haven Line too.
Harlem Line express service and the New Haven Line
Currently, the New Haven Line runs 20 trains per hour into Grand Central at the peak. This number will go down after Penn Station Access opens in 2027, but not massively; a split of 6-8 trains per hour into Penn Station and 16-18 into Grand Central, with the new service mildly increasing total throughput, is reasonable.
Today, New Haven Line locals stop at Fordham, and nowhere else in the Bronx. This is inherited from the trackage rights agreement between the New York Central and the New York, New Haven and Hartford Railroad, allowing the latter to make only one stop in the Bronx on the former’s territory; it used to be Woodlawn, the branch point, but has been moved to Fordham, which has busier reverse-peak traffic. The two railroads merged in 1969, and all service is currently run by Metro-North, but the practice persists. This is not necessarily stupid: the New Haven locals are long – Stamford is 53 km from Grand Central, 50% farther than White Plains – and a system in which the New Haven trains are more express than the Harlem trains is not by itself stupid, depending on other system constraints. Unfortunately, this setup introduces all manners of constraints into the system:
- Fordham is a local-only station, and thus New Haven locals have to use the local tracks, using awkwardly-placed switches to get between the express and the local tracks. In fact, all stations up to and including Woodlawn are local-only; the first station with platforms on the express tracks is Wakefield, just north of the split between the two lines.
- If there are 12 Harlem Line trains per hour expressing through the Bronx, then the New Haven Line is limited to about 12 trains per hour as well unless the local trains make all the Bronx local stops.
- The Hudson Line has a flat junction with the Harlem Line at Mott Haven Junction, which means that any regular schedule has to have gaps to let Hudson Line trains pass; current peak Hudson Line traffic is 11 trains per hour, but it was 14 before corona.
This leads to a number of different options, each problematic in its own way.
Maximum separation
In this schedule, all Harlem Line trains run local, and all New Haven Line trains run express in the Bronx. This is the easiest to timetable – the junction between the two lines, unlike Mott Haven, is grade-separated. This also requires splitting the Hudson Line between local and express tracks, so delays will still propagate in any situation unless the Hudson Line is moved to the Empire Connection (6-8 trains per hour can stay on the current route); but in a future with Penn Station Access West, building such service, it does allow for neat separation of the routes, and I usually crayon it this way in very high-investment scenarios with multiple through-running tunnels.
But in the near future, it is a massive slowdown for Harlem Line riders who currently have express service from White Plains to Manhattan. The current peak timetable has a 15-minute difference between local and express trains on this section; this figure is padded but not massively so, and conversely, higher speeds on curves increase the express train speed premium.
It also severs the connection between the Bronx and the New Haven Line, unless passengers take east-west buses to the Penn Station Access stations. It is possible to add infill at Wakefield on the New Haven Line: this is north of the junction with the Harlem Line, but barely, so the separation between the lines is short, and a transfer station is feasible. But it wouldn’t be a cross-platform transfer, and so Fordham-Stamford service would still be degraded.
Locals run local
The New Haven Line locals can make local stops in the Bronx. It’s a slowdown of a few minutes for those trains – the current outbound timetable is 18 minutes from Grand Central to Fordham, two minutes faster than on Harlem Line locals while skipping Melrose and Tremont. Overall, it’s a slowdown of around six minutes; the current speed zones are 60 and 75 mph, and while raising the speed limits increases the extent of the slowdown (most of the track geometry is good for 160 km/h), getting new trainsets with better acceleration performance decreases it, and overall it’s likely a wash.
From there, the service pattern follows. New Haven Line locals to Grand Central have little reason to run more frequently than every 10 minutes at peak – the local stations are 30-60 minutes out of Grand Central today, and this is massively padded, but with the timetables Devin produced, fixing the Grand Central throat, New Rochelle would still be 20 minutes out on a local train (stopping at Fordham only as is the case today) and Stamford would be 45 minutes out. What’s more, there will be some local trains to Penn Station starting in three years, boosting the effective frequency to a train every five minutes, with a choice of Manhattan station if express trains can be made to stop at New Rochelle with a timed connection.
Now, if there are six local trains per hour in the Bronx going to Stamford, then the Harlem Line locals only take six trains per hour of their own, and then 12 trains should run express from Wakefield to Harlem. What they do to the north depends. The simplest option is to have all of them make all stops, which costs White Plains 7-8 minutes relative to the express stopping pattern. But if the line can be four-tracked to Crestwood, then half the trains can run local to White Plains and half can run nonstop between Wakefield or Mount Vernon West and White Plains. Two local stations, Scarsdale and Hartsdale, are in two-track territory, but timetabling a local to follow an express when both run every 10 minutes and there are only two local stops’ worth of speed difference is not hard.
The New Haven Line, meanwhile, gets 12 express trains per hour. Those match 12 express Harlem Line trains per hour, and then there’s no more room on the express tracks; Hudson Line trains have to use the local tracks and somehow find slots for the northbound trains to cross both express tracks at-grade.
Status quo
The status quo balances Bronx-Stamford connectivity with speed. Bear in mind, the New Haven Line today has truly massive timetable padding, to the point that making trains make all six stops in the Bronx and not just Fordham would still leave New Rochelle locals faster than they are today if the other speedup treatments were put into place. But the status quo would allow New Rochelle, Larchmont, Rye, and Greenwich to take maximum advantage of the speedup, which is good. The problem with it is that it forces New Haven Line locals to take slots from both the express tracks and the local tracks in the Bronx.
In this situation, the New Haven Line still runs six locals and 12 express trains to Grand Central per hour. The Harlem Line is reduced to six express trains through the Bronx and has to run 12 trains local. Transfers at Wakefield allow people in suburbs south of White Plains to get on a faster train, but this in effect reduces the effective peak-of-peak throughput from the suburbs to Manhattan to just six trains per hour.
Express Fordham station
Rebuilding Fordham as an express station means there’s no longer any need to figure out which trains stop there and which don’t: all would. Then the New Haven Line would run express and the Harlem would either run local or run a mix.
The problem is that Fordham is in a constrained location, where such a rebuild is hard:
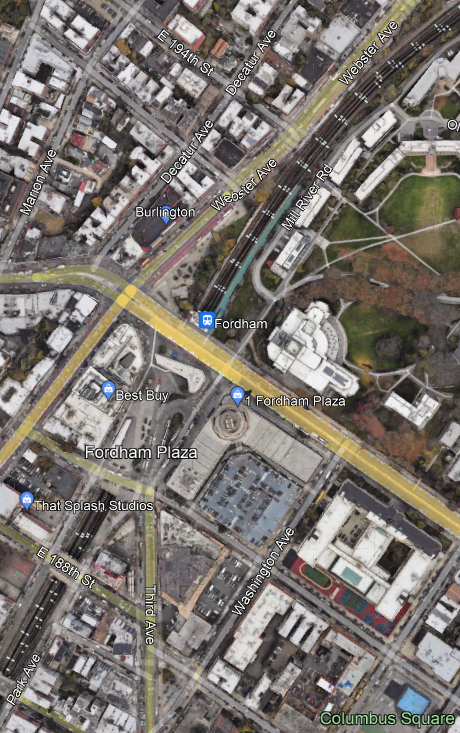
The line is below-grade, with a tunnel from Fordham Road to 189th Street. The platforms are short and narrow, and partly overlap the tunnel. Any conversion has to involve two island platforms north of the tunnel, where there is room but only if the right-of-way is expanded a little, at the expense of some parkland, and possibly a lane of Webster Avenue. The cost would not be pretty, independently of the inability of the MTA to build anything on a reasonable budget.
That said, the timetables on the Northeast Corridor require some infrastructure intervention to smooth things, like grade-separating some junctions for hundreds of millions of dollars each. New Rochelle, which has only a local platform southbound, should almost certainly be rebuilt as a full express stop. So rebuilding Fordham is not out of the question, even if the cost is high (which it is).
In this situation, all New Haven Line trains should use the express tracks. Thus, as in the status quo alternative, the Harlem Line gets six express trains, the other trains having to run local. Potentially, there may be a schedule in which the New Haven Line runs 16 trains to Grand Central and eight to Penn Station, and then the Harlem Line can get eight local and eight express trains; but then the local trains have to be carrying the load well into Westchester, and four-tracking the line to Crestwood is likely obligatory.
The New Haven Line and intercity trains
The above analysis elides one important factor: intercity trains. The current practice in the United States is a three-way separation of urban rail, suburban commuter rail, and intercity rail, with fares designed to discourage riders from taking trains that are not in their sector. However, in much the same way the best industry practice is to charge mode-neutral fares within cities, it is also valuable to charge mode-neutral fares between them. In other words, it’s useful to look at the impact of permitting people with valid commuter rail tickets to take intercity trains, without seat reservations.
To be clear, this means that at rush hour, there are going to be standees on busy commuter routes including Stamford-New York and Trenton-New York. But it’s not necessarily bad. The intercity trip time in our timetables between Stamford and New York is around 29 minutes without high-speed bypasses; the standing time would be less than some subway riders endure today – in the morning rush hour the E train departs Jamaica Center full and takes 34 minutes to get to its first Manhattan stop. And then there’s the issue of capacity: commuter trains on the New Haven Line are eight cars long, intercity trains can be straightforwardly expanded to 16 cars by lengthening the platforms at a very small number of stations.
And if the intercity trains mop up some of the express commuter rail traffic, then the required service on the New Haven Line at rush hour greatly decreases. An intercity train, twice as long as a commuter train (albeit with somewhat fewer seats and less standing space per car), could plausibly displace so much commuter traffic that the peak traffic on the line could be reduced, say to 18 trains per hour from today’s 20. Moreover, the reduction would be disproportionately at longer distance: passengers west of Stamford would not have any replacement intercity train unless they backtracked, but passengers east of Stamford would likely switch. This way, the required New Haven Line traffic shrinks to 12 local trains per hour and six express trains; half the locals run to Penn Station and half to Grand Central, and all express trains run to Grand Central.
In that situation, we can rerun the scenarios for what to do about Fordham; the situation generally improves, since less commuter traffic is required. The maximum separation scenario finally permits actual separation – the Hudson Line would run on the express tracks into Grand Central and have to cross the southbound Harlem Line locals at Mott Haven Junction, with predictable gaps between trains. The locals-run-local scenario gives Harlem Line express trains more wiggle room to slot between New Haven Line express trains. The status quo option lets the Harlem Line run six local trains and 12 express trains, though that likely underserves the Bronx. Converting Fordham to an express stop straightforwardly works with zero, six, or 12 express Harlem Line trains per hour.
Or maybe not. It’s fine to assume that letting passengers get on a train that does Stamford-Penn Station in 29 minutes and New Haven-Penn Station in 57 for the price of a commuter pass is going to remove passengers from the express commuter trains and put them onto longer intercity trains. But by the same token, the massive speed improvements to the other stops could lead to an increase in peak demand. The current trip time to Stamford is 1:12 on a local train; cutting that to 45 minutes means so much faster trips to the suburbs in between that ridership could increase to the point of requiring even more service. I’m not convinced on this – the modal split for peak commutes to Manhattan is already very high (Metro-North claimed 80% in the 2000s), and these suburbs are incredibly NIMBY. But it’s worth considering. At the very least, more local service is easier to add to the timetable than more express service – locals to Grand Central don’t share tracks with intercities at all, and even locals to Penn Station only do on a controllable low-speed section in Queens.
New York-New Haven Trains in an Hour
Devin Wilkins and I are still working on coming up with a coordinated timetable on the Northeast Corridor, north to south. Devin just shared with me the code she was running on both routes from New Haven to New York – to Grand Central and to Penn Station – and, taking into account the quality of the right-of-way and tunnels but not timetable padding and conservative curve speeds – it looks like intercity trains would do it in about an hour. The current code produces around 57 minutes with 7% timetable pad if I’m getting the Penn Station throat and tunnel slowdowns right – but that’s an if; but at this point, I’m confident about the figure of “about an hour” on the current right-of-way.
I bring this up to give updates on how the more accurate coding is changing the timetable compared to previous estimates, but also to talk about what this means for future investment priorities.
First, the curve radii I was assuming in posts I was writing last decade were consistently too optimistic. I wrote three months ago about how even within the highest speed zone in southern Rhode Island, there’s a curve with radius 1,746 meters (1 degree in American parlance), which corresponds to about 215 km/h with aggressive cant and cant deficiency. At this point we’ve found numbers coming straight from Amtrak, Metro-North, and MBTA, letting us cobble together speed zones for the entire system.
But second, conversely, I was being too conservative with how I was setting speed zones. My principle was that the tightest curve on a section sets the entire speed limit; when writing commuter rail timetables, I would usually have each interstation segment be a uniform speed zone, varying from this practice only when the interstation was atypically long and had long straight sections with a tight curve between them. When writing intercity timetables, I’d simplify by having the typical curves on a line set the speed limit and then have a handful of lower speed limits for tighter curves; for example, most curves on the New Haven Line are 873 meters, permitting 153 km/h with aggressive high-speed rail cant and cant deficiency, and 157 km/h with aggressive limits for slower trains, which can run at slightly higher cant deficiency, but those sections are punctuated by some sharper curves with lower limits. Devin, using better code than me, instead lets a train accelerate to higher speed on straight sections and then decelerate as soon as it needs to. Usually such aggressive driving is not preferred, and is used only when recovering from delays – but the timetable is already padded somewhat, so it might as well be padded relative to the fastest technical speed.
The upshot of all of this is that the speed gains from just being able to run at the maximum speed permitted by the right-of-way are massive. The trip time today is 1:37 on the fastest trains between New York and New Haven. Commuter trains take 2:10, making all stops from New Haven to Stamford and then running nonstop between Stamford and Manhattan; in our model, with a top speed of 150 km/h, high-performance regional trains like the FLIRT, Talent 3, or Mireo should do the trip in about 1:15-1:20, and while we didn’t model the current rolling stock, my suspicion is that it should be around six minutes longer. The small difference in trip time is partly because Penn Station’s approach is a few kilometers longer than Grand Central’s and the curves in Queens and on the Hell Gate Bridge are tight.
What this means is that the highest priority should be getting trains down to this speed. In the Swiss electronics-before-concrete schema, the benefits of electronics on the Northeast Corridor are massive; concrete has considerable benefits as well, especially on sections where the current right-of-way constrains not just speed but also reliability and capacity, like New Haven-Kingston, but the benefits of electronics are so large that it’s imperative to make targeted investments to allow for such clean schedules.
Those investments do include concrete, to be clear. But it’s concrete that aims to make the trains flow more smoothly, in support of a repetitive schedule with few variations in train stopping patterns, so that the trains can be timetabled in advance not to conflict. At this point, I believe that grade-separating the interlocking at New Rochelle, popularly called Shell Interlocking and technically called CP 216, is essential and must be prioritized over anything else between the city limits of New York and New Haven Union Station. Currently, there’s very high peak traffic through the interlocking, with a flat junction between trains to Penn Station and trains to Grand Central.
On the electronics side, the timetables must become more regular. There are currently 20 peak trains per hour on the New Haven Line into Grand Central; of those, four go to branches and 16 are on the main line, and among the 16, there are 13 different stopping patterns, on top of the intercity trains. It is not possible to timetable so many different trains on a complex system and be sure that everything is conflict-free, and as a result, delays abound, to which the response is to pad the schedules. But since the padded schedules still have conflicts, there is a ratchet of slowdowns and padding, to the point that a delayed train can recover 20 minutes on less than the entire line. Instead, every train should either be a local train to Stamford or an express train beyond Stamford, and there should only be a single express pattern on the inner line, which today is nonstop between Harlem and Stamford and in the future should include a stop at New Rochelle; this means that, not taking intercity trains into account, the main line should have at most four stopping patterns (local vs. express, and Penn Station vs. Grand Central), and probably just three, since express commuter trains should be going to Grand Central and not Penn Station, as passengers from Stamford to Penn Station can just ride intercity trains.
Also on the electronics side, the way the line is maintained currently is inefficient to an extent measured in orders of magnitude and not factors or percents. Track inspection is manual; Metro-North finally bought a track geometry machine but uses it extremely unproductively, with one report saying it gets one tenth as much work done as intended. Normally these machines can do about a track-mile in an overnight work window, which means the entire four-track line can be regraded and fixed in less than a year of overnights, but they apparently can’t achieve that. Whatever they’re doing isn’t working; the annual spending on track renewal in Connecticut is what Germany spends on once-in-a-generation renewal. The endless renewal work includes a plethora of ever-shifting slow zones, and at no point is the entire system from New York to New Haven clear for trains, even on weekdays. The excessively complex schedule, on tracks that constantly shift due to segment-by-segment daytime repairs, is turning a trip that should be doable on current rolling stock in perhaps 1:23 into one that takes 2:10.
The billions of dollars in the Bipartisan Infrastructure Law that are dedicated to the Northeast Corridor and have not yet been spent can reduce trip times further. But the baseline should be that the bucket of money is a few hundreds of millions smaller and the base case trip time from New York to New Haven is an hour and not 1:37; this is what the system should be compared with.
