Category: Transportation
The Northeastern United States Wants to Set Tens of Billions on Fire Again
The prospect of federal funds from the Bipartisan Infrastructure Bill is getting every agency salivating with desires for outside money for both useful and useless priorities. Northeastern mainline rail, unfortunately, tilts heavily toward the useless, per a deep dive into documents by New York-area activists, for example here and here.
Amtrak is already hiring project management for Penn Station redevelopment. This is a project with no transportation value whatsoever: this is not the Gateway tunnels, which stand to double capacity across the Hudson, but rather a rebuild of Penn Station to add more tracks, which are not necessary. Amtrak’s current claim is that the cost just for renovating the existing station is $6.5 billion and that of adding tracks is $10.5 billion; the latter project has ballooned from seven tracks to 9-12 tracks, to be built on two levels.
This is complete overkill. New train stations in big cities are uncommon, but they do exist, and where tracks are tunneled, the standard is two platform tracks per approach tracks. This is how Berlin Hauptbahnhof’s deep section goes: the North-South Main Line is four tracks, and the station has eight, on four platforms. Stuttgart 21 is planned in the same way. In the best case, each of the approach track splits into two tracks and the two tracks serve the same platform. Penn Station has 21 tracks and, with the maximal post-Gateway scenario, six approach tracks on each side; therefore, extra tracks are not needed. What’s more, bundling 12 platform tracks into a project that adds just two approach tracks is pointless.
This is a combined $17 billion that Amtrak wants to spend with no benefit whatsoever; this budget by itself could build high-speed rail from Boston to Washington.
Or at least it could if any of the railroads on the Northeast Corridor were both interested and expert in high-speed rail construction. Connecticut is planning on $8-10 billion just to do track repairs aiming at cutting 25-30 minutes from the New York-New Haven trip times; as I wrote last year when these plans were first released, the reconstruction required to cut around 40 minutes and also upgrade the branches is similar in scope to ongoing renovations of Germany’s oldest and longest high-speed line, which cost 640M€ as a once in a generation project.
In addition to spending about an order of magnitude too much on a smaller project, Connecticut also thinks the New Haven Line needs a dedicated freight track. The extent of freight traffic on the line is unclear, since the consultant report‘s stated numbers are self-contradictory and look like a typo, but it looks like there are 11 trains on the line every day. With some constraints, this traffic fits in the evening off-peak without the need for nighttime operations. With no constraints, it fits on a single track at night, and because the corridor has four tracks, it’s possible to isolate one local track for freight while maintenance is done (with a track renewal machine, which US passenger railroads do not use) on the two tracks not adjacent to it. The cost of the extra freight track and the other order-of-magnitude-too-costly state of good repair elements, including about 100% extra for procurement extras (force account, contingency, etc.), is $300 million for 5.4 km.
I would counsel the federal government not to fund any of this. The costs are too high, the benefits are at best minimal and at worst worse than nothing, and the agencies in question have shown time and time again that they are incurious of best practices. There is no path forward with those agencies and their leadership staying in place; removal of senior management at the state DOTs, agencies, and Amtrak and their replacement with people with experience of executing successful mainline rail projects is necessary. Those people, moreover, are mid-level European and Asian engineers working as civil servants, and not consultants or political appointees. The role of the top political layer is to insulate those engineers from pressure by anti-modern interest groups such as petty local politicians and traditional railroaders who for whatever reasons could not just be removed.
If federal agencies are interested in building something useful with the tens of billions of BIL money, they should instead demand the same results seen in countries where the main language is not English, and staff up permanent civil service run by people with experience in those countries. Following best industry practices, $17 billion is enough to renovate the parts of the Northeast Corridor that require renovation and bypass those that require greenfield bypasses; even without Gateway, Amtrak can squeeze a 16-car train every 15 minutes, providing 4,400 seats into Penn Station in an hour, compared with around 1,700 today – and Gateway itself is doable for low single-digit billions given better planning and engineering.
German Rail Traffic Surges
DB announced today that it had 500,000 riders across the two days of last weekend. This is a record weekend traffic; May is so far 5% above 2019 levels, representing full recovery from corona. This is especially notable because of Germany’s upcoming 9-euro ticket: as a measure to curb high fuel price from the Russian war in Ukraine, during the months of June, July, and August, Germany is both slashing fuel taxes by 0.30€/liter and instituting a national 9€/month public transport ticket valid not just in one’s city of domicile but everywhere. In practice, rail riders respond by planning domestic rail trips for the upcoming three months; intercity trains are not covered by the 9€ monthly pass, but city transit in destination cities is, so Berliners I know are planning to travel to other parts of Germany during the window when local and regional transit is free, displacing trips that might be undertaken in May.
This is excellent news, with just one problem: Germany has not invested in its rail network enough to deal with the surge in traffic. Current traffic is already reaching projections made in the 2010s for 2030, when most of the Deutschlandtakt is supposed to go into effect, with higher speed and higher capacity than the network has today. Travel websites are already warning of capacity crunches in the upcoming three months of effectively free regional travel (chaining regional trains between cities is possible and those are covered by the 9€ monthly pass). Investment in capacity is urgent.
Sadly, such investment is still lagging. Germany’s intercity rail network rarely builds complete high-speed lines between major cities. The longest all-high-speed connection is between Cologne and Frankfurt, 180 km apart. Longer connections always have significant slow sections: Hamburg-Hanover remains slow due to local NIMBY opposition to a high-speed line, Munich’s lines to both Ingolstadt and Augsburg are slow, Berlin’s line toward Leipzig is upgraded to 200 km/h but not to full high-speed standards.
Moreover, plans to build high-speed rail in Germany remain compromised in two ways. First, they still avoid building completely high-speed lines between major cities. For example, the line from Hanover to the Rhine-Ruhr is slow, leading to plans for a high-speed line between Hanover and Bielefeld, and potentially also from Bielefeld to Hamm; but Hamm is a city of 180,000 people at the eastern margin of the Ruhr, 30 km from Dortmund and 60 from Essen. And second, the design standards are often too slow as well – Hanover-Bielefeld, a distance that the newest Velaro Novo trains could cover in about 28 minutes, is planned to be 31, compromising the half-hourly and hourly connections in the D-Takt. Both of these compromises create a network that 15 years from now is planned to have substantially lower average speeds than those achieved by France 20 years ago and by Spain 10 years ago.
But this isn’t just speed, but also capacity. An incomplete high-speed rail network overloads the remaining shared sections. A complete one removes fast trains from the legacy network except in legacy rail terminals where there are many tracks and average speeds are never high anyway; Berlin, for example, has four north-south tracks feeding Hauptbahnhof with just six trains per hour per direction. In China, very high throughput of both passenger rail (more p-km per route-km than anywhere in Europe) and freight rail (more ton-km per route-km than the United States) through the removal of intercity trains from the legacy network to the high-speed one, whose lines are called passenger-dedicated lines.
So to deal with the traffic surge, Germany needs to make sure it invests in intercity rail capacity immediately. This means all of the following items:
- Building all the currently discussed high-speed lines, like Frankfurt-Mannheim, Ulm-Augsburg (Stuttgart-Ulm is already under construction), and Hanover-Bielefeld.
- Completing the network by building high-speed lines even where average speeds today are respectable, like Berlin-Halle/Leipzig and Munich-Ingolstadt, and making sure they are built as close to city center as possible, that is to Dortmund and not just Hamm, to Frankfurt and not just Hanau, etc.
- Purchasing 300 km/h trains and not just 250 km/h ones; the trains cost more but the travel time reduction is noticeable and certain key connections work out for a higher-speed D-Takt only at 300, not 250.
- Designing high-speed lines for the exclusive use of passenger trains, rather than mixed lines with gentler freight-friendly grades and more tunnels. Germany has far more high-speed tunneling than France, not because its geography is more rugged, but because it builds mixed lines.
- Accelerating construction and reducing costs through removal of NIMBY veto points. Groups should have only two months to object, as in Spain; current practice is that groups have two months to say that they will object but do not need to say what the grounds for those objections are, and subsequently they have all the time they need to come up with excuses.
Systemic Investments in the New York City Subway
Subway investments can include expansion of the map of lines, for example Second Avenue Subway; proposals for such extensions are affectionately called crayon, a term from London Reconnections that hopped the Pond. But they can also include improvements that are not visible as lines on a map, and yet are visible to passengers in the form of better service: faster, more reliable, more accessible, and more frequent.
Yesterday I asked on Twitter what subway investments people think New York should get, and people mostly gave their crayons. Most people gave the same list of core lines – Second Avenue Subway Phase 2, an extension of the 2 and 5 on Nostrand, an extension of the 4 on Utica, an extension of the N and W to LaGuardia, the ongoing Interborough Express proposal, and an extension of Second Avenue Subway along 125th – but beyond that there’s wide divergence and a lot of people argue over the merits of various extensions. But then an anonymous account that began last year and has 21 followers and yet has proven extremely fluent in the New York transit advocacy conversation, named N_LaGuardia, asked a more interesting question: what non-crayon systemic investments do people think the subway needs?
On the latter question, there seems to be wide agreement among area technical advocates, and as far as I can tell the main advocacy organizations agree on most points. To the extent people gave differing answers in N_LaGuardia’s thread, it was about not thinking of everything at once, or running into the Twitter character limit.
It is unfortunate that many of these features requiring capital construction run into the usual New York problem of excessive construction costs. The same institutional mechanisms that make the region incapable of building much additional extension of the system also frustrate systemwide upgrades to station infrastructure and signaling.
Accessibility
New York has one of the world’s least accessible major metro systems, alongside London and (even worse) Paris. In contrast, Berlin, of similar age, is two-thirds accessible and planned to reach 100% soon, and the same is true of Madrid; Seoul is newer but was not built accessible and retrofits are nearly complete, with the few remaining gaps generating much outrage by people with disabilities.
Unfortunately, like most other forms of capital construction in New York, accessibility retrofits are unusually costly. The elevator retrofits from the last capital plan were $40 million per station, and the next batch is in theory $50 million, with the public-facing estimates saying $70 million with contingency; the range in the European cities with extensive accessibility (that is, not London or Paris) is entirely single-digit million. Nonetheless, this is understood to be a priority in New York and must be accelerated to improve the quality of universal design in the system.
Platform screen doors
The issue of platform screen doors (PSDs) or platform edge doors (PEDs) became salient earlier this year due to a much-publicized homicide by pushing a passenger onto a train, and the MTA eventually agreed to pilot PSDs at three stations. The benefits of PSDs are numerous, including,
- Safety – there are tens of accident and suicide deaths every year from falling onto tracks, in addition to the aforementioned homicide.
- Greater accessibility – people with balance problems have less to worry about from falling onto the track.
- Capacity – PSDs take up platform space but they permit passengers to stand right next to them, and the overall effect is to reduce platform overcrowding at busy times.
- Air cooling – at subway stations with full-height PSDs (which are rare in retrofits but I’m told exist in Seoul), it’s easier to install air conditioning for summer cooling.
The main difficulty is that PSDs require trains to stop at precise locations, to within about a meter, which requires signaling improvements (see below). Moreover, in New York, trains do not yet have consistent door placement, and the lettered lines even have different numbers of doors sometimes (4 per car but the cars can be 60′ or 75′ long) – and the heavily interlined system is such that it’s hard to segregate lines into captive fleets.
But the biggest difficulty, as with accessibility, is again the costs. In the wake of public agitation for PSDs earlier this year, the MTA released as 2019 study saying only 128 stations could be retrofitted with PSDs, at a cost of $7 billion each, or $55 million per station; in Paris, PSDs are installed on Métro lines as they are being automated, at a cost of (per Wikipedia) 4M€ per station of about half the platform length as in New York.
Signaling improvements
New York relies on ancient signaling for the subway. This leads to multiple problems: maintenance is difficult as the international suppliers no longer make the required spare parts; the signals are designed around the performance specs of generations-old trains and reduce capacity on more modern trains; the signals are confusing to drivers and therefore trains run slower than they can.
To modernize them, New York is going straight to the most advanced system available: CBTC, or communications-based train control, also known as moving-block signaling. This is already done on the L and 7 trains and is under installation on other lines, which are not isolated from the rest of the system. CBTC permits much higher peak capacity in London; in New York, unfortunately, this effect has been weaker because of other constraints, including weak electrical substation capacity and bumper tracks at the terminals of both the L and the 7.
Moreover, in New York, the L train’s performance was derated when CBTC was installed, to reduce brake wear. The effect of such computer control should be the opposite, as computers drive more precisely than humans: in Paris, the automation of Line 1 led to a speed increase of 15-20%, and CBTC even without automation has the same precision level as full automation.
As before, costs form a major barrier. I can’t give the most recent analogs, because such projects tend to bundle a lot of extras, such as new trainsets and PSDs in Paris. In Nuremberg, the first city in the world to permanently convert a preexisting metro system to driverless operations, the cost of just the driverless system is said to have been 110M€ in the late 2000s, for what I believe is 13 km of U2 (U3 was built with driverless operations in mind, and then U2, from which it branches, was converted). It is said that automating U1 should cost 100M€ for 19.5 km, but this project is not happening due to stiff competition for federal funds and therefore its real cost is uncertain. In contrast, Reinvent Albany quotes $636 million for the 7 train in New York, of which $202 million must be excluded as rolling stock conversion; the Flushing Line is 16 km long, so this is still $27 million/km and not the $7-12 million/km of Nuremberg.
Maintenance regime
The maintenance regime in New York involves heavy slowdowns and capacity restrictions. Trains run 24/7 without any breaks for regular maintenance. Instead, maintenance is done one track at a time during off-peak periods, with flagging rules that slow down trains on adjacent tracks and have gotten more onerous over the last 10-20 years; only recently have planners begun to use temporary barriers to reduce the burden of flagging.
The result of this system is threefold. First, track maintenance productivity is extremely low – the train on an adjacent track slows down as it passes but the work stops as it passes as well. Second, speeds are unreliable off-peak and the timetable is in perpetual firefighting mode. And third, parts of the system are claimed to be incapable of running more than about 16 trains per hour off-peak, which means that if there is any branching, the branches are limited to 8, which is not enough frequency on a major urban metro system.
It takes a small amount of capital spending to increase efficiency of maintenance, through procuring more advanced machinery, installing barriers between tracks, and installing crossovers at appropriate locations. But it takes a large degree of operations and management reform to get there, which is necessary for reducing the high operating costs of the subway.
Deinterlining
New York has the most complicated interlining of any global metro network. Only four lines – the 1, 6, 7, and L – run by themselves without any track sharing with other lines. The 2, 3, 4, and 5 share tracks with one another. Then the lettered trains other than the L all share tracks on various segments, without any further segregation. Only some commuter rail networks are more complex than this – and even Tokyo has greater degree of segregation between different trunk lines, despite extensive through-service to commuter rail. The New York way guarantees more direct service on more origin-destination pairs, but at low frequency and with poor speed and reliability.
London, the second most interlined system, has long wanted to reduce interlining to increase capacity. The Northern line traditionally had just one southern segment reverse-branching to two central trunks, combining and splitting into two northern branches. When CBTC opened, the busier of the central trunks got 26 peak trains per hour; the more recent Battersea extension removed the interlining to the south, permitting boosting capacity up to 32 tph, and full deinterlining to the north would boost it to 36 tph, as on the most captive Underground lines.
In New York, it is desirable to remove all reverse-branching. At DeKalb Avenue in Downtown Brooklyn, the interlocking switches the four express (bridge) tracks from an arrangement of the B and D on one track pair and the N and Q on the other to the B and Q on one track pair and the D and N on the other; the process is so complex that every train is delayed two minutes just from the operation of the switches. Everywhere within the system, interlining creates too much dependency between the different trains, so that delays on one line propagate to the others, reducing reliability, speed, and capacity.
Some of the problem is, as usual, about high costs. Rogers Avenue Junction controls the branching of the 2, 3, 4, and 5 trains in Brooklyn, transitioning from the 2 and 3 sharing one track pair and the 4 and 5 sharing another to the 3 and 4 running on dedicated tracks and the 2 and 5 sharing tracks. For a brief segment, the 2, 3 and 5 trains all share tracks. This devastates capacity on both trunk lines, which rank first and third citywide in peak crowding as of the eve of the opening of Second Avenue Subway. There are already internal designs for rebuilding the junction to avoid this problem – at a cost of $300 million.
But some of the problem is also about operating paradigms. New York must move away from the scheduling ideas of the 1920s and 30s and understand that independently-operated lines with dedicated fleets and timetables, with passengers making transfers as appropriate, are more robust and overall better for most riders. DeKalb can be deinterlined with no capital spending at all, and so can Columbus Circle. It’s Rogers and Queens Plaza where spending is ideal (but even then, not strictly required if some operational compromises are made), and the 142nd Street Junction in Harlem where an extensive rebuild is obligatory in order to permit splitting the 2 from the 5 in the Bronx permanently.
Labor changes
Staffing levels in New York are very high. Trains have conductors and not just drivers; this is not globally unheard of (Toronto and some lines in Tokyo still have conductors) but it’s rare. With good enough signaling, a retrofit even for full automation is possible, as in Nuremberg, Paris, and Singapore. Maintenance work is likewise unproductive, not because people don’t work hard, but because they work inefficiently.
Improving this situation involves changes on both sides of the ledger – staffing and service. Conductors have to be cut for efficiency and not all of them can be absorbed by other roles, and the same is true of some station facilities and maintenance functions. In contrast, the low productivity of drivers in New York – they spend around 550 hours a year driving a revenue train whereas Berlin’s drivers, who get 6 weeks of annual paid vacation, scratch 900 – is the result of poor off-peak frequency, and must be resolved through increases in off-peak service that increase efficiency without layoffs.
Ultimate goal: six-minute service
I wrote two years ago about what it would take to ensure every public transit service in New York runs every six minutes off-peak, calling it a six-minute city.
Riders Alliance argues for the same goal, with the hashtag #6minuteservice; I do not know if they were basing this on what I’d written or if it’s convergent evolution. But it’s a good design goal for timetabling, with implications for labor efficiency, maintenance efficiency, the schedule paradigm, and the bus system.
No tradeoffs
It is fortunate that the agenda of systemwide improvements does not exhibit significant tradeoffs in investment. Other parts of the transit agenda do not need to suffer to implement those improvements. On the contrary, they tend to interact positively: accessibility and PSDs can be combined (and federal law is written in such a way that PSDs void the grandfather clause permitting the subway to keep most of its stations inaccessible), faster and more reliable trains can be run more frequently off-peak, better service means higher ridership and therefore higher demand for extensions. Only the issue of labor exhibits a clear set of losers from the changes, and those can be compensated in a one-time deal.
Moreover, the budget for such an agenda is reasonable, if New York can keep its construction costs under control. At the per-elevator costs of Berlin or Madrid, New York could make its entire network wheelchair-accessible for around $3.5-4 billion. Parisian PSDs, pro-rated to the greater size of New York trains, would be around $10 million a station, or $5 billion systemwide. Full automation at German costs would be maybe $6 billion with triple- and quad-track lines pro-rated. The entire slate of changes required for full deinterlining, including a pocket track for the 3 train at 135th Street, a rebuild of the 36th Street station in Queens, and a connection between Queensboro Plaza and Queens Plaza, should be measured in the hundreds of millions, not billions.
The overall program still goes into double-digit billions; it requires a big push. But this big push is worth two to three years’ worth of current New York City Transit capital spending. A New York that can do this can also add 50-100 km to its subway network and vice versa, all while holding down operating costs to typical first-world levels. For the most part, the planners already know what needs to be done; the hard part is getting construction costs to reasonable levels so that they can do it on the current budget.
Why We Adjust Costs for PPP
The Transit Costs Project adjusts all construction costs for purchasing power parities. This means that, for example, a Chinese subway is converted into dollars not at the exchange rate of $1 = 6.7¥, but at the PPP rate of $1 = 4.2¥; this means that present-day Chinese subways look 1.5 times more expensive in our analysis than in analyses that use exchange rate values, and projects from 10 years ago look twice as expensive. I believe our choice is correct, and would like to explain why, since it has gotten some criticism from serious people, who’s prefer exchange rates.
Local costs
I started this comparing mature developed countries. The US and Europe have largely separate markets for construction, and so American work is almost entirely done in dollars and European work in euros (or pounds, or kronor, etc.). Japan is likewise very local and so is China. In that case, local costs matter far more than international ones.
But what’s interesting is that even in countries that use imported technology and international consultants and contractors and have low wages, costs are almost entirely local. I wrote about this last year, referencing an article out of India about the small cost impact of indigenization and an interview I made with a Philippine planner who told me 90% of the value of civil works is local. Rolling stock is internationally traded, but we exclude it from our cost estimates whenever possible.
The impact of currency changes
Using PPPs, if a country undergoes a bout of inflation, this should be reflected in changes in construction costs. This is intentional. The example given to me in the critique linked in the lede is that if Bangladeshi food prices rise, then this makes the PPP exchange rate look less favorable (a taka in Bangladesh can then buy less relative to a dollar in the US). But that’s fine – if Bangladeshi food prices rise then this forces Dhaka to pay higher wages to MRT construction workers, so overall it’s just domestic inflation. It’s no different from how, today, we’re seeing nominal construction cost growth in the United States and Europe because of high inflation.
At least the inflation today is moderate by any developing-country standard. Core inflation in the United States is 6%; in Germany it’s 3%. This may introduce third-order errors into the database as we deflate costs to the midpoint of construction. In contrast, 50-60% annual inflation is sustained over years in some middle-income countries like Iran, and then the choice of year for prices has significant impact, to the point that Iranian costs have a significant error bar. But that’s regardless of whether one adjusts for PPP or not, since usually inflation leads to deteriorating terms of trade.
In contrast, if prices are compared in exchange rate terms, then international fluctuations create fictitious changes in construction costs. When China permitted the renminbi to appreciate in the mid-2000s, this would have looked like an increase in costs of about 20% – but the costs of local inputs did not change, so in reality there was no increase in costs. The euro:dollar rate peaked around 1€ = $1.58 in 2008, before tumbling to 1€ = $1.28 in the financial crisis – but nothing material happened that would reduce European construction costs by 19% relative to American ones; right now it’s trading at 1€ = $1.05, but this again does not mean that construction in Europe is suddenly a third cheaper compared with in the US relative to 15 years ago.
Unusual currency values
Some patterns are systemic – richer countries have stronger currencies relative to PPP value than poor countries. But others are not, and it’s important to control for them. A currency can be weak due to the risk of war or disaster; the Taiwanese dollar is unusually weak for how rich Taiwan is, and this should not mean that Taiwanese construction costs are half what they really are. Or it can be strong or weak based on long-term investment proposition: investors will bid up the value of a currency in a country they expect to profit in in the long term, perhaps due to population growth coming from high birthrates or immigration, and this does not mean that today, it builds infrastructure more expensively.
In any of those cases, the unusual value of the currency really reflects capital availability. Capital for investment in Australia is plentiful, but this by itself does not raise its construction costs; capital for investment in Taiwan is scarce, but this certainly does not make it a cheap place to build infrastructure.
Foreign-denominated construction
In some peripheral countries with unstable currencies, costs are quoted in foreign currency – dollars or euros. Some Turkish contracts are so quoted, and this is also common in Latin America and sometimes Southeast Asia. But ultimately, the vast majority of the contract’s value is paid out in the local currency, not just labor but also locally-made materials like concrete. This creates a weird-looking statistical artifact in which we convert dollars or euros to local currency in exchange rate terms and then back in PPP terms.
This, we do because the quotation of the contract (in dollars or euros) is not the real value. Rather, it comes out of one of two artifacts. The first is data reporting: we rely on international trade media, and those often quote prices in exchange rate dollars or euros, even if the contract is in local currency (and in all cases where we’ve seen both, they match in exchange rate value).
The second is that an international consultancy may demand actual payment in foreign currency as a hedge against currency depreciation; in that case its rate of profit should be dollar- or euro-denominated. However, this again is a small minority of overall contract value. Moreover, if a country’s institutions can’t produce enough capital stability to do business in their own currency, it’s a problem that should be reflected in global indices; ultimately, if costs are higher in PPP terms as a result, this means that the country really does have greater problem affording infrastructure.
A posteriori justification
The above reasoning is all a priori. When I started comparing costs in the early 2010s, I was comparing developed countries and the euro:dollar rate was in flux in the early financial crisis, so I just went with one long-term PPP rate.
However, a posteriori, there is another positive feature of PPP adjustment: it levels the differences in construction costs by income. There is positive correlation between metro cost per km and the GDP per capita of the country the metro is built in, about 0.22, but it comes entirely out of the fact that poorer countries (especially India) build more elevated and fewer subway lines; correcting for this factor, the correlation vanishes. This is as it should be: PPP is a way of averaging out costs in different countries, first because it levels short-term fluctuations such as between different developed countries, and second because exchange rate value is dominated by internationally tradable goods, which are relatively more expensive in poor countries than non-tradable goods like food and housing.
What this says is that infrastructure should be viewed as an average-tradable good, at least a posteriori: its variation in costs across the world is such that there is no correlation with GDP per capita, whereas food prices display positive correlation even after PPP adjustment, and tradables like smartphones display negative correlation (because they cost largely the same in exchange rate terms).
Tails on Commuter Rail
An interesting discussion on Twitter came out of an alternatives analysis for Philadelphia commuter rail improvements. I don’t want to discuss the issue at hand for now (namely, forced transfers), but the discussion of Philadelphia leads to a broader question about tails. Commuter rail systems sometimes have low-frequency tails with through-service to the core system and sometimes don’t, and it’s useful to understand both approaches.
What is a tail?
For the purposes of this post, a tail is whenever there is a frequent line with trains infrequently continuing farther out. Frequency here is relative, so a subway line running every 2.5 minutes to a destination with every fourth train continuing onward is a tail even though the tail still has 10-minute frequency, and a commuter line running every 20 minutes with every third train continuing onward also has a tail, even though in the latter case the core frequency is lower than the tail frequency in the former case.
The key here is that the line serves two markets, one high-intensity and frequent and one lower-intensity warranting less service, with the outer travel market running through to the inner one. Usually the implication is that the inner segment can survive on its own and the contribution of the outer segment to ridership is not significant by itself. In contrast, it’s common enough on S-Bahn systems to have a very frequent trunk (as in Berlin, or Munich, or Paris) that fundamentally depends on through-service from many suburban segments farther out combining to support high frequency in the core; if ridership farther out is significant enough that without it frequency in the core would suffer, I would not call this a tail.
When are tails useful?
Tails are useful whenever there is a core line that happens to be along the same route as a lower-intensity suburban line. In that case, the suburban line behind can benefit from the strong service in the core by having direct through-service to it at a frequency that’s probably higher than it could support by itself. This is especially valuable as the ridership of the tail grows in proportion to that of the core segment – in the limiting case, it’s not even a tail, just outer branches that combine to support strong core frequency.
Tokyo makes extensive use of tails. The JR East commuter lines all have putative natural ends within the urban area. For example, most Chuo Rapid Line trains turn at Takao, at the western end of the built-up area of Tokyo – but some continue onward to the west, running as regional trains to Otsuki or as interregional or as intercity trains farther west to Shiojiri.
Munich and Zurich both use tails as well on their S-Bahns. In Munich, the base frequency of each of the seven main services is every 20 minutes, but some have tails running hourly, and all have tails running two trains per hour with awkward alternation of 20- and 40-minute gaps. In Zurich, the system is more complex, and some lines have tails (for example, S4) and some do not (for example, S3); S4 is not a portion of an intercity line the way the Chuo Line is, and yet its terminus only gets hourly trains, while most of the line gets a train every 20 minutes.
What are the drawbacks of tails?
A tail is a commitment to running similar service as in the core, just at lower frequency. In Philadelphia, the proposal to avoid tails and instead force what would be tails into off-peak shuttle trains with timed transfers to the core system is bundled into separate brands for inner and outer service and a desire to keep the outer stations underbuilt, without accessibility or high platforms. Branding is an exercise in futility in this context, but there are, in other places than Philadelphia, legitimate reasons to avoid tails, as in Paris and Berlin:
- Different construction standards – perhaps the core is electrified and an outer segment is not; historically, this was the reason Philadelphia ended commuter rail service past the limit of electrification, becoming the only all-electrified American commuter rail network. In Berlin, the electrification standards on the mainline and on the S-Bahn differ as the S-Bahn was electrified decades earlier and is run as an almost entirely self-contained system.
- Train size difference – sometimes the gap in demand is such that the tail needs not just lower frequency than the core but also shorter trains. In the United States, Trenton is a good example of this – New York-Trenton is a much higher-demand line than Trenton-Philadelphia and runs longer trains, which is one reason commuter trains do not run through.
- Extra tracks – if there are express tracks on the core segment, then it may be desirable to run a tail express, if it is part of an intercity line like the Chuo Line rather than an isolated regional line like S4 in Zurich, and not have it interface with the core commuter line at all to avoid timetabling complications. If there are no extra tracks, then the tail would have to terminate at the connection point with the core line, as is proposed in Philadelphia, and the forced transfer is a drawback that generally justifies running the tail.
Do the drawbacks justify curtailment?
Not really. On two-track lines, it’s useful to provide service into city center from the entire line, just maybe not at high frequency on outer segments. This can create situations in which intercity-scale lines run as commuter rail lines that keep going farther than typical, and this is fine – the JR East lines do this on their rapid track pairs and within the built-up area of Tokyo people use those longer-range trains in the same way they would an ordinary rapid commuter train.
This is especially important to understand in the United States, which is poor in four-track approaches of the kind that the largest European cities have. I think both Paris and Berlin should be incorporating their regional lines into the core RER and S-Bahn as tails, but they make it work without this by running those trains on dedicated tracks shared with intercity service but not commuter rail. Boston, New York, and Philadelphia do not have this ability, because they lack the ability to segregate S-Bahn and RegionalBahn services. This means Boston should be running trains to Cape Cod, Manchester, and Springfield as tails of the core system, and New York should electrify its entire system and run trains to the Hamptons as LIRR tails, and Philadelphia should run tail trains to the entire reach of its commuter rail system.
Trains are not Planes
Trains and planes are both scheduled modes of intercity travel running large vehicles. Virgin runs both kinds of services, and this leads some systems to treat trains as if they are planes. France and Spain are at the forefront of trying to imitate low-cost airlines, with separately branded trains for different classes of passengers and yield management systems for pricing; France is even sending the low-cost OuiGo brand to peripheral train stations rather than the traditional Parisian terminals. This has not worked well, and unfortunately the growing belief throughout Europe is that airline-style competition on tracks is an example of private-sector innovation to be nourished. I’d like to explain why this has failed, in the context of trains not being planes.
How do trains and planes differ?
All of the following features of trains and planes are relevant to service planning:
| Trains | Planes |
| Stations are located in city center and are extremely inconvenient to move | Airports can be located in a wider variety of areas in the metro area, never in the center |
| Timetables can be accurate to the minute | Timetables are plus or minus an hour |
| Linear infrastructure | Airport infrastructure |
| High upfront costs, low variable costs | High upfront costs but also brutal variable costs in fuel |
| Door-to-door trip times in the 1.5-5 hour range | Door-to-door trip times starting around 3 hours counting security and other queues |
| In a pinch, passengers can stand | Standing is never safe |
| Interface with thousands of local train stations | All interface with local transport is across a strict landside/airside divide |
| Travel along a line, so there’s seat turnover at intermediate stops | Point-to-point travel – multi-city hops on one plane are rare because of takeoff and landing costs |
Taken together, these features lead to differences in planning and pricing. Plane and train seats are perishable – once the vehicle leaves, an unsold seat is dead revenue and cannot be packaged for later. But trains have low enough variable costs that they do not need 100% seat occupancy to turn a profit – the increase in cost from running bigger trains is small enough that it is justified on other grounds. Conversely, trains can be precisely scheduled so as to provide timed connections, whereas planes cannot. This means the loci of innovation are different for these two technologies, and not always compatible.
What are the main innovations of LCCs?
European low-cost carriers reduce cost per seat-km to around 0.05€ (source: the Spinetta report). They do so using a variety of strategies:
- Using peripheral, low-amenity airports located farther from the city, for lower landing fees (and often local subsidies).
- Eliminating such on-board services as free meals.
- Using crew for multiple purposes, as both boarding agents and air crew.
- Flying for longer hours, including early in the morning and later at night, to increase equipment utilization, charging lower fares at undesirable times.
- Running a single class of airplane (either all 737 or all 320) to simplify maintenance.
They additionally extract revenue from passengers through hidden fees only revealed at the last moment of purchase, aggressive marketing of on-board sales for ancillary revenue, and an opaque yield management system. But these are not cost cutting, just deceptive marketing – and the yield management system is in turn a legacy carrier response to the threat of competition from LCCs, which offer simpler one-way fares.
How are LCC innovations relevant to trains?
On many of the LCC vs. legacy carrier distinctions, daytime intercity trains have always been like LCCs. Trains sell meals at on-board cafes rather than providing complimentary food and drinks; high-speed rail carriers aim at fleet uniformity as much as practical, using scale to reduce unit maintenance costs; trains have high utilization rates using their low variable operating costs.
On others, it’s not even possible to implement the LCC feature on a railroad. SNCF is trying to make peripheral stations work on some OuiGo services, sending trains from Lyon and Marseille to Marne-la-Vallée and reserving Gare de Lyon for the premium-branded InOui trains. It doesn’t work: the introduction of OuiGo led to a fall in revenue but no increase in ridership, which on the eve of corona was barely higher than on the eve of the financial crisis despite the opening of three new lines. The extra access and egress times at Marne-la-Vallée and the inconvenience imposed by the extra transfer with long lines at the ticketing machines for passengers arriving in Paris are high enough compared with the base trip time so as to frustrate ridership. This is not the same as with air travel, whose origins are often fairly diffuse because people closer to city center can more easily take trains.
What innovations does intercity rail use?
Good intercity train operating paradigms, which exist in East Asia and Northern Europe but not France or Southern Europe, are based on treating trains as trains and not as planes (East Asia treats them more like subways, Northern Europe more like regional trains). This leads to the following innovations:
- Integration of timetable and infrastructure planning, taking advantage of the fact that the infrastructure is built by the state and the operations are either by the state or by a company that is so tightly linked it might as well be the state (such as the Shinkansen operators). Northern European planning is based on repeating hourly or two-hourly clockface timetables.
- Timed connections and overtakes, taking advantage of precise timetabling.
- Very fast turnaround times, measured in minutes; Germany turns trains at terminal stations in 3-4 minutes when they go onward, such as from north of Frankfurt or Leipzig to south of them with a reversal of the train direction, and Japan turns trains at the end of the line in 12 minutes when it needs to.
- Short dwell times at intermediate stops – Shinkansen trains have 1-minute dwell times when they’re not sitting still at a local station waiting to be overtaken by an express train.
- A knot system in which trips are sped up so as to fit into neat slots with multiway timed connections at major stations – in Switzerland, trains arrive at Zurich, Basel, and Bern just before the hour every half hour and depart just after.
- Fare systems that reinforce spontaneous trips, with relatively simple fares such that passengers don’t need to plan trips weeks in advance. East Asia does no yield management whatsoever; Germany does it but only mildly.
All of these innovations require public planning and integration of timetable, equipment, and infrastructure. These are also the exact opposite of the creeping privatization of railways in Europe, born of a failed British ideological experiment and a French railway that was overtaken by airline executives bringing their own biases into the system. On a plane, my door-to-door time is so long that trips are never spontaneous, so there’s no need for a memorable takt or interchangeable itineraries; on a train, it’s the exact opposite.
How Comparisons are Judged
I’m about to complete the report for the Transit Costs Project about Sweden. For the most part, Sweden is a good comparison case: its construction costs for public transport are fairly low, as are those of the rest of Scandinavia, and the projects being built are sound. And yet, the Nordic countries and higher-cost countries in the rest of Northern Europe, that is Germany and the Netherlands, share a common prejudice against Southern Europe, which in the last decade or so has been the world leader in cost-effective infrastructure. (Turkey is very cheap as well but in many ways resembles Southern Europe, complete with having imported Italian expertise early on.)
This is not usually an overt prejudice. Only one person who I’ve talked to openly discounted the idea that Italy could be good at this, and they are not Nordic. But I’ve been reading a lot of material out of Nordic countries discussing future strategy, and it engages in extensive international comparisons but only within Northern Europe, including high-cost Britain, ignoring Southern Europe. The idea that Italians can be associated with good engineering is too alien to Northern Europeans.
The best way to illustrate it is with a toy model, about the concept of livable cities.
Livable cities
Consider the following list of the world’s most livable cities:
- Vienna
- Stockholm
- Auckland
- Zurich
- Amsterdam
- Melbourne
- Geneva
- Copenhagen
- Munich
- Vancouver
The list, to be clear, is completely made up. These are roughly the cities I would expect to see on such a list from half-remembering Monocle’s actual lists and some of the discourse that they generate: they should be Northern European cities or cities of the peripheral (non-US/UK) Anglosphere, and not too big (Berlin might raise eyebrows). These are the cities that urbanist discourse associates with livability.
The thing is, prejudices like “Northern Europe is just more livable” can tolerate a moderate level of heresy. If I made the above list, but put Taipei at a high place shifting all others down and bumping Vancouver, explaining this on grounds like Taipei’s housing affordability, strong mass transit system, and low corona rates (Taiwan spent most of the last two years as a corona fortress, though it’s cracked this month), it could be believed. In effect, Taipei’s status as a hidden gem could be legitimized by its inclusion on a list alongside expected candidates like Vienna and Stockholm.
But if instead the list opened with Taipei, Kaohsiung, Taichung, and Tainan, it would raise eyebrows. This isn’t even because of any real criteria, though they exist (Taiwan’s secondary cities are motorcycle- and auto-oriented, with weak metro systems). It just makes the list too Taiwanese, which is not what one expects from such a list. Ditto if the secondary Taiwanese cities were bumped for other rich Asian cities like Singapore or Seoul; Singapore is firmly in the one-heresy status – it can make such a list if every other city on the list is as expected – but people have certain prejudices of how it operates and certain words they associate with it, some right and some laughably wrong, and “livable” is not among them.
The implication for infrastructure
A single number is more objective than a multi-factor concept like livability. In the case of infrastructure, this is cost per kilometer for subways, and it’s possible to establish that the lowest-cost places for this are Southern Europe (including Turkey), South Korea, and Switzerland. The Nordic countries used to be as cheap but with last decade’s cost overruns are somewhat more expensive to dig in, though still cheaper than anywhere else in the world; Latin America runs the gamut, but some parts of it, like Chile, are Sweden-cheap.
Per the one-heresy rule, the low costs of Spain are decently acknowledged. Bent Flyvbjerg even summarized the planning style of Madrid as an exemplar of low costs recently – and he normally studies cost overruns and planning failures, not recipes for success. But it goes deeper than just this, in a number of ways.
- While Madrid most likely has the world’s lowest urban subway costs, the rest of Southern Europe achieves comparable results and so does South Korea. So it’s important to look at shared features of those places and learn, rather than just treat Spain as an odd case out while sticking with Northern European paradigms.
- Like Italy, Spain has not undergone the creeping privatization of state planning so typical in the UK and, through British soft power, other parts of Northern Europe. Design is done by in-house engineers; there’s extensive public-sector innovation, rather than an attempt to activate private-sector innovation in construction.
- Southern European planning isn’t just cheap, but also good. Metro Milano says that M5 carries 176,000 passengers per day, for a cost of 1.35b€ across both phases; in today’s money it’s around $13,000 per rider, which is fairly low and within the Nordic range. Italian driverless metros push the envelope on throughput measured in peak trains per hour, and should be considered at the frontier of the technology alongside Paris. Milan, Barcelona, and Madrid have all been fairly good at installing barrier-free access to stations, roughly on a par with Berlin; Madrid is planning to go 100% accessible by 2028.
- As a corollary of point #3, there are substantial similarities between Southern and Northern Europe. In particular, both were ravaged by austerity after the financial crisis; Northern Europe quickly recovered economically, but in both, infrastructure investment is lagging. In general, if you keep finding $10,000/rider and $15,000/rider subways to build, you should be spending more money on more subway lines. Turkey is the odd one out in that it builds aggressively, but on other infrastructure matters it should be viewed as part of the European umbrella.
- Italian corruption levels in infrastructure are very low, and from a greater distance this also appears true of Spain. Italy’s governance problems are elsewhere – the institutional problems with tax avoidance drag down the private sector, which has too many family-scale businesses that can’t grow and too few large corporations, and not the public sector.
I’m not going to make a list of the cities with the best urban rail networks in the world, even in jest; people might take this list as authoritative in ways they wouldn’t take a list I made up about livability. But in the same way that there are prejudices that militate in favor of associating livability with Northern Europe and the peripheral Anglosphere, there are prejudices that militate in favor of associating good public transport with Northern and Central Europe and the megacities of rich Asia. All of those places indeed have excellent public transportation, but this is equally true of the largest Southern European cities; Istanbul is lagging but it’s implementing two large metro networks, one for Europe and one for Asia, and already has Marmaray connecting them under the Bosporus.
And what’s more, just as Southern Europe has things to learn from Northern Europe, Northern Europe has things to learn from the South. But it doesn’t come naturally to Germans or Nordics. It’s expected that every list of the best places in Europe on every metric should show a north-south gradient, with France anywhere in between. If something shows the opposite, it must in this schema be unimportant, or even fraudulent. Northerners know that Southerners are lazy and corrupt – when they vacation in Alicante they don’t see anyone work outside the hospitality industry, so they come away with the conclusion that there is no high-skill professional work in the entire country.
But at a time when Germany is building necessary green infrastructure at glacial rates and France and Scandinavia have seen real costs go up maybe 50% in 20 years, it’s necessary to look beyond the prejudice. Madrid, Barcelona, Rome, Milan, Istanbul, Lisbon, and most likely also Athens have to be treated as part of the European core when it comes to urban rail infrastructure, with as much to teach Stockholm as the reverse and more to teach Berlin than the reverse.
Consolidating Stops with Irregular Spacing
There was an interesting discussion on Twitter a few hours ago about stop consolidation on the subway in New York. Hayden Clarkin, the founder of TransitCon, brings up the example of 21st Street on the G in Long Island City. The stop is lightly-used and very close to Court Square, which ordinarily makes it a good candidate for removal, a practice that has been done a handful of times in the city’s past. However, the spacing is irregular and in context this makes the stop’s removal a lower-value proposition; in all likelihood there should not be any change and trains should keep calling at the station as they do today.
What is 21st Street?
The G train, connecting Downtown Brooklyn with Long Island City directly, makes two stops in Queens today: Court Square, at the southern end of the Long Island City business district, and 21st Street, which lies farther south. Here is a map of the area:
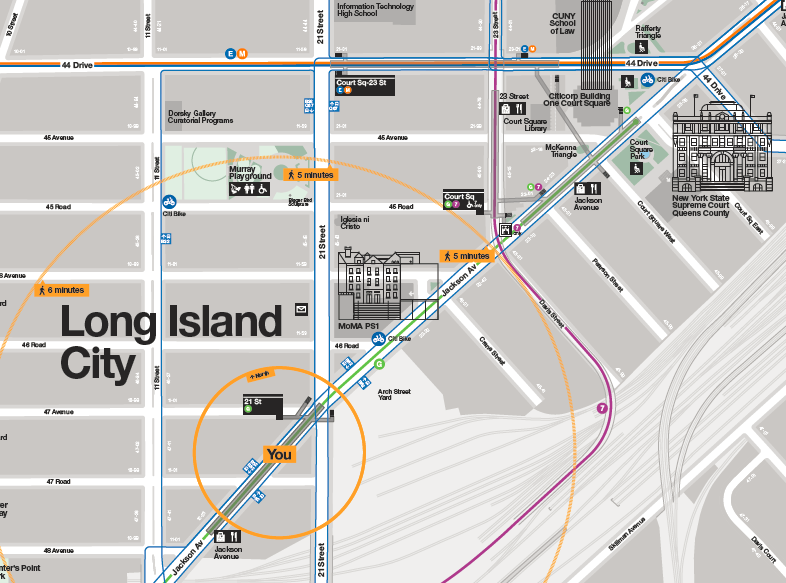
At closest approach, the platforms of 21st are 300 meters away from those of Court Square on the G; taking train length into account, this is around 400 meters (the G runs short trains occupying only half the platform). Moreover, Court Square is a more in-demand area than 21st Street: Long Island City by now near-ties Downtown Brooklyn as the largest job center in the region outside Manhattan, and employment clusters around Queens Plaza, which used to be one stop farther north on the G before the G was curtailed to Court Square in order to make more room for Manhattan-bound trains at Queens Plaza. Court Square is still close to jobs, but 21st Street is 400 meters farther away from them, with little on its side of the neighborhood.
Stop spacing optimization
Subways cannot continuously optimize their stop spacing the way buses can. Building a new bus stop costs a few thousand dollars, or a few ten thousand if you’re profligate. Building a new subway stop costs tens of millions, or a few hundred million if you’re profligate. This means that the question of subway stop optimization can only truly be dealt with during the original construction of a line. Subsequently, it may be prudent to build a new stop but only at great expense and usually only in special circumstances (for example, in the 1950s New York built an infill express station on the 4 and 5 trains at 59th, previously a local-only station, to transfer with the N, R, and W). But deleting a stop is free; New York has done it a few times, such as at 18th Street on the 6 trains or 91st on the 1. Is it advisable in the case of 21st?
The answer has to start with the formula for stop spacing. Here is my earliest post about it, in the context of bus stops. The formula is,

The factor of 4 in the formula depends on circumstances. If travel is purely isotropic along the line, then the optimum is at its minimum and the factor is 2. The less isotropic travel is, the higher the factor; the number 4 is when origins are purely isotropic, which reflects residential density in this part of New York, but destinations are purely anisotropic and can all be guaranteed to be at distinguished nodes, like business centers and transfer points. Because 21st Street is a residential area and Court Square is a commercial area and a transfer point, the factor of 4 is justified here.
Walk speed is around 1.33 m/s, the walk penalty is typically 2, the stop penalty on the subway is around 45 seconds, and the average unlinked trip on the subway is 6.21 km; the formula spits out an optimum of 863 m, which means that a stop that’s 400 meters from nearby stops should definitely be removed.
But there’s a snag.
The effect of irregular stop spacing
When the optimal interstation is 863 meters, the rationale for removing a stop that’s located 400 meters from adjacent stations is that the negative impact of removal is limited. Passengers at the stop to be removed have to walk 400 meters extra, and passengers halfway between the stop and either of the adjacent stops have no more walking to do because they can just walk to the other stop; the average extra walk is then 200 meters. The formula is based on minimizing overall travel time (with a walk penalty) assuming that removing a stop located x meters from adjacent stops incurs an extra walk of x/2 meters on average near the station. Moreover, only half of the population lives near deleted stops, so the average of x/2 meters is only across half the line.
However, this works only when stop spacing is regular. If the stop to be removed is 400 meters from an adjacent stop, but much farther from the adjacent stop on the other side, then the formula stops applying. In the case of 21st Street, the next stop to the south, Greenpoint Avenue, is 1.8 km away in Brooklyn, across an unwalkable bridge. Removing this stop does not increase the average walk by 200 meters but by almost 400, because anywhere from 21st south in Long Island City the extra walk is 400. Moreover, because this is the entire southern rim of Long Island City, this is more than just half the line in this area.
In the irregular case, we need to halve the factor in the formula, in this case from 4 to 2 (or from 2 to 1 if travel is isotropic). Then the optimum falls to 610; this already takes into account that 21st Street is a weaker-demand area than Court Square, or else the factor in the formula would drop by another factor of 2. At 610 meters, the impact of removing a stop 400 meters from an adjacent stop is not clearly positive. In the long run, it is likely counterproductive, since Long Island City is a growth area and demand is likely to grow in the future.
Does this generalize?
Yes!
In New York, this situation occurs at borough boundaries, and also at the state boundary if more service runs between the city and New Jersey. For example, in retrospect, it would have been better for the east-west subway lines in Manhattan to make a stop at 1st or 2nd Avenue, only 300-500 meters from the typical easternmost stop of Lexington. The L train does this, and if anything does not go far enough – there’s demand for opening a new entrance to the 1st Avenue stop (which is one of the busiest on the line) at Avenue A, and some demand for a likely-infeasible infill stop at Avenue C. These are all high-density areas, but they’re residential – most people from Queens are not going to 2nd Avenue but to Lex and points west, and yet, 2nd would shorten the walk for a large group of residential riders by around 400 meters, justifying its retrospective inclusion.
Quick Note: Learning from the Past and the Present
There are two tendencies among Americans in the rail industry that, taken together, don’t really mesh. The first is to ignore knowledge produced outside North America, especially if it’s also outside the Anglosphere, on the grounds that the situations are too different and cannot be compared. The second is to dwell on the past and talk about how things could have been different and, therefore, to spend a lot of time looking at old proposals as a guideline.
The problem with this is that the past is a foreign country. They do things differently there. The world of the imagined past of modern-day Western romantics, usually placed in the 1950s or early 60s, is barely recognizable, economically or politically; Mad Men hits watchers on the head in its early seasons with how alien it is. The United States was an apartheid state until around 1964; France only decolonized Algeria in 1962; Germany had a deep state until the Spiegel affair of 1962 started to dismantle it and wouldn’t truly apologize for its WW2 crimes until the Kniefall and the fallout therefrom.
So as a public service, let’s look at some economic indicators comparing the US to the three low-construction cost countries that the Transit Costs Project is doing case studies about:
| Indicator | USA 2019 | Sweden 2019 | Italy 2019 | Turkey 2019 | USA 1960 |
| GDP per capita (2017 PPPs) | 62,631 | 52,851 | 42,708 | 28,197 | 19,444 |
| Female labor force participation, 15+ | 56.6% | 61.2% | 41.3% | 34.5% | 37.7% |
| Life expectancy at birth | 79 | 83 | 83 | 78 | 70 |
| Total fertility rate | 1.7 | 1.7 | 1.3 | 2.1 | 3.7 |
| Industry, % of jobs | 20 | 18 | 26 | 25 | 32 |
| Agriculture, % of jobs | 1.4 | 1.7 | 4 | 18 | 6 |
The US is comparable to Sweden on net – the higher GDP per capita is mostly an artifact of shorter vacation times. It is a considerably more developed country than Italy, by most accounts (except health care, where the US is more or less the worst in the developed world). Italy is a more developed country than Turkey. And Turkey, today, is considerably more developed than the US was in the imagined postwar golden age, even if it’s urbanizing later. The one indicator where they look similar, female LFP, masks the fact that the gender gap for employed women today isn’t especially high in Turkey and that, after a fall in female LFP in the late 20th century, today working outside the home is more middle-class, whereas in early postwar America it was considered a marker of poverty for a married woman to work.
So in that supposed golden age of an America before the Interstates, or when the Interstates were still in their infancy, GDP per capita was about comparable to Mexico today (and underinvestment in public transportation was comparable too; the Mexico City Metro’s expansion ground to a halt after AMLO was elected mayor). Women were only starting to emerge from the More Work for Mother era. Black people were subjected to literal apartheid. 65 was an old age to retire at (the majority of the increase in life expectancy at birth has occurred since age age 65 – it wasn’t mostly about declining child mortality).
Deindustrialization was nowhere on the horizon in 1960, which is a cause for celebration by people today who view industry as more moral than services. But the industrial jobs that are romanticized today were held by the era’s traditionalists to be morally inferior to the rapidly depleting farm jobs, and did not pay well until generations of wage increases brought about by unions. And Sweden, Italy, and Turkey are all deindustrializing rapidly; China today has a slightly lower manufacturing job share than the US had at its postwar peak, and elsewhere in the world than East Asia, there’s a serious issue of premature deindustrialization.
What about the law? Well, in 1960 the US had the same constitution as today, in theory, but the interpretative theories were completely different. The vast majority of the American constitution is unwritten (the word “filibuster” does not appear there) and there are vast differences in practice today and in the 1950s, when, again, members of the largest minority group risked being lynched if they tried voting in the states the majority of them lived. The party system at the time was extraordinarily loose; Julia Azari speaks of strong partisanship and weak parties today, but by postwar standards, both American parties are characterized by ideological uniformity and congressional command-and-control systems, even if the distribution of power within the parties is dramatically different from the European norm. Turkey might be comparable to postwar America – it’s hard to exactly say, since the two entities’ democratic systems are flawed in completely different ways. Italy and Sweden are not.
So the only thing that’s left is the romanticism. It’s the belief of 21st-century Americans that they could have ridden trains out of the old Penn Station, and worked in any of the prestige industries at the time, and done things differently. The constitution of the US today, its politics, its society, and its economy have little to do with their counterparts of 60+ years ago, but it’s useful for a lot of people to pretend that there’s continuity. It feels more stable this way. It just happens to be dangerously incorrect. Burn the past and look at the present.
The Solution to Failed Process isn’t More Process
The US Department of Transportation has an equity action plan, and it’s not good. It suffers from the same fundamental problem of American governance, especially at the federal level: everything is about process, nothing is about visible outcomes for the people who use public services. If anything, visible change is constantly deprecated, and direct interference in that direction is Not What We Do. Everything is a nudge, everything has to be invisible. When the state does act, it must do so in the direction of ever more layers of red tape, which at this point are for their own sake.
Case in point: a 12-page PDF with many graphics and charts manages to fit in two giant red flags, both with serious implications for how USDOT views its mission. They showcase a state that exists to obstruct and delay and shrugs off social and developmental goals alike. The action plan should be dismissed and replaced with an approach that aims to dissolve anti-developmental institutions and favor action over talk.
Contractors, or users?
Most of the document does not concern itself with how to be more equitable for the users of public transportation in the United States. It doesn’t talk about racial differences in commuting patterns – it says poor people spend more of their income on transportation (as is the case for other basic staples) but ignores the issue where 61% of American public transport commuters are racial or ethnic minorities in a country that’s 62% white.
What it does talk about is the needs of contractors. The US has special programs for disadvantaged business enterprises (DBEs). In contracting, this is called MWBE in New York – minority- and women-owned business enterprise. New York requires 20% of contract value to go to MWBE, and since construction is an oligopoly owned entirely by white men and there is no interest in breaking said oligopoly, everything goes through a web of subcontractors to satisfice the law while driving up costs for the end users; one source at the MTA quotes a 20% premium to me just from the subcontracting web caused by this and other special restrictions.
In anti-left American media, the black slumlord who complaints that it is racist to levy fines on him for violating building codes is somehow a sympathetic figure, in preference to the people with the misfortune of living in one of his 100 apartments. Similarly, when Americans speak about income mobility in their country, they center the origin stories of billionaires, most of whom grew up comfortably upper middle-class, rather than whether a working poor person has much hope to ascend to the middle class.
It’s the same with the focus on MWBE. MWBE are not socially relevant. There is no social or developmental purpose in creating a class of business owners shielded from competition – in this case, federal contractors – and then trying to diversify it. Most people are not business owners; most people work for someone else and to get to work they need to commute, and for women and minorities, this is disproportionately likely to be public transport. The path forward is a federal repeal of all MWBE laws and their replacement with preemption forbidding states to enact similar laws. Federal power should dissolve failed local arrangements, free from the need to kowtow to local power brokers who have limited power beyond the local level and none at the federal level.
Process for the sake of process
Community meetings in the United States are a failure. The action plan recognizes this problem, and even begins to understand why:
* Public meetings are a common public involvement strategy, but can be inconvenient or impossible to attend for some. Physical meeting locations may be inaccessible for some, including those with disabilities. Virtual public meetings are inaccessible for people without internet access or computer literacy.
* Various methods may be needed to allow people with diverse circumstances to have a voice in decisions that affect their community. Adaptive engagement strategies can be a resource-intensive but valuable endeavor that is responsive to specific community needs, including different language and cultural backgrounds.
Unfortunately, the solution wants to accrete more process for its own sake. There is no positive use for a community meeting; the defenders of the process in multiple American cities, when I challenged them on this point, could not name to me a single useful thing that came out of them. But the negatives are numerous, and not fixable through multilingual meetings:
- The times at which meetings are held tend to privilege people who can take time off during work hours – the same class of already overprivileged business owners, comfortable housewives, and retirees, to the exclusion of people who work for someone else.
- Community as a concept is exclusive; in Cultural Theory terms, egalitarian systems tend toward strong boundedness and this is inherently exclusive in ways that market- and state-based systems lack. Outsiders who attempt to attend community meetings report being verbally harassed for not looking like the typical attendee, for example if they are much younger.
- Community meeting dynamics favor loudness and adversarial agitation. Social media has the same problem, with a growing body of published work about the effect of online harassment on people, disproportionately people from disadvantaged background. Yelling is believed to get results, and the idea that the state should punish it to let other voices than that of the biggest blowhard be heard is treated as so ridiculous that in popular culture it’s put in the mouth of a junta member.
- Local community is not relevant to how most people live in metropolitan areas. In New York, only 8% of workers work in the same community board that they live in (and even same-borough commutes are only 39%); the other 92% and their dependents socialize in citywide networks rather than locally. And yet, community boards, representing those 8% with local ties, are taken as closest to the people.
- People with limited English proficiency need not just government services in the relevant language but also relevant information. For example, Chinese immigrants receive information out of Chinese networks, which are not especially local to one specific Chinatown, but are often pan-Chinese or pan-Chinese-American. With much thinner sourcing than is available in English, they can form opinions about the issues most in the news, which tend to be national, but not about local issues. This is something every intra-European immigrant gets very quickly – it’s easier to find someone who speaks the same language with opinions about Annalena Baerbock than someone who speaks the same language with opinions about Bettina Jarasch, let alone any borough-scale politician (I do not remember a single conversation within queer Berlin spaces about borough-scale politicians).
- Local knowledge, to the extent it even exists, is not important, but the community meeting foregrounds it. Long-timers insist on talking about the history of every parklet and mural and shop and not about jobs or rents or public services; the community meetings elevates their concerns above memorizing sports statistics or similar trivialities.
The community meeting as a source of knowledge for the state to use or as a source of informal or formal power is a social stain wherever it is tried, and the impacts disproportionately fall on women, the young, minorities, queers, and immigrants. And yet an equity action plan that understands at least some of the problems created by the process cannot bring itself to recommend its abolition in favor of top-down state action, informed by the academic research of ethnographers to create universal design standards. No: it is recommending even more process. Process cannot fail; it can only be failed. Fair outcomes are out; endless red tape with all talk and no action is in.
