Category: Transportation
How Deinterlining Can Improve New York City Transit
New York is unique among the major subways of the world in the extent of interlining its network has. All routes share tracks with other routes for part of the way, except the 1, 6, 7, and L. The advantage of this system is that it permits more one-seat rides. But the disadvantages are numerous, starting with the fact that delays on one line can propagate to nearly the entire system, and the fragile timetables lead to slower trains and lower capacity. New NYCT chief Andy Byford just released a plan calling for investment in capacity, called Fast Forward, focusing on accessibility and improved signaling, but also mentioning reducing interlining as a possibility to increase throughput.
I covered the interlining issue more generally in my article about reverse branching, but now I want to explain exactly what it means, having learned more about this issue in London as well as about the specifics of how it applies to New York. In short, New York needs to reduce the extent of reverse branching as much as possible to increase train speed and capacity, and can expect serious gains in maximum throughput if it does so. It should ultimately have a subway map looking something like this:

Lessons from London
In London, there is extensive interlining on the Underground, but less so than in New York. The subsurface lines form a complex interconnected system, which also shares tracks with one branch of the Piccadilly line, but the Northern, Central, Victoria, Jubilee, and Waterloo and City lines form closed systems (and the Bakerloo line shares tracks with one Overground line). The Northern line reverse-branches: it has two central trunks, one through Bank and one through Charing Cross; one southern segment, with through-trains to both trunks; and two northern branches, each sending half its trains to each trunk. The other closed systems have just one trunk each, and as a result are easier to schedule and have higher capacity.
As the Underground moves to install the same high-capacity signaling on more and more lines, we can see what the outer limit of throughput is on each system. The Northern line’s new moving-block signaling permits 26 trains per hour on the Bank trunk and 22 on the Charing Cross trunk. When the Battersea extension opens, reverse branching on the south will end, pairing the older line to Morden with Bank and the new extension with Charing Cross, and capacity will rise to 32 tph per trunk. Planned improvements to transfer capacity at Camden Town, the northern branch point, will enable TfL to permanently pair each northern branch with one central trunk, raising capacity to 36 tph per trunk. Moreover, TfL expects moving block signaling to raise District line capacity from 24 tph to 32, keeping the current reverse branching. The Victoria line already runs 36 tph and the Jubilee line soon will too, while the Central line runs 35 tph. So 36 vs. 32 seems like the difference coming from the final elimination of reverse branching, while more extensive reverse branching reduces capacity further.
The reason complex branching reduces capacity is that, as delays propagate, the schedule needs to incorporate a greater margin of error to recover from unexpected incidents. It also slows down the trains, since the trains are frequently held at merge points. The general rule is that anything that increases precision increases capacity (such as automation and moving block signaling) and anything that reduces precision reduces capacity; reverse branching reduces timetable precision, because each train can be delayed by incidents on more than one line, making delays more common.
What deinterlining in New York entails
NYCT has its work cut out for it when it comes to deinterlining. There are eight different points in the system where reverse-branching occurs – that is, where lines that do not share track in Manhattan (or on the G trunk outside Manhattan) share tracks elsewhere.
- The 2 and 5 trains share tracks on the Nostrand Avenue Line.
- The 2 and 5 also share tracks in the Bronx.
- The A and C trains share tracks on the two-track narrows through Lower Manhattan and Downtown Brooklyn.
- The A and D share the express tracks on Central Park West while the B and C share the local tracks.
- The E and F share the express tracks on Queens Boulevard, while the M and R share the local tracks, the E and M share the tunnel from Queens to Manhattan, and the N, R, and W share a different tunnel from Queens to Manhattan.
- The B and Q share tracks in Brooklyn, as do the D and N.
- The F and G share tracks in South Brooklyn.
- The M shares the Williamsburg Bridge tracks with the J/Z but runs in Manhattan on the same tracks as the F.
NYCT should work to eliminate all of the above reverse branches. The easiest to start with is #6: the junction at DeKalb Avenue should be set to keep the B and D trains together and to keep the N and Q together rather than to mix them so that the B shifts to the Q tracks and the D to the N tracks. This requires no changes in physical infrastructure, and has especially high benefits as the junction delays trains by several minutes in each direction. Moreover, the loss of one-seat rides is minimal: the BDFM and NQRW run closely parallel in Manhattan and intersect with a transfer at Herald Square in addition to the inconveniently long BQ/DNR transfer at Atlantic Avenue.
Another relatively easy reverse branch to eliminate is #8, a recent introduction from the 2010 service cuts. Previously, today’s M route in Queens and Manhattan was covered by the V train, which turned on the Lower East Side, while the M ran the same route as the J/Z, merging onto the R and thence the N in Brooklyn at rush hour. Today’s route is thus an M-V merger, which railfans including myself hoped would help decongest the L by creating an alternative route from Williamsburg to Midtown. Unfortunately, such decongestion has not happened, perhaps because gentrification in Williamsburg clusters near the L and not near the J or M.
Harsh decisions
Fixing the reverse-branching at DeKalb Avenue and on the Williamsburg Bridge is painless. The other reverse branches require a combination of hard decisions and new infrastructure.
Fixing reverse branches #3 and #4 requires no capital investment, just political will. Reverse branch #4 is there because there’s demand for two routes’ worth of capacity in the tunnel from Brooklyn but there’s only one express line on Eighth Avenue, and that in turn is the result of reverse branch #3; thus these two issues should be tackled together.
NYCT should decide between having the A and C trains run express between 145th and 59th Streets and the B and D trains run local, or the other way around. This is not an easy decision: either Washington Heights or Grand Concourse would get consigned to local trains. North of 145th the total number of boardings is 102,000 at B/D stations compared with 79,000 on the A/C, but conversely Concourse riders can change to the express 4 trains whereas Washington Heights’ only alternative is the local 1. However the A and C run, express or local, the E should run the opposite in Manhattan – it can merge to either the local or express tracks – and the express trains should continue to Brooklyn. The map I made doesn’t distinguish local from express service, but my suspicion is that Washington Heights should get express trains, on account of its long commutes and lack of fast alternatives.
The same problem of harshness occurs in reverse-branch #5. In theory, it’s an easy fix: there are three track pairs in Queens (Astoria, Queens Boulevard local, Queens Boulevard express) feeding three tunnels to Manhattan (63rd, 60th, and 53rd Streets). In practice, the three Manhattan trunks have astonishingly poor transfers between them in Midtown. Nonetheless, if it does nothing else, NYCT should remove the R from Queens Boulevard and route all 60th Street Tunnel trains to Astoria; together with fixing DeKalb Avenue, this would separate the lettered lines into two closed systems, inherited from the BMT and IND.
However, undoing the connection between the BMT and the IND probably requires constructing a transfer station in Long Island City between Queensboro Plaza and Queens Plaza, which involves a few hundred meters of underground walkway. Even then, the connection cannot possibly be convenient. The saving grace is that Eighth Avenue, Sixth Avenue, and Broadway are close enough to one another that passengers can walk to most destinations from any line.
Subsequently, NYCT should make a decision about whether to send express Queens Boulevard trains to 63rd Street and Sixth Avenue and local trains to 53rd and Eighth, as depicted in the above map, or the other way around. The problem is that the merge point between 53rd and 63rd Street Tunnels is one station east of Queens Plaza, at a local station, and thus the true transfer point is Roosevelt Avenue, far to the east. Riders on the local stations west of Roosevelt would get no choice where to go (though they get little choice today – both the E and M serve 53rd Street, not 63rd). The argument to do things as I depict them is to give the local stations access to 53rd Street; the argument to switch the lines is that there is more demand on 53rd than 63rd and also more demand on the express tracks than the local tracks, so the busiest lines should be paired. However, this in turn runs into turnback capacity limitations on the E in Manhattan, at the World Trade Center bumper tracks.
Potentially, NYCT could try to convert 36th Street into an express station, so that passengers could connect cross-platform. But such a dig would be costly and disruptive to operations. There were plans to do this at 59th Street on the 1/2/3 a few decades ago, for the transfer to the A/B/C/D, but nothing came of them.
Where new infrastructure is needed
The remaining reverse branches get increasingly more difficult. Already #7 requires new turnouts. The South Brooklyn trunk line has four tracks, but there’s not enough demand (or space in Manhattan) to fill them, so only the local tracks are used. There are occasional railfan calls for express service using the F, but it’s better to instead use the express tracks to segregate the G from the F. The G could be turned at Bergen Street on the local tracks, while the F could use the express tracks and then transition to the locals on new turnouts to be constructed at Carroll Street.
Also in the category of requiring new turnouts is #1: Rogers Avenue Junction is set up in a way that briefly forces the 2, 3, and 5 trains to share a short segment of track, limiting capacity. This can be resolved with new turnouts just east of the junction, pairing Nostrand Avenue Line with the local tracks and the West Side and the portion of the Eastern Parkway Line east of Nostrand with the express tracks and the Lexington Avenue Line. Trains on Eastern Parkway could either all go local, or keep the current mixture of local trains to New Lots (currently the 3) and express trains to Utica (currently the 4), skipping a total of two stations. This fix also reduces passengers’ access to one-seat rides, but at least there is a reasonable cross-platform transfer at Franklin Avenue, unlike on Queens Boulevard or at 145th Street and St. Nicholas.
And then there is #2, by far the most difficult fix. Demand on the White Plains Road branch in the Bronx is too strong to be a mere branch: the combined number of boardings at all stations is 166,000 per weekday, and besides, the line branches to Dyre Avenue near its outer end and thus needs the frequency of either a trunk or two branches to ensure adequate service to each other branch. This is why it gets both the 2 and 5 trains. There is unfortunately no infrastructure supporting a switch eliminating this track sharing: the 4 and 5 trains could both use this line, but then the 2 has no way of connecting to Jerome Avenue Line without new tunnels.
On the map, I propose the most obtrusive method of fixing this problem: cutting the 3 trains to a shuttle, with a new pocket track at 135th Street, letting passengers transfer to the 2, ideally cross-platform. With all through-trains running on the 2, there is no need (or space) for the 5 on White Plains Road, and instead the 5 should help boost the frequency on Jerome Avenue. In addition, some work is required at Woodlawn, which currently has bumper tracks, fine for a single branch but not for a non-branching trunk line (the bumper tracks on the L limit throughput to 26 tph no matter how good the electronics are).
Additional infrastructure suggested by deinterlining
Deinterlining is a service increase. Lines that today only get half or two-thirds service would get full trunk frequency: Second Avenue Subway would get the equivalent of the Q and N trains, the Astoria Line would get the entirety of 60th Street Tunnel’s capacity, Eighth Avenue would get more express trains, and 63rd Street Line and the South Brooklyn Line would get more than just the half-service of the F. With six track pairs on the lettered lines through Midtown and six north and east (Central Park West*2, Second Avenue, Astoria, Queens Boulevard*2), there is no room for natural branching to give more service to busy areas than to less busy ones.
One solution to this situation is targeted development on weak lines. Even with half service, South Brooklyn has underfull F trains, and Southern Brooklyn’s B, D, N, and Q trains aren’t much busier, making this entire area an attractive target for upzoning.
However, it’s more interesting to look at lines with extensions that suggest themselves. Second Avenue Subway has the obvious extension north to Harlem in phase 2, and a potential subsequent extension under 125th Street to Broadway, which is less obvious but popular among most area railfans (including one of my inside sources at NYCT). The Astoria Line has a natural extension to LaGuardia, ideally elevated over Ditmars to capture local ridership on Astoria as well as airport traffic; while the steel el structures in New York are soundboxes, it is possible to build quieter els using concrete (as on the 7 el over Queens Boulevard in Sunnyside) or a mixture of concrete columns and a steel structure (as on the Metro 2 and 6 els here in Paris).
The Nostrand Avenue Line provides an especially interesting example of a subway extension suggested by deinterlining. The terminal, Flatbush Avenue, was intended to be temporary, and as a result has limited turnback capacity. To prevent it from constraining the entire 2 route, which became the city’s most crowded even before Second Avenue Subway began decongesting the 4 and 5, it would be prudent to extend the line to Sheepshead Bay as the city intended when it planned the line in the 1910s.
In contrast, a subway extension under Utica, a stronger bus corridor than Nostrand with a strong outer anchor at Kings Plaza, loses value under deinterlining. It could only get a branch and thus have lower capacity than Nostrand. It would also definitely force branching on the express trains, whereas without such an extension they could run as a single unbranched line between Woodlawn and New Lots Avenue via Jerome Avenue, Lexington Avenue, and Eastern Parkway. A Utica subway should wait until there is political will to fund an entirely new crossing into Manhattan, presumably via Williamsburg to help decongest the L.
A second extension I have occasionally mooted, a subway under Northern, loses value even more. Such a subway would be a fourth trunk line in Queens and have to come at the expense of capacity on Queens Boulevard. It is only supportable if there is an entirely new tunnel to Midtown, passing under the mess that is the tracks in Long Island City.
A deinterlined New York City Subway
Fast Forward proposes moving block signaling on the most crowded subway segments, but typically only on trunks, not branches, and in some cases not even entire trunks. But in the long term, New York should transition to moving blocks and automation on all lines – at the very least the highly automated system used on the L, but ideally fully driverless operation, in recognition that wages are going up with economic growth but driver productivity isn’t. Simultaneously, deinterlined operations should allow tph counts in the mid 30s or even more (Metro 13 here runs 38 tph and Metro 14 runs 42).
Instead of the potpourri of lines offered today, there would be fewer, more intense lines. Nomenclature would presumably change to deal with the elimination of some services, clarifying the nature of the subway as a nine-line system in which five lines have four tracks and four lines have two. Each of these fourteen track pairs should be able to support a train every 90-105 seconds at the peak; not all lines have the demand for such frequency, and some have capacity-limiting bumper tracks that aren’t worth fixing (e.g. the 1 at Van Cortlandt Park), but many lines have the infrastructure and the demand for such capacity, including the express lines entering Midtown from Uptown or Queens.
Off-peak, too, service would improve. There is ample capacity outside rush hour, but turning the system into one of lines arriving every 4-5 minutes with strategic transfers rather than every 8-10 minutes would encourage people to take the trains more often. The trains would simultaneously be faster and more reliable, since incidents on one line would wreck service on other trains on the same line but leave the rest of the network unaffected.
With service improvements both during and outside rush hour, New York could expect to see substantial increases in ridership. Raising peak frequency from the current 24 tph to 36 tph on the busiest lines (today’s 2/3, 4/5, A/D, and E/F) is equivalent to building an entirely new four-track subway trunk line, and can be expected to produce similar benefits for passengers. The passups that have become all too familiar for riders on the 4, L, and other busy trains would become a thing of the past unless ridership rose 50% to match the increase in capacity.
Which Older Lines Should Express Rail Have Transfers to?
In my writings about metro network design I’ve emphasized the importance of making sure every pair of intersecting lines have a transfer. Moreover, I’ve argued that missed connections often come from having very wide stop spacing, because large metro networks have very closely-spaced lines in the core, and if the stop spacing in the core is too wide, as in Moscow, then lines will frequently cross without transfers. In contrast, in Paris, where the Metro has very closely-spaced stops, there is only one missed connection on the Metro, between Lines 5 and 14. However, what’s missing from this discussion is what to do on lines that, due to network design, have to run express and miss some connections. This question mattered to most RER lines and currently matters to Crossrail and Crossrail 2, and will be critical in any New York regional rail plan.
I claim that the most important connections to prioritize should be to,
- The busiest lines.
- Lines that are orthogonal to the newly-built express lines.
But before explaining this, I’d like to go over the scale of the underlying problem of prioritizing transfers. For a start, look at the Underground in Central London:
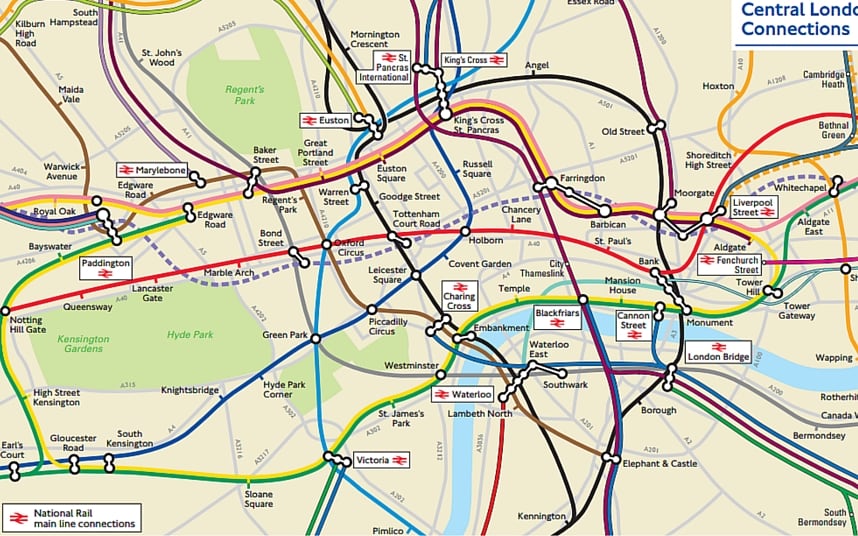
Crossrail is the dashed gray line. Between Paddington and Liverpool Street, it intersects seven north-south lines, including five in rapid succession on the West End; stopping at all of Bond Street, Oxford Circus, Tottenham Court Road, and Holborn would slow down too much what’s intended to be an express relief line to the Central line.
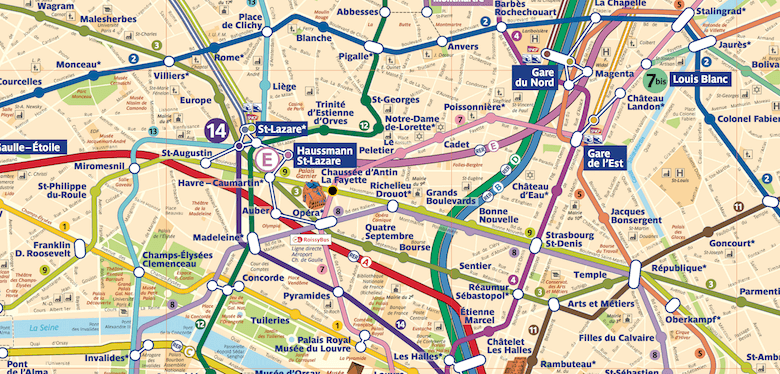
Stopping between two stations and having transfers to both is possible – look at Farringdon-Barbican and at Moorgate-Liverpool Street – but results in very long transfer times. The RER has opted for this solution at Auber, which is located between the Opera and Saint-Lazare, with a transfer stretching over three successive stations on Line 3, leading to legendarily labyrinthine transfers between the RER and the Metro:
Observe that in contrast with the RER A’s convoluted transfer at Auber, the RER B simply expresses between Chatelet-Les Halles and Gare du Nord, missing the connection to the east-west Lines 3, 8, and 9 and the north-south Line 7, and only connecting to the circumferential Line 2 via a long underground passageway. The reason for this is that a transfer station at Bonne Nouvelle or Sentier would be very expensive to construct; the RER’s stations were all extremely costly, and the RER A’s record of $750 million per km for the Nation-Auber segment remains unbroken outside the Anglosphere. On Crossrail (the recordholder in cost per km outside the US, soon to be overtaken by Crossrail 2), it’s the stations that drive up costs as well, and the same problem is even more acute in New York.
The tension is then between the network effects of including more transfer points, and the costs and slowdowns induced by stopping more often. The first point in my claim at the beginning of this post follows immediately: it’s more valuable to stop at transfer points to busier lines. The RER A misses Line 5 entirely, as does the express Line 14, because Line 5 is so weak that it’s not worth it to detour from Gare de Lyon through Bastille to connect to it; the oldest plans for the RER A had a stop at Bastille and not at Gare de Lyon, but under SNCF’s influence the system was redesigned to connect to the train stations better and thus Bastille was replaced.
Whereas the RER A in theory connects to every north-south one except the weakest (although the second strongest after Line 4, Line 13, has an even longer connection than at Chatelet), Crossrail does the opposite. The busiest station in London excluding mainline stations is Oxford Circus, thanks to the three-way transfer of the Bakerloo, Victoria, and Central lines; the Victoria line is the busiest in the system per km (although the longer Northern and Central lines have more riders), and it’s certainly the busiest north-south trunk line. However, plans to have a transfer to both Bond Street and Oxford Circus were rejected in favor of a connection to Bond Street alone. The reason is that London’s low-capacity passageways get congested, and TfL’s hamfisted solution is to omit critical transfers, a decision also made at the Battersea extension of the Northern line, which will miss a connection to the Victoria line at Vauxhall.
This brings me to the second transfer priority: it’s the most important to connect to orthogonal lines. The reason is that parallel lines, especially closely parallel lines, are less likely to generate transfers. New York’s four-track subway lines have very high volumes of local-express transfers, because those are easy cross-platform interchanges; as soon as any walking between platforms is required (for example, on the Lexington Avenue Line at 59th and 86th Streets), transfer volumes fall dramatically. In Paris, transfers between Line 1 and the RER A happen, but usually for longer-distance travel; I find it faster to take Line 1 from Nation to Chatelet than to take the RER A, even without any transfer, purely because it’s easier to get between the street and the Metro platforms at both ends.
This issue was never really in contention when Paris built the original RER system. The one place where the RER prioritized a transfer to a same-direction Metro line over an orthogonal one, Gare du Nord, is such an important destination for commuter and intercity trains that it’s obviously justified to prioritize it over an easier connection to Line 2. However, more recently, the RER E has seen this issue surface with the location of the infill Rosa Parks station. The RER E could have sited a station at the intersection with Line 5, but Line 5 goes northeast and serves much the same area as the RER E, so the network effects from an interchange would be weak. Instead, the station is sited to interchange with the circumferential T3 tramway, which opens up a connection toward Nation and eventually toward Porte d’Asnieres.
In London, the same question is critical to the central route of Crossrail 2. The current plan has three Central London stops: Victoria, Tottenham Court Road (with a transfer to Crossrail), and Euston-St. Pancras. But Victoria itself is not much of a destination, and of the two lines served, the District and the Victoria, the Victoria line is parallel to Crossrail 2 rather than orthogonal to it. The purpose of Crossrail 2 is to add north-south capacity through the West End to decongest the Victoria line and reduce the shuffle at Victoria station between mainline trains and the Underground; to this end, there’s no need to stop at Victoria station itself.
To this effect, Martha Dosztal proposes moving Crossrail 2 to Westminster or possibly Charing Cross. Instead of spending $2 billion on a station at Victoria, London would need to spend probably a comparable amount on a station that interchanges with lines that go northwest-southeast like Jubilee or Bakerloo rather than on the parallel Victoria line; moreover, Westminster and Charing Cross both have connections to the District line, so Crossrail 2 would still connect to all three east-west Underground lines.
Finally, the application to New York is the most delicate. New York’s scores of missed connections come from deliberate indifference on the IND’s part to transfers with the older lines rather than any systematic attempt at prioritizing important interchanges; the older IRT and BMT systems have between them just two missed connections (3/L in Brooklyn, 4-5/R-W in Lower Manhattan). But including better connections in the event the city builds more rail lines remains critical. Second Avenue Subway gets this right by having a cross-platform transfer to the east-west F; there’s no transfer to the north-south Lexington Line, but this is less important given Second Avenue’s role as a Lexington relief line.
Regional rail transfers are especially circumscribed in New York given the system’s nature as a few short tunnels: new tunnels across the Hudson, and ideally a connection between Penn Station and Grand Central. This is why there is little room for improving connectivity between the subway and what I call Lines 1-3 of New York regional rail. However, the priorities I’m advocating in this post suggest two important things about Penn Station: first, it’s important to reopen passageways to Sixth Avenue to allow connections to the NQRW and BDFM trains; and second, it’s not important to have a connection to the 7 at Hudson Yards, as IRUM proposes.
On more speculative lines involving longer tunnels, the same priorities point to my proposed stopping pattern in and around Lower Manhattan. What I call Line 4, a north-south line from Grand Central to Staten Island stopping at Union Square and Fulton Street would intersect the east-west subways: the 7 at Grand Central, the L at Union Square, and PATH and most Brooklyn-bound trains at Fulton Street. The only missed subways – the F/M at Houston Street and the N/Q at Canal – go mostly north-south (except the M, which has a same-platform transfer with the J/Z, connecting at Fulton). Likewise, what I call Line 5, connecting from Pavonia to Atlantic Terminal, would connect to most north-south subways at Fulton Street.
Ideally, it’s better to make every interchange, and subway builders around the world should aim for very long-term planning in order to prevent missed connections in the future. However, when the inevitable changes happen and missed connections are unavoidable, there are emergent rules for which are more important: busier lines are more important than less busy lines, and less obviously, lines that are orthogonal to the new line are more important than ones that are parallel. These priorities make it possible to build express lines that maximize regional connectivity with minimal loss of travel time due to making local stops.
Little Things That Matter: Circulation at Transfer Stations
I’ve written before about some problems of metro network design in large cities. In brief, it’s important to maximize network effects in a multi-line system, which means offering plenty of transfers between lines. The perfect network should have every pair of lines intersecting in the center with a transfer, with possible additional intersections outside the center, again with transfers. In practice, it never works quite this way. There are always compromises, based on particular historical and geographical details of city layout. But probably the single biggest contributor to the issue is transfer capacity. This issue also has independent interest, but the two worst examples I know of involve the central transfer points of London and Paris, where many lines converge.
For a start, it’s worth asking why even have multiple stations. Why not just build a perfect star-shaped system? Two-line subway networks usually just cross once in city center. Three-line networks can intersect at one point (as in Stockholm and the first three lines of Moscow), but more commonly they intersect in a triangle of three city center stations. Central transfer points go way beyond three lines, though: Otemachi has five subway lines; Tokyo Station has a subway line and six independent JR East commuter lines; Chatelet-Les Halles has five Metro lines and two and a half RER lines; Bank and Monument together have four Underground lines and the Docklands Light Railway; Times Square has five subway lines, three of which are four-track. Why not just add more lines to the same central station? There are three distinct answers.
Coverage
Transit networks aren’t just about connecting large neighborhoods (“Upper West Side”) to a nebulously defined city center. They’re about specific connections. City centers are larger than a single subway stop, and much larger than a single subway stop in any city that has any business building four or more subway lines. In Stockholm, where three lines is about right, the CBD extends about two stops heading north and east of T-Centralen. New York, Paris, Tokyo, and London all have CBDs several square kilometers in area, so it makes sense to route lines in such a way that it’s easy to reach many points within the CBD from all directions.
Concretely, take Times Square and Grand Central. It’s useful to serve both of them on multiple subway lines, but a north-south line can only serve one. Thus, the 4/5/6 serve Grand Central, and the A/C/E, 1/2/3, and N/Q/R/W serve Times Square. The same process repeats itself at a number of nodes within Midtown, and within CBDs of other large cities.
Construction difficulties
Independently of the value of having extensive service in multiple directions from multiple points in the CBD, there is the cost of bringing lines together. In large cities, the biggest source of missed connections to begin with is that the street available for line 6 may happen to pass right between two widely-spaced stops on line 1, which never had a stop at this street because line 6 was not in the planning stages yet.
For the same reason, urban street networks make it difficult to serve one point from more than a few directions. Even lines bored deep under the surface, without regard for the street network, would find it difficult to go on level -9, beneath eight older lines. The stations with the largest number of independent lines all have tricks to make this work. Times Square has three north-south subways that don’t physically intersect (the 1/2/3 is always to the west of the N/Q/R/W and the A/C/E well to the west of both), a stub-ending east-west subway (the shuttle), and one deep-bored east-west subway (the 7). At Tokyo Station four of the six commuter lines are elevated at the same level. At Otemachi the lines form a square, with one side consisting of two lines that were built together at the same time. Chatelet-Les Halles has platforms that do not intersect, and the most difficult retrofit, the addition of the RER, was a massive excavation project that cost billions of euros.
The same construction difficulties are also relevant to small transfer stations. In Paris, transfer stations try to avoid superimposing one line’s platforms on top of the other, just because it’s hard to build. As a result, transfers often involve long walks; transfers at Chatelet are particularly labyrinthine.
Transfer capacity
The biggest problem is not coverage, and only partly related to construction difficulties. At the busiest stations, pedestrian circulation between platforms can be a challenge. London Reconnections has a four–part series about Bank, where three deep-level Underground lines meet, all having built in the late 1890s, when expected ridership was far lower than it is today. Circulation is so obstructed that at rush hour TfL occasionally has to close the station for safety reasons, or else passengers would fall onto the tracks. Retrofitting the station with additional connections between lines as well as from the platforms to the street has been a daunting task, since the most logical places for escalators to one line would often pass through the platforms of another.
At Chatelet-Les Halles, the same problem occurs, if not so acutely that trains need to skip the station at rush hour. The passageways between the Metro platforms and between the Metro and the RER are long and narrow, and barely adequate to handle the large volume of passengers.
The simplest way to prevent this problem from occurring at a particular station is to make sure to design enough room for the transfer. The simplest way to do that, in turn, is to ensure transfers are cross-platform. The RER has such cross-platform transfers at the station, pairing westbound RER A trains with northbound RER B trains and eastbound RER A trains with southbound RER B trains. But even the wrong-way RER A-B transfers and the transfers involving the RER D are fine: the station’s extreme cost paid for a full-length, full-width mezzanine. The London Underground, too, retrofitted these onto some older lines when it built the Victoria line, which has cross-platform transfers at such key stations as Oxford Circus (the busiest in London not counting mainline stations – Bank is only the second busiest) and Euston.
However, cross-platform transfers connect two lines. I know of one place where they connect three: Jamaica Station, where one track in each direction has platforms on both sides, and passengers on the trains on the opposite sides of these platforms are sometimes told to walk through the train to transfer. This is a unique feature of regional rail, with its timed connections; subways with a train every 2-3 minutes can’t realistically time the connections, and without timing the connections, passengers are better off walking up and down to the other platform than waiting for a train to come in for a purely horizontal transfer.
The need for coordinated planning
The ultimate problem with using more cross-platform transfers if that they require a great deal of foresight. Retrofitting them is not always possible, and costs money in modification of existing stations. Hong Kong, Singapore, and Taipei all use these transfers extensively, but only on lines that were planned together, such as the first two lines in Singapore; Singapore’s newer lines have long (though spacious) transfer corridors, and Hong Kong’s lines inherited from the original MTR and from mainline rail have poor transfers.
With relatively limited opportunities to have high-capacity, high-quality transfers, it’s no wonder that most cities that build rapid transit try to avoid four- and five-way transfers when possible. Complex transfers like this can arise by accident, over several layers of planning – in the case of Paris, Line 11 was planned and built a generation later than Lines 1, 4, and 7; the RER was built a generation later than Line 1; and Line 14 was built a generation later than the RER, and indeed was designed as a relief line to the RER A.
Ultimately, the best way to prevent a situation like Chatelet or Bank from occurring is to know in advance where every line will go. However, this is necessarily a hard task. In the 1890s, London was a city of 6 million, with a large number of poor people living in overcrowded condition in East and South London; a planner could guess how the city would grow and suburbanize in the 20th century but would not be able to predict this with any certainty. Paris, the capital of a then-poorer and far less industrialized country, has grown even more tremendously – in 1901 Ile-de-France had 4.7 million people, not all living in the built-up area of the capital.
In very large third-world cities, the task of predicting future growth is somewhat easier, but only because they’re already very large and have informal transit pointing the way to the major corridors. I can draw a semi-serious Lagos metro proposal based on the city’s urban layout today and expect much of its future growth to come from increasing building heights so that the same density can be accommodated with less overcrowding, but I can’t meaningfully say which future areas will become hotspots that must be served from all directions or how far the suburban sprawl will go.
Why Free Trade in Rolling Stock is Good
Classical economics asserts that if two countries freely trade, then both gain relative to a baseline in which they don’t trade. The classical theory of comparative advantage hinges on reciprocal free trade. But more recently, economists have begun to push for entirely domestic support for free trade, arguing that reducing trade barriers is good even without reciprocation. The arguments involve corruption and misallocation of capital coming from protectionism. Whatever criticism there may be of this neoliberal conception of trade, rolling stock appears to be an example in which this conception is right.
I have previously criticized informal French protectionism in high-prestige procurement for blowing up Parisian rolling stock costs by a factor of almost 2. In Paris, my example of what could be done with the money Ile-de-France Mobilités is wasting on rolling stock was infrastructure construction, justified by the city’s very low construction costs relative to ridership (if not relative to route-length). But there’s an even better set of examples of high costs in the United States, justified on labor grounds and yet involving wastes of money disproportionate to the number of jobs created.
Last month, The American Prospect published an article about a union push to have more US rolling stock made in America, by unionized workers. The TAP article talks about a light rail vehicle order in Los Angeles for $890 million, for what the article says is 175 cars and what manufacturer Kinki Sharyo and other industry sources say is 235 cars, built at a dedicated factory in the Los Angeles exurbs. The purpose of the article is to advocate for more protectionism for the sake of American union members, so it details the wages the workers are making (about $20 an hour, up from $11 for unskilled jobs elsewhere) but does not delve into comparative costs. It’s worth asking if the costs are competitive, and the answer is that they are not.
The cost of LACMTA’s Kinki Sharyo order is $3.8 million per car; these cars are 27 meters long, so this translates to $140,000 per meter of train length. In contrast, the average cost in Europe appears to be just under $100,000 per meter, across a variety of cities and models:
- In Bordeaux, a recent Citadis tram order cost $80,000 per meter.
- In Strasbourg, the Citadis cost $95,000 per meter.
- In Avignon, the Citadis Compact cost $95,000 per meter.
- In Aubagne, the Citadis Compact cost $100,000 per meter.
- In Budapest, an order for Urbos trams cost $95,000 per meter.
- In Birmingham, the launch customer for the Urbos, they cost £2 million per unit, and at 33 meters per car, it’s around $90,000 per meter.
- In Luxembourg, the Urbos cost €3.95 million per unit, each at 45 meters, or $110,000 per meter, and include catenary-free operation.
- In Munich, the launch customer for the Avenio, the trams cost $120,000 per meter.
- In the Hague, the Avenio cost $90,000 per meter.
The shortest trains on this list (the Citadis Compact orders, at 22-24 meters) are in the middle of the pack, so it’s unlikely there’s any nonlinearity in cost; moreover, the Compact is slightly shorter than the Kinki Sharyo trains, so no extrapolation is required, only interpolation.
The LACMTA order follows another premium-priced light rail order in the same state: as I wrote in the Bay City Beacon last year, Muni Metro’s Siemens LRV order cost about $4 million per 23-meter car, about $170,000 per meter of train length. The trains are being built at a new plant in Sacramento.
The United States has federal Buy America laws, requiring federally-funded contracts to buy domestic products provided they cost no more than 25% more than equivalent imports. However, there is no in-state purchase requirement. Owing to large New York City Subway orders, some vendors have long-established plants near New York (Kawasaki and Alstom are in-state, Bombardier is in Vermont). However, under informal pressure from activists within California to provide good local jobs, LACMTA asked bidders to open local factories. Moreover, Siemens most likely placed its plant in Sacramento rather than in lower-cost states in order to curry favor with state-funded orders.
We even see the same problem in Massachusetts, where CRRC opened a plant in Springfield for an MBTA Red and Orange Line car order. The order itself does not come at a premium – according to Metro Report the base order is about $100,000 per meter of train length and the option is $115,000, and the range of per-meter costs for subway trains is the same as that for LRVs – but it’s possibly a loss leader to help establish CRRC as a player in the American market. Even before Trump’s election, Congress investigated the order, which beat the competitors by a large margin; the competing bids were about $135,000 per meter for the base order. It says a lot about Massachusetts’ broken procurement that it takes a loss leader just to get costs down to their international levels. Nonetheless, the US premium does appear to be smaller for large subway orders than for small and medium-size LRV orders, since the extra costs of siting and setting up a factory are spread across more units.
The explicit goal of local content requirements is to create jobs. This is usually justified in terms of inequality and bleak prospects for unskilled workers. However, there is no cost-benefit calculation involved in this. According to TAP, the LACMTA order is creating 250 jobs manufacturing the trains; it doesn’t say how long they will last, but the duration of the contract is about 6 years. But the premium, about $300 million, works out to $1.2 million per job, a large multiple of total compensation to the workers. The Springfield plant has 200 jobs paying $50,000-60,000 per year, lasting 7 years across more than just the Boston contract; pro-rating to the Boston contract’s share of orders from the plant, the jobs will last around 5 years. Adding back the premium charged by the competing vendors raises the cost to $1 million per job, again a multiple of total working-class compensation.
There are two reasons why labor protectionism costs so much compared with its direct impact on working-class hiring. The first is leakage: much of the premium goes to management, including factory design and construction, or is just wasted on inefficiency (CRRC is opening a second American plant, in Chicago, instead of building everything at one plant). Some of the money goes to foreign consultants with the vendor and some stays domestic, but the domestic leakage goes to sitework and not to direct hiring.
The second reason is corruption and degradation of institutions. When the goal of public procurement is not just to buy the best product in terms of cost and quality, lobbyists make demands, like local hiring, that corrupt the process. A city that signals that the only things that matter are cost and quality will attract vendors who make the best bids in terms of cost and quality; a city that signals that the process depends on local political needs will attract vendors who make bids in order to satisfy local political actors, who as a rule don’t give a damn about good transit. Thus American agencies buy trains at a premium well beyond Buy America’s 25% limit, just because they think of cost and quality as just two of several political priorities and not as the sole legitimate bases of choosing a bidder.
The United States leads the world in higher education costs. The unsubsidized cost of a college degree at a good public university is about $100,000; at CUNY, which provides a good quality of degrees even if it’s so underfunded that classrooms aren’t supplied with chalk, it’s about $75,000. Stipends at the level of a good graduate program add another $30,000 or so per year. For around $200,000 per person, California could send low-income workers to college and pay for their living expenses for the duration of the degree, whereupon they will be able to get unsubsidized jobs paying much more than $20 per hour. For workers who can’t go to college, trade school is another option, offering decently-paying jobs for much lower cost since they take much less time. There is no need to lade the transit capital budget with what should be state or federal retraining grants; given the massive difference in cost, even the loss of matching funds (i.e. other people’s money) can leave the state or the city better off.
The problem is that there is no political incentive to think in such terms. Part of it is the corruption of institutions, as I mentioned already: labor groups see an opportunity to create jobs from a budget that from a local perspective is other people’s money. Another part is political prestige: romantics like old jobs (farmer, builder, truck driver, coal miner, baker, factory worker), which have had enough time to percolate into the national psyche, and since these jobs are old, they’re likely to be at the low end of the value-added ladder.
Absent very strong rules forbidding protectionism in procurement, this corruption will continue: evidently, Paris insists on buying expensive bespoke trains and somehow manages to get them manufactured within France, even though EU rules against interstate dumping are much stronger than US rules. Rules at the highest level are required to discourage such behavior (although Paris might still waste money on bespoke trains, just ones that can be made in Poland). Congress can and should stop funding any local or state agency that takes in-state content into account in procurement; the US is one democratic country, not fifty mercantile fiefdoms, and should use its status as a superstate with a large internal market to universalize good governance.
Construction Costs: Electrification
Continuing from last week’s post about signaling costs, here is what I’ve found about electrification costs.
Like signaling, electrification usually doesn’t make the industry press, and therefore there are fewer examples than I’d like. Moreover, the examples with concrete costs are all in countries where infrastructure costs are high: the US, Canada, the UK, Israel, New Zealand. However, a check using general reported French costs (as opposed to a specific project) suggests there is no premium in Israel and New Zealand over France, even though both countries’ urban rail tunneling projects are more expensive than Parisian Metro and RER extensions.
In the UK, the recent electrification project has stalled due to extreme cost overruns. Finding exact cost figures by segment is difficult in most of the country, but there are specific figures in the Great Western. Financial Times reports the cost of the Great Western project at £2.8 billion, covering 258 km of intercity mainline (mostly double-track, some four-track) and what I believe to be 141 km of commuter rail lines in South Wales, working from Wikipedia’s graphic and subtracting the canceled electrification to Swansea. In PPP dollars it’s around $10 million per km, but the cost may include items I exclude elsewhere in this post, such as rolling stock. For reference, in the late 2000s the project was estimated at £640 million, but costs then tripled, as the plan to automate wire installation turned out not to work. Taking the headline cost as that of the last link, £1.74 billion, the cost is $6.1 million per km, but there have been further overruns since (i.e. the Swansea cancellation).
In the US, there are three projects that I have numbers for. The most expensive of the three is Caltrain electrification, an 80 km project whose headline cost is $1.9 billion. But this includes rolling stock and signaling, and in particular, the CBOSS signaling system has wasted hundreds of millions of dollars. Electrification infrastructure alone is $697 million, or $8.5 million per km. The explanations I’ve read for this high figure include indifference to best practices (e.g. electrification masts are spaced 50 meters apart where 80 meters is more common) and generally poor contracting in the Bay Area.
The other two US projects are more remote, in two different ways. One is California High-Speed Rail: with the latest cost overrun, the projected electrification cost is $3.7 billion (table 4, PDF-p. 14). The length of route to be electrified is unclear: Phase 1, Los Angeles to San Francisco with a short branch up to Merced, is a little more than 700 km, but 80 km of that route is Caltrain, to which the high-speed rail fund is only contributing a partial amount. If the denominator is 700 km then the cost is $5.3 million per km.
The other remote US project is Amtrak’s electrification of the New Haven-Boston segment of the Northeast Corridor in the late 1990s. Back then, the 250-km double-track route was electrified for $600 million, which is $2.4 million per km, or about $3.5 million per km adjusted for inflation.
In Canada, Toronto is in the process of electrifying most of its regional rail network. The current project includes 262 route-km and has a headline cost of $13.5 billion, but according to rail consultant Michael Schabas, this includes new track, extensive junction modification, unnecessary noise walls (totaling $1 billion), and nearly 100% in contingency just because on the original budget the benefit-cost ratio seemed too good to be true. In a 2013 study, the infrastructure cost of full electrification was estimated at $2.37 billion for 450 route-km in 2010 Canadian dollars. In today’s American dollars it’s about $4.5 million per km.
In France, a report that I can no longer find stated that a kilometer of electrification cost a million euros, in the context of the electrification of a single-track legacy branch to Sables d’Olonne, used by some TGV services. While trying to find this report, I saw two different articles claiming the cost of electrification in France to be a million euros per double-track kilometer. The latter article is from 2006, so the cost in today’s money is a little higher, perhaps as high as $1.5 million per km; the article specifically says the cost includes bridge modification to permit sufficient clearances for catenary.
In Israel, the majority of the national network is currently being electrified, and I’ve argued elsewhere for a completist approach owing to the country’s small size, high density, and lack of rail connections with its neighbors. The project has been delayed due to litigation and possibly poor contractor selection, but a recent article on the subject mentions no cost overrun from the original budget of 3 billion shekels, about $750 million, for 600 km of double-track. This is $1.25 million per km and includes not just wire and substations but also 23 years’ worth of maintenance. This may be similar to the Danish ETCS project, which has been severely delayed but is actually coming in slightly under budget.
In New Zealand, the one electrification project recently undertaken, that of the Auckland regional rail network, cost $80 million in infrastructure. This is New Zealand dollars, so in US terms this is closer to $55 million. The total length of the network is about 80 route-km and 200 track-km, making the cost about $700,000 per km. But the project includes much more than wire: the maintenance facility, included in the Israeli figure, cost another NZ $100 million, and it is unclear whether bridge modifications were in the infrastructure contract or tendered separately.
The big takeaway from this dataset, taking French costs as the average (which they are when it comes to infrastructure), is that Israel and New Zealand, both small countries that use extensive foreign expertise, do not pay a premium, unlike the US, UK, and Canada. In the UK, there is a straightforward explanation: Network Rail attempted to automate the process to cut costs, and the automation failed, creating problems that blew up the budget. Premature automation is a general problem in industry: analysts have blamed it for Tesla’s production problems.
In the US and Canada, the construction cost problem is generally severe. However, it’s important to note that at NZ$2.8-3.4 billion for 3.4 km of tunnel, Auckland’s tunneling cost, around US$600 million per km, isn’t much lower than Toronto’s and is actually slightly higher than the Bay Area’s. My explanation for high costs in Israel, India, Bangladesh, Australia, Canada, New Zealand, Singapore, and Hong Kong used to be their shared English common law heritage, but this is contradicted by the lack of any British premium over French costs in the middle of the 20th century. An alternative explanation, also covering some high-cost civil law third-world countries like Indonesia and Egypt, is that these countries all prefer outside consultants to developing public-sector expertise, which in the richer countries is ideologically associated with big government and in the poorer ones doesn’t exist due to problems with corruption. (China and Latin America are corrupt as well, but their heritages of inward-looking development did create local expertise; after the Sino-Soviet split, China had to figure out how to build subways on its own.)
But Israel Railways clearly has no domestic expertise in electrification. The political system is so unused to this technology that earlier this decade I saw activists on the center-left express NIMBY opposition to catenary, citing bogus concerns over radiation, a line of attack I have never seen in California, let alone the Northeastern US. Nor is Israel Railways good at contracting: the constant delays, attributed to poor contractor choice, testify to that. The political hierarchy supports rail electrification as a form of modernization, but Transport Minister Israel Katz is generally hostile to public transit and runs for office with a poster of his face against a background of a freeway interchange.
What’s more likely in my view is that Israel and New Zealand, with no and very little preexisting electrification respectively, invited experts to design a system from scratch based on best industry practices. I’m unfamiliar with the culture of New Zealand, but Israel has extensive cultural cringe with respect to what Israelis call מדינה מתוקנת (“medina metukenet”), an unbroken country. The unbroken country is a pan-first-world mishmash of American, European, and sometimes even East Asian practices. Since the weakness of American rail is well-known to Israelis, Israel has just imported European technology, which in this case appears easy to install, without the more particular sensitivities of urban tunneling (the concrete side of the electronics before concrete maxim). In contrast, the US is solipsistic, insisting on using domestic ideas (designed by consultants, not civil servants). Canada, as far as I can tell, is as solipsistic as the US: its world extends to Canada and the US; Schabas himself had to introduce British ideas of frequent regional rail service to a bureaucracy that assumed regional rail must be run according to North American peak-only practices.
All of this is speculation based on a small number of cases, so caveat emptor. But it’s fairly consistent with infrastructure construction costs, so long as one remembers that the scope for local variation is smaller in electrification and systems than in civil infrastructure (for one, the scope for overbuilding is much more limited). It suggests that North America could reduce its electrification costs dramatically by expanding its worldview to incorporate the same European (or Asian) companies that build its trains and use European (or Asian) standards.
Construction Costs: Signaling
I launched a Patreon poll about construction cost posts, offering three options: signaling and electrification, rolling stock, and historical costs. Signaling and electrification won with 29 votes to historical costs’ 20 and rolling stock’s 6. This post covers signaling, and a subsequent post will cover electrification.
I was hoping to have a good database of the cost of installing train protection systems. Instead, I only have a few observations. Most metro lines in the world have searchable construction costs given a few minutes on Google, and a fair number of rolling stock orders are reported alongside their costs on Railway Gazette and other trade publications. In contrast, recent numbers for signaling are hard to get.
The gold standard for mainline rail signaling is European Train Control System, or ETCS; together with a specified GSM communications frequency it forms the European Rail Traffic Management System, or ERTMS. It’s a system designed to replace incompatible national standards that are often nearing the end of their lives (e.g. Germany expects that every person qualified to maintain its legacy LZB system will retire by 2026). It’s of especial interest to high-speed lines, since they are new and must be signaled from scratch based on the highest available standard, and to freight lines, since freight rail competes best over long distances, crossing national borders within Europe. Incompatible standards between countries are one reason why Europe’s freight rail mode share is weaker than that of the US, China, or Russia (which is Eurasian rather than European when it comes to freight rail).
As with every complex IT project, installation has fallen behind expectations. The case of Denmark is instructive. In 2008, Denmark announced that it would install ETCS Level 2 on its entire 2,667-km network by 2020, at the cost of €3.2 billion, or about $1.5 million per route-km. This was because, unlike both of its neighbors, Denmark has a weak legacy rail network outside of the Copenhagen S-tog, with little electrification and less advanced preexisting signaling than LZB. Unfortunately, the project has been plagued with delays, and the most recent timetable calls for completion by 2030. The state has had to additionally subsidize equipping locomotives with ETCS, but the cost is so far low, around $100,000 per locomotive or a little more.
That said, costs in Denmark seem steady, if anything slightly lower than budgeted, thanks to a cheap bid in 2011-2. The reason given for the delay is that Banedanmark changed its priorities and is now focusing on electrification. But contracts for equipping the tracks for ETCS are being let, and the cost per kilometer is about €400,000, or $500,000. The higher cost quoted above, $1.5 million per km, includes some fixed development costs and rolling stock costs.
Outside Denmark, ETCS Level 2 installation continues, but not at a nationwide scale, even in small countries. In 2010, SNCB rejected the idea of near-term nationwide installation, saying that the cost would be prohibitive: €4.68 billion for a network of 3,607 km, about $1.6 million per route-km. This cost would have covered not just signaling the tracks but also modifying interlockings; it’s not purely electronics but also concrete.
The Netherlands is planning extensive installation as well. As per Annex V of an EU audit from last year (PDF-pp. 58-59), the projected cost is around $2 million per route-km; the same document also endorses Denmark’s original budget, minus a small reduction as detailed above due to unexpectedly favorable bids. Locomotive costs are said to be not about $100,000 but €300,000 for new trainsets or €500,000 for retrofitting older trainsets.
A cheaper version, ETCS Level 1, is also available. I do not know its cost. Switzerland is about to complete the process of a nationwide installation. It permits a trainset equipped with just ETCS equipment and no other signaling to use the tracks, improving interoperability. However, it is an overlay on preexisting systems, so it is only a good fit in places with good preexisting signaling. This includes Switzerland, Germany, and France, but not Denmark or other countries with weak legacy rail networks, including the US. The Northeast Corridor’s ACSES system is similar to ETCS Level 1, but it’s an overlay on top of a cab signaling system installed by the Pennsylvania Railroad in the 1930s.
Comparing this with American costs is difficult. American positive train control, or PTC, uses lower-capacity overlay signaling, nothing like ETCS Level 2. One article claims that the cost per track-km (not route-km) on US commuter rail is about $260,000. On the MBTA, the projected cost is $517 million for 641 km, or $800,000 per route-km; on the LIRR it’s $1 billion for 513 route-km, or $1.9 million per route-km. Observe that the LIRR is spending about as much on a legacy tweak as Denmark and the Netherlands are on a high-capacity system built from scratch.
Why is Second Avenue Subway Phase 2 So Expensive?
I am only loosely following the news about the second phase of Second Avenue Subway. The project, running from 96th Street to 125th, with a short segment under 125th to Lexington, passing under the 4, 5, and 6 trains, is supposed to be cheap. In the 1970s, work began on Second Avenue Subway before the city went bankrupt, and there are extant tunnel segments built cut-and-cover in East Harlem between the station sites. The stations need to be dug, but the plan dating back to 2003 was to build them cut-and-cover as well, with local disruption for only a few blocks around 106th, 116th, and 125th Streets. Only one part would be difficult: going deep under 125th, under the preexisting subway. And yet, costs are very high, and the design seems to be taking a wrong turn.
In the early 2000s, the cost projections were $3.7 billion for phase 1 (actual cost: $5 billion, but much of the difference is inflation), and $3.3 billion for phase 2 (projected cost: at least $6 billion). Since then, there have been changes. For about a year I heard rumors that the preliminary engineering had been done wrong, and it was impossible to use the preexisting tunnel segments. Then I heard that no, it’s actually possible to use the existing tunnels. But a few days ago I heard that even though it’s possible, the MTA is now planning to demolish the existing tunnels and build the entire project deep underground using tunnel-boring machines.
With the information generally given out at community meetings, it’s hard to know what’s exactly going on. However, the fact that the MTA is talking about this suggests extreme disinterest in cost control. Cut-and-cover construction is cheaper than TBMs, per a 1994 paper by Godard, Barrié, Zhang, et al, looking at French urban rail costs since the 1970s. The tradeoff is that it forces rail lines to go underneath streets, which is disruptive to pedestrians and merchants, or demolish private property. Fortunately, Second Avenue is a wide, straight throughfare, and requires no such demolitions, while the disruption would be localized to areas that are scheduled to get subway stops as part of the project. Metro extensions here and in a number of other European cities are constructing stations cut-and-cover and the tunnels between them with TBMs; Metro Line 12’s online documents state that station construction involves just 18 months of digging.
It’s possible that the need to turn to 125th Street is messing up the plan to do everything cut-and-cover. While the turn itself can be done with minimal demolitions (the inside of the curve has a few small buildings, and there’s also an alignment slightly farther east that goes under vacant land while maintaining a 90-meter curve radius), going underneath the Lexington Avenue Line requires diving deep, and then there is no advantage to cut-and-cover. Building cut-and-cover under existing lines is difficult, and in that case, TBMs are warranted.
If the problem is 125th Street, then I would propose extending phase 2 and then breaking it apart into two subphases. Phase 2.0 would be cut-and-cover and open stations at 106th, 116th, and possibly 125th and 2nd temporarily. Phase 2.5 would involve driving TBMs under 125th Street all the way to Broadway; this could be done with a large-diameter TBM, with the platforms contained within the bore and vertical access dug so as to avoid the intersecting north-south subways. 125th Street has 30,000 crosstown bus boardings according to the MTA, which would make it the busiest bus corridor in the city per km: 10,000 per km, compared with 8,000 on the busiest single route, the M86. It is a priority for subway expansion, and if it’s for some reason not possible to easily build from 96th and 2nd to 125th and Lex in one go then the entire project should be extended to 125th and Broadway, at somewhat higher cost and far higher benefits.
The reason phase 1 was so expensive is that the stations were mined from small digs, rather than built cut-and-cover as is more usual. The idea was to limit street disruption; instead there was street disruption lasting 5 years rather than 1.5, just at small bore sites at 72nd and 86th rather than throughout the station boxes’ footprints. The TBM drive and systems cost together $260 million per kilometer, compared with $125 million on Paris’s Metro Line 1 extension, but the stations cost $750 million each, compared with $110 million.
It’s crucial that the MTA not repeat this mistake in phase 2, and it’s crucial that area transit activists hold the MTA’s feet to the fire and demand sharp cost control. Even taking the existing premiums as a given, cut-and-cover stations should not cost more than $200 million each, which means phase 2 as planned should cost $600 million for stations, about $330 million for systems, and another $350 million for overheads. At $1.3 billion this still represents high cost per kilometer, about $500 million, but it’s based on actual New York cost items, which means it’s plausible today. There is no excuse for $6 billion.
Rapid Transit in Low-Density Boomtowns
Most of my thinking about public transit comes from large, dense cities, especially New York. In those cities, transit ridership is not a problem; only cost is. When such cities have decent cost control, they can build massive expansion programs, as Paris is. But most of the developed world is not New York, Paris, London, Tokyo, or other transit cities. A large and (thanks to differential national population growth rates) growing share of the developed world lives in fast-growing, low-density city regions with no public transit to speak of, such as the American Sunbelt and its counterparts in Canada and Australia.
I’ve had to intellectually grapple with public transit in two American Sunbelt cities in which current transit usage is a rounding error and the built form is wholly auto-oriented: Orlando (which I was asked about by a Twitter mutual) and Nashville (which just voted against a flawed light rail plan by an overwhelming margin). In those areas, there is no chance for any public transit, provided the urban form stays as it is – but fortunately such cities can leverage their high growth rates to change their urban form, as Calgary did in the 1980s and 90s.
Density versus growth
A few months ago I made this chart:
![]()
The density and growth demand axes are not meant to come from a single quantitative metric; density is a subjective mix of residential and job density, whereas growth demand refers to either population growth or the demand for more housing as expressed by price signal. In San Francisco, most likely the richest metro area in the world, density is middling, and growth demand is higher than even in New York and London; in the American Rust Belt, density is fairly low and there is also little demand for more; in some cities on the margin of the first world there is little demand for more growth but high preexisting density. It goes without saying that it’s easier to build new rapid transit lines on the upper right corner than on the lower left one.
The situation of the American Sunbelt, most of which goes in the bubble of Texas and Georgia, is difficult. Residential density is extremely low, so the ridership base near potential rail lines is low. Moreover, streets are usually designed exclusively around auto use, so passengers are unlikely to walk a kilometer to the train station the way they routinely do in transit cities. At the destination end, things aren’t much better – American cities have high-rise CBDs, but few jobs locate there or in surrounding dense neighborhoods.
The Orlando CBD has about 80,000 jobs, in a metro area of 2.5 million people. Disney World adds another 37,000, but is not surrounded by any serviceable residential neighborhoods, and has to be at the end of any reasonable transit service coming from the CBD. Nashville, a metro area of nearly 2 million, has a CBD with 36,000 jobs. The medical center to the southwest adds another 33,000, and this time it could plausibly lie on a rail trunk, but most of the useful urban arterials converge on the CBD and not on the medical center. In contrast, Washington, with 5.5 million people, has 280,000 people working at the CBD (from the Green and Yellow Lines to just beyond Dupont Circle and Foggy Bottom), 77,000 in the Rosslyn-Ballston corridor, and 33,000 in Crystal City and at National Airport and the Pentagon. Both the percentages and the absolute numbers (including job density) count: there is a great mass of people who would be interested in taking rail to Washington CBD jobs but not to Orlando or Nashville CBD jobs.
Can regional rail work?
No.
High-growth areas are likely to have been small a few decades ago. For the most part the metro areas in question were too small in the heyday of rail transportation to have inherited a large legacy rail network. Even the ones that did, including Atlanta and Perth, have less legacy rail than older cities of comparable size – compare Atlanta with Philadelphia, or Perth with Brisbane. And most North American boomtowns are not Atlanta. Miami has two north-south mainlines and a handful of east-west connections, none at the right place for commuter rail. Orlando has a north-south trunk with a branch to the north, and Nashville a few branches, but they’re surrounded by industrial land use and not by the sort of suburbs that developed around commuter rail in the Northeast.
A commuter rail-based network can still work, but only with extensive greenfield lines. Disney World is not on any legacy rail line, because it developed long after rail stopped being a relevant mode of transportation outside large urban areas. But even then, gaps in coverage are unavoidable, as the dense neighborhoods of such cities did not develop around legacy rail.
Can transit-oriented development work?
Sort of.
The big question about TOD is, who is it for? In Nashville specifically, the far left opposed the light rail plan, essentially because it would cannibalize funding that could go to public housing. Now, public housing could be used to beef up density along rail corridors. Stockholm built public housing simultaneously with the subway, placing housing projects on top of rail branches, and as a result has per capita ridership today that’s not much lower than the level of Paris, Berlin, or Munich.
The problem is that public housing is horrendously expensive. A house in low-cost American cities costs around $150,000, but apartments cost more, so $200,000 per household is more likely even with some economies about size. Most of this cost is impossible to recover through rent – if low-income households made enough money to pay market rent in nice apartments, they’d just rent these apartments on the open market. The American Sunbelt does not lack for developable suburban land.
Market-rate housing is much easier to construct – for one, developers make a profit on it, and so are eager to put up their own money. The problem is that in cities like Nashville and Orlando, the middle class has close to 100% car ownership, and a large majority of households have one car per adult. The real estate industry is not going to spontaneously build housing with less parking or pedestrian-oriented retail.
In San Diego, developers build more parking than the minimum at University Avenue and 30th Street, according to Duncan McFetridge of the Cleveland National Forest Foundation. University is a bus corridor and not a light rail corridor, but the bus frequency there isn’t terrible, and the area is pretty walkable for a low-density city. In Los Angeles, I’ve read analysis that blames the region’s falling transit ridership on gentrification, explaining that in gentrifying inner neighborhoods like Boyle Heights, the middle class drives whereas the working class takes transit. It’s not like here or in New York, where recent gentrifiers rarely own cars.
How did Calgary make it work?
Calgary is a metro area of somewhat more than a million people. Its economy is based on oil, and when oil prices were higher earlier this decade its average income was comparable to that of San Francisco; its politics is thoroughly conservative, which means there is no progressive impetus for walkability or green transit. Nonetheless, it built light rail lines that get about 100 million annual riders today. Its transit mode share is 16%, higher than that of any American metro area except New York (or, in the most restrictive definition, San Francisco). This is with no residential TOD to speak of: the vast majority of housing in Calgary is single-family and low-density, and from what I’ve seen there’s almost no dense residential development near the stations.
The big thing Calgary did was develop its CBD to be high-rise. In the early 1980s Calgary was a small, monocentric city, and since then it’s grown more monocentric, developing downtown parking lots as high-rise buildings. When I visited it had a more prominent high-rise downtown than Providence, a bigger and older metro area, and walking between the high-rises was reasonably pleasant.
In low-density cities with demand for more growth, the best opportunity appears to be centralizing jobs in the CBD. The straightforward application involves developing parking lots, as in Calgary, and relying on the private market to do the rest of the job. In both Nashville and Orlando, there are also more proactive approaches, specific to their urban layouts. In Nashville, the high job density at the medical center calls for developing a continuous corridor from the CBD, about 3 km long. This corridor could plausibly get an east-west subway, in contrast with the north-south subway in the rejected light rail plan. In Orlando, the Disney World cluster calls for some residential upzoning and sprawl repair around that area, which would strengthen the case for building a rail line between that area and the CBD.
Growing cities can use their growth to support more auto-oriented development (as the big American cities did in the postwar era) or to support more public transit. This is understood in cities that already have a transit-oriented core, but it’s equally true in cities that don’t really have any public transit, like the entire American Sunbelt. Calgary, starting with very low population, managed to build a decent if not great public transit network centered on its light rail system, and the same should be doable in American cities of comparable size and age.
Do Rich and Poor People Work in Different Neighborhoods?
There are workplaces where most employees are high-income, for example office towers (or office parks) hosting tech firms, law firms, or banks. There are workplaces where most employees are working-class, for example factories, warehouses, and farms. Does this lead to a difference in commuting patterns by class? I fired up OnTheMap two days ago and investigated. This is American data, so it stratifies workers by income, education, industry, or race rather than by job class. I generated maps for New York and saw the following:
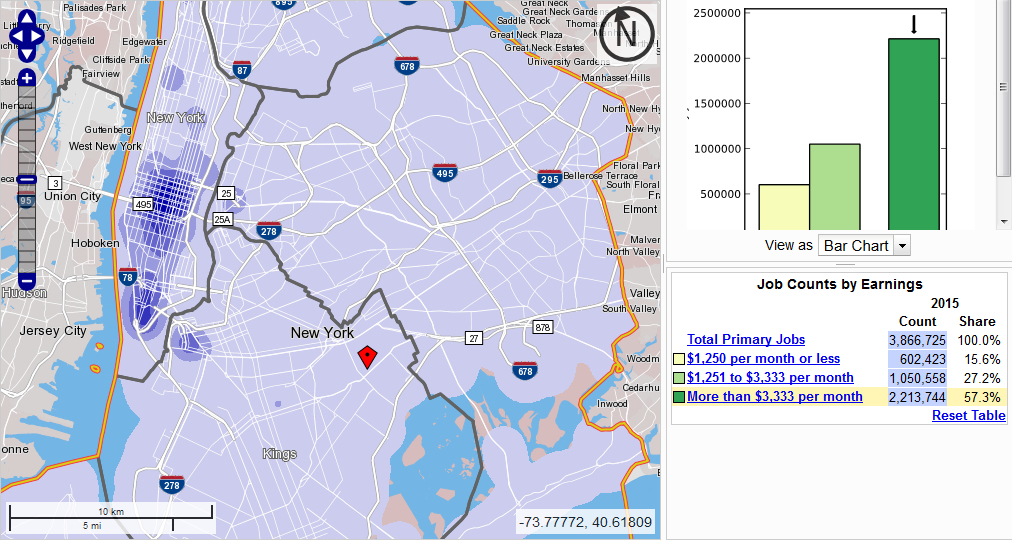
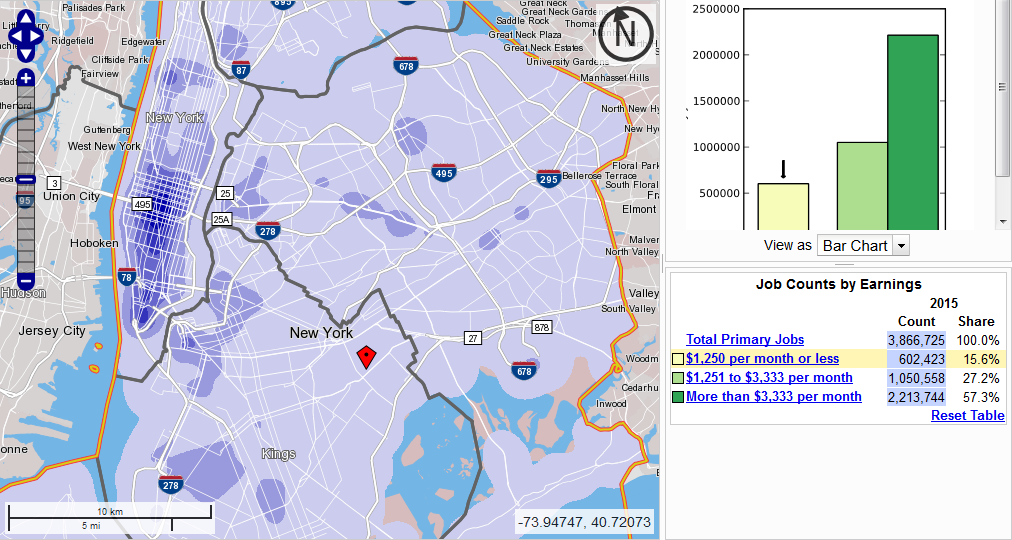
There are three income classes available, and I looked at the bottom and top ones, but the middle one, still skewed toward the working class, looks the same as the bottom class. The biggest observation is that Midtown is dominant regardless of income, but is more dominant for middle-class workers (more than $40,000 a year) than for low-income ones (up to $15,000, or for that matter $15,000-40,000).
The colors are relative, and the deepest shade of blue represents much more density for middle-class workers, even taking into account the fact that they outnumber under-$15,000 workers almost four to one. Among the lowest-income workers we see more work on Queens Boulevard and in Williamsburg, Flushing, and the Hub, but these remain tertiary workplaces at most. The only place outside Midtown, Lower Manhattan, or Downtown Brooklyn (which includes all city workers in Brooklyn due to how the tool works, so it looks denser than it is) that has even the third out of five colors for low-income workers is Columbia, where the low-income job density is one-third that of Midtown, and where there is also a concentration of middle-class workers.
The same pattern – job centers are basically the same, but there’s more concentration within the CBD for the rich – also appears if we look at individual neighborhoods. Here is the Upper East Side versus East Harlem:
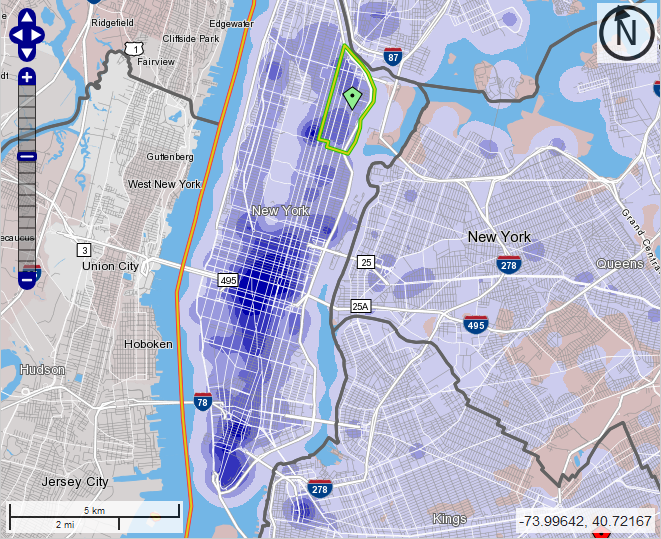
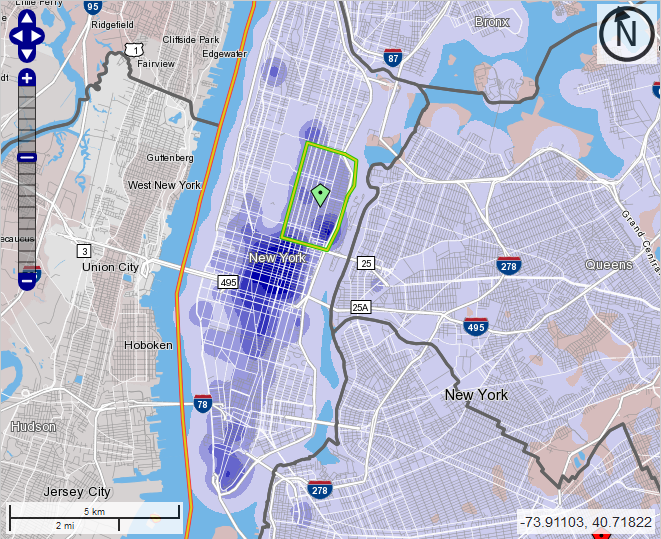
I chose these two neighborhoods to compare because they exhibit very large differences in average income and are on the same subway line. Potentially there could be a difference between where East Siders and West Siders work due to the difficulty of crosstown commuting, so I thought it would be best to compare different socioeconomic classes of people on the same line. With the East Side-only restriction, we see two Uptown job centers eclipse Columbia: Weill-Cornell Medical Center in Lenox Hill at the southeast corner of the Upper East Side, and Mount Sinai Hospital at the northwest corner.
One place where there is a bigger difference is the definition of Midtown. Looking at the general job distribution I’d always defined Midtown to range between 34th and 59th Street. However, there are noticeable differences by income:
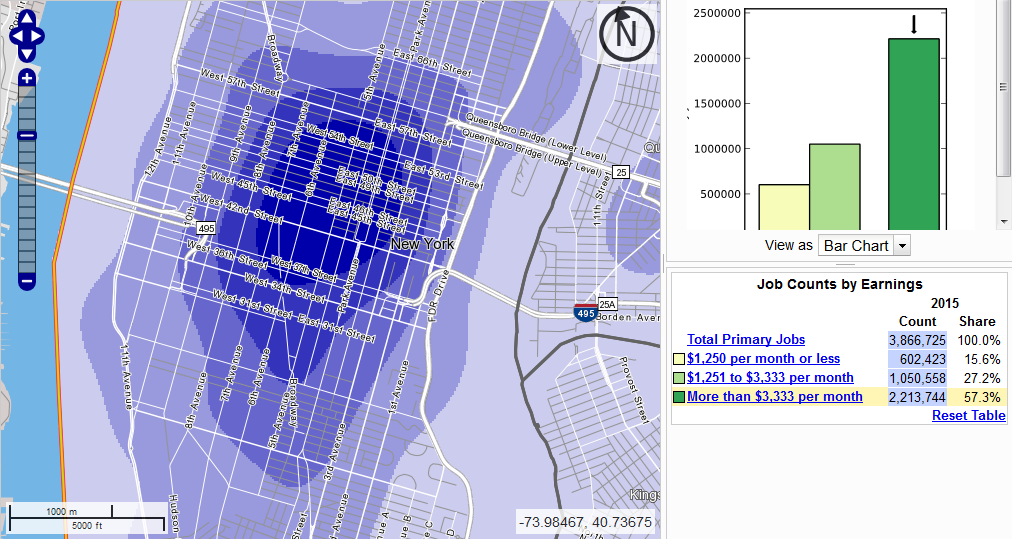
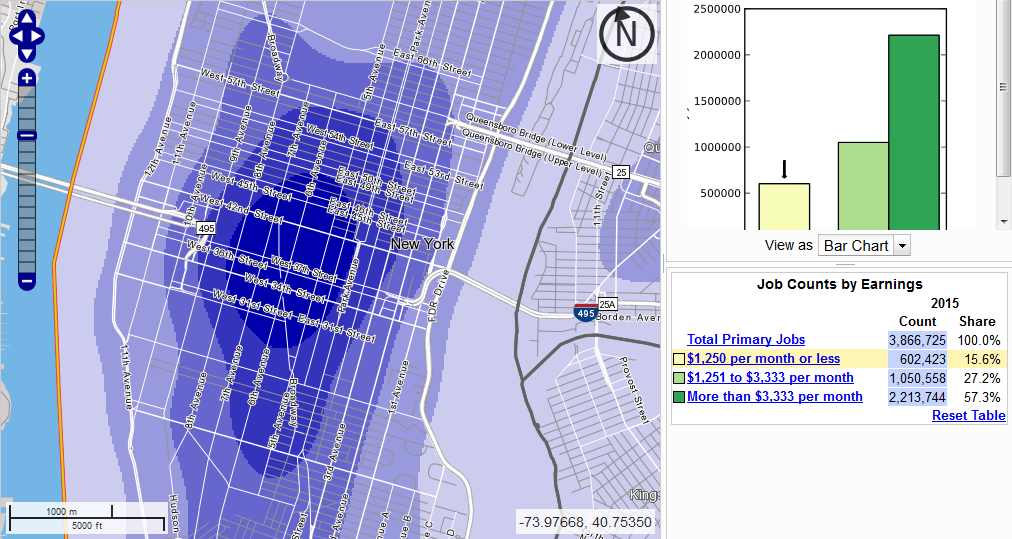
For the middle class, Midtown ranges from 34th to 57th Street and peaks around 47th. For the lowest-income workers, it ranges from 28th to 49th and peaks in the high 30s. My best explanation for this is that Midtown South and Union Square are more retail hubs than office hubs, featuring department stores and shopping centers, where the rich spend money rather than earning it.
In a deindustrialized country like the US or France, the working class no longer works in manufacturing or logistics. There are a lot of truck drivers today – 3.5 million in the US – but in 1920 the American railroad industry peaked at 2.1 million employees (source, PDF-p. 15), nine times today’s total, in a country with one third the population it has today and much less mobility. Manufacturing has plummeted as a share of employment, and is decreasing even in industrial exporters like Germany and Sweden. Instead, most poor people work at places that also employ many high-skill, high-income workers, such as hospitals and universities, or at places where they serve high-income consumption, such as retail and airports.
Since the working class works right next to the middle class, the nature of bosses’ demands of workers has also changed. Low-skill works now involves far more emotional labor; in Singapore, which makes the modern-day boss-worker relationships more explicit than the Anglosphere proper, there are signs all over the airport reminding workers to smile more. Nobody cares if auto workers smile, but they’re no longer a large fraction of the working class.
With the working class employed right next to the middle class, there is also less difference in commuting. For the most part, the same transportation services that serve middle-class jobs also serve working-class jobs and vice versa. This remains true even across racially segregated communities. The patterns of white New York employment are similar to those of middle-class New York employment, and those of black, Hispanic, and Asian employment are similar to those of the working class, with small differences (Asians are somewhat more concentrated in Flushing, and blacks in Downtown Brooklyn, reflecting the fact that blacks are overrepresented in public employment in the US and all city workers in Brooklyn are counted at Court Square).
This is true provided that opportunities for transportation are available without class segregation. This is not the situation in New York today. Commuter rail actually serves working-class jobs better than middle-class jobs, since Penn Station is closer to the department stores of 34th Street than to the office towers in the 50s. However, it’s priced for the middle class, forcing the working class to take slower buses and subway trains.
When I posted the above maps on Twitter, Stephen Smith chimed in saying that, look, the poor are less likely to work in the CBD than the middle class, so everywhere-to-everywhere public transportation is especially useful for them. While Stephen’s conclusion is correct, it is not supported by this specific data. In the $40,000 and up category, 57% of city jobs are in Manhattan south of 60th Street, compared with 37% in the $15,000-40,000 and under-$15,000 categories. It’s a noticeable difference, but not an enormous one. The reason Stephen is correct about how rides crosstown transit is different: people who can afford cars are very likely to drive if the transit option is not good (which it isn’t today), whereas people who can’t are stuck riding slow crosstown buses; in contrast, for CBD-bound commutes, the subway and commuter rail work reasonably well (especially at rush hour) and driving is awful.
Instead of trying to look specifically at low-income and middle- and high-income job centers, it’s better to just plan transit based on general commute patterns, and let anyone take any train or bus. This doesn’t mean business as usual, since it requires transitioning to full fare integration. Nor does this mean ignoring residential segregation by income, which in some cases can lead to transit segregation even in the face of fare integration (for example, the crosstown buses between the Upper East Side and Upper West Side have mostly white, mostly middle-class riders). Finally, this doesn’t mean relying on middle-class transit use patterns as a universal use case, since the middle class drives in the off-hours or to off-CBD locations; it means that relying on middle-class transportation needs could be reasonable. It just means that the rich and poor have substantially the same destinations.
An even bigger implication relates to questions of redevelopment. There have been periodic complaints from the left about gentrification of jobs, in which working-class job sites are turned over to high-end office and retail complexes. For example, Canary Wharf used to be the West India Docks. In New York, Jane Jacobs’ last piece of writing before she died was a criticism of Greenpoint rezoning, in which she specifically talked up the importance of keeping industrial jobs for the working class. But since the big deindustrialization wave, developments brought about by urban renewal, gentrification, and industrial redevelopment have not had any bias against providing employment for the poor. It’s not the factory jobs that the unionized working class still culturally defines itself by, but it’s industries that are hungry for low-skill work, and in many cases are serious target of unionization drives (such as universities).
When are Express Trains Warranted? Part 2: Subways
Last week, I wrote about which regional rail lines should run local and express trains and which should only run locals. I gave various guidelines, specific to that mode of transportation. The same question makes a lot of sense for subways (or elevated lines), and is especially important for large cities building new metro networks, typically in developing countries. The key difference is that subway trains almost always run so frequently that the only way to have local and express services is to build four-track mainlines, like in New York. So really, this is a question about when it’s useful to build four-track subways instead of two-track subways.
Costs
The cost of a four-track subway is higher than that of a two-track subway. However, the difference depends on the method of construction. Cut-and-cover four-track subways do not appear to be much more expensive than two-track subways; in the 1900s, New York had little to no cost premium over London or Paris. The First Subway’s underground segments, slightly less than half of which are four-track, cost $39 million per km in today’s money, compared with about $29 million per km in Paris in the same era (see sources in this post). The Metropolitan line in London cost about the same: £1.3 million for 6 km in the early 1860s, or about $30 million per km.
In contrast, boring four tracks appears to cost twice as much as boring two. It’s hard to find examples, since four-track bores are extremely rare; the examples I do know, such as the East River Tunnels and the tunnel carrying the Lexington Avenue Line under the Harlem River, are short. There are bound to be efficiencies in engineering and sitework reducing the cost of boring, just as there are with cut-and-cover, but the majority of the cost of tunneling is the boring and the systems. The majority of the rest is stations, and the local stations can be built for not much of a premium over stations on a two-track line, but the express stations require considerably more excavation.
What this means is that cities that build cut-and-cover should probably aim to build four tracks rather than two. In retrospect, Paris should have built Metro Line 1 with four tracks: the narrowest street segment, Rue de Rivoli, runs for 3 km and is about 20-23 meters wide, which can take four tracks if there are only local platforms, and everything else is at least 30 meters and could take four tracks and express platforms. The only express station under Rivoli would probably be Chatelet, where there is a wide square where the station footprint could expand.
The question of whether to use cut-and-cover today is a separate issue. It’s easier for the first few lines than for subsequent lines, which have to cross under the old lines. Nonetheless, it’s still in use, for example in China; the lack of express tracks on Chinese subways has led to criticism on some railfan forums, particularly by Japanese railfans, who are used to the fast express trains of the JRs through urban areas. But in India, the longest underground segment in Delhi, on the Yellow Line, appears to be bored, running deep under Old Delhi. The one potential pitfall is that bored tunnels, while generally more expensive to construct than cut-and-cover tunnels if wide streets are available, are nimbler, making it easier to build lines to high standards, with wide curves.
Benefits
The two obvious benefits of express subways are speed and capacity. New York averages a decent speed, just under 30 km/h, buoyed by express trains that average about 36 km/h. When frequency on both the local and express tracks is adequate, which it regrettably isn’t most of the time in New York, it’s possible to use cross-platform local/express transfers to improve trip times even for people on the local stations.
The capacity benefits are sometimes compromised by transfers. In New York, the express tracks are consistently more crowded than the local tracks on the main lines, and the Upper West Side in particular sees the city’s most overcrowded trains on the express tracks run alongside the second least crowded on the local tracks. However, on the East Side, the local and express trains under Lexington are both quite full. The number of passengers they carry would overwhelm any two-track line: to carry the same number of passengers on just two tracks at the current peak frequency, each train would need about 2,100 passengers, more per unit of train floor area than the most crowded Tokyo Metro lines.
There are also indirect effect of four-tracking. The most distant stations are presumably express-only, or, if not, passengers will transfer to an express train at the first opportunity. This means that adding local stops does not increase trip times for passengers far out, which in turn argues in favor of tighter stop spacing on local trains, to provide more coverage. Evidently, New York has one of the smallest interstations (on local trains) of any major metro network in the world, surpassed only by Paris, which built the Metro without regard for the suburbs. Second Avenue Subway, built with just two tracks, has wider stop spacing than other Manhattan north-south mainlines, missing 79th Street, with the planned phase 2 stopping at 106th instead of 103rd and 110th.
Network effects
I have hammered repeatedly that metro systems need to avoid three pitfalls of network planning:
- Tangential lines, starting as radial farther out but becoming circumferential closer in rather than staying radial and serving city center.
- Reverse-branching: a common trunk in an outlying area splitting into branches in city center, the opposite of the more normal branching arrangement.
- Missed connections, in which two lines intersect without a transfer.
It is easier to miss connections when the stop spacing is wider, because city centers are so small that line 1 can easily miss the road that line 6 will later run under. The Paris Metro has just one missed connection (M5/M14), and the city made a failed effort in the 1900s to bring Line 5 to what would be the transfer station, Gare de Lyon. New York has only two missed connections among the lines built from 1900 to the 1920s (Junius/Livonia on the 3/L, Bowling Green/Whitehall on the 4-5/RW), both of which are easy to fix; the city’s tens of misses come from a deliberate decision to avoid transfers in the lines built in the 1930s. Systems with wider stop spacing have more opportunities for missed connections, such as Tokyo, Shanghai, and Moscow.
Four-track mainlines short-circuit this problem doubly. First, fewer lines are required to provide the same coverage and capacity. On the eve of the Great Depression, New York had six subway mainlines, three with four tracks and three with two, and 2 billion annual riders. Even if a city insists that all transfer stations be express (which is the case in New York among lines built before the 1930s, though at one station express platforms were only retrofitted decades later), there are fewer potential intersections; at city center, even the express lines are unlikely to have very wide stop spacing.
Moreover, it’s fine to miss transfers on express lines. The reason missed connections are so bad is that the alternative option typically requires a three-seat ride. For example, the 1 passes between Columbus Circle-59th Street and 50th Street without a connection to the E train, leaving connecting passengers with one of two options: ride to Times Square and transfer there, which is both a detour and a very long walk between the platforms, or change to the B or D at 59th and then again to the E at 53rd; the latter option is the faster one, saving about 5 minutes of in-vehicle time and 3 minutes of transfer time.
But if one of the transfers is cross-platform, then a three-seat ride is less onerous. This is especially true if this transfer is local/express on a long shared trunk line, where the transfer stations usually don’t get as crowded as between two separate trunks. This means that it’s possible, if there is no better option, to have local-only transfers. Two of the top stations in New York, 53rd/Lex and Columbus Circle, are local-only transfers.
Scale
Small cities don’t need to think about express trains very much. Transit cities with about 2 million people in their metro areas, such as Vienna, Stockholm, Prague, Budapest, and Hamburg, make do with a handful of metro lines, sometimes supplemented by regional rail. But as they grow, the number of urban rail lines they need grows to the point that a coherent two-track network is too difficult, not to mention too slow. Paris manages to make do with the RER acting as the express layer, but outside India and Pakistan, cities that are just beginning to build their metro networks don’t have large legacy commuter rail networks to leverage for express service. In Africa between the Sahara and South Africa, nearly everything has to be built from scratch, and the same is true of Bangladesh and much of Southeast Asia and Latin America.
Moreover, in developing countries, a large number of cities either are megacities or can expect to grow to that size class soon. This is less true in Latin America, nearly all of which has at- or below-replacement birth rates, already high urbanization rates, and negative net migration (thus, the main case for four-track subways in Bogota hinges on the fact that the city has absurdly wide roads for cut-and-cover, not on future scale). However, in poor countries with high birth rates and low urbanization rates, cities can expect to increase their population many times over in the next few decades. Lagos and Dhaka are already huge, and midsize cities such as Nairobi, Kampala, Dar es Salaam, Addis Ababa, Khartoum, Accra, Abidjan, Douala, and Sanaa can expect to grow to that size class within a generation, as can midsize cities in countries with lower birth rates, such as Chittagong, Hanoi, and Ho Chi Minh City. In such cities, transportation planning should presume much greater scale than may seem warranted today.
A smaller-scale version of this principle can be found in cities that are growing rapidly due to immigration, especially Singapore but also Sydney, Melbourne, Toronto, Vancouver, and Stockholm. Such cities might want to consider infrastructure investments based not on their present-day population levels, but on those that they can expect after 30 more years of high migration rates. Vancouver and Stockholm are too small for express subways no matter what, and Toronto has already built its central spines with two tracks (and is upgrading its regional rail network to act as an express layer), but Singapore, Sydney, and Melbourne should all think about how to plan for the possibility that they will have 10 million people within 50 years.
