Category: Regional Rail
Do Rich and Poor People Work in Different Neighborhoods?
There are workplaces where most employees are high-income, for example office towers (or office parks) hosting tech firms, law firms, or banks. There are workplaces where most employees are working-class, for example factories, warehouses, and farms. Does this lead to a difference in commuting patterns by class? I fired up OnTheMap two days ago and investigated. This is American data, so it stratifies workers by income, education, industry, or race rather than by job class. I generated maps for New York and saw the following:
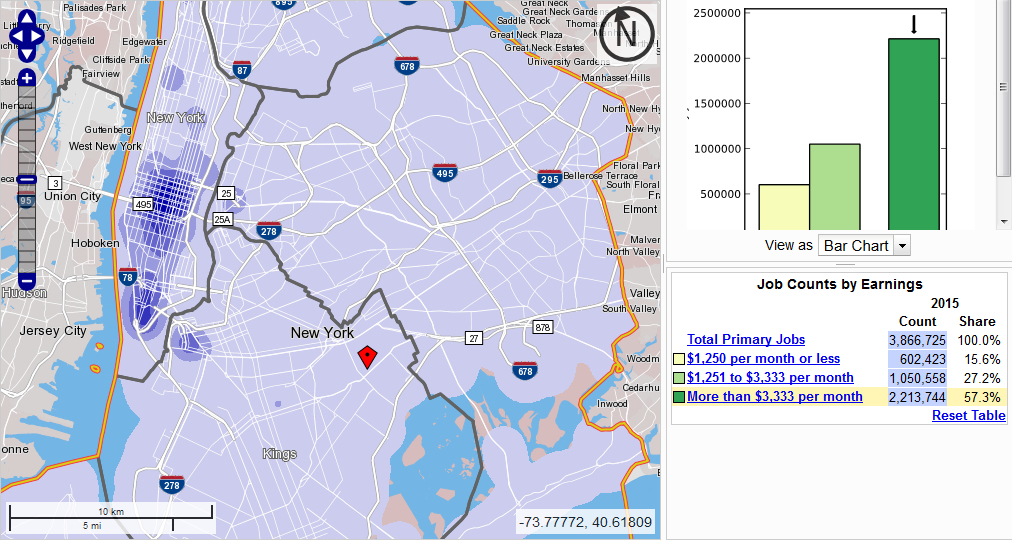
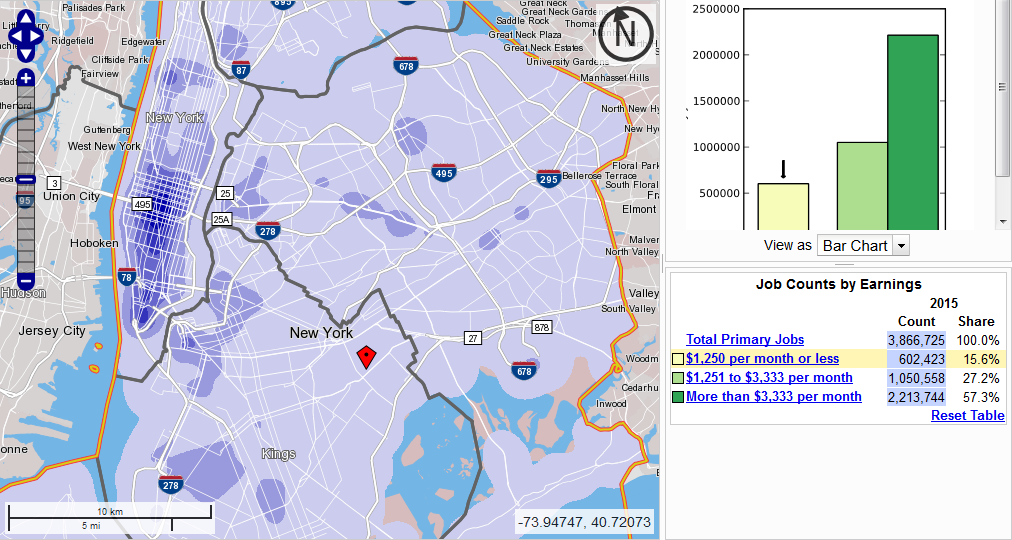
There are three income classes available, and I looked at the bottom and top ones, but the middle one, still skewed toward the working class, looks the same as the bottom class. The biggest observation is that Midtown is dominant regardless of income, but is more dominant for middle-class workers (more than $40,000 a year) than for low-income ones (up to $15,000, or for that matter $15,000-40,000).
The colors are relative, and the deepest shade of blue represents much more density for middle-class workers, even taking into account the fact that they outnumber under-$15,000 workers almost four to one. Among the lowest-income workers we see more work on Queens Boulevard and in Williamsburg, Flushing, and the Hub, but these remain tertiary workplaces at most. The only place outside Midtown, Lower Manhattan, or Downtown Brooklyn (which includes all city workers in Brooklyn due to how the tool works, so it looks denser than it is) that has even the third out of five colors for low-income workers is Columbia, where the low-income job density is one-third that of Midtown, and where there is also a concentration of middle-class workers.
The same pattern – job centers are basically the same, but there’s more concentration within the CBD for the rich – also appears if we look at individual neighborhoods. Here is the Upper East Side versus East Harlem:
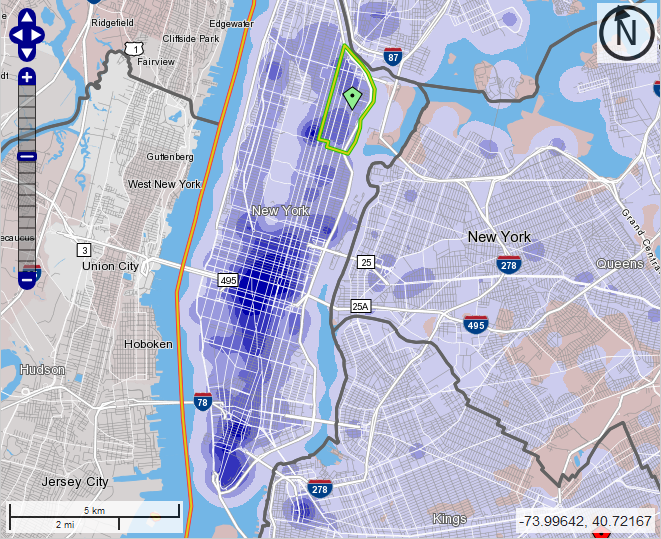
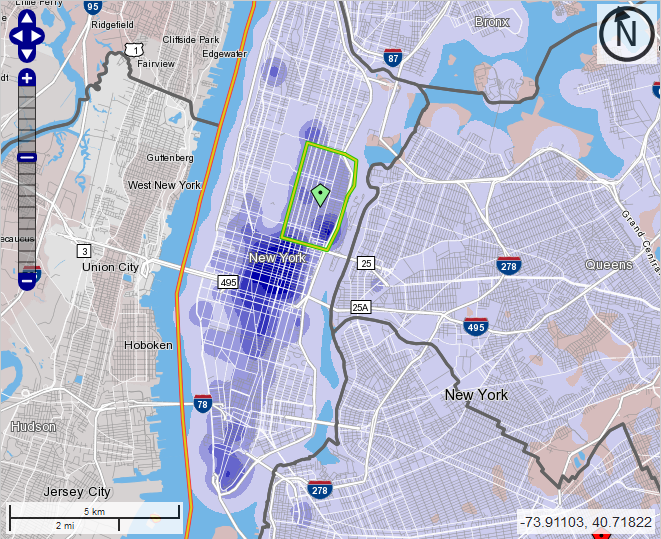
I chose these two neighborhoods to compare because they exhibit very large differences in average income and are on the same subway line. Potentially there could be a difference between where East Siders and West Siders work due to the difficulty of crosstown commuting, so I thought it would be best to compare different socioeconomic classes of people on the same line. With the East Side-only restriction, we see two Uptown job centers eclipse Columbia: Weill-Cornell Medical Center in Lenox Hill at the southeast corner of the Upper East Side, and Mount Sinai Hospital at the northwest corner.
One place where there is a bigger difference is the definition of Midtown. Looking at the general job distribution I’d always defined Midtown to range between 34th and 59th Street. However, there are noticeable differences by income:
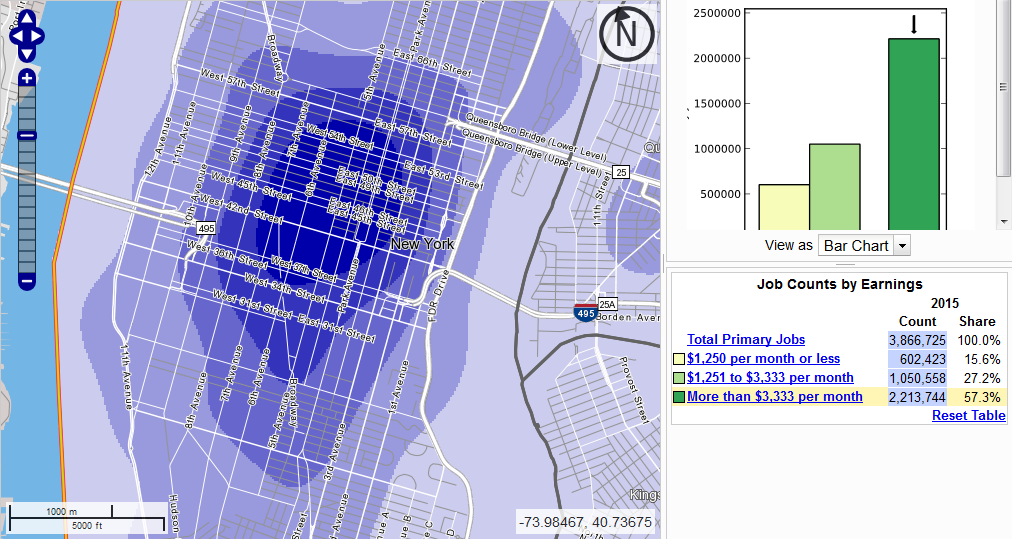
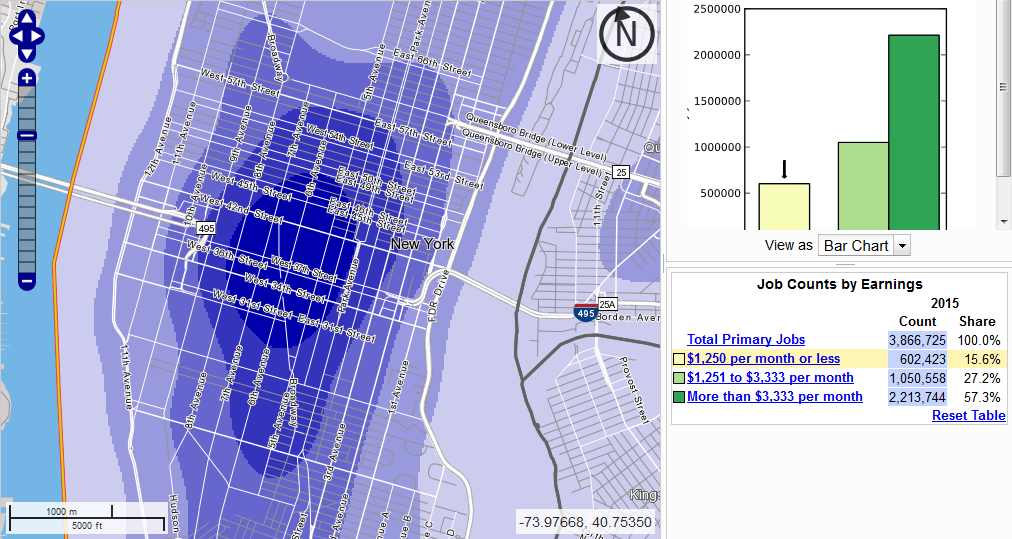
For the middle class, Midtown ranges from 34th to 57th Street and peaks around 47th. For the lowest-income workers, it ranges from 28th to 49th and peaks in the high 30s. My best explanation for this is that Midtown South and Union Square are more retail hubs than office hubs, featuring department stores and shopping centers, where the rich spend money rather than earning it.
In a deindustrialized country like the US or France, the working class no longer works in manufacturing or logistics. There are a lot of truck drivers today – 3.5 million in the US – but in 1920 the American railroad industry peaked at 2.1 million employees (source, PDF-p. 15), nine times today’s total, in a country with one third the population it has today and much less mobility. Manufacturing has plummeted as a share of employment, and is decreasing even in industrial exporters like Germany and Sweden. Instead, most poor people work at places that also employ many high-skill, high-income workers, such as hospitals and universities, or at places where they serve high-income consumption, such as retail and airports.
Since the working class works right next to the middle class, the nature of bosses’ demands of workers has also changed. Low-skill works now involves far more emotional labor; in Singapore, which makes the modern-day boss-worker relationships more explicit than the Anglosphere proper, there are signs all over the airport reminding workers to smile more. Nobody cares if auto workers smile, but they’re no longer a large fraction of the working class.
With the working class employed right next to the middle class, there is also less difference in commuting. For the most part, the same transportation services that serve middle-class jobs also serve working-class jobs and vice versa. This remains true even across racially segregated communities. The patterns of white New York employment are similar to those of middle-class New York employment, and those of black, Hispanic, and Asian employment are similar to those of the working class, with small differences (Asians are somewhat more concentrated in Flushing, and blacks in Downtown Brooklyn, reflecting the fact that blacks are overrepresented in public employment in the US and all city workers in Brooklyn are counted at Court Square).
This is true provided that opportunities for transportation are available without class segregation. This is not the situation in New York today. Commuter rail actually serves working-class jobs better than middle-class jobs, since Penn Station is closer to the department stores of 34th Street than to the office towers in the 50s. However, it’s priced for the middle class, forcing the working class to take slower buses and subway trains.
When I posted the above maps on Twitter, Stephen Smith chimed in saying that, look, the poor are less likely to work in the CBD than the middle class, so everywhere-to-everywhere public transportation is especially useful for them. While Stephen’s conclusion is correct, it is not supported by this specific data. In the $40,000 and up category, 57% of city jobs are in Manhattan south of 60th Street, compared with 37% in the $15,000-40,000 and under-$15,000 categories. It’s a noticeable difference, but not an enormous one. The reason Stephen is correct about how rides crosstown transit is different: people who can afford cars are very likely to drive if the transit option is not good (which it isn’t today), whereas people who can’t are stuck riding slow crosstown buses; in contrast, for CBD-bound commutes, the subway and commuter rail work reasonably well (especially at rush hour) and driving is awful.
Instead of trying to look specifically at low-income and middle- and high-income job centers, it’s better to just plan transit based on general commute patterns, and let anyone take any train or bus. This doesn’t mean business as usual, since it requires transitioning to full fare integration. Nor does this mean ignoring residential segregation by income, which in some cases can lead to transit segregation even in the face of fare integration (for example, the crosstown buses between the Upper East Side and Upper West Side have mostly white, mostly middle-class riders). Finally, this doesn’t mean relying on middle-class transit use patterns as a universal use case, since the middle class drives in the off-hours or to off-CBD locations; it means that relying on middle-class transportation needs could be reasonable. It just means that the rich and poor have substantially the same destinations.
An even bigger implication relates to questions of redevelopment. There have been periodic complaints from the left about gentrification of jobs, in which working-class job sites are turned over to high-end office and retail complexes. For example, Canary Wharf used to be the West India Docks. In New York, Jane Jacobs’ last piece of writing before she died was a criticism of Greenpoint rezoning, in which she specifically talked up the importance of keeping industrial jobs for the working class. But since the big deindustrialization wave, developments brought about by urban renewal, gentrification, and industrial redevelopment have not had any bias against providing employment for the poor. It’s not the factory jobs that the unionized working class still culturally defines itself by, but it’s industries that are hungry for low-skill work, and in many cases are serious target of unionization drives (such as universities).
When are Express Trains Warranted? Part 1: Regional Rail
The Regional Plan Association has a detailed regional rail proposal out. It’s the same one from the Fourth Plan that I’ve criticized here, on Streetsblog, and on Curbed, but with more explanation for how the service should run, with stopping patterns and frequency.
There are some good aspects there, like a section about the importance of electrification and multiple-units, though it stops short of calling for full electrification and replacement of locomotives with EMUs; the focus on off-peak frequency is also welcome. There are also bad ones, like the claim on p. 32 that it’s difficult to impossible to provide through-running using the existing Penn Station tracks used by New Jersey Transit. Foster Nichols told me that there are some difficulties with grades but they should be doable if NJT commits to an all-EMU fleet, and reminded me that the ARC studies judged through-running using these station tracks and new tunnels feasible. What he expressed to me as a difficulty turned into a near-impossibility in the report, in order to justify the $7 billion Penn Station South project.
But I want to focus on one particularly bad aspect of the proposal: the stopping patterns. The RPA is proposing three distinct stopping patterns on pp. 32-45, with three separate brands: Metro, in the city and some inner suburbs; Regional Express (RX), in the suburbs; and Trans-Regional Limited (TRL), providing intercity service to New Haven, Ronkonkoma, Philadelphia, and other major stations outside the built-up area. Even as the plan talks about the importance of making sure suburban trains serve urban stations in order to give them frequent service through overlay, the stopping patterns suggest the opposite.
The proposal involves trains from the suburbs expressing through most city stations (including the infill) even on two-track lines, like the Port Washington Branch. Metro trains would make all current stops plus additional infill to Bayside, and RX trains would only serve Willets Point, Flushing, and Bayside, and then run from Bayside to Port Washington. A similar pattern happens from Jamaica to Valley Stream, resulting in the Babylon, Long Beach, and Far Rockaway Branches all having to share a track pair. Moreover, the RX trains may themselves be divided into local and express trains, for example on the New Haven Line.
This is bad practice. On a two-track line, there’s no real reason to skip a handful of inner stations just to guarantee the outer ones express service. If anything, the need to schedule trains on the same tracks would lead to more fragile timetables, requiring more schedule padding. My analysis from 2.5 years ago found that the LIRR Main Line is padded 32% and the Babylon Branch is padded 19%: that is, the scheduled travel time on the Main Line (up to Ronkonkoma) is 32% more than the travel time imputed from line speed limits and current fleet acceleration performance. Patrick O’Hara, who the RPA study even quotes as a source elsewhere, investigated this issue separately, looking at best-case timetables, and found that some runs are padded 40-50%.
In Switzerland, trains are padded 7%, and I’m told that in Japan, after the Amagasaki accident showcased the safety problems of overly precise schedules, pads are about 5%. Express trains and locals mixed on the same line make it harder to maintain tight enough reliability for low schedule padding; this way, on an all-local line, trip times may match those of express trains on mixed lines, as they do in my analysis above. The best analogy is the RER B going to the north: the express trains are 4 minutes faster than the local trains, skipping 9 stops. The stop penalty on the RER B is higher, closer to 7 minutes over 9 stops, but the shared tracks with local trains (and with the RER D between Gare du Nord and Chatelet-Les Halles) means that there’s a fudge factor in the schedule, so it’s not possible to reliably do better than 4 minutes, and the trains end up visibly crawling on the mainline.
The reader familiar with technical transit advocacy in the Bay Area may interject, what about Caltrain? Clem Tillier has no trouble proposing timetables mixing local trains, express trains, and high-speed rail on the same track pair with timed overtakes, and a 7% pad. So why am I down on this concept in New York? The answer is line complexity. Caltrain is a simple two-track back-and-forth, and HSR is generally more punctual than legacy trains because it runs for long stretches on high-quality dedicated tracks, so it’s unlikely to introduce new variability to the line. In contrast, the RPA plan for regional rail in New York involves extensive branching, so that train schedules depend on trains elsewhere on the line. In this case, introducing more complexity through local/express sharing is likely to require more schedule padding, erasing the speed advantage.
In general, my questions to establish guidelines for where express trains are warranted are,
- How long is the line, measured in the number of stations? More stations encourage more express trains, because more stations can be skipped. In higher speed zones, stop penalties are higher, but at equal line length measured in km, higher speeds and fewer local stations reduce the benefit of express trains.
- How frequent are trains? At low frequency, local stations need more frequency, so express runs are less useful. At very high frequency, there may not be capacity for different stopping patterns unless the line has four tracks. On a two-track line, the optimum frequency for a local/express alternation is about 6-12 trains per hour, 3-6 local and 3-6 express, with a single mid-line overtake. Multiple overtakes on a single line are possible, but more fragile, so they are a bad idea except in special circumstances.
- What is the demand for travel? Express trains work best if there are a few distinguished stations at regular intervals, or else if the line is long and there is strong demand at the far end; if the inner stations are very strong then it’s more important to give them higher local frequency. When performing this analysis, it’s important to make sure station ridership levels reflect genuine demand rather than service. For example, Caltrain express stops have high ridership in large part because of their better service, not nearby density, as shown in Clem Tillier’s analysis. The LIRR Main Line has far more ridership at Mineola and Hicksville than the other stations on the trunk and also far more service, but Patrick explains that this is due to better highway access, so it’s genuine demand and not just a reflection of better service.
Caltrain needs express service because it has about 20 stations between San Francisco and San Jose, depending on the amount of infill and anti-infill desired; a target frequency of 8-10 peak trains per hour; and strong demand on the outer stations, especially for reverse-peak trips. In New York, none of the two-track lines meets the same standard. Some are too short, such as the Port Washington Branch. Others are too busy, such as the Harlem Line, Babylon Branch, and LIRR Main Line. Yet others have too much demand clustering in the inner stations, such as the Erie lines and the North Jersey Coast Line.
On four-track lines, it’s always easier to run express service. This doesn’t mean it should always be run: the upper New Haven Line is a strong candidate for relegating all commuter trains to the local tracks, making all stops, giving the express tracks to intercity trains. The Northeast Corridor Line in New Jersey is a dicey example: past Rahway there are four tracks, but intercity trains could run at very high speeds, making track sharing on the express tracks difficult. My service pattern map has express trains skipping Edison and Metuchen, but it’s just two stations, making it better to just run local beyond Rahway to clear the express tracks for high-speed rail.
It’s tempting to draw proposals involving intense metro-style regional rail service only serving the urban and inner-suburban stations; I’ve had to argue against such plans on some MBTA lines. The problem is that trains from the outer suburbs are still necessary and still going to pass through the inner suburbs, and in most cases they might as well stop at those stations, which need the frequency more than the outer suburbs need the few minutes of speedup.
I Gave a Pair of Talks in the Bay Area About Regional Rail
Thanks to the invitation of Adina Levin’s Friends of Caltrain, I came to the Bay Area for a few days, giving two talks about regional rail best industry practices in front of Friends of Caltrain, Seamless Bay Area, and SF Transit Riders. My schedule was packed, including a meeting with a world-leading expert in transportation systems in which I learned about the Barcelona bus service changes; a Q&A about both general and Bay Area-specific issues for Bay City Beacon subscribers; and several other meetings.
My two talks were in Mountain View and San Francisco, and used the same slides, with minor corrections. Here are the slides I used in San Francisco; I consolidated the pauses so that each page is a slide rather than a line in a slide. This was also covered in Streetsblog, which gives more background and gives some quotes from what I said during the presentation, not printed in the slides.
Unlike in my NYU presentation last year, I did not include a proposed map of service improvements. The reason is that in the Bay Area, there are more questions than answers about which service should use which piece of infrastructure. This makes fantasy maps dangerous, as they tend to fix people onto one particular service pattern, which may prove suboptimal based on decisions made elsewhere in the system. This is not a huge problem in New York or Boston, where the alignments naturally follow where the stub-end commuter lines are, with only a few questions; but in the Bay Area, the situation is more delicate, because big questions like “can/should Caltrain get a trans-Bay connection from San Francisco to Oakland and the East Bay?” can go either way.
The role of redevelopment in the area is especially important. Unlike New York, Paris, or other big transit cities, San Francisco does not have much density outside the city proper, Oakland, or Berkeley. Moreover, there is extensive job sprawl in Silicon Valley, which contributes to a last-mile problem for public transit; usually first-mile access is a bigger problem and high-end jobs tend to cluster near train stations. But conversely, the high incomes in the Bay Area and the growth of the tech industry mean that everywhere TOD is permitted in the core and the suburbs, it will be built. This impacts decisions about the total size of transit investment.
At present-day development patterns, San Francisco proper really doesn’t need more rail construction except Geary and the Downtown Extension, depending on construction costs. But general upzoning makes Geary worth it even at $1 billion per km and opens up the possibilities of four-tracking Caltrain within the city (which means expanding some tunnels), giving the N-Judah dedicated tracks and a dedicated tunnel under Mission, and extending the Central Subway to the north and northwest. The land use in the Richmond and Sunset Districts today supports a fair amount of transit, but not new subways if there’s no cost control.
New York-Area Governments to Form a Coordinated Transportation Planning Agency
Governors Andrew Cuomo (D-NY) and Phil Murphy (D-NJ) announced that they would cooperate to form a Lower Hudson Transportation Association, or LHTA, to supersede what they described as antiquated 20th-century thinking and bring the region’s transportation into the 21st century. LHTA would absorb the transportation functions of Port Authority, which senior New York state officials speaking on condition of anonymity called “irredeemably corrupt,” and coordinate planning across the region. Negotiations with the state of Connecticut are ongoing; according to planners in New Jersey, the timing for the announcement was intended to reassure people that despite the lack of federal funding for Gateway, a lower-cost modified version of the project would go forward.
But the first order of business for LHTA is not Gateway. The governors’ announcement mentioned that LHTA would begin by integrating the schedules and fares throughout the region. By 2019, passengers will be able to transfer between the New York City Subway and PATH for free, and connect from the subway to the AirTrain JFK paying only incremental fare. Engineering studies for removing the false walls between PATH and F and M subway platforms are about to begin.
Commuter rail fare integration is also on the table. Currently, the fare on the subway is a flat $2.75. On commuter rail, it is higher even within New York City: a trip between Jamaica Station and New York Penn Station, both served by the E line of the subway, is $10.25 peak or $7.50 off-peak on the Long Island Railroad (LIRR). The governors announced that they would follow the lead of European transportation associations, such as Ile-de-France Mobilités in Paris, and eliminate this discrepancy under LHTA governance, which also includes revenue sharing across agencies. Detailed studies are ongoing, but in 2019, LHTA will cut commuter rail fares within New York City and several inner cities within New Jersey, including Newark, to be the same as the subway fare, with free transfers.
Simultaneously, LHTA will develop a plan for schedule integration, coordinating New Jersey Transit, the LIRR, Metro-North, and suburban bus agencies. In order to make it easier for suburban passengers to reach commuter rail stations, the suburban buses will be timed to just meet the commuter trains, with a single ticket valid for the entire journey. Today most passengers in the suburbs drive to the commuter rail stations, but the most desirable park-and-rides are full. Moreover, the states would like to redevelop some of the park-and-rides as transit-oriented development, building dense housing and retail right next to the stations in order to encourage more ridership.
Moreover, the LIRR and New Jersey Transit’s commuter trains currently stub-end at Penn Station in opposite directions. LHTA is studying French and German models for through-running, in which trains from one suburb run through to the other instead of terminating at city center. Planners within several agencies explain that the systems on the Long Island and New Jersey side are currently incompatible – for example, LIRR trains are electrified with a third rail whereas New Jersey Transit trains are electrified with high-voltage catenary – but reorganizing these systems for compatibility can be done in a few years, well before the Gateway project opens.
In response to a question about the cost of this reorganization, one of the planners cited the Swiss slogan, “electronics before concrete.” Per the planner, electronics include systems, electrification, and software, all of which are quite cheap to install, whereas pouring concrete on new tunnels and viaducts is costly. The planner gave the example of resignaling on the subway: the New York Times pegged the cost of modernizing subway signals at $20 billion, and this could increase capacity on most lines by 25 to 50 percent. But the cost of building the entire subway from scratch at today’s costs in New York is likely to run up to $200 billion.
But while the immediate priorities involve fare and schedule integration, LHTA’s main focus is the Gateway project. There are only two commuter rail tracks between New Jersey and Penn Station, and they are full, running a train every 2.5 minutes at rush hour. The Gateway project would add two more tracks, doubling capacity. The currently projected cost for the tunnel is $13 billion, but sources within New York said that this number can be brought down significantly through better coordination between the agencies involved. This way, it could be funded entirely out of local and state contributions, which add up to $5.5 billion. When pressed on this matter, officials and planners refused to say outright whether they expect $5.5 billion to be enough to cover the tunnel, but some made remarks suggesting it would be plausible.
Previous estimates for the costs of Gateway adding up to $30 billion include substantial extra scope that is not necessary. Sources on both sides of the Hudson report that the main impetus for the formation of LHTA was to coordinate schedules in a way that would make this extra scope no longer necessary. “With last decade’s ARC, there was a cavern under Penn Station to let trains reverse direction and go back to New Jersey,” explains one of the planners; ARC was a separate attempt to add tracks to the Hudson rail crossing to Penn Station, which Republican Governor Chris Christie canceled in 2010 shortly after his election. “With Gateway, there was the plan for Penn Station South, condemning an entire Manhattan block for the station for $7 billion. With the plans we’re developing with LHTA we don’t need either Penn South or a cavern to let trains run between stations.”
Moreover, some planners suggested reactivating plans to connect Penn Station and Grand Central as part of Gateway. They refused to name a cost estimate, but suggested that at the low end it could be funded out of already-committed state money. Under this plan, there would be through-running between not just New Jersey Transit and the LIRR but also Metro-North, serving the northern suburbs of New York and Connecticut. Sources at the Connecticut Department of Transportation said they are studying the plan and have reservations but are overall positive about it, matching the reports of sources within New York, who believe that Connecticut DOT will join LHTA within six months.
Officials are optimistic about the effects of LHTA on the region both privately and publicly. The joint press release referred to the metro area as “a single region, in which decisions made in far apart areas of New York nonetheless affect people in New Jersey and vice versa.” Planners in both states cited examples of friends and family in the other state who they would visit more often if transportation options were better. With better regional rail integration, they said, people would take more trips, improving regional connectivity, and take fewer trips by car, reducing traffic congestion and pollution.
New Hudson Tunnels Are Canceled. Again.
Amtrak’s Gateway project, spending $30 billion on new tunnels from New Jersey to Penn Station, just got its federal funding yanked. Previously the agreement was to split funding as 25% New York, 25% New Jersey, 50% federal; the states had committed to $5.5 billion, which with a federal match would build the bare tunnels but not some of the ancillary infrastructure (some useful, some not).
When Chris Christie canceled ARC in 2010, then estimated at $10-13 billion, I cheered. I linked to a YouTube video of the song Celebration in Aaron Renn‘s comments. ARC was a bad project, and at the beginning Gateway seemed better, in the sense that it connected the new tunnels to the existing station tracks and not to a deep cavern. But some elements (namely, Penn Station South) were questionable from the start, and the cost estimate was even then higher than that of ARC, which I attributed to both Amtrak’s incompetence and likely cost overruns on ARC independent of who managed it.
But I’m of two minds about to what extent good transit advocates should cheer Gateway’s impending demise. The argument for cheering is a straightforward cost-benefit calculation. The extra ridership coming from Gateway absent regional rail modernization is probably around 170,000 per weekday, a first-order estimate based on doubling current New Jersey Transit ridership into Penn Station. At $40,000 per weekday rider, this justifies $7 billion in construction costs, maybe a little more if Gateway makes it cheaper to do maintenance on the old tunnels. Gateway is $30 billion, so the cost is too high and the tunnel should not be built.
Moreover, it’s difficult to raise the benefits of Gateway using regional rail modernization. On the New Jersey side, population density thins fast, so the benefits of regional rail that do not rely on through-running (high frequency, fare integration, etc.) are limited. The main benefits require through-running, to improve access on Newark-Queens and other through-Manhattan origin-destination pairs. Gateway doesn’t include provisions for through-running – Penn Station South involves demolishing a Manhattan block to add terminal tracks. Even within the existing Penn Station footprint, constructing a new tunnel eastward to allow through-running becomes much harder if the New Jersey Transit tracks have heavy terminating traffic, which means Gateway would make future through-running tunnels more expensive.
But on the other hand, the bare tunnels are not a bad project in the sense of building along the wrong alignment or using the wrong techniques. They’re just extremely expensive: counting minor shoring up on the old tunnels, they cost $13 billion for 5 km of tunnel. Moreover, sequencing Gateway to start with the tunnels alone allows dropping Penn South, and might make it possible to add a new tunnel for through-running mid-project. So it’s really a question of how to reduce costs.
The underground tunneling portion of Second Avenue Subway is $150 million per km, and that of East Side Access is $200 million (link, PDF-p. 7). Both figures exclude systems, which add $110 million per km on Second Avenue Subway, and overheads, which add 37%. These are all high figures – in Paris tunneling is $90 million per km, systems $35 million, and overhead a premium of 18% – but added up they remain affordable. A station-free tunnel should cost $350 million per km, which has implications to the cost of connecting Penn Station with Grand Central. Gateway is instead around $2 billion per km.
Is Gateway expensive because it’s underwater? The answer is probably negative. Gateway is only one third underwater. If its underwater character alone justifies a factor of six cost premium over Second Avenue Subway, then other underwater tunnels should also exhibit very high costs by local standards. There aren’t a lot of examples of urban rail tunnels going under a body of water as wide as the Hudson, but there are enough to know that there is not such a large cost premium.
In the 1960s, one source, giving construction costs per track-foot, finds that the Transbay Tube cost 40% more than the bored segments of BART; including systems and overheads, which the source excludes, BART’s history gives a cost of $180 million, equivalent to $1.38 billion today, or $230 million per km. The Transbay Tube is an immersed tube and not a bored tunnel, and immersed tubes are overall cheaper, but a report by Transport Scotland says on p. 12 that immersed tubes actually cost more per linear meter and are only overall cheaper because they require shorter approaches, which suggests their overall cost advantage is small.
Today, Stockholm is extending the T-bana outward in three direction. A cost breakdown per line extension is available: excluding the depot and rolling stock, the suburban tunnel to Barkarby is $100 million per km, the outer-urban tunnel to Arenastaden in Solna is $138 million per km, and the part-inner urban, part-suburban tunnel to Nacka is $150 million per km. The tunnel to Nacka is a total of 11.5 km, of which about 1 is underwater, broken down into chunks using Skeppsholmen, with the longest continuous underwater segment about 650 meters long. A 9% underwater line with 9% cost premium over an underground line is not by itself proof of much, but it does indicate that the underwater premium is most likely low.
Based on the suggestive evidence of BART and the T-bana, proposing that bare Hudson tunnels should cost about $2-2.5 billion is not preposterous. With an onward connection to Grand Central, the total cost should be $2.5-3 billion. Note that this cost figure does not assume that New York can build anything as cheaply as Stockholm, only that it can build Gateway for the same unit cost as Second Avenue Subway. The project management does not have to be good – it merely has to be as bad as that of Second Avenue Subway, rather than far worse, most likely due to the influence of Amtrak.
The best scenario coming out of canceling Gateway is to attempt a third tunnel project, this time under a government agency that is not poisoned by the existing problems of either Amtrak or Port Authority. The MTA could potentially do it; among the agencies building things in the New York area it seems by far the least incompetent.
If Gateway stays as is, just without federal funding, then the solution is for Amtrak to invest in its own project management capacity. The cost of the Green Line Extension in Boston was reduced from $3 billion to $2.3 billion, of which only $1.1 billion is actual construction and the rest is a combination of equipment and sunk cost on the botched start of the project; MBTA insiders attribute this to the hiring of a new, more experienced project manager. If Gateway can be built for even the same unit cost as Second Avenue Subway, then the existing state commitments are enough to build it to Grand Central and still have about half the budget left for additional tunnels.
Boston Regional Rail
At TransitMatters, we have finally released our regional rail paper, recommending improvements to the MBTA that regular readers of this blog are probably familiar with. Alert readers might even want to probe which parts were written by me and which by others; the main document underwent several edits but some stylistic differences might persist, and the appendices were mostly written individually. We are suggesting the following two-step process:
1. Modernize the system based on best industry practices. This includes full electrification and fleet replacement with electric multiple units (and not electric locomotives), high platforms at all stations, and high frequency all day, every half hour on every branch interlining to support a train every 10-15 minutes on urban trunk lines. In some areas, such as Revere, there should also be infill stops. The capital cost, excluding fleet replacement, should be on the order of $2-3 billion, but the first priority, the Providence Line, is maybe $100 million excluding rolling stock, mostly going to high platforms.
2. Build the North-South Rail Link, with four tracks connecting the South Station and North Station systems. This takes longer than electrification, so planning should start immediately, with the intention of opening somewhat after the entire system is wired. The capital cost should be $4-6 billion, per a study that we’re referencing in our report.
In my mind, regional rail serves three main markets:
1. Local trips on trunk lines, connecting to urban neighborhoods and subway transfer points. The main benefit of regional rail is that it provides an express subway at very high frequency, just as I use the RER to get to Western Paris faster than I would on the Metro. In Boston, areas that would benefit include Forest Hills, Allston and Brighton, Hyde Park, Dorchester and Mattapan along the Fairmount Line, Chelsea, Revere, and Porter Square. Residents of these neighborhoods are likely to travel to other neighborhoods and not just to Downtown Boston.
2. Suburban trips, which are dominated by peak commutes; I complained here that US commuter rail demand is peaky, with 67-69% of suburban trips on the LIRR and Metro-North and 80% on the MBTA occurring in the morning peak compared with around 47% on Transilien, but this is in large part about land use and not just frequency. We’re calling for replacing park-and-rides with town center stations in the report, but absent extensive transit-oriented development, suburban trips are likely to remain peaky and CBD-bound. This is the only market North American commuter rail serves, and its users are territorial about what they view as their trains. However, electrification would speed up these trips materially (the Sharon-South Station trip time would go from 35 to 23 minutes), and the North-South Rail Link would offer North Side suburbs access to the CBD, which is too far from North Station.
3. Intercity trips, which are not peaky except insofar as some people commute. Those tend to dominate off-peak ridership today: per a CTPS study from 2012, about half of the Providence Line’s off-peak ridership originates in Providence itself, which also accords with my observations taking the line on weekends. These trips gain less from high frequency, but need a consistent frequency all day, every day, at worst every 30 minutes, ideally every 15 or 20. Regional rail modernization also speeds these trips the most.
Bear in mind that even though the report just came out, the actual writing was for the most part done in November. This means that the technical aspects of scheduling reflect my thinking in November and not now. At the time, I hadn’t thought about peak-to-base ratios systematically, so my sample schedule for the Providence Line has a train every 15 minutes on each branch (Providence and Stoughton) at the peak and a train every 30 minutes off-peak. I had been assuming a peak-to-base ratio of 2 would be appropriate, by comparison with schedules in Tokyo and on the RER here in Paris. I knew that the ratio was lower in some other places I think highly of, including London and the German-speaking world, but my assumption had been that demand would be so peaky that the maximum acceptable peak-to-base ratio was the correct one.
I’ve argued before that the peak-to-reverse-peak ratio must be 1 or as close to it as practical, in order to avoid parking trains in city center midday. The capacity problems at South Station, which averages a train arrival per platform track per 35 minutes at the peak even though the system is capable of 10-minute turnaround times, come from trains going from the platform tracks to the layover yard during the peak, crossing the station throat at-grade and delaying peak arrivals.
But recently, I started thinking more carefully about operating costs, and wrote this post about peak-to-base ratios. I no longer think peak-to-base frequency ratios higher than 1 are supportable. The marginal labor cost of midday service when there’s a prominent peak is very low, since the railroad would be replacing split shifts with regular shifts, and this encourages running the same frequency during rush hour and midday, if not during the evening and on weekends. And as I explain in the linked post, the cost of rolling stock purchase and maintenance encourages running trains as often as possible. Only energy costs scale linearly with service-km, and those are low: at New England’s current electricity rates, it costs $180 to run a 320-ton 8-car EMU between Providence and Boston each way, and at current fares, inducing 16 extra passengers from the extra frequency is enough to make this pay.
In the report, we talk about American commuter rail operating costs, mostly because that’s what’s available. SEPTA’s are $311/car-hour, whereas those of the LIRR, Metro-North, New Jersey Transit, Metra, and the MBTA are $500-600/car-hour. Per car-km, SEPTA costs about $9 to operate. But a system built around cost minimization, with a peak-to-base ratio of 1 (thus, relatively empty off-peak trains), can get this down to about $2/car-km, or about $180/car-hour.
The reason I think the MBTA could run modern regional rail for $2/car-km, where the RER costs $6/car-km and the Singapore MRT $4-5/car-km, is that the schedule is faster. The costs of rolling stock and labor are based on time rather than distance, and the regional rail system we’re proposing has aggressive schedules, averaging 90 km/h between Boston and Providence. Even energy costs can be contained, since a fast schedule implies relatively few stops. For the same reason it’s easier to make a profit on high-speed rail averaging 200 km/h than on low-speed rail, it’s easier to make a profit on a 90 km/h train at the boundary between regional and intercity scale than on a 40 km/h local train.
In general, I believe that transit planning has to be opportunistic: no city is perfect, so it’s always necessary to find workarounds for some local misfeatures, or ways to turn them into positives. In Boston, the misfeature is very low suburban density, making intense regional service modeled after the RER less useful. The opportunity lies in retooling lines that serve low-density suburbs as intercity lines, connecting Boston with Worcester, Providence, Lowell, Nashua, and Hyannis. With the exception of Worcester, which is on a curvy line, these cities can be connected to Boston at an average speed of 90 km/h or so: the stop spacing is so sparse, and the lines are so straight, that long stretches of 160 km/h are feasible.
But none of this can happen under the present-day operating paradigm. The opportunity I’m describing relies on postwar travel patterns and to some extent even on 21st-century ones (namely, university travel between Providence and Cambridge), which requires reforming frequencies, rolling stock, and infrastructure decisions to incorporate best industry practices that emerged from the 1970s onward. The MBTA can offer a fast, affordable, frequent regional transportation system from as far north as Manchester to as far south as Providence, but for this it needs to implement the regional rail improvements we’re proposing.
What the Spinetta Axe Reveals About Cost Control
The Macron administration commissioned a report about the future of SNCF by former Air France chief Jean-Cyril Spinetta. Spinetta released his report four days ago, making it clear that rail is growing in France but most of the network is unprofitable and should be shrunk. There is an overview of the report in English on Railway Gazette, and some more details in French media (La Tribune calls it “mind-blowing,” Les Echos “explosive”); the full proposal can be read here. Some of the recommendations in the Spinetta report concern governance, but the most radical one calls for pruning about 45% of SNCF’s network by length, which carries only 2% of passenger traffic. Given the extent of the proposed cut, it’s appropriate to refer to this report as the Spinetta Axe, in analogy with the Beeching Axe.
I wrote a mini-overview on Twitter, focusing on the content of the Axe. In this post I’m going to do more analysis of SNCF’s cost control problem and what we can learn from the report. The big takeaway is that cost control pressure is the highest on low-ridership lines, rather than on high-ridership lines. There is no attempt made to reduce SNCF’s operating costs in Ile-de-France or on the intercity main lines through better efficiency. To the British or American reader, it’s especially useful to read the report with a critical eye, since it is in some ways a better version of British and American discussions about efficiency that nonetheless accept high construction costs as a given.
SNCF is Losing Money
The major problem that the report begins with is that SNCF is losing money. It is not getting state subsidies, but instead it borrows to fund operating losses, to the tune of €2.8 billion in annual deficit (p. 28), of which €1.2-1.4 billion come from interest expenses on past debt and €1 billion come from taxes. Its situation is similar to that of Japan National Railways in the 1970s, which accumulated debt to fund operating losses, which the state ultimately wiped out in the restructuring and privatization of 1987. The report is aiming to find operating savings to put SNCF in the black without breaking up or privatizing the company; its proposed change to governance (turning SNCF into an SA) is entirely within the state-owned sector.
Unlike the Beeching report, the Spinetta report happens in a context of rising rail traffic. It opens up by making it clear that rail is not in decline in France, pointing out growth in both local and intercity ridership. However, SNCF is still losing money, because of the low financial performance of the legacy network and regional lines. The TGV network overall is profitable (though not every single train is profitable), but the TERs are big money pits. Annual regional contributions to the TER network total €3 billion, compared with just €1 billion in fare revenue (p. 30). The legacy intercity lines, which are rebranded every few years and are now called TETs, lose another €300 million. Some of the rising debt is just capital expenses that aren’t fully funded, including track renovation and new rolling stock; even in the Paris region, which has money, rolling stock purchase has only recently been devolved from SNCF to the regional transport association (p. 31).
In fact, the large monetary deficit is a recent phenomenon. In 2010, SNCF lost €600 million, but paid €1.2 billion in interest costs (p. 27); its operating margin was larger than its capital expenses. Capital expenses have risen due to increase in investment, while the operating margin has fallen due to an increase in operating costs. The report does not go into the history of fares (it says French rail fares are among Europe’s lowest, but its main comparisons are very high-fare networks like Switzerland’s, and in reality France is similar to Germany and Spain). But it says fares have not risen, for which SNCF’s attempt to provide deliberately uncomfortable lower-fare trains must share the blame.
The Spinetta Axe
The Spinetta report proposes multiple big changes; French media treats converting SNCF to an SA as a big deal. But in terms of the network, the biggest change is the cut to low-performing rail branches. The UIC categorizes rail lines based on traffic levels and required investment, from 1 (highest) to 9 (lowest). Categories 7-9 consist of 44% of route-km but only 9% of train-km (p. 48) and 2% of passengers (p. 51). Annual capital and operating spending on these lines is €1.7 billion (about €1 per passenger-km), and bringing them to a state of good repair would cost €5 billion. In contrast, closing these lines would save €1.2 billion a year.
But the report is not just cuts. Very little of SNCF’s operating expenditure is marginal: on p. 34 the report claims that marginal operating costs only add up to €1 billion a year, out of about €5.5 billion in total operating costs excluding any and all capital spending. As a result, alongside its recommendations to close low-ridership lines, it is suggesting increasing off-peak frequency on retained lines (p. 54, footnote 53).
There is no list of which lines should be closed; this is left for later. Page 50 has a map of category 7-9 lines, which are mostly rural branch lines, for example Nice-Breil-Tende. But a few are more intense regional lines, around Lyon, Toulouse, Rennes, Lille, and Strasbourg, and would presumably be kept and maintained to higher standards. Conversely, some category 5-6 lines could also be closed.
The report is equally harsh toward the TGV. While the TGV is overall profitable, not all parts of it are competitive. Per the report, the breakeven point with air travel, on both mode share and operating costs, is 3 hours one-way. At 3:30-4 hours one way, the report describes the situation for trains as “brutal,” with planes getting 80% mode share (p. 61). With TGV operating costs of €0.06/seat-km without capital (€0.07 with), it is uncompetitive on cost with low-cost airlines beyond 700 km, where EasyJet and Air France can keep costs down to €0.05/seat-km including capital and Ryanair to €0.04.
And this is where the report loses me. The TGV’s mode share versus air is consistently higher than that given in the report. One study imputes a breakeven point at nearly 4 hours. A study done for the LGV PACA, between Marseille and Nice, claims that as of 2009, the TGV had a 30% mode share on Paris-Nice, even including cars; its share of the air-rail market was 38%. This is a train that takes nearly 6 hours and was delayed three out of four times I took it, and the fourth time only made it on time because its timetable was unusually padded between Marseille and Paris. On Paris-Toulon, where the TGV takes about 4 hours, its mode share in 2009 was 54%, or 82% of the air-rail market.
SNCF has some serious operating cost issues. For example, the conventional TGVs (i.e. not the low-cost OuiGo) have four conductors per 200-meter train; the Shinkansen has three conductors per 400-meter train. The operating costs imputed from the European and East Asian average in American studies are somewhat lower, about $0.05-6/seat-km, or about €0.04-5/seat-km, making HSR competitive with low-cost airlines at longer range. However, there is no attempt to investigate how these costs can be reduced. One possibility, not running expensive TGVs on legacy lines but only on high-speed lines, is explicitly rejected (p. 64), and rightly so – Rennes, Toulouse, Mulhouse, Toulon, Nice, and Nantes are all on legacy lines.
This is something SNCF is aware of; it’s trying to improve fleet utilization to reduce operating costs by 20-30%. With higher fleet utilization, it could withdraw most of its single-level trains and have a nearly all-bilevel fleet, with just one single-level class, simplifying maintenance and interchangeability in similar manner to low-cost carriers’ use of a single aircraft class. However, this drive is not mentioned at all in the report, which takes today’s high costs as a given.
Efficiencies not Mentioned
The biggest bombshell I saw in the report is not in the recommendations at all. It is not in the Spinetta Axe, but in a table on p. 21 comparing SNCF with DB. The two networks are of similar size, with DB slightly larger, 35,000 route-km and 52,000 track-km vs. 26,000 and 49,000 on SNCF. But DB’s annual track maintenance budget is €1.4 billion whereas SNCF’s is €2.28 billion. Nearly the entire primary deficit of SNCF could be closed just by reducing track maintenance costs to German levels, without cutting low-usage lines.
Nonetheless, there is no investigation of whether it’s possible to conduct track maintenance more efficiently. Here as with the TGV’s operating expenses, the report treats unit costs as a fixed constant, rather than as variables that depend on labor productivity and good management.
Nor is there any discussion of rolling stock costs. Paris’s bespoke RER D and E trains, funded locally on lines to be operated by SNCF, cost €4.7 million per 25 meters of train length, with 30% of this cost going to design and overheads and only 70% to actual manufacturing. In Sweden, the more standard KISS cost €2.9 million per 25-meter car.
Low-ridership dilapidated rural branch lines are not the only place in the network where it’s possible to reduce costs. Rolling stock in Paris costs too much, maintenance on the entire network costs too much, TGV operating costs are higher than they should be, and fleet utilization in the off-peak is very low. The average TGV runs for 8 hours a day, and SNCF hopes to expand this to 10.
The Impetus for Cost Control
The Beeching Axe came in the context of falling rail traffic. The Spinetta Axe comes in the context of rapidly growing SNCF operating costs, recommending things that could and probably should have been done ten years ago. But ten years ago, SNCF had a primary surplus and there was no pressure to contain costs. By the same token, the report is recommending pruning the weakest lines, but ignores efficiencies on the strong lines, on the “why mess with what works?” idea.
The same effect is seen regionally. French rolling stock costs do not seem unusually high outside Paris. But Ile-de-France has money to waste, so it’s spending far too much on designing new rolling stock that nobody else has any use for. This is true outside France as well: the high operating costs of the subway in New York are not a US-wide phenomenon, but rather are restricted to New York, Boston, and Los Angeles, while the rest of the country, facing bigger cost pressure than New York and Boston, is forced to run trains for the same cost as the major European cities. It is also likely that New York (and more recently London) allowed its construction costs to explode to extreme levels because, with enough money to splurge on high-use lines like 63rd Street Tunnel and Second Avenue Subway, it never paid attention to cost control.
This approach to cost control is entirely reactive. Places with high operating or capital costs don’t mind these costs when times are good, and then face crisis when times are bad, such as when the financial crisis led to stagnation in TGV revenue amidst continued growth in operating costs, or when costs explode to the point of making plans no longer affordable. In crisis mode, a gentle reduction in costs may not be possible technically or politically, given pressure to save money fast. Without time to develop alternative plans, or learn and adopt best industry practices, agencies (or private companies) turn to cuts and cancel investment plans.
A stronger approach must be proactive. This means looking for cost savings regardless of the current financial situation, in profitable as well as unprofitable areas. If anything, rich regions and companies are better placed for improving efficiency: they have deep enough pockets to finance the one-time cost of some reforms and to take their time to implement reforms correctly. SNCF is getting caught with its pants down, and as a result Spinetta is proposing cuts but nothing about reducing unit operating and maintenance costs. Under a proactive approach, the key is not to get caught with your pants down in the first place.
Base Train Service is Cheap, Peak Train Service is Expensive
A few days ago, I calculated regional rail operating costs from first principles, as opposed to looking at actual operating costs around the world. Subway operating costs in the developed world bottom at $4-5/car-km (and Singapore, near the bottom end, has long cars), and I wanted to see what the minimum achievable was. I tweetstormed about it two days ago and was asked to turn it into a full blog post. It turns out there is a vast difference between the operating cost of base service and the operating cost of the peak. The cost of rolling stock acquisition and maintenance may differ by a factor of five, or even more for especially peaky operations. The reason is that there are about 5,800 hours of daytime and evening operation per year but only about 1,000 hours of peak operation. Acquisition and maintenance costs seem to be based exclusively on time and not distance traveled, so this is about a factor of five difference in cost per hour (or kilometer) of operation: $5/car-km for the peak, or $1/car-km for the base.
The cost of acquisition of trains is pretty easy to calculate, since a large number of orders are reported in trade magazines like Railway Gazette and Rail Journal. The cost of a single-level trainset should be taken to be $2.5 million per 25-meter-long car, a length typical of American and Nordic trains, though on the high side for the rest of Europe. This is based on German orders of high-performance EMUs from 2014, 2016, and 2017, rated per meter of car length. In the US, the cost of single-level EMUs is similar, but the trains are heavier and lower-performance: the LIRR and Metro-North M9 is $2.7 million per car, and SEPTA’s defective Silverliner V cost $2.3 million per car. Bilevels cost more, and, as I complained at the beginning of this month, Paris has some comically expensive bilevels, approaching $6 million per 25 meters of car length on the RER D and E. American one-off orders are expensive as well: Caltrain’s KISS order is $5.7 million per car for the base order and $4 million per car for the option; in countries that import trains from the usual factories rather than making manufacturers open new domestic plants, the KISS is cheaper, down to about $3.2 million per car in Sweden.
I consolidated this list of costs to one tweet: $2.5 million per 25-meter car if you’re good at procurement, $5 million if you’re bad. The rest of the analysis assumes agencies are good at procurement, so a car is $2.5 million. This is a capital cost, but it’s still a marginal cost of operations, since higher frequency requires more trains at the end of the day; it’s not like investments in physical plant, which may or may not be necessary depending on the precise infrastructure situation.
Depreciation on $2.5 million over 40 years, and 4% interest, add up to $162,500 per year. Here I’m making an assumption that the lifespan of a train is the same no matter how long it runs. This seems justified: peaky American trains, traveling less than 100,000 km per year, don’t last longer than their less peaky counterparts in Europe. London aims at reducing its peak-to-base ratio to not much more than 1; judging by annual train-km and the number of trainsets, Underground trains travel 127,000 km a year, whereas the same analysis on the New York City Subway (using NTD data) yields 86,000 km. But in both cities, trains typically last about 40 years.
In Japan, the situation is different – trains only last 20 years. This is not because they run all that much (the peak-to-base ratio on the Tokyo rail network is about 2, and the average speed is 30 km/h except on a few express lines), but because the trains are designed to be lighter, cheaper, and lower-maintenance, at the cost of lasting only half as long. I’m not including Japanese costs in this analysis, because I can’t find any numbers for procurement costs, let alone maintenance costs, except for Shinkansen – and high-speed trains cost a multiple of regional trains (in Europe, about $5 million per 25-meter car).
Now, if acquisition ends up costing about $160,000 per year for a car, maintenance adds another $70,000-100,000. This is harder to ascertain, but there are occasional maintenance contracts, or purchase + maintenance contracts. An Alstom Coradia Nordic maintenance contract works out to about $70,000 per 25 meters of train length annually. Another Alstom contract, for British trains manufactured by CAF for $3.3 million per 25 meters of train length, is $550,000 per 25 meters of train length over 6 years; half of the trains are EMUs, the other half are unpowered cars (the diesel locomotive’s maintenance is not included in the contract). Two more contracts covering purchase plus maintenance, one by Bombardier and one by Stadler, are consistent with annual maintenance costs in the $70,000-100,000 range.
That the maintenance cost is priced per year, independently of distance driven, suggests that distance driven plays a limited role. The Bombardier contract involves a consortium with specified service, but the other contracts separate maintenance from operations, and were maintenance cost based largely on distance, operators could easily run more service and offload the cost to the vendors. This is not necessarily true everywhere, and Adam Rahbee (profiled in CityLab) told me that New York City Subway maintenance costs scale with distance driven, so running trains more often off-peak wouldn’t improve per-km operating expenses. But it does seem to hold at least in European regional rail maintenance contracts.
The upshot is that adding maintenance and depreciation and interest on rolling stock acquisition works out to about $250,000 per 25 meters of train length. So it’s now left to compute costs per car-km.
Base service for 16 hours a day works out to 5,800 hours a year. But rolling stock availability is less than 100% because of routine maintenance needs. In its proposals for high-speed rail in the US, SNCF said that it cycles TGVs for maintenance on weekdays in order to be able to run maximum service during the weekend travel peak: for example, in its Midwest proposal, it says on PDF-p. 60 that off-peak availability is 80% and peak availability is 98%. The 80% off-peak availability figure assumes one fifth of the trains are undergoing maintenance each weekday; but for service provided without a peak, it’s possible to also do maintenance on weekends, raising availability to 6/7, or about 86%, giving about 5,000 hours a year. If commuter trains average 50 km/h, the cost is $250,000/(5,000*50) = $1/car-km.
Peak service only allows a fraction of this usage level. Rolling stock availability can approach 100% if maintenance is kept to the off-peak period, but this only squeezes an extra 1/6 improvement in vehicle-km per year, nowhere near enough to offset the fact that the peak is short. When I write commuter rail schedules for the US I assume a 6-hour peak, entering the CBD between 7 and 10 in the morning and leaving between 5 and 8; however, actual peaks are much shorter, especially in the morning. The RER A has about 2.5 peak hours per day. One MBTA commuter train, the Heart-to-Hub nonstop service between Worcester and Boston, only runs for an hour a day in each direction. Metro-North’s New Haven Line schedules suggest a short peak period for each train as well. A 4-hour peak corresponds to 1,000 hours a year, assuming 250 weekdays excluding holidays.
Of note, it doesn’t matter too much whether the peak is unidirectional (inbound in the morning, outbound in the afternoon) or bidirectional, except when the train’s one-way travel time is much shorter than the peak window. A bidirectional 6-hour peak, with 3 hours in each direction, only allows trains to run the full 6 peak hours if the one-way trip time is 3 hours or if there’s enough reverse-peak service to allow the train to do multiple runs. On Heart-to-Hub this doesn’t matter because it consists of exactly one roundtrip, but on Metro-North, it does matter: the peak lasts about 2 hours in each direction, but there’s almost no supplemental reverse-peak service, and the one-way trip time ranges from 30 minutes to just over 2 hours, with an average of a little more than an hour, so each train can only run about 2.5 hours of peak service on average. The assumption of 4 hours of peak service per weekday is generous for an American operation.
With 1,000 annual hours of peak service and 50 km/h average speed, $250,000 in maintenance costs translates to $5 per car-km. Heart-to-Hub averages about 70 km/h, but only gets about 500 annual hours, boosting costs to $7/car-km.
In practice, all-peak and all-base rail operations only exist as edge cases: the only urban rail service without a peak that I know of is the Helsinki Metro, which runs every 5 minutes all day, whereas peak-only rail operations, such as Vancouver’s West Coast Express, tend to have so little ridership that they’re irrelevant to any discussion of modern regional rail. Switzerland tries to run the same frequency all day based on its clockface schedule plans, but peak trains are longer, so from the perspective of train maintenance there is often a hefty peak-to-base ratio there.
A mixed operation can be analyzed as a weighted average of peak and base costs. A good rule of thumb is that the overall cost can never be higher than the cost of the base times the peak-to-base ratio, because ultimately introducing extra peak service multiplies costs by the peak-to-base ratio while also increasing train-km (and of course increasing capacity when it is most constrained, significantly increasing ridership and revenue).
A peak-to-base ratio of 2, which seems typical of operations in Tokyo and is a little bit on the high side on the RER (in both Tokyo and Paris train lengths are the same throughout the day), means 5/6 of train-km are the base and 1/6 are supplemental service over the 4-hour peak, combining to a weighted average of $1.67/car-km. But the peak-to-base ratio on the New Haven Line is 5, which means the base contributes 5/9 of train-km and not 5/6, yielding only 90,000 annual km per car (in fact, the NTD suggests the actual figure is about 97,000, not including locomotives). Were maintenance costs on Metro-North similar to those of routine European operations, this would be about $2.70/car-km.
It’s important to note that rolling stock is just one of several costs of rail operations. Evidently, Metro-North costs $10/car-km to operate, and while its rolling stock maintenance appear higher than the European norm, procurement costs aren’t, and high maintenance costs can push it from $2.70/car-km to maybe $4/car-km. There’s a lot of extra expense on top of that. Among the other costs, infrastructure maintenance, including stations, has the same implication as rolling stock: the costs are insensitive to train-km, and they’re also relatively insensitive to the total amount of peak service provided. Crew costs in contrast mostly scale with train operating hours – a higher peak-to-base ratio does make it harder to schedule crew for optimal efficiency, but the difference is not so stark. And energy costs scale linearly with the number of train runs in service. So it’s not really true that the peak is five times as expensive to run as the base; I would guess the figure is about three times as expensive, from some data on other costs that isn’t strong enough for me to commit it to a blog post.
That said, rolling stock really does cost five times as much at the peak than off-peak. This implies that places that can’t control their rolling stock costs should aim at reducing the peak-to-base ratio whenever possible, including the RER (because of high procurement costs, especially on the RER A) and American rail operations (because of high maintenance costs on the LIRR and Metro-North, and high procurement cost of anything that requires setting up a new factory because of Buy America regulations).
The RER is not the LIRR or Metro-North. The total operating costs of the Metro and the RATP portions of the RER are together about $6 per car-km (this is one of the systems labeled “EU” in London’s benchmarking report), and unless the Metro is unusually cheap to operate, which would be surprising, the costs of both systems have to be about the same. Depreciation and interest on RER A rolling stock procurement costs alone is about $350,000 per 22.5-meter car, which works out to about $1.50/car-km base and $7.50 peak. Today’s peak-to-base ratio of 2 means that this capital cost adds about $2.50/car-km, or about 40% of operating and maintenance costs; this could be cut back to $1.50 if RATP ran off-peak and reverse-peak service at the same frequency as the peak. Boosting off-peak frequency to where the peak is today, about 25 trains per hour, would still have pretty full trains within the city and its innermost suburbs, if not near the ends. And it would cut unit capital costs by about 1/6 of present-day operating costs, while also allowing a supplementary cut in direct unit operating costs (namely, maintenance) of about 3%. In reality, Francilien tax money goes to pay for both capital and operating costs, so combined this cuts ongoing unit costs (i.e. excluding new tunnels) by about 17%, by running more service for not much more than today’s costs.
In an environment in which costs are dominated by capital acquisition, it makes sense to operate expensive machinery for as many hours as possible. This means running maximum service whenever possible, subject to spare ratios and maintenance needs. Even if the off-peak trains are mostly empty, the marginal cost of rolling stock for such service is free, and the other costs are still on the low side; adding more runs throughout the day has low enough operating costs ($1/car-km for rolling stock procurement and maintenance, again) that trains don’t need to be full or even close to full to socially and economically justify extra service.
Grand Paris Express Cost Overruns: Organization Before Electronics Before Concrete
Paris is building a suburban Metro expansion, consisting of 200 km of which 160 are underground, carrying automated trains. This program, dubbed Grand Paris Express, is intended to provide circumferential service in the inner suburbs (on future Metro Lines 15, 16, and 18) and some additional radial service from the suburbs into Central Paris (on future Line 17 and extensions of Lines 11 and 14). The estimated cost was about €25 billion in 2012 prices – about average for a European subway. But now a bombshell has dropped: the cost estimate should be revised upward by 40%, to €35 billion for the 200 km GPX scheme and €38 billion for GPX plus related projects (such as GPX contribution to the RER E extension). You can read it in English-language media on Metro Report, but more detail is available in French-language media, such as Le Monde, and in the original report by the Cour des Comptes, the administrative court charged with auditing government finances. The goal of this post is to suggest how Ile-de-France should react to the cost overruns, using best industry practices from neighboring countries.
First, it’s worthwhile to look at the problems the Cour des Comptes report identifies. It includes a moderate amount of scope creep, on page 40, which helped raise the budget by €3.5 billion between 2013 and 2017:
- €592 million for separate maintenance facilities at Aulnay for M15 and the other lines (M14, M16, M17).
- €198 million for interoperability between two segments of M15 in the south and east; the original plan made M15 not a perfect circle but a pinch, without through-service between south and east, and building connections to permit through-running at the southeast costs extra.
- €167 million for a second railyard for storing trains on M15 East.
On page 47, there is a breakdown of the larger cost overrun accumulated in 2017, by segment. The bulk of the overrun comes from new risk assessments: whereas the budget in early 2017 was €22.4 billion plus €2.8 billion for contingency, the new cost estimate is €27.7 billion plus €7 billion for contingency. This is a combination of geological risk and management risk: the report criticizes the project for lacking enough management to oversee such a large endeavor, and recommends target costs for each segment as well as better cost control to reduce risk.
Reducing the scope of GPX to limit its cost is thankfully easy. For a while now I have puzzled over the inclusion of M18 and M17 (which the report calls M17 North, since M17 South is shared with M16 and M14 in an awkward branch). Whereas M15 is a circular line just outside city limits, serving La Defense and many other major inner-suburban nodes, and M16 is another (semi-)circular alignment to the northeast of M15, M18 is a southwestern circumferential far from any major nodes, connecting Versailles, Massy-Palaiseau, and Orly on a circuitous alignment. Between the major nodes there is very little, and much of what it does connect to is already parallel to the RER B and to one branch of the RER C, which is being replaced with an orbital tram. The suburbs served are high-income and have high car ownership, and transit dependence is unlikely, making M18 an especially weak line.
M17 North is weak as well. It is a weird line, an underground radial connecting to Charles-de-Gaulle, already served by the RER B and by the under-construction CDG Express money waste. The route is supposed to be faster than the RER B, but it is no more direct, and makes more stops – the RER B runs a nonstop train between Gare du Nord and the airport every 15 minutes off-peak. It serves hotels near Saint-Lazare better using the connection to M14, but the RER B serves these hotels, as well as the hotels near Etoile, using a wrong-way transfer at Chatelet-Les Halles with the RER A.
The Cour des Comptes report itself does not recommend pruning these two lines, but its cost-benefit calculations per line on page 29 suggest that they should be deleted. On page 30 it says outright that the cost-benefit calculation for M18 is unfavorable. But on page 29 we see that the benefit-cost ratio of M18, not counting contingency costs, is barely higher than 1, and that of M17 North is a risky 1.3. In contrast, M15 South, the section already under construction, has a benefit-cost ratio of 1.7. M15 West has a ratio of 2.3, M15 East 1.5, M14 South 2.1, and M16 about 2. The M11 eastern extension is not included on the list.
Blog supporter Diego Beghin brought up on social media that M17 and M18 are already most at risk, and local elected officials are seeking assurances from the state that these lines will not be canceled. However, given their low potential ridership, the state should cancel them over local objections. Their combined cost is €4.9 billion, or €6.3 billion with contingency, about the same as the total cost overrun since early 2017.
Instead of pouring concrete on tunnels through lightly-developed high-income southwestern suburbs and on a third express route to the airport, the region should learn from what Germany and Switzerland have had to do. Germany has higher construction costs than France, which has forced it to prioritize projects better. Swiss construction costs seem average or below average, but the entire country has only two-thirds the population of Ile-de-France, and the public’s willingness to subsidize transit as a social service is much smaller than that of the French public. Hence the Swiss slogan, electronics before concrete (and its German extension, organization before electronics before concrete).
The M18 route already has a mainline rail route paralleling it – one of the branches of the RER C. This is an awkward branch, allowing trains from Versailles to enter the core trunk from either east or west, and ridership is so low that SNCF is downgrading it to an orbital tram-train. Thus, there is no need for a new Versailles-Massy connection. Two more destinations of note, Orsay and Orly, are also not necessary. Orsay is notable for its university, but there is already a connection from the university to Massy-Palaiseau and the city via the RER B with a little bit of walking to the station, and the connection to Versailles isn’t important enough to justify building a new line. Orly is a major airport, with about 90,000 travelers per day, but most of the traffic demand there is to the city (which it will connect to via the M14 South extension), and not to Versailles. While many tourists visit Versailles, this is just one stop on their journey, and their hotels are in the city or perhaps near Eurodisney in Marne-la-Vallee.
The M17 route is a more complex situation. The only new stops are Le Mesnil-Amelot, beyond the airport, with little development; Le Bourget-Aeroport, on the wrong side of a freeway; and Triangle de Gonesse, which is farmland. All three are development sites rather than places with existing demand, and development can be built anywhere in the region. However, the new airport-city connection is interesting, as relief for the RER B.
That said, there are better ways to relieve the RER B. The RER B has trains running nonstop between the airport and the city, but only off-peak. At the peak, trains run local every six minutes, with another branch (to Mitry-Claye) also getting a train every six minutes. The trains are very crowded, with obstructed corridors and not enough standing space in the vestibules, and with 20 trains per hour on the RER B and another 12 on the RER D, delays are common. Fixing this requires some improvement in organization, and some in concrete.
The concrete (and electronics) improvement is easier to explain: the shared RER B and D tunnel is a bottleneck and should be quadrupled. With four tracks rather than two, there would be space for more RER B as well as RER D trains; 24 trains per hour on each would be easy to run, and 30 would be possible with moving-block signaling of the same kind used on the RER A. This would provide more capacity not just to the northeast, around Aulnay-sous-Bois, but also north and northwest, since the RER D could take over more branches currently used by Transilien H.
The cost of quadrupling the tunnel is hard to estimate. Local rail advocate group ADUTEC explains the problem. In 2003 a proposal was estimated to cost €700 million, but construction would disrupt service, and in 2013 a study proposed new stations platforms at Les Halles for the RER D, raising the project’s cost to €2-4 billion. ADUTEC instead proposes building one track at a time to avoid disruption without building new platforms, saying this option should be studied more seriously; the cost estimate has to be higher than €700 million (if only because of inflation), but should still not be multiple billions.
But this project, while solving the capacity problems on the RER to the north and south in the medium term, doesn’t help connect passengers to the airport. On the contrary: more RER B traffic would make it harder to fit express trains between the local trains. Already there is little speed difference between local and express trains, about four minutes with nine skipped stations. This isn’t because the trains accelerate so quickly (they don’t) or because the maximum line speed is so low (the maximum speed on the line is 110-120 km/h). Rather, it’s because otherwise the express trains would catch up with local trains, on the airport branch or on the Mitry branch.
Fortunately, the route between the approach to Gare du Nord and Aulnay-sous-Bois, where the two RER B branches diverge, has four tracks. Right now, two are used by the RER, and two by other trains, including Transilien K but also the odd intercity train. The organizational fix is then clear: the four tracks should be reassigned so that all local trains get two tracks and all express trains (including intercities and Transilien but also airport express trains) get the other two. There is very little intercity traffic on the route, which carries no TGVs, and Transilien K has only a handful of peak trains and can be folded into the RER B.
With four tracks between Gare du Nord and Aulnay, express trains could go at full speed, saving about a minute for each skipped stop. But they shouldn’t go nonstop to the airport. They should serve Aulnay, giving it fast trains to the center. Passenger boardings by time of day are available for the SNCF-owned portion of the RER and Transilien here; Aulnay is the busiest station on the RER B north of Gare du Nord, with about 20% more weekday boardings than the second busiest (Stade de France) and 25% more morning peak boardings than the second busiest (La Courneuve). If express trains stop there, then it will free more space on local trains for the stations closer in, which would permit a service plan with half local trains and half express trains, each coming every 4-5 minutes. Today the inner stations get a local train every 3 minutes, so this is a service cut, but letting express trains handle demand from Aulnay out, on the airport branch as well as the Mitry and Transilien K branch, would mean passengers wouldn’t clog the local trains as much.
Potentially this could also reduce the demand for M16, whose northern segment, currently planned to be interlined with M14 and M17, is radial rather than circumferential. The entire M16 has a high benefit-cost ratio, but this could change in the presence of more RER B and D capacity. It may even be prudent to consider canceling M15 East and rerouting the remainder of M16 to complete the circle, a Line 15 consisting of the segments planned as M15 South, M15 West, and M16.
The study shows there is demand for two circumferentials in the east and northeast (M15 East and M16), but if RER B improvements rob M16 of its usefulness as a radial then this may change. If RER B improvements reduce the benefit-cost ratio of M16 below 1.5, then it should be canceled as well; with a budget of €4.4 billion plus another €1.2 billion in contingency, M16 could fund radial improvements that are more useful elsewhere. M15 East is a more coherent circumferential, with connections to Metro lines, whereas M16 is too far out.
But despite lack of coherence, M16 serves key destinations on the RER B. By default, the plan for GPX should be canceling M17 North and M18, and instead quadrupling the RER B and D tunnel and running more north-south RER service. Further cost overruns should be limited by the mechanisms the Cour des Comptes proposes, including tighter oversight of the project; without M17, there also may be room for removing ancillary scope, such as the Aulnay railyard.
High-Speed Rail from New Rochelle to Greens Farms: Impacts, Opportunities, and Analysis
I was asked by Greg Stroud of SECoast to look at HSR between New Rochelle and Greens Farms. On this segment (and, separately, between Greens Farms and Milford), 300+ km/h HSR is not possible, but speedups and bypasses in the 200-250 area are. The NEC Future plan left the entire segment from New York to New Haven as a question mark, and an inside source told me it was for fear of stoking NIMBYism. Nonetheless, SECoast found a preliminary alignment sketched by NEC Future and sent it to me, which I uploaded here in Google Earth format – the file is too big to display on Google Maps, but you can save and view it on your own computer. Here’s my analysis of it, first published on SECoast, changed only on the copy edit level and on English vs. metric units.
The tl;dr version is that speeding up intercity trains (and to some extent regional trains too) on the New Haven Line is possible, and requires significant but not unconscionable takings. The target trip time between New York and New Haven is at the lower end of the international HSR range, but it’s still not much more than a third of today’s trip time, which is weighed down by Amtrak/Metro-North agency turf battles, low-quality trains, and sharp curves.
The New Haven Line was built in the 1840s in hilly terrain. Like most early American railroads, it was built to low standards, with tight curves and compromised designs. Many of these lines were later replaced with costlier but faster alignments (for example, the Northeast Corridor in New Jersey and Pennsylvania), but in New England this was not done. With today’s technology, the terrain is no problem: high-speed trains can climb 3.5-4% grades, which were unthinkable in the steam era. But in the 170 years since the line opened, many urban and suburban communities have grown along the railroad right of way, and new construction and faster alignments will necessarily require significant adverse impacts to communities built along the Northeast Corridor.
This analysis will explain some of the impacts and opportunities expanding and modernizing high-speed rail infrastructure on or near the New Haven Line—and whether such an investment is worthwhile in the first place. There are competing needs: low cost, high speed, limited environmental impact, good local service on Metro-North. High-speed rail can satisfy each of them, but not everywhere and not at the same time.
The Northeast Corridor Future (NEC Future) preferred alternative, a new plan by the Federal Railroad Administration to modernize and expand rail infrastructure between Washington and Boston, proposes a long bypass segment parallel to the New Haven Line, between Rye and Greens Farms. The entire segment is called the New Rochelle-Greens Farms bypass; other segments are beyond the scope of this document.
Structure and Assumptions
The structure of this write-up is as follows: first, technical explanations of the issues with curves, with scheduling commuter trains and high-speed trains on the same track, and with high-speed commuting. Then, a segment-by-segment description of the options:
- New Rochelle-Rye, the leadup to the bypass, where scheduling trains is the most difficult.
- Rye-Cos Cob, the first bypass.
- The Cos Cob Bridge, a decrepit bridge for which the replacement is worth discussing on its own.
- Cos Cob-Stamford, where the preferred alternative is a bypass, but a lower-impact option on legacy track is as fast and should be studied.
- Stamford-Darien, where another bypass is unavoidable, with significant residential takings, almost 100 houses in one possibility not studied in the preferred alternative.
- Norwalk-Greens Farms, a continuation of the Darien bypass in an easier environment.
The impacts in question are predominantly noise, and the effect of takings. The main reference for noise emissions is a document used for California High-Speed Rail planning, using calibrated noise levels provided by federal regulators. At 260 km/h, higher than trains could attain in most of the segment in question, trains from the mid-1990s 45 meters away would be comparable to a noisy urban residential street; more recent trains, on tracks with noise barriers, would be comparable to a quiet urban street. Within a 50-meter (technically 150 feet) zone, adverse impact would require some mitigation fees.
At higher speed than 260 km/h, the federal regime for measuring train noise changes: the dominant factor in noise emissions is now air resistance around the train rather than rolling friction at the wheels. This means two things: first, at higher speed, noise emissions climb much faster than before, and second, noise barriers are less effective, since the noise is generated at the nose and pantograph rather than the wheels. At only one place within the segment are speeds higher than about 260 km/h geometrically feasible, in Norwalk and Westport, and there, noise would need to be mitigated with tall trees and more modern, aerodynamic trains, rather than with low concrete barriers.
This analysis excludes impact produced by some legacy trains, such as the loud horns at grade crossings; these may well go away in a future regulatory reform, as the loud horns serve little purpose, and the other onerous federal regulations on train operations are being reformed. But in any case, the mainline and any high-speed bypass would be built to high standards, without level crossings. Thus noise impact is entirely a matter of loud trains passing by at high speed.
Apart from noise and takings, there are some visual impacts coming from high bridges and viaducts. For the most part, these are in areas where the view the aerials block is the traffic on I-95. Perhaps the biggest exception is the Mianus River, where raising the Cos Cob Bridge has substantial positive impact on commuter train operations and not just intercity trains.
Curves
The formula for the maximum speed on a curve is as follows:

If all units are metric, and speed is in meters per second, this formula requires no unit conversion. But as is common in metric countries, I will cite speed in kilometers per hour rather than meters per second; 1 m/s equals 3.6 km/h.
Lateral acceleration is the most important quantity to focus on. It measures centrifugal force, and has a maximum value for safety and passenger comfort. But railroads decompose it into two separate numbers, to be added up: superelevation (or cant), and cant deficiency (or unbalanced superelevation, or underbalance).
Superelevation means banking the tracks on a curve. There is an exact speed at which trains can run where the centrifugal force exactly cancels out the banking, but in practice trains tend to run faster, producing additional centrifugal force; this additional force is called cant deficiency, and is measured as the additional hypothetical cant required to exactly balance.
If a train sits still on superelevated track, or goes too slowly, then passengers will feel a downward force, toward the inside of the curve; this is called cant excess. On tracks with heavy freight traffic, superelevation is low, because slow freight trains would otherwise be at dangerous cant excess. But the New Haven Line has little freight traffic, all of which can be accommodated on local tracks in the off-hours, and thus superelevation can be quite high. Today’s value is 5” (around 130 mm), and sometimes even less, but the maximum regulatory value in the United States is 7” (around 180 mm), and in Japan the high-speed lines can do 200 mm, allowing tighter curves in constrained areas.
Cant deficiency in the United States has traditionally been very low, at most 3” (75 mm). But modern trains can routinely do 150 mm, and Metro-North should plan on that as well, to increase speed. The Acela has a tilting mechanism, allowing 7”; the next-generation Acelas are capable of 9” cant deficiency (230 mm) at 320 km/h; this document will assume the sum total of cant and cant deficiency is 375 mm (the new Acela trainsets could do 200 mm cant deficiency with 175 mm cant, or Japanese trainsets could do 175 mm cant deficiency with 200 mm cant). This change alone, up from about 200 mm today, enough to raise the maximum speed on every curve by 37%. At these higher values of superelevation and cant deficiency, a curve of radius 800 meters can support 160 km/h.
Scheduling and Speed
The introduction of high-speed rail between New York and New Haven requires making some changes to timetabling on the New Haven Line. In fact, on large stretches of track on this line, especially in New York State, the speed limit comes not from curves or the physical state of the track, but from Metro-North’s deliberately slowing Amtrak down to the speed of an express Metro-North train, to simplify scheduling and dispatching. This includes both the top speed (90 mph/145 km/h in New York State, 75 mph/120 km/h in Connecticut) and the maximum speed on curves (Metro-North forbids the Acela to run at more than 3”/75 mm cant deficiency on its territory).
The heart of the problem is that the corridor needs to run trains of three different speed classes: local commuter trains, express commuter trains, and intercity trains. Ideally, this would involve six tracks, two per speed class, much like the four-track mainlines with two speed classes on the subway in New York (local and express trains). However, there are only four tracks. This means that there are four options:
- Run only two speed classes, slowing down intercity trains to the speed of express commuter trains.
- Run only two speed classes, making all commuter trains local.
- Expand the corridor to six tracks.
- Schedule trains of three different speed classes on just four tracks, with timed overtakes allowing faster trains to get ahead of slower trains at prescribed locations.
The current regime on the line is option #1. Option #2 would slow down commuters from Stamford and points east too much; the New Haven Line is too long and too busy for all-local commuter trains. Option #3 is the preferred alternative; the problem there is the cost of adding tracks in constrained locations, which includes widening viaducts and rebuilding platforms.
Option #4 has not been investigated very thoroughly in official documents. The reason is that timed overtakes require trains to be at a specific point at a specific time. Amtrak’s current reliability is too poor for this. However, future high-speed rail is likely to be far more punctual, with more reliable equipment and infrastructure. Investing in this option would require making some targeted investments toward reliability, such as more regular track and train maintenance, and high platforms at all stations in order to reduce the variability of passenger boarding time.
Moreover, at some locations, there are tight curves on the legacy New Haven Line that are hard or impossible to straighten in any alignment without long tunnels. South of Stamford, this includes Rye-Greenwich.
This means that, with new infrastructure for high-speed rail, the bypass segments could let high-speed trains overtake express commuter trains. The Rye-Greenwich segment is especially notable. High-speed rail is likely to include a bypass of Greenwich station. Thus, express commuter trains could stop at Greenwich, whereas today they run nonstop between Stamford and Manhattan, in order to give intercity trains more time to overtake them. A southbound high-speed trains would be just behind an express Metro-North train at Stamford, but using the much greater speed on the bypass, it would emerge just ahead of it at Rye. This segment could be built separately from the rest of the segment, from Stamford to Greens Farms and beyond, because of its positive impact on train scheduling.
It is critical to plan infrastructure and timetable together. With a decision to make express trains stop at Greenwich, infrastructure design could be simpler: there wouldn’t be a need to add capacity by adding tracks to segments that are not bypassed.
High-Speed Commuting
A junior consultant working on NEC Future who spoke to me on condition of anonymity said that there was pressure not to discuss fares, and at any rate the ridership model was insensitive to fare.
However, this merits additional study, because of the interaction with commuter rail. If the pricing on high-speed rail is premium, as on Amtrak today, then it is unlikely there will be substantial high-speed commuting to New York from Stamford and New Haven. But if there are tickets with low or no premium over commuter rail, with unreserved seating, then many people would choose to ride the trains from Stamford to New York, which would be a trip of about 20 minutes, even if they would have to stand.
High-speed trains are typically longer than commuter trains: 16 cars on the busier lines in Japan, China, and France, rather than 8-12. This is because they serve so few stops that it is easier to lengthen every platform. This means that the trains have more capacity, and replacing a scheduled commuter train with a high-speed train would not compromise commuter rail capacity.
The drawback is that commuters are unlikely to ride the trains outside rush hour, which only lasts about 2 or 3 hours a day in each direction. In contrast, intercity passengers are relatively dispersed throughout the day. Capital investment, including infrastructure and train procurement, is based on the peak; reducing the ratio of peak to base travel reduces costs. The unreserved seat rule, in which there is a small premium over commuter rail for unreserved seats (as in Germany and Japan) and a larger one for reserved seats, is one potential compromise between these two needs (flat peak, and high-speed commuter service).
New Rochelle-Rye
The track between New Rochelle and Rye is for the most part straight. Trains go 145 km/h, and this is because Metro-North slows down intercity trains for easier dispatching. The right-of-way geometry is good for 180 km/h with tilting trains and high superelevation; minor curve modifications are possible, but save little time. The big item in this segment concerns the southern end: New Rochelle.
At New Rochelle, the mainline branches in two: toward Grand Central on the New Haven Line, and toward Penn Station on the Hell Gate Line, used by Amtrak and future Penn Station Access trains. This branching is called Shell Interlocking, a complex of track switches, all at grade, with conflicts between trains in opposite directions. All trains must slow down to 30 mph (less than 50 km/h), making this the worst speed restriction on the Northeast Corridor outside the immediate areas around major stations such as Penn Station and Philadelphia 30th Street Station, where all trains stop.
The proposed (and only feasible) solution to this problem involves grade-separating the rails using flyovers, a project discussed by the FRA at least going back to 1978 (PDF-p. 95). This may involve some visual impact, or not—there is room for trenching the grade-separation rather than building viaducts. It is unclear how much that would cost, but a flyover at Harold Interlocking in Queens for East Side Access, which the FRA discussed in the same report, cost $300 million dollars earlier this decade. Harold is more complex than Shell, since it has branches on both sides and is in a more constrained location; it is likely that Shell would cost less than Harold’s $300 million. Here is a photo of the preferred alignment:
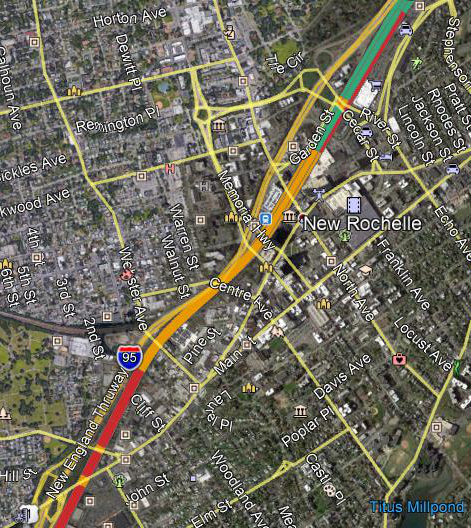
The color coding is, orange is viaducts (including grade separations), red is embankments, and teal is at-grade. This is the Northeast Corridor, continuing south on the Hell Gate Line to Penn Station, and not the Metro-North New Haven Line, continuing west (seen in natural color in the photo) to Grand Central.
A Shell fix could also straighten the approach from the south along the Hell Gate Line, which is curvy. The curve is a tight S, with individual curves not too tight, but the transition between them constraining speed. The preferred alignment proposes a fix with a kilometer of curve radius, good for 180 km/h, with impact to some industrial sites but almost no houses and no larger residential buildings. It is possible to have tighter curves, at slightly less cost and impact, or wider ones. Slicing a row of houses in New Rochelle, east of the southern side of the S, could permit cutting off the S-curve entirely, allowing 240 km/h; the cost and impact of this slice relative to the travel time benefit should be studied more carefully and compared with the cost per second saved from construction in Connecticut.
The main impact of high-speed rail here on ordinary commuters is the effect on scheduling. With four tracks, three train speed classes, and heavy commuter rail traffic, timetabling would need to be more precise, which in turn would require trains to be more punctual. In the context of a corridor-wide high-speed rail program, this is not so difficult, but it would still constrain the schedule.
Without additional tracks, except on the bypasses, there is capacity for 18 peak Metro-North trains per hour into New York (including Penn Station Access) and 6 high-speed trains. Today’s New Haven Line peak traffic is 20 trains per hour (8 south of Stamford, 12 north of which 10 run nonstop from Stamford to Manhattan), so this capacity pattern argues in favor of pricing trains to allow commuters to use the high-speed trains between Stamford and New York.
Rye-Greenwich
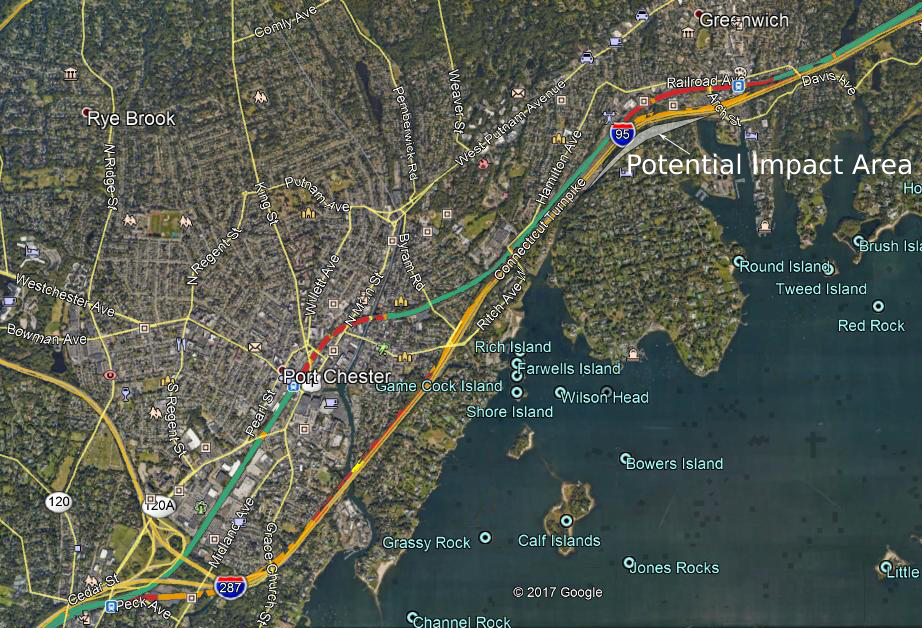
Rye is the first place, going from the south, where I-95 is straighter than the Northeast Corridor. This does not mean it is straight: it merely means that the curves on I-95 in that area are less sharp than those at Rye, Port Chester, and Greenwich. Each of these three stations sits at a sharp S-curve today; the speed zone today is 75 mph (120 km/h), with track geometry that could allow much more if Metro-North accepted a mix of trains of different speed, but Rye and Greenwich restrict trains to 60 mph/95 km/h, and Port Chester to 45 mph/70 km/h at the state line. The segment between the state line and Stamford in particular is one of the slowest in the corridor.
As a result, the NEC Future plan would bypass the legacy line there alongside the Interstate. Currently, the worst curve in the bypassed segment, at Port Chester, has radius about 650 meters, with maximum speed much less than today’s trains could do on such a curve because of the sharp S. At medium and high speed, it takes a few seconds of train travel time to reverse a curve, or else the train must go more slowly, to let the systems as well as passengers’ muscles adjust to the change in the direction of centrifugal force. At Rye, the new alignment has 1,200-meter curves, with gentle enough S to allow trains to fully reverse, without additional slowdowns; today’s tracks and trains could take it at 140 km/h, but a tilting train on tracks designed for higher-speed travel could go up to 195.
Within New York State, the bypass would require taking a large cosmetics store, and some houses adjacent to I-95 on the west; a few townhouses in Rye may require noise walls, as they would be right next to the right-of-way where trains would go about 200-210 km/h, but at this speed the noise levels with barriers are no higher than those of the freeway, so the houses would remain inhabitable.
In Connecticut, the situation is more delicate. When the tracks and I-95 are twinned, there is nothing in between, and thus the bypass is effectively just two extra tracks. To the south, just beyond the state line, the situation is similar to that of Rye: a few near-freeway houses would be acquired, but nothing else would, and overall noise levels would not be a problem.
But to the north, around Greenwich station, the proposed alignment follows the I-95 right-of-way, with no residential takings, and one possible commercial taking at Greenwich Plaza. This alignment comes at the cost of a sharp curve: 600 meters, comparable to the existing Greenwich curve. This would provide improvements in capacity, as intercity trains could overtake express commuter trains (which would also stop at Greenwich), but not much in speed.
Increasing speed requires a gentler curve than on I-95; eliminating the S-curve entirely would raise the radius to about 1,600 meters, permitting 225 km/h. This has some impact, as the inside of the curve would be too close to the houses just south of I-95, requiring taking about seven houses.
However, the biggest drawback of this gentler curve is cost: it would have to be on a viaduct crossing I-95 twice, raising the cost of the project. It is hard to say by exactly how much: either option, the preferred one or the 225 km/h option, would involve an aerial, costing about $100 million according to FRA cost items, so the difference is likely to be smaller than this. It is a political decision whether saving 30 seconds for express trains is worth what is likely to be in the low tens of millions of dollars.
Cos Cob Bridge
The Cos Cob Bridge restricts the trains, in multiple ways. As a movable bridge, it is unpowered: trains on it do not get electric power, but must instead coast; regular Metro-North riders are familiar with the sight of train lights, air conditioning, and electric sockets briefly going out when the train is on the bridge. It is also old enough that the structure itself requires trains to go more slowly, 80 km/h in an otherwise 110 km/h zone.
Because of the bridge’s age and condition, it is a high priority for replacement. One cost estimate says that replacing the bridge would cost $800 million. The Regional Plan Association estimates the cost of replacing both this bridge and the Devon Bridge, at the boundary between Fairfield and New Haven Counties, at $1.8 billion. The new span would be a higher bridge, fully powered, without any speed limit except associated with curves; Cos Cob station has to be rebuilt as well, as it is directly on the approaches, and it may be possible to save money there (Metro-North station construction costs are very high—West Haven was $105 million, whereas Boston has built infill stations for costs in the teens).
In any high-speed rail program, the curves could be eased as well. There are two short, sharp curves next to the bridge, one just west to the Cos Cob station and the other between the bridge and Riverside. The replaced bridge would need long approaches for the deck to clear the Mianus River with enough room for boats to navigate, and it should not cost any more in engineering and construction to replace the two short curves with one long, much wider curve. There is scant information about the proposed clearance below and the grades leading up to the bridge, but both high-speed trains and the high-powered electric commuter trains used by Metro-North can climb steep grades, up to 3.5-4%, limiting the length of the approaches to about 400 meters on each side. This is the alternative depicted as the potential alternative below; the Cos Cob Bridge is the legacy bridge, and the preferred alignment is a different bypass (see below for the Riverside-Stamford segment):
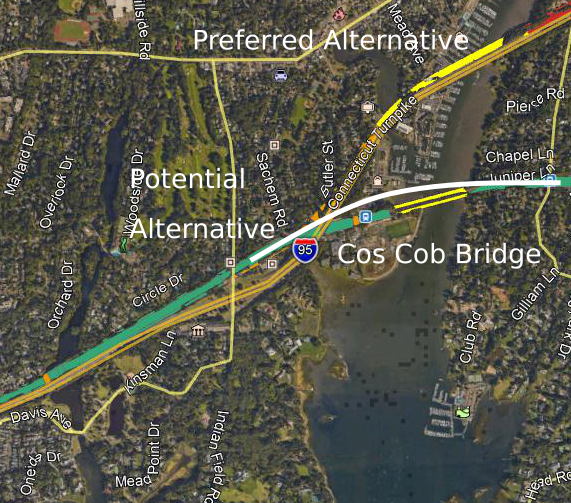
The color coding is the same as before, but yellow means major bridge. White is my own drawing of an alternative.
The radius of the curve would be 1,700 meters. A tilting train could go at 235 km/h. Commuter rail would benefit from increased speed as well: express trains could run at their maximum speed, currently 160 km/h, continuing almost all the way east to Stamford. The cost of this in terms of impact is the townhouses just north of the Cos Cob station: the viaduct would move slightly north, and encroach on some, possibly all, of the ten buildings. Otherwise, the area immediately to the north of the station is a parking lot.
The longer, wider curve alternative can be widened even further. In that case, there would be more impact on the approaches, but less near the bridge itself, which would be much closer in location to the current bridge and station. This option may prove useful if one alignment for the wider curve turns out to be infeasible due to either unacceptable impact to historic buildings or engineering difficulties. The curve radius of this alternative rises to about 3,000 meters, at which point the speed limit is imposed entirely by neighboring curves in Greenwich and Stamford; trains could go 310 km/h on a 3,000-meter curve, but they wouldn’t have room to accelerate to that speed from Greenwich’s 225 km/h.
Riverside-Stamford
Between the Mianus River and Stamford, there are two possible alignments. The first is the legacy alignment; the second is a bypass alongside I-95, which would involve a new crossing of the Mianus River as well. The NEC Future alignment appears to prefer the I-95 option:

The main benefit of the I-95 option is that it offers additional bypass tracks for the New Haven Line. Under this option, there is no need for intercity trains and express commuter trains to share tracks anywhere between Rye and Westport.
However, the legacy alignment has multiple other benefits. First, it has practically no additional impact. Faster trains would emit slightly more noise, but high-speed trains designed for 360 km/h are fairly quiet at 210. In contrast, the I-95 alignment requires a bridge over the Greenwich Water Club, some residential takings in Cos Cob, and possibly a few commercial takings in Riverside.
Second, it is cheaper. There would need to be some track reconstruction, but no new right-of-way formation, and, most importantly, no new crossing of the Mianus River. The Cos Cob Bridge is in such poor shape that a replacement is most likely necessary even if intercity trains bypass it. The extra cost of the additional aerials, berms, and grade separations in Riverside is perhaps $150-200 million, and that of the second Mianus River crossing would run into many hundreds of millions. This also means somewhat more visual impact, because there would be two bridges over the river rather than just one, and because in parts of Riverside the aerials would be at a higher level than the freeway, which is sunken under the three westernmost overpasses
In either case, one additional investment in Stamford is likely necessary, benefiting both intercity and commuter rail travelers: grade-separating the junction between the New Canaan Branch and the mainline. Without at-grade conflicts between opposing trains on the mainline and the New Canaan Branch, scheduling would be simpler, and trains to and from New Canaan would not need to use the slow interlocking at Stamford station.
The existing route into Stamford already has the potential to be fast. The curves between the Mianus and Stamford station are gentle, and even the S-curve on the approach to Stamford looks like a kilometer in radius, good enough for 180 km/h on a tilting train with proper superelevation.
Stamford-Darien
Between New York and Stamford, the required infrastructure investments for high-speed rail are tame. Everything together except the Mianus crossing should be doable, based on FRA cost items, on a low 9-figure budget.
East of Stamford, the situation is completely different. There are sharp curves periodically, and several in Darien and Norwalk are too tight for high-speed trains. What’s more, I-95 is only available as a straight alternative right-of-way in Norwalk. In Darien, and in Stamford east of the station, there is no easy solution. Everything requires balancing cost, speed, and construction impact.
The one saving grace is that there is much less commuter rail traffic here than between New York and Stamford. With bypasses from Stamford until past Norwalk, only a small number of peak express Metro-North trains east of Greens Farms would ever need to share tracks with intercity trains. Thus the scheduling is at least no longer a problem.
The official plan from NEC Future is to hew to I-95, with all of its curves, and compromise on speed. The curve radius appears to be about 700-750 meters through Stamford and most of Darien, good for about 95 mph over a stretch of 5.5 miles. This is a compromise meant to limit the extent of takings, at the cost of imposing one of the lowest speed limits outside major cities. While the official plan is feasible to construct, the sharp curves suggest that if Amtrak builds high-speed rail in this region, it will attempt a speedup, even at relatively high cost.
There is a possible speedup, involving a minimum curve radius of about 1,700-2,000 meters, good for 235-255 km/h. This would save 70-90 seconds, at similar construction cost to the preferred alignment. The drawback is that it would massively impact Darien, especially Noroton. It would involve carving a new route through Noroton for about a mile. In Stamford, it would require taking an office building or two, depending on precise alignment; in Noroton, the takings would amount to between 55 and 80 houses. The faster option, with 2,000-meter curves, does not necessarily require taking more houses in Noroton: the most difficult curves are farther east. In the picture, this speedup is in white, the preferred alternative is in orange, and the legacy line in teal:
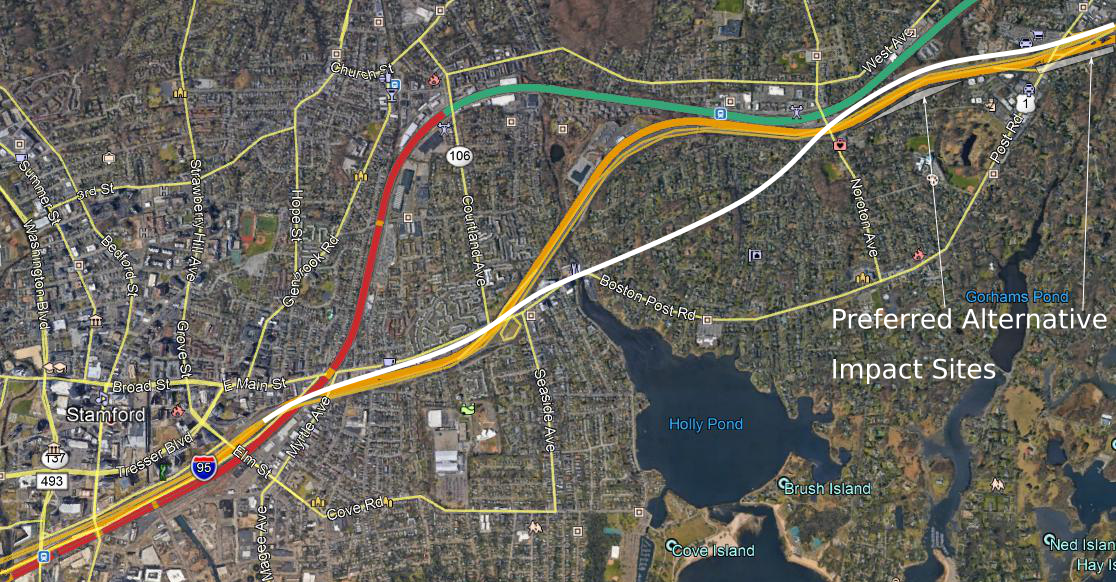
Fortunately, east of Norton Avenue, there is not much commercial and almost no residential development immediately to the north of I-95, making things easier:
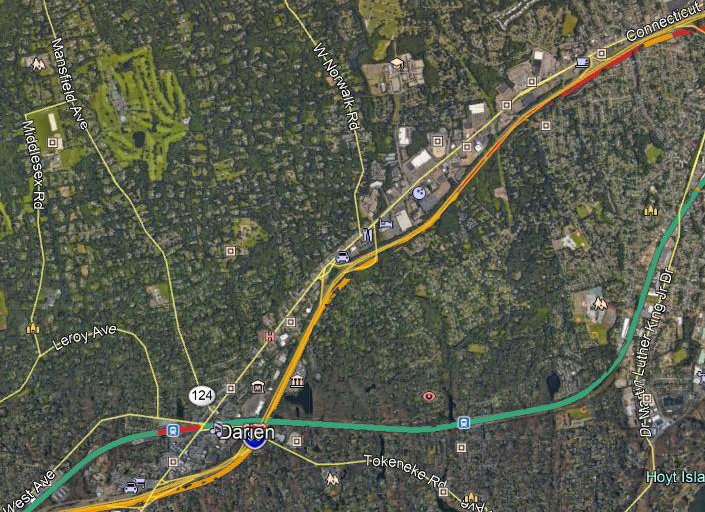
The preferred alignment stays to the south of the Turnpike. This is the residential side; even with tight curves, some residential takings are unavoidable, about 20 houses. Going north of I-95 instead requires a few commercial takings, including some auto shops, and one or two small office buildings east of Old Kings Highway, depending on curve radius. Construction costs here are slightly higher, because easing one curve would require elevated construction above I-95, as in one of the Greenwich options above, but this is probably a matter of a few tens of millions of dollars.
The main impact, beyond land acquisition cost, is splitting Noroton in half, at least for pedestrians and cyclists (drivers could drive in underpasses just as they do under highways). Conversely, the area would be close enough to Stamford, with its fast trains to New York, that it may become more desirable. This is especially true for takings within Stamford. However, Darien might benefit as well, near Noroton Heights and Darien stations, where people could take a train to Stamford and change to a high-speed train to New York or other cities.
As in Greenwich, it is a political decision how much a minute of travel time is worth. Darien houses are expensive; at the median price in Noroton, 60-80 houses would be $70-90 million, plus some extra for the office buildings. Against this extra cost, plus possible negative impact on the rest of Noroton, are positive impacts coming from access, and a speedup of 70-90 seconds for all travelers from New York or Stamford to points north.
Norwalk-Greens Farms
In Norwalk, I-95 provides a straight right-of-way for trains. This is the high-speed rail racetrack: for about ten kilometers, until Greens Farms, it may be possible for trains to run at 270-290 km/h.
Here is a photo of Norwalk, with the Walk and Saga Bridges in yellow, a tunnel in the preferred alternative in purple, a possible different alignment in white, and impact zones highlighted:
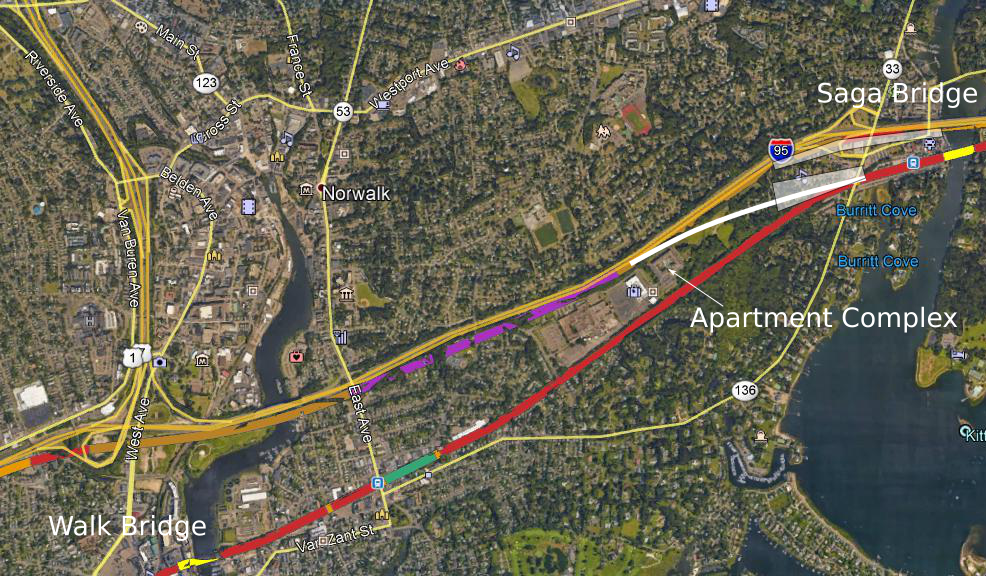
Three question marks remain about the preferred alignment.
The first question is, which side of the Turnpike to use? The preferred alignment stays on the south side. This limits impact on the north side, which includes some retail where the Turnpike and U.S. 1 are closely parallel, near the Darien/Norwalk boundary; a north side option would have to take it. But the preferred alignment instead slices Oyster Shell Park. A third option is possible, transitioning from the north to the south side just east of the Norwalk River, preparing to rejoin the New Haven Line, which is to the south of I-95 here.
The second question is, why is the transition back to the New Haven Line so complex? The preferred alignment includes a tunnel in an area without any more impacted residences than nearby segments, including in Greenwich and Darien. It also includes a new Saga Bridge, bypassing Westport, with a new viaduct in Downtown Westport, taking some retail and about six houses. An alternative would be to leverage the upcoming Saga Bridge reconstruction, which the RPA plan mentions is relatively easy ($500 million for Saga plus Walk, on the Norwalk River, bypassed by any high-speed alignment), and transition to the legacy alignment somewhat to the west of Westport.
A complicating factor for transitioning west of Westport is that the optimal route, while empty eight years ago, has since gotten a new apartment complex with a few hundred units, marked on the map. Alternatives all involve impact to other places; the options are transitioning north of the complex, taking about twenty units in Westport south of the Turnpike and twenty in Norwalk just north of it.
The third question, related to the second, is, why is Greens Farms so complicated? See photo below:
The area has a prominent S-curve, and some compromises on curve radius are needed. But the preferred alternative doesn’t seem to straighten it. Instead, it builds an interlocking there, with the bypass from Darien and points west. While that particular area has little impact (the preferred alignment transitions in the no man’s land between the New Haven Line and the Turnpike), the area is constrained and the interlocking would be expensive.
No matter what happens, the racetrack ends at Greens Farms. The existing curve seems to have a radius of about a kilometer or slightly more, good for about 190 km/h, and the best that can be done if it is straightened is 1,300-1,400 meters, good for about 200 km/h.
These questions may well have good answers. Unlike in Darien, where all options are bad, in Norwalk and Westport all options are at least understandable. But it’s useful to ask why go south of the Turnpike rather than north, and unless there is a clear-cut answer, both options should be studied in parallel.

