Category: Urban Transit
Phased Implementation of Bus Redesign
Jarrett has a good post about the new Auckland bus redesign, which he had been involved in when he worked for international consultancy MRCagney, before he opened his own. He mentions one peculiar aspect of Auckland – namely, that it is so divided by water boundaries that different areas of it have independent surface transit networks – that facilitates gradual implementation. In contrast, in a city with a more connected street network, every route affects every other route, so redesign has to be implemented together, without any intermediate phases. He brings up Brooklyn (together with Queens) as one example of such a connected network, and I feel like I need to explain why a phased approach is appropriate there.
But this is not just about Brooklyn. The question of whether to implement changes abruptly or gradually generalizes to every scale, up to and including the type of regime (democratic, militaristic, communist, etc.). The scope of this post concerns bus networks anywhere. The arguments I bring up in favor of a phased approach in Brooklyn should also give correct answers in other cities, regardless of whether they end up recommending gradualism.
Sharp edges
Jarrett brings up one factor influencing whether phased implementation is appropriate: sharp edges between different parts of the city. In New York, the East River has few road crossings and many rail crossings; only one local bus crosses it in Brooklyn, the half-hourly B39, and only four cross it in Queens.
But even edges that look less sharp than the East River or the Hudson can be so stark so as to permit separate planning on their two sides. The Harlem River is one example: many Bronx buses cross it, but their routes in Manhattan are constrained based on which avenue or street the bridge connects to, so there’s not much scope for creative recombination.
Brooklyn itself has few internal sharp edges. The closest thing to a sharp edge is the combination of Greenwood Cemetery and Prospect Park, separating on one side Park Slope and South Brooklyn and on the other side Flatbush and Southern Brooklyn. A few marginal neighborhoods are sharply divided from the rest of the borough, especially Red Hook. But for those neighborhoods, the question of where in the rest of the borough they should connect to depends on the shape of the rest of the system.
That said, it’s plausible to talk about how the new network would look in various neighborhoods, if there are choke points or generally agreed upon spines. Red Hook is an especially good example, since it has a strong connection to Manhattan via the Brooklyn-Battery Tunnel (hence, our proposed tunnel bus to Lower Manhattan). But as the arguments in comments here over Williamsburg show (and as my constant refrain about the north-south Bed-Stuy routes shows), it’s possible to discuss individual neighborhoods even if they’re more strongly connected, as long as it’s clear that it’s in the context of a greater network.
However, in one aspect, Jarrett and the MTA make a mistake: they treat the edge between Brooklyn and Queens as less sharp than it really is. In the north, the Newtown Creek choke point forces buses to all go up to Long Island City along a single bridge. In the center, a few route mergers passing through Bushwick and Ridgewood (especially the B54/Q55 on Myrtle) are reasonable, but fully integrated planning would not create very many connections. It’s possible to design the network for Brooklyn alone and then notate where Queens connections would happen, just as it’s possible to design a Manhattan network and point out that the M60 goes into Queens.
The subtle issue regarding Brooklyn and Queens concerns what happens in the south. At TransitCenter we were asked about connections to Howard Beach, but when I looked, I ran across a subtle geographic divide. The southeastern margin of Brooklyn and Queens is a series of small peninsulas with weak connections between them: Gerritsen Beach, Mill Basin, Bergen Beach, Canarsie, Starrett City, Spring Creek, Howard Beach, Old Howard Beach. When I crayoned a metro network for Lagos, which has the same problem in the west and northwest, I had to assume new metro bridges connecting various neighborhoods. On a surface transit network in a developed country, such bridges are unlikely to happen, forcing buses to use the main through-routes today, like Flatlands and Linden.
Is it good enough today?
The entire reform versus revolution discourse depends on how bad things are today. It’s unavoidable in discussions of socialism and Marxism. Socialists and even some social democrats hold that mid-20th century social reforms (like the New Deal) saved capitalism from itself, by making the working class’s situation less desperate. As a result, there is a contingent of leftists who call themselves accelerationists, who prefer to make things as bad as they can be (for example, by refusing to back the center-left against the far right) hoping that this would accelerate the revolution.
The “is it good enough today?” principle scales down to any level. When it comes to bus networks, it really asks, how much would the optimal route network differ from today’s situation?
The highly radial buses of San Jose today, Houston before Jarrett’s redesign, and Barcelona before Nova Xarxa all differ greatly from the redesigned networks. This encourages abrupt implementation, in two ways. First, the old routes are generally weak, increasing the pressure to get rid of them. And second, the old routes don’t feed the new grid trunk lines well, whereas the grid trunks feed one another. Nova Xarxa (which is a six-year process, retaining many old lines) has seen its phase 1 lines grow in ridership as each subsequent phase was implemented, making the early stages much less useful than the entire system.
In contrast, Brooklyn is firmly in the good enough basket. This does not mean its current network design is objectively good; it isn’t. But it does mean that most of its key trunk lines should survive redesign with at most light modifications. Among the 15 busiest Brooklyn routes today measured by ridership per km, only three see big changes: the B1 (straightened into a Southern Brooklyn grid), the B82 (cut to Kings Highway, its tails on both sides given to the B6), and the B41 (cut north of the B/Q subway connection at Prospect Park). A few more are merged into longer routes, like the B42 and the B60, but maintain their current route, just with through-service elsewhere. Key grid routes like Lafayette, Church, Nostrand, Avenue M, and Myrtle survive almost unchanged.
The Brooklyn redesign is not predominantly about starting from scratch, since the network today already has the characteristics of an imperfect grid. It’s about consolidating weak and weak-ish routes, straightening some buses that are too circuitous, and switching around buses to serve destinations that have grown stronger since the 1970s redesign. The East New York network in particular has a lot of meanders that should be fixed regardless of what happens anywhere else; the rest of the bus and subway network is good enough that people from East New York can then transfer to it even if increasing trunk frequency happens later.
Future changes
Bus redesigns are not immutable, to be done once in a few decades with long periods of stasis in between. Cities change, and the optimal bus network for 2025 may be different from that for 2019 in some situations. In a city where there’s relative stasis in development intensity, traffic, and any rail trunk, an abrupt change makes more sense. Realistically, such a change would come not when the first phase of a gradual implementation would have been done but when the middle or last phases would have. Thus, if the redesign is a long-lasting product it’s easier to wait for the first phase (which in an abrupt implementation is also the last phase) and not change much afterward.
This relates to California Transit Twitter’s biggest criticism of Jarrett’s San Jose redesign: that it does not incorporate the recent BART extension to Warm Springs. Jarrett unveiled his redesign for VTA in the spring of 2017, expecting BART to be extended from Warm Springs to the San Jose Flea Market at Berryessa by the end of the year, as BART had projected. Based on this expectation, he designed the network around an abrupt implementation, to go into effect shortly after trains would start running to Berryessa. Since then, BART has announced delays to the extension, talking about opening it only at the end of 2019. Trusting BART’s early promises of 2017 opening is an understandable error; Jarrett did not cause the BART timetable slip. But the outcome is that the VTA bus redesign is delayed.
The upshot is that in a city with a rapidly-growing rapid transit network, bus redesigns should be done on a continuous basis, tweaked every time a new subway line opens. The Bay Area is not generally such a city, but BART is expanding into San Jose, so in that part of the region, phased implementation with updates every few years is warranted. By the same principle, a city with rapid changes in where people live and work should expect recurrent changes to its surface transit network; this is less relevant to San Jose, since the growth nodes are the CBD (e.g. the upcoming Google building) and the Apple headquarters in Cupertino, but it’s relevant to cities in which residential areas are commercializing, such as San Francisco with SoMa.
New York, of course, has a static subway system, courtesy of extreme construction costs. It also has a relatively static workplace geography. However, in one respect, it is undergoing rapid change: it is gradually making its subway network accessible. When I say that the optimal networks for 2018, 2022, and 2026 are all different, I say this in reference to upcoming subway accessibility upgrades, as well as potential changes (i.e. de-interlining) that would increase subway frequency at the cost of one-seat rides. In Brooklyn, our plan to get rid of the B25 depends on upcoming accessibility upgrades for Broadway Junction, without which the bus should probably stay as an accessible alternative to the A and C trains. Likewise, our plan to retain the B63 comes from plans to only make the outermost R stations accessible but not the ones in Sunset Park or South Slope.
What about Nova Xarxa?
On two out of three metrics, Barcelona’s layout recommends an abrupt approach: it lacks internal sharp edges, and its preexisting network was too radial to be useful. On the third, it does not: it is rapidly expanding its metro network; however, the implementation of Nova Xarxa as far as I can tell has not been timed for the opening of L9/L10. So why is it phased there?
The fact that the early-phase lines of the network have seen further increases in ridership as the rest of the network has come online suggests that, on purely technical criteria, gradual implementation was not the right choice in Barcelona. However, in political reality, Nova Xarxa could not replace the entire radial network. Most bus routes in Barcelona today are still not Nova Xarxa. The system’s characteristic as an overlay that took over old lines that became superfluous forced it to be done in phases.
Conflicting excuses
In comments, people here have warned that a phased implementation can be an excuse to do nothing: put the few things everyone agrees on in the first phase, do that, and then postpone future phases indefinitely. This is a real risk. However, abrupt change has its own risks as well: it can be used as an excuse not to do low-cost or negative-cost things that can be implemented fast, such as merging the two Myrtle routes, redoing the East New York bus network in advance of the L train shutdown, and opening the Red Hook-Lower Manhattan route.
The upshot is that the question of gradualism seems independent from the question of obstructive bureaucrats and apparatchiks. There may well arise a local situation in which one answer to the main question is less vulnerable to political sabotage than the other, but it depends on idiosyncratic factors and is unlikely to be the case in general.
With the political criteria uncertain, the answer to whether network redesign should be done in one go or in stages should depend only on technical criteria. These differ from city to city and from region to region depending on local physical and urban geography. In New York, they suggest a phased implementation would work; elsewhere, they may not.
Brooklyn Bus Redesign Version 1.2
About two weeks ago, Eric Goldwyn and I unveiled our Brooklyn bus redesign. It consolidates the borough from 550 route-km to about 350, and cuts the number of stops along the surviving lines from 1580 to 706; the increase in speed coming from stop consolidation and other treatments (i.e. bus lanes and prepayment) and the route consolidation together permit doubling the frequency with the same resources available today, guaranteeing that each bus route have at worst 6-minute frequency between 6 am and 10 pm. The first version we released was 1.0, and the version I blogged was 1.1. In this post I’d like to introduce changes as well as explain why we made certain decisions that have been criticized in comments here and elsewhere.
Version 1.2
V1.2 differs from v1.1 in just two ways. First, it was pointed out to me that we made a mistake in the map: the route we proposed for the B6 to take across the structure of the Brighton Line of the subway, at Avenue H, was not in fact a street crossing. At Avenue H the structure goes from trenched to the north to elevated in the south, and as a result the street does not go through. We fixed this error by restoring the present-day route, and also slightly changing the route of the B11 to follow what must be a high-quality bus lane.
And second, months ago, in arguments with former MTA planner Allan Rosen (who comments on blogs by the name BrooklynBus and has his own proposed redesign), there came the question of the route of the B9. Allan was supportive of the idea of running the B9 on Veterans Avenue, taking over what is now a B41 branch, rather than going to Kings Plaza as it does today, legacy of an era when Kings Plaza was a more important shopping destination. I also asked about straightening the route, which currently goes on a combination of Avenues L and M; Avenue M provides a straighter route connecting to the important destinations (the eastern end of the route, and the main drag in Midwood at Avenue M). Allan explained that no, a reroute to Avenue M is not feasible, as east of the heart of Midwood it’s a narrower residential street, forcing the bus to use the wider Avenue L. The only reason the straighter Avenue M route appeared on v1.0 and v1.1 is that I forgot to change it; after we went public with the map, he reminded us.
There are some associated changes to the stop spacing to accommodate the new routes (or, rather, the retention of old routes that we were wrong to try to change before), but overall there is practically no impact on overall trip times. The B9 is a few hundred meters longer than in v1.0 and v1.1, but the cost in on the order of 20 service-hours per weekday, which by itself is a lot lower than my uncertainty in the underlying numbers (which is about 100 hours).
Service-hours vs. fleet requirement
When putting together the redesign, we aimed at one cost metric: service-hours. This is the correct metric for variable bus operating costs, as they are dominated by the driver’s wage (which is hourly, not per km) and to a lesser extent maintenance costs (which are partly distance-based and partly time-based, as the frequent acceleration cycles common to slow bus traffic stress the engine). The MTA costs buses by distance and not time, which is not a bad approximation when all buses are about equally fast, but generates wrong results when the subject of the discussion is speeding up the buses, as we propose.
But there’s one more metric we did not consider: fleet requirement. Our redesign actually saves money there, which should not be a surprise, as it has more off-peak service, which implies less service at the peak. Our 10,000-hour schedule requires a fleet of 1,007 buses, which compares with 1,129 today excluding the MTA Bus-operated B100 and B103 (which look like they require about 40 vehicles between them). Our proposed v1.2 schedule has 7.5% fewer service-hours than today – not because we propose a cut but because we expect future additions and politicized slowdowns to add hours – but 14% fewer buses. The smaller fleet is to be used more intensively and somewhat more efficiently thanks to the removal of short, infrequent routes.
Since the goal is to keep the redesign roughly cost-neutral, it’s likely that overall service-hour figures will rise: higher operating costs will be balanced by slightly lower capital costs, as the MTA will need to procure slightly fewer buses and not need to expand depots for them as much. In 2008-11, the MTA spent $500,000 per bus on procurement; in 2014, this was the cost per standard bus (which is the vast majority of the MTA Bus and NYCT fleet), while articulated buses were $750,000. This is a premium of about 50% over London bus costs.
Overall the fleet requirement looks like a small proportion of the cost. A $500,000 bus, say $600,000 at today’s higher prices, operates for 12 years, and requires a team of about five drivers, each earning around $140,000 a year with benefits. This is just about market wage – San Francisco and Boston, which pay about the same, have trouble finding and retaining drivers; high bus driver wages should be viewed as similar to high wages for oil rig workers, compensating for poor work conditions. Excluding the costs of depot enlargement, the overall exchange rate seems to be about one bus = 40-45 daily service-minutes. At best, our redesign can squeeze maybe 100 extra daily hours out of better fleet utilization.
The Williamsburg issue
As Eric and I have always emphasized in our communications, our redesign is necessarily win-lose – it’s just that there’s overall much more winning than losing. This is true across neighborhoods as well as within neighborhoods. The diciest case is that of Williamsburg, where we are proposing to consolidate a number of routes into 1.5 north-south trunk lines: one is a continuation of the B44 running up Bedford, and the other goes up Graham and thence either Manhattan Avenue (connecting to the G) or McGuinness (a straighter route on a wider street). This guts service to South Williamsburg, especially west of the BQE, where the only remaining stops are the Marcy Avenue J/M/Z subway stop and another stop on Broadway at Bedford.
It’s not an optimal situation. However, it’s a necessary cut, for a number of reasons:
- The existing north-south lines in Williamsburg are for the most part quite weak. The average weekday ridership per route-km in Brooklyn is about 1,100. The Williamsburg routes are at 945 (B43), 613 (B62), 414 (B67), 358 (B48), 225 (B24), and 152 (B32). The strongest two run along the routes that we are retaining for north-south service, but the rest are so weak that consolidation is required; for the same reason, we are replacing the B48 and B69 (which is at 453) in Clinton Hill with a compromise route on Washington.
- The Williamsburg routes are not just weak but also wasteful, measured in ridership per service-hour. Borough average is 55, and the overall strong routes cluster in the 60s, with high ridership balanced by high service. The top three routes are the B74 (98), B1 (82), and B36 (70), serving short-hop trips in Southern Brooklyn. Among the Williamsburg, only the B43 (49) holds up; the B62 (42), B67 (39), B32 (35), B24 (35), and B48 (32) are weak, the last three all falling in the borough’s bottom six.
- The main north-south route in South Williamsburg west of the BQE is Bedford. Unfortunately, a continuous route up Bedford misses the all-important connection to the subway at Marcy. The B62 resolves this issue by detouring to serve Marcy, which slows down through-riders.
- Williamsburg streets are narrow. Even Bedford is only 18 meters wide, comparable to a Manhattan street. Bus speeds are unlikely to be high in such a situation, and bus lanes are guaranteed to be contentious due to the removal of on-street parking and loading access.
- The eastern margins of Williamsburg and Greenpoint are awkwardly just too far away for some people to walk to the subway (Meeker Avenue’s easternmost residential area, at Van Dam, is 960 meters from the nearest bus stop in our plan and 1,370 from the G train), but just close enough that most people will still walk rather than take a bus unless the bus is extremely frequent. Without the travel intensity found in Coney Island and at Kingsborough Community College, there is no hope for the travel volumes justifying very high frequency on the routes there, especially the B1. A frequency-ridership spiral is unavoidable, helping explain the poor performance of the B24 and B48.
The only possible compromise is to keep the B44’s current route on Lee, which in our plan we slightly straightened to reach the Marcy subway station faster. Keeping the northbound direction on Bedford, which serves South Williamsburg more centrally than Lee, is out of the question: south of Flushing Avenue, Nostrand is unambiguously more important, and the northern tail of the B44 is too weak to be allowed to drive the placement of the entire route. The cost of restoring the Lee/Taylor bus stop is small, around 12 daily service-hours, and this can be incorporated into the next version. However, it still only serves the area peripherally, and slows through-riders by around 1.5 minutes each way.
Brooklyn-Queens connections
People have told us that interborough connections are the new hot thing, to replace the borough-by-borough bus planning that currently exists. We are not depicting any on our map beyond what currently exists: one route to JFK, the aforementioned north-south Williamsburg route to Long Island City, and a bunch of east-west routes through Bed-Stuy terminating slightly east of the borough line. We are willing to be convinced otherwise, but so far it seems like adding more connections is difficult, for several unrelated reasons.
Hard boundaries
The Brooklyn-Queens border may not be as stark as the East River or the Harlem River, but it is nonetheless mostly hard. East of the Greenpoint/LIC border, the border follows a polluted industrial creek; the B24 crosses it twice and is very weak, and there’s no good route until the cluster of Grand, Metropolitan, and Flushing around Ridgewood. Metropolitan and Grand do go through, and we indicate them on our map. Flushing doesn’t; there’s no good route in Queens to connect it to except maybe a hybrid of the Q18 and Q47 to LaGuardia, and even that is uncertain.
Beyond Ridgewood, there is another hard boundary consisting of several cemeteries. The B13 goes through today, but is a weak route (473 riders/km, 38/hour) and should be cut to just a north-south subway feeder. To the immediate south of the cemeteries, several Queens buses go through to key connection points in Brooklyn. Only the southernmost zone, around Howard Beach, has weak connections.
Queens is not Brooklyn
Brooklyn is relatively uniformly dense, making a grid with uniformly high frequency tenable. Queens is not. East Elmhurst is several times denser than Queens Village. Central and Eastern Queens have a street hierarchy, in which the list of which streets get bus routes is preordained: Lefferts, Jamaica, Union Turnpike, Main, etc.; it’s not the relatively flat grid hierarchy that characterizes most of Brooklyn. There are multiple town centers to serve, with too sparse a rail network for buses to work purely as a rail feeder. The LIRR has so many stations that there are two distinct optimal maps, one assuming fare and schedule integration with commuter rail and one assuming today’s lack of integration.
What this means is that maybe a uniform 6-minute frequency is not right for Queens. Maybe the larger geographic size of Queens, with longer bus routes, permits slightly lower frequency, say every 8 minutes at the base (maybe even every 10). Combining routes is not always the right approach in this situation; there are going to be frequency-based seams.
Depot locations
There are some potential combinations of Brooklyn and Queens bus routes, most obviously on Avenue, which hosts the B54 and Q55. The B12 could even be combined with the Q56 and Q24 as branches. The Q58, an extremely strong circumferential, could be combined with the B38, the busiest Brooklyn route near its terminus. The problem is that the break points today tend to be very close to bus depots, and often they’re major destinations in their own right, such as the subway connection point at Broadway Junction or at Myrtle/Wyckhoff.
The B54/Q55 combination seems relatively easy, but the rest are more strained. At East New York Depot especially the loss of the easy pullout is unlikely to justify cutting the transfer to the few through-riders.
The City Line problem
At TransitCenter, we were asked specifically about the southernmost part of the Brooklyn/Queens border, covering City Line and Spring Creek on the Brooklyn side and Lindenwood and Howard Beach on the Queens side. The bus network there today is glaring in its gaps: there is no east-west connection south of the Q7 (the B15 looks like a connection on a map, but runs nonstop from Brooklyn to JFK). The street network itself is poorly connected, but even the existing connection at Linden doesn’t host local buses.
And yet, there’s not much room for serious improvements. The B15 could make a stop just over the border on the Queens side, but its route to the airport takes it through a highway with nowhere to stop; a BRT lane with some stops at north-south arteries like Woodhaven might be possible, but would not be a pleasant place to transfer at.
Worse, going on Linden and then southeast toward Howard Beach raises a difficult question: where does such a route go on the Brooklyn side? There are too many options: Gateway Center, New Lots on the 3, Euclid on the A/C. Reverse-branching is out of the question. Of those, probably the best is New Lots – Euclid serves a subway line that Howard Beach can get to more easily without the bus, and Gateway will always be too circuitous compared with driving on the Belt Parkway.
Tweaks vs. redesign
There are tweaks that improve Brooklyn-Queens connectivity, like merging the two Myrtle routes, giving the Brooklyn-JFK route dedicated lanes to facilitate a stop at Woodhaven, and changing the Metropolitan and Grand routes slightly to improve intra-Williamsburg east-west service (already depicted on our map). However, this is not the same as a redesign. In some parts of Brooklyn our proposal is a tweak, for example the east-west routes in Bed-Stuy, but in Southern Brooklyn and East New York we are rationalizing nearly everything into a grid, and in Bushwick and Canarsie we are proposing extensive changes.
Additional routes?
Based on the shape of our proposal, there are a few potential additions. One involves a 16th Avenue north-south route, possibly veering east to follow Cortelyou and Beverly. Another involves an Ocean Parkway bus to Church. A third involves extending the B17 up through Bed-Stuy to provide a second interpolating route between Nostrand and Malcolm X, which is available today (as the B15 and B43) but not on our map. A fourth involves going up Smith Street between Red Hook and Downtown Brooklyn until the subway stops in South Brooklyn are made wheelchair-accessible.
However, all of those add a hefty number of service-hours. Whether they’re tenable depends on how strictly NYC DOT implements our recommendations for dedicated lanes on every bus route. If no bus routes are added on top of the ones that exist today, v1.2 requires 11,050 revenue-hours and 1108 buses. This is still more or less achievable with current resources (it requires about a 1-1.5% increase in costs), but there is no room for any additional routes, or for restoring the B25. And that’s without taking into account compromises on bus stop spacing and bus route reliability.
In contrast, things are rosier if the reliability improvements we prescribe are implemented, and if every bus that needs a dedicated lane (i.e. nearly all of them) gets it even if motorists complain. There’s room in the budget for additional service. The above bus routes, excluding B25 restoration, total about 30 km including some possible tie-ins elsewhere in the system, creating nearly 800 new service-hours, bringing the system to the same place it is today, maybe just 1% short given additional efficiency and fleet savings.
And if higher ridership brings in more revenue for the same expense, there should be room for more service increases. The network in v1.2 could support maximum 5-minute peak headways on all routes for 210 more hours, which should not be hard to accommodate even with more routes. Going down to 4-minute peak headways requires another 370 hours, and going to 5-minute off-peak headways requires another 890.
To do all of this, another 1,300 hours or so are needed net of efficiency gains. To keep the subsidy per rider constant, this requires a 12% gain in overall linked trips, which isn’t outlandish (it would still leave Brooklyn with less bus ridership than at the 2002 peak). Making such expansion cost-neutral is harder: a linked trip nets about $2 in revenue, and this expansion would cost about $95 million annually, and then the required growth in ridership, 47.5 million, is 25% over Brooklyn’s unlinked bus ridership. It still looks achievable but very ambitious, relying on a positive frequency-ridership spiral.
Will this happen?
Some variant of a bus redesign will definitely happen. It’s in vogue in the US right now, and the MTA is taking this as an excuse to rationalize its bus service, which has accumulated a lot of oddities and historical artifacts that no longer make much sense.
The question is, will a good redesign happen? That I don’t know. I believe our redesign is good. The conversations I’ve had with bus planners at the MTA have been positive and suggest to me that, barring political interference, they are likely to come up with good redesigns as well, sharing the same overall characteristics as ours. We are working from the same set of best practices, for the most part.
But then the political question looms large. Physically separated bus lanes and signal priority require the city to give a damn about bus riders. Stop consolidation requires the MTA to stick to a long interstation even if minority of people who are hurt by it (e.g. by having high walk penalties and low wait penalties) complain. All of this requires political appointees at DOT and the MTA to consciously think how they can provide better public transit to the city they serve. Will they deliver?
Our Brooklyn Bus Redesign
Eric Goldwyn and I spent about six months working on a Brooklyn bus redesign. I mentioned some aspects of it before here, on social media, and in blog comments, but not the overall shape. Eric and I gave a pair of presentations about our plan, one two days ago at the MTA in front of senior MTA planners and NYC DOT people and one today at TransitCenter in front of activists and mid-level MTA planners. We have a still-unreleased writeup explaining everything we’re doing with references to both public reports from various cities and peer-reviewed literature. Here I’m going to condense the 8,000-word writeup into a blog post length, going over the main points, including of course the proposed map.
The map, in brief
The depicted version is 1.1. You can see a lower-resolution version 1.0 on Streetsblog, albeit with a different color code (the map we made for the presentation, reproduced on Streetsblog, uses red for the highest-frequency routes and blue for the lowest-frequency ones whereas the Google Earth version linked above is the opposite). It has 353 route-km, down from about 550 today, not including Grand and Metropolitan Avenues, which are Queens bus routes, shown on the map for completeness’s sake, without stopping pattern.
Some tails are cut due to low ridership or duplication of rail:
- The B25 on Fulton goes.
- The B37 on Third Avenue is consolidated into the B63 on Fifth.
- The B45 and B65 are merged into one compromise route.
- The B15 is cut east of the Long-Term Parking JFK AirTrain station (where service is free); ideally it would be cut east of City Line with passengers taking the subway to the AirTrain (as was the case in version 1.0), but I do not expect Port Authority to integrate AirTrain fares with the subway.
- The B41 is cut north of Parkside Avenue, at the transfer to the B/Q.
- Instead of two routes in Bed-Stuy between Nostrand (i.e. B44) and Malcolm X (i.e. B46), today’s B15 and B43, there’s just one route.
- The B57 segment on Court and Smith Streets in South Brooklyn goes, as the subway serves the area in several directions.
- The B39 over the Williamsburg Bridge goes.
- The B32 and B62, providing north-south service through Williamsburg up to Long Island City, are merged into one compromise route.
- The East New York bus network is circuitous (buses go to Gateway Center the long way around) and is straightened here.
- In version 1.0, the B26 on Halsey was cut west of Franklin with a forced transfer to the subway, but the short distance to Downtown Brooklyn argues in favor of continuing to at least Flatbush.
Overall, this is a cut from 54 routes (including the separately-managed MTA Bus routes B100 and B103) to 37. The smaller network is far more frequent. The minimum frequency is,
- Every 6 minutes between 6 am and 10 pm every day.
- Every 10 minutes between 5 and 6 am and between 10 pm and midnight.
- Every 30 minutes between midnight and 5 am; every 20 minutes with timed transfers to the subway is aspirational, but the subway doesn’t run reliably on a timetable overnight for such a system to be viable. The 30-minute night network could potentially involve mini-pulses in Downtown Brooklyn and smaller hubs (like East New York and Bay Ridge).
Routes depicted in red on the Google Maps link, or in blue on the map in the Streetsblog link, have exactly the minimum frequency. Routes depicted in green have higher frequency at the peak; routes depicted in blue on Google Maps or red on Streetsblog have higher frequency peak and off-peak. Higher frequency than the minimum is depicted as “Utica [2/4]” (buses on Utica run every 2 minutes peak, 4 off-peak) or “Avenue U [5/6]” (buses on Avenue U run every 5 minutes peak, 6 off-peak). Peak means 7-9 am and 5-7 pm on weekdays, in both directions; the morning peak is a little earlier and the afternoon peak a little later than the subway peak, but as buses are still mostly subway feeders, an earlier morning peak and a later afternoon peak are justifiable.
Speedup treatments
Pruning the network is not the only or even most important part of bus reform. Buses have to be sped up to be useful for people except as last-resort transit. In interviews about unrelated topics, people have volunteered to me that they do not take trips they used to take due to the degradation in bus speed and reliability. New York City Transit bus ridership peaked in 2002; the fare hike in 2003 led to a small dip in ridership that the mid-2000s oil crisis didn’t quite erase, and then in the recession and subsequent recovery bus ridership crashed. In Manhattan it’s 30% below the 2007 level; in Brooklyn it’s 20% below the 2007 level, with buses extending the subway or letting people connect to a better line (like the B41 and B35) particularly hit.
The current average speed in Brooklyn is about 11 km/h. Excluding limited-stop buses, it’s 10.8. We’re proposing to increase it to 15, even though the redesign is pruning buses in faster areas more than in slower ones. This is using four speedup treatments.
Prepayment
Today, New York prefers to treat off-board fare collection as a special product available only on select buses (i.e. SBS). This should be changed to citywide prepayment, with all-door boarding. German-speaking cities do it; so does San Francisco. Data from San Francisco and from the TRB (PDF-p. 20) suggests a gain of about 2.5-3 seconds per passenger boarding, counting both boarding and alighting time. At Brooklyn’s bus ridership level, this suggests a saving of around 400-450 revenue-hours, or about 4% of total service-hours. This is not a big change, but it helps stabilize the schedule by slowing down the mechanism by which buses bunch.
How to get passengers to pay if not on-board remains an open question; there are several approaches. The Zurich model involves placing a ticket-vending machine (TVM) at every bus stop. While New York severely pays for TVMs on SBS (the RPA says $75,000 per stop), an ATM costs $3,000, so installing the required infrastructure need not cost a lot. But more commonly, passengers can board freely if they have transfers or unlimited monthlies and pay the driver (potentially after the bus has begun moving) otherwise.
Of note, the bus drivers are particularly interested in prepayment. Eric and I explained the issue in a CityLab article a few months back: the drivers are worried about being assaulted by riders who don’t want to pay.
Stop consolidation
About 60% of the time saving in our plan relative to current practices comes from stop consolidation. I discussed the issue here, and our forthcoming report has references to many studies in the literature optimizing stop spacing for minimum door-to-door travel time. With each deleted stop saving 20-30 seconds (say 25 seconds on average), our proposed stop consolidation, from an average of 220 meters to 490 excluding long tails (i.e. the B15’s long nonstop segment toward JFK) saves around a minute per km, cutting travel time from 5.5 minutes per km to 4.5.
Conceptually, stop spacing should be longer when trips are longer, or when relative density is less uniform. New York City Transit bus trips are short, as many are subway extenders, but relative density is extremely spiky, as a large number of people get off at a few dominant stops at the subway connection points. If the on/off density on a route is uniform, then lengthening the stop spacing means passengers have to walk longer at both ends; but if passengers are guaranteed a connection at one end (because of transfer points with the subway or other buses) then they only have to walk longer at the other end. Based on this principle, Utica and Nostrand get particularly long stop spacing. Conversely, routes with extremely short trips, like the Mermaid route inherited from the B74, have shorter stop spacing.
To improve network legibility, we have tried as far as possible to have buses stop on consistent streets. For example, south of Fulton Street (where it’s awkwardly between Nostrand and Franklin), Bedford Avenue gets a stop on every intersecting bus, including east-west routes but also the diagonal B41.
Every bus stop should have shelter. In Central Florida, North Florida, and London, this costs $10,000 per stop, give or take. Our 707-stop plan (700 in version 1.0) would cost $14 million at this cost. Even at Santa Ana’s higher cost of $35,000, it’s $50 million. NIMBYs who oppose stop consolidation argue that having many stops is necessary for people with disabilities, but people with disabilities would benefit from benches and shelter, without needing to stand for 15 minutes waiting for bunched buses.
Bus lanes
Every bus in an area with congestion should get dedicated lanes. SBS implementations so far, imperfect as they are, have saved around 30 seconds per km in traffic. Physically-separated median lanes should do better; the MTA and NYCDOT have so far avoided them on the theory that local and limited bus routes should coexist on the same route and limiteds should pass locals, but in reality, a single stopping pattern is better, and then there are no drawbacks to physical separation.
On wide streets, this is not a problem. On narrow ones, it is. The real headache is Nostrand, about 25 meters wide building to building, enough for just four lanes. The correct thing to do is a moving lane and a bus lane in each direction, with merchants told to park on side streets. If parking is unavoidable, then a contraflow bus lane, with parking on one side, is also feasible, but less safe for pedestrians (Boulevard Saint-Michel has this configuration and has to remind pedestrians crossing the street to look left).
Two-way buses are essential whenever streets are widely separated, as on avenues, in Brooklyn as well as Manhattan. Nostrand is just more important than Rogers and New York Avenue, where northbound B44s go today; today’s configuration forces east-west buses to make too many stops (the B35 limited makes 4 stops in a kilometer).
Signal priority
Buses should get priority at intersections and not just on the street. The studies we’ve seen find a 4-7% gain, bus only on individual bus routes, not gridded networks. In our proposed trip times we are not assuming any speedup from signal priority, just better timekeeping as more delayed buses get priority to stabilize the schedule. This is a counter-bunching mechanism more than a straight speedup.
A process, not an immutable product
Jarrett Walker’s bus network redesigns tend to come as complete products, changed rapidly from radial low-frequency networks. What we’re proposing is a longer process. Nova Xarxa began implementation in 2012 and is wrapping up now, installing a few routes at a time by cannibalizing parallel routes. The map we’re showing is what we estimate would be a good fit for 2022-3. Beyond that, more subway stops are going to be wheelchair-accessible, making it easier to prune more subway-parallel buses (like the B63).
Gradual implementation means starting from the easier parts of the network. East New York’s current network is so circuitous that straightening it should not be too controversial. Our proposed redesign there is also better at connecting to the 2, 3, 4, and 5 trains and not just the L, which should prove valuable during the L shutdown. In Southern Brooklyn, we are proposing more service, but this could be paired with stop consolidation. Central Brooklyn and Bed-Stuy require the most street redesigns and the most robust frequency network-wide (as they are already transfer-based grids, and nobody transfers at 12-15 minute off-peak frequency) and could be done later; the B25 itself should probably not be eliminated until Broadway Junction is made accessible on the A and C lines.
We are not even wedded to the map as a proposal for 2022. Some variations are always possible, as already seen in the differences between versions 1.0 and 1.1. The biggest addition we can think of is adding a second north-south route through Bed-Stuy: the existing one would be moved from Marcus Garvey to Throop (hitting the subway better), while the B17 could be extended up Troy and Lewis.
Overall, Brooklyn has 10,800 service-hours today. Our redesign uses just 10,000, with a 1% gain in efficiency from location relative to bus depots on top of that. There is room for service increases, or restoration of marginal routes required for political reasons, or slowdowns imposed by political unwillingness to install bus lanes.
Win-lose
In a modern developed country, it’s rare to find win-win situations. The US is blessed with these in transit (i.e. it’s so inefficient at construction it might as well be third-world), but not in urban bus networks. Stop consolidation is a net benefit to the average user of the route, but a few people would still see longer trips, e.g. those living at the exact midpoint between two widely-spaced stops. Route consolidation (as in Ocean Hill) is the same thing.
There are sociopolitical groups that would win out: labor would see higher ridership, reducing the pressure to cut jobs; regular commuters (who generally have low transfer penalties) would see faster trips; people with disabilities that make it difficult for them to stand (as is true of some people with chronic pain) would be able to sit at bus stops and wouldn’t need to sit for long. In contrast, small business owners would sometimes lose the ability to park in front of their stores, and occasional users who usually drive would see longer perceived trips because of stiff transfer penalties.
This is equally true on the level of neighborhoods. Southern Brooklyn generally gains, and Borough Park in general gains an extra north-south route (though this is canceled out by high transfer and access penalty among Haredis: in Israel they just won’t walk longer to better service). East New York sees much more direct routes. Flatbush and East Flatbush don’t see much change in network structure but do gain off-peak frequency. Red Hook gains a direct connection to Manhattan. But then Bed-Stuy loses north-south routes, South Brooklyn’s buses are completely gutted, and Williamsburg loses north-south routes.
A political system based on citywide (or nationwide) ideological groups could find the will to build the network we’re proposing or something like it. Could a system based on local representation, treating retirees and small business owners as a vanguard class, deliver the same? We will see in the next year or two.
Sioux City: Straightening Buses and Getting Route-Length Right
A few days ago, Sandy Johnston linked to a diagram of the single bus route in South Sioux City, Nebraska, a suburb of Sioux City, Iowa. While South Sioux City has a traditional main street in Dakota Avenue, the bus does not follow it; it meanders, hitting destinations on and off Dakota. Many destinations are on US Route 77, an arterial bypass around the built-up area, with recent auto-oriented retail and office uses, including a Wal-Mart (in small-town America often the biggest bus trip generator). The discussion around what to do with this region’s bus network made me realize a crucial concept in planning infrequent transit: getting route-length right. To start with, here is a map of the bus, numbered Route 9 within the Sioux City area:
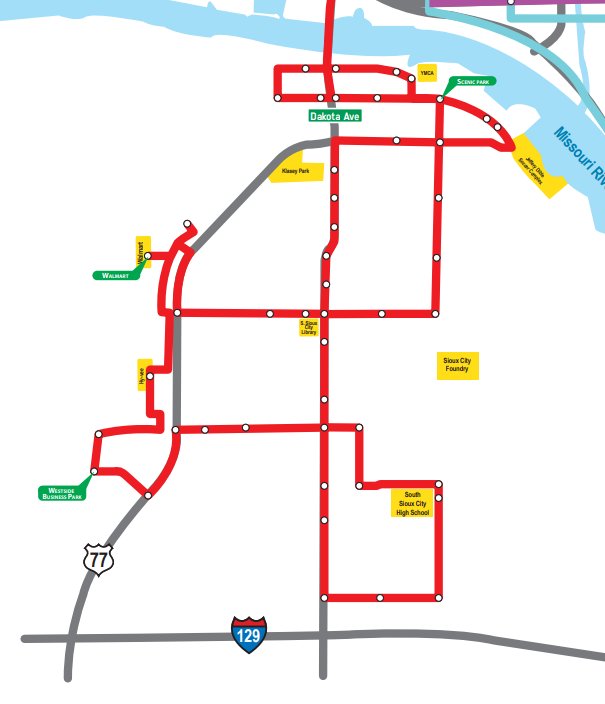
Here is a PDF map of the entire network. It has 10 routes, using 12 buses running hourly, with a timed meet at the center of Sioux City (just off the above map) at :30 every hour. Most routes run as loops, with highly separated inbound and outbound legs. Route 9 above runs one-way southbound on Dakota Avenue in the northern and southern legs but then meanders to run southbound on Route 77; the Dakota Avenue leg in between the two major east-west runs is one-way northbound.
I asked, why need it be so complicated? The major destinations are all on Dakota or Route 77. It should be easy to run two distinct routes, one on each, right? Without the east-west meanders, there would be the same total service-hours, right?
But no. The route runs hourly. The scale of the map is small: from the bridge over the Missouri in the north to I-129 in the south it’s 4.1 km. There is so little traffic that in the evening rush Google Maps said it would be just 10 minutes by car from Downtown Sioux City to the southern edge of Dakota Avenue near I-129. The roundtrip time would be 25-30 minutes, so the bus would sit idle half the time due to the hourly pulse.
Getting route-length right
When designing regional rail schedules, as well as my take on night buses in Boston (since reduced to a single meandering route), I’ve taken great care to deal with roundtrip route length not always being an integer multiple of the headway. A train that comes every half hour had better have a roundtrip length that’s just less than an integer or half-integer number of hours, counting turnaround times, to minimize the time the train sits at the terminal rather than driving in revenue service. The same is true of buses, except that scheduling is less precise.
In Boston, the plan at the time was for hourly buses, and has since changed to half-hourly, but the principle remains. The roundtrip length of each leg of the night bus network, should it expand beyond one (double-ended) route, should be an integer or half-integer number of hours. In practice this means a one-way trip time of about 25-26 minutes, allowing for a little recovery time and for delays for passengers getting on or off; overnight there is no traffic and little ridership, so 25 minutes of driving time correspond to just less than 30 minutes of actual time.
Thus, on each corridor, the bus should extend about 25 minutes of one-way nighttime driving time from the connection point, and the choice of which routes to serve and where to end each route should be based on this schedule. Of course on some shorter routes 12 minutes (for a half-hour roundtrip) and on some long routes 38 minutes (for a 90-minute roundtrip) are feasible with half-hourly frequencies, but in Boston’s case the strong night bus routes in practice would all be 25.
Length and frequency
In the case of Sioux City, hourly buses meeting at the center should have a one-way trip time of 25 minutes. However, the city is so lightly populated that there is little traffic, and the average traffic speed is so high that 25 minutes puts one well outside the built-up area. The driving time from city center to the edge of the built-up area, around I-129, Lakefront Shopping Center, and the various Wal-Marts ringing the city, is around 10 minutes.
Moreover, a car travel time of 10 minutes corresponds to not much longer on a bus. Frequent commenter Zmapper notes that in small American cities, taking the driving time in traffic and multiplying by 1.2, or 1.3 with recovery time, is enough. A one-way driving time of 11-12 minutes involves a roundtrip bus time of half an hour.
With such a small urban extent, then, the bus frequency should be bumped to a bus every half hour, leveraging the fact that few important destinations lie more than 11-12 minutes outside city center. The question is then how to restructure the network to allow for doubling frequency without doubling operating expenses.
The importance of straight routes
Some of Sioux City’s bus routes go beyond the 12-minute limits, such as route 6 to the airport. But most stay within that limit, they’re just incredibly circuitous. Look at the map of route 9 again. It jumps between two main corridors, has multiple loops, and enters the parking lots of the Wal-Mart and other destinations on US 77.
The reason for the meanders is understandable. US 77 is a divided highway without sidewalks or crosswalks, and none of the destinations thereon fronts the road itself. From the wrong side of the road to Wal-Mart it’s 330 meters, and a few other retail locations are more than 100 meters off. Many agencies wince at making passengers walk this long.
However, understandable does not mean justifiable. Traversing even 330 meters takes only about 4 minutes, and even with a hefty walking penalty it’s much less than the inconvenience caused by hourly headways. The other routes in the Sioux City area have the same problem: not a single one runs straight between city center and its outer destination.
With straighter routes, the savings in service-hours would permit running every half hour. A single bus could run every half hour if the one-way car travel time were at most 11-12 minutes; up to 23 minutes, two buses would provide half-hourly service. With 12 buses, there is room to replace route 9 with two routes, one on Dakota and one on US 77 (possibly entering the Wal-Mart, since the route is so short it may be able to get closer to Wal-Mart while still staying under 12 minutes). The Lakeport Commons and Southern Hills Mall area could get buses at the entrance, as it is the logical end of the line (route 1, to Southern Hills).
Some pruning would still be required. Some low-density areas far from the main corridors would have to be stranded. Some circumferential lines would be pruned as well, such as route 10 (to the Commons) on US 75 and route 2 (on Pierce Jackson) to Wal-Mart. Circumferential lines at such a low frequency are not useful unless the transfers to the spokes are timed, which is impossible without breaking the city center interchange since the lines take different amounts of time to get between city center with the plausible connection point. Ultimately, replacing the hourly routes with half-hourly routes would guarantee better service to everyone who’d still get any service, which is nearly everyone.
It’s not just Sioux City
I focus on Sioux City because it’s a good toy model, at such scale that I could redesign the buses in maybe two weeks of part-time work. But it’s not the only place where I’ve seen needlessly circuitous routes wreck what should be a decent bus network for the city’s size and density. In 2014 Sandy wrote about the bus network in New Haven, which has okay trunks (I only needed to hitchhike because of a bus delay once – the other four or five times I took the bus it was fine) but splits into indescribably complex branches near its outer ends.
More recently, I looked at the network in Ann Arbor, partly out of prurient interest, partly out of having gone to two math conferences there and had to commute from the hotel to the university on the city’s most frequent bus, route 4. Zoomed out, the Ann Arbor map looks almost reasonable (though not quite – look at routes 5 and 6), but the downtown inset shows how route 4 reverse-branches. Ann Arbor is a car-oriented city; at my last math conference, in Basel, a professor complained that despite the city’s leftist politics, people at the math department were puzzled when the professor biked to campus. The buses are designed to hit every destination someone who’s too poor to own a car might go to, with speed, frequency, and reliability not the main concerns.
The underlying structure of bus networks in small American cities – radial buses converging on city center, often with a timed transfer – is solid. The problem is that the buses run every hour when cities should make an effort to run them every half hour, and the routes themselves are circuitous. In very small cities like Sioux City, increasing the base frequency is especially urgent, since their built-up extent is so compact a direct bus would reach the limit of the serviceable area in 10-12 minutes, perfect for a half-hourly schedule, and not the 25 minutes more typical of hourly schedules. Sometimes, scaling down requires maintaining higher frequency than the bare minimum, to avoid wasting drivers’ time with low-value meanders.
Overbuilding for Future Capacity
I ran a Patreon poll with three options for posts about design compromises: overbuilding for future capacity needs, building around compromises with unfixably bad operations, and where to build when it’s impossible to get transit-oriented development right. Overbuilding won with 16 votes to bad operations’ 10 and development’s 13.
It’s generally best to build infrastructure based exactly on expected use. Too little and it gets clogged, too much and the cost of construction is wasted. This means that when it comes to rail construction, especially mainline rail, infrastructure should be sized for the schedule the railroad intends to run in the coming years. The Swiss principle that the schedule comes first was just adopted in Germany; based on this principle, infrastructure construction is geared around making timed transfers and overtakes and shortening schedules to be an integer (or half-integer) multiple of the headway minus turnaround time for maximum equipment utilization.
And yet, things aren’t always this neat. This post’s topic is the issue of diachronic optimization. If I design the perfect rail network for services that come every 30 minutes, I will probably end up with a massive upgrade bill if ridership increases to the point of requiring a train every 20 minutes instead. (I chose these two illustrative numbers specifically because 30 is not a multiple of 20.) In some cases, it’s defensible to just build for higher capacity – full double-tracking even if current ridership only warrants a single track with passing sidings, train stations with more tracks in case more lines are built to connect to them, and so on. It’s a common enough situation that it’s worth discussing when what is technically overbuilding is desirable.
Expected growth rates
A fast-growing area can expect future rail traffic to rise, which implies that building for future capacity today is good. However, there are two important caveats. The first is that higher growth usually also means higher uncertainty: maybe our two-track commuter line designed around a peak of 8 trains per hour in each direction will need 32 trains per hour, or maybe it will stay at 8 for generations on end – we usually can’t guarantee it will rise steadily to 16.
The second caveat, applicable to fast-growing developing countries, is that high growth raises the cost of capital. Early British railroads were built to higher standard than American ones, and the explanation I’ve seen in the rail history literature is that the US had a much higher cost of capital (since growth rates were high and land was free). Thus mainlines in cities (like the Harlem) ran in the middle of the street in the US but on elevated structures in Britain.
But with that in mind, construction costs have a secular increase. Moreover, in constrained urban areas, the dominant cost of above-ground infrastructure cost is finding land for multiple tracks of railroad (or lanes of highway), and those are definitely trending up. The English working class spent 4-5% of its income on rent around 1800 (source, PDF-p. 12); today, spending one third of income on rent is more typical, implying housing costs have grown faster than incomes, let alone the general price index.
The upshot is that cities that can realistically expect large increases in population should overbuild more, and optimize the network around a specific level of traffic less. Switzerland and Germany, both of which are mature, low-population growth economies, can realistically predict traffic many decades hence. India, not so much.
Incremental costs
The expected growth rate helps determine the future benefits of overbuilding now, including reduced overall costs from fronting construction when costs are expected to grow. Against these benefits, we must evaluate the costs of building more than necessary. These are highly idiosyncratic, and depend on precise locations of needed meets and overtakes, potential connection points, and the range of likely train frequencies.
On the Providence Line, the infrastructure today is good for an intercity train at current Amtrak speed every 15 minutes and a regional train making every stop every 15 minutes. There is one overtake segment at Attleboro, around three quarters of the way from Boston to Providence, and the line is otherwise double-track with only one flat junction, with the Stoughton branch. If intercity trains are sped up to the maximum speed permitted by right-of-way geometry, an additional overtake segment is required about a quarter of the way through, around Readville and Route 128. If the trains come every 10 minutes, in theory a mid-line overtake in Sharon is required, but in practice three overtakes would be so fragile that instead most of the line would need to be four-tracked (probably the entire segment from Sharon to Attleboro at least). This raises the incremental costs of providing infrastructure for 10-minute service – and conversely, all of this is in lightly developed areas, so it can be deferred without excessive future increase in costs.
An even starker example of high incremental costs is in London. Crossrail 2 consists of three pieces: the central tunnel between Clapham Junction and Euston-St. Pancras, the northern tunnel meandering east to the Lea Valley Lines and then back west to connect to the East Coast Main Line, and the southern tunnel providing two extra tracks alongside the four-track South West Main Line. The SWML is held to be at capacity, but it’s not actually at the capacity of an RER or S-Bahn system (as I understand it, it runs 32 trains per hour at the peak); the two extra tracks come from an expectation of future growth. However, the extreme cost of an urban tunnel with multiple new stations, even in relatively suburban South London, is such that the tunnel has to be deferred in favor of above-ground treatments until it becomes absolutely necessary.
In contrast, an example of low incremental costs is putting four tracks in a cut-and-cover subway tunnel. In absolute terms it’s more expensive than adding passing tracks in suburban Massachusetts, but the effect on capacity is much bigger (it’s an entire track pair, supporting a train every 2 minutes), and moreover, rebuilding a two-track tunnel to have four tracks in the future is expensive. Philadelphia most likely made the right choice to build the Broad Street Line four-track even though its ridership is far below the capacity of two – in the 1920s it seemed like ridership would keep growing. In developing countries building elevated or cut-and-cover metros, the same logic applies.
Sundry specifics
The two main aspects of every infrastructure decision are costs and benefits. But we can discern some patterns in when overbuilding is useful:
- Closing a pinch point in a network, such as a single- or double-track pinch point or a flat junction, is usually worth it.
- Cut-and-cover or elevated metro lines in cities that are as large as prewar New York (which had 7 million people plus maybe 2 million in the suburbs) or can expect to grow to that size class should have four tracks.
- On a piece of infrastructure that is likely to be profitable, like high-speed rail, deferring capacity increases until after operations start can be prudent, since the need to start up the profitable system quickly increase the cost of capital.
- Realistic future projections are imperative. Your mature first-world city is not going to triple its travel demand in the foreseeable future.
- Higher uncertainty raises the effective cost of capital, but it also makes precise planning to a specific schedule more difficult, which means that overbuilding to allow for more service options becomes reasonable.
- The electronics before concrete principle extends to overbuilding: it’s better to complete a system (such as ETCS signaling or electrification) even if some branches don’t merit it yet just because of the benefits of having a single streamlined class of service, and because of the relatively low cost of electronics.
Usually cities and countries should not try to build infrastructure ahead of demand – there are other public and private priorities competing for the same pool of money. But there are some exceptions, and I believe these principles can help agencies decide. As a matter of practice, I don’t think there are a lot of places in the developed world where I’d prescribe overbuilding, but in the developing world it’s more common due to higher future growth rates.
The Dynamics of Bus Bunching
I’ve been wanting to write a paper about how to use dynamical systems to analyze failure modes for transportation networks. So far I haven’t been able to analyze this more carefully, but there’s one relatively simple example, namely bunching along a single bus line. This intersects to some extent with what I did in math academia, although the mathematical tools I’m using are fairly primitive within dynamics, going back to the early 20th century and not to the advanced machinery that dynamicists have developed in the last forty years (like the Mandelbrot set). As a caution, despite the math jargon and the math paper structure, it’s a blog post, and not something I’d even be comfortable uploading to the arXiv.
The upshot of the mathematical model in this post is that several already-understood reforms can seriously reduce bus bunching: speeding up boarding through prepayment and all-door boarding, using bigger buses with many doors on the busiest routes, implementing signal priority and enforcing bus lanes better, and improving dispatching to tell bus drivers to maintain even headways leaving each terminus. Section 1 provides mathematical background, and people who know some dynamics can skip it; it’s meant to be accessible to a general audience (if you’ve heard of derivatives, you should be fine). Section 2 constructs the model for bus schedule variations, section 3 explains how the model predicts bunching, and section 4 goes into how the above interventions can improve the situation. The mathematics I’m using is not terribly advanced, but it may benefit from careful reading, especially around the formulas.
1. Background on dynamics and chaos
Before I left academia, when people asked me to explain my research, I’d use the following example. In dynamics, we study what happens when we take a function and iterate it many times. We are specifically interested in chaotic behavior, which arises when two very close numbers can end up widely separated after sufficient iteration. There is no chaos if we only look at linear functions, so the simplest example is quadratic:

The simplest behavior of any number when we apply a function many times is if nothing changes. A point where this happens is called a fixed point. Two numbers are fixed points for the function x^2: 0 and 1. But in practice, it’s useful to view infinity as a number, so that instead of being far away from each other, the numbers 1,000,000, 1,000,000,000, and -1,000,000 should be viewed as all very close to infinity. Under the squaring function, infinity is a fixed point as well.
The key to understanding the dynamics of a function is to look at the behavior of the function near a fixed point. Near the point 0, if we take the square of a number, it gets much smaller. For example, 0.1^2 = 0.01. This means that if a number x is close to zero, then as we iterate the function x^2 we will get closer and closer to 0, very quickly. This behavior is called attracting. Near 0, small changes in initial conditions don’t matter much: the numbers 0.1 and 0.11 are close, and if we keep squaring them, we will approach 0 either way. Infinity is attracting as well once you get used to thinking of very large (or very large with a negative sign) numbers as close to infinity: 1,000 is pretty close to infinity and 1,000^2 = 1,000,000, even larger, i.e. closer.
However, near the point 1, we get the opposite behavior: 1.1^2 = 1.21, which is about twice as far away from 1 as 1.1, and similarly 0.9^2 = 0.81, again about twice as far away from 1 as 0.9. We then say that 1 is a repelling point. Near a repelling point, we have chaotic behavior, because two points that start out close, like 0.9 and 1.1 or even 0.99 and 1.01, end up widely separated after iteration (0.99 eventually approaches 0, 1.01 eventually approaches infinity).
If you’ve learned calculus, your reaction to the line about how 1.21 is about twice as far away from 1 is “the derivative is 2!”. In general, the way to figure out whether a fixed point is attracting or repelling is to take the derivative f‘(x) at the point (technically it’s called the multiplier). If the absolute value of the derivative is less than 1, the point is attracting; if it’s more than 1, the point is repelling; if it’s exactly equal to 1, we say the point is indifferent and then the behavior near the fixed point depends on further details that I don’t want to get into. As a note of caution, taking the derivative anywhere except at a fixed point won’t tell you anything about the function – for example, the derivative of x^2 (which is 2x) is 4 when x = 2 but 2 is not repelling, it’s a non-fixed point that ends up going off to infinity.
(You may wonder what it exactly means to take the derivative at infinity. The answer is that if f is a polynomial, then the multiplier at infinity is always 0. If f is not a polynomial, there is a definition on Wikipedia.)
Attracting points are in every sense nicer to deal with than repelling points. Unfortunately, chaos is everywhere: most points of every nonlinear function are repelling. More precisely: in addition to fixed points, there are periodic points (i.e. fixed points of iterates). The periodic points of x^2 are a little hard to unpack if you’re not used to complex numbers: they’re solutions to equations like x^4 = x, x^8 = x, etc., and these are all complex numbers on the unit circle. We can compute multipliers there too (take the derivative of the iterate for which they’re fixed) and classify them as attracting or repelling. One of the foundational theorems of dynamics is that all but finitely many periodic points are repelling – and the number of non-repelling points is at most 2d-2 where d is the degree of the function (and if the function is a polynomial of degree d, then there are at most d-1, not counting infinity). My main contribution to math is to extend this result to a certain number-theoretic application.
2. Modeling buses using dynamics
The key insight of why buses bunch is that maintaining the exact schedule is a repelling fixed point, so small variations from the schedule (due to traffic, slow passengers, or random noise in passenger numbers) will compound over time, just as the variation of 0.9 or 1.1 from 1 compounds over time as you apply the squaring function.
More precisely, let’s say buses on a certain street run every 10 minutes. Eventually we will call the scheduled headway h, but to make this concrete, let’s say h = 10 minutes. Every few hundred meters, the buses stop to pick up and drop off passengers. Before San Francisco instituted prepayment, each additional passenger took on average 3.9 seconds to board and another 3.9 to disembark (link, PDF-p. 14); the TRB claims the average is 3 seconds to board (link, PDF-p. 20). We will call the extra boarding time per passenger b, and right now set b = 3 seconds = 0.05 minutes.
To understand why bunching occurs, let’s say that our bus falls behind schedule by a minute. It’s now 11 minutes behind the bus ahead (which we’ll assume is on schedule), not 10 minutes. On average, there will be 10% more passengers to pick up at each stop (passengers arrive at stops at a uniform rate). Let’s say the bus gets 60 boardings per hour (which is the Brooklyn-wide average). Typically we expect the bus to get 10 boardings in the next 10 minutes, but because there are 10% more passengers per stop, there will instead be 11 boardings. The one extra boarding will slow the bus down by 3 more seconds. The bus will then be 1:03 minutes behind. It’s a small difference, but over time it compounds.
There will also be more alightings as the bus gets more crowded, with a lag time equal to average passenger trip length. But in practice, to avoid introducing exponential factors, complicating the analysis, it’s best to just think of boardings plus alightings as a single metric, which if there are 60 boardings per hour equals 120 per hour or 2 per minute, and take note that a 1-minute delay only starts accumulating half a lag time in the future (e.g. 10 minutes if the average unlinked passenger trip is 20 minutes, as in New York). We call the number of boardings plus alightings per hour r, and in our example case r = 2.
If we choose our unit of time to be the minute, then the formula for the average delay a minute after our bus was x minutes behind the bus ahead is,
In the example we worked out above, it took 10 minutes to accumulate an additional 6-second delay (3 from boarding, 3 from alighting). Using the numbers h = 10, x = 11, b = 0.05, r = 2, verify that the formula spits out 0.01, or in other words an extra 0.6-second delay per minute. If x = h, that is if the headway between our bus and the bus ahead is exactly as timetabled, then there is no additional delay, making the correct headway a fixed point, but a repelling one. The multiplier is equal to,

Note that choosing units is important. The reason is that the mathematics I’m using assumes there are discrete steps: you apply the squaring function (or any other nonlinear function) once at a time. In reality, time is continuous. So to model it using discrete dynamics, it matters which unit of time we pick; this is the equivalent of choosing between x^2, x^4, x^16, or any other iterate. Fixed points will stay attracting or repelling (or indifferent) no matter what, but the exact value of the multiplier will change.
With this in mind, when our quantum of time is a minute, the multiplier with our usual values of h, b, and r is equal to 1.01. Every minute, a delay multiplies by a factor of 1.01. Within an hour, this factor grows to 1.82. This doesn’t seem too bad – it means a 1-minute delay turns into a 1:49-minute delay within an hour.
3. How bunching occurs
In section 2 we showed that if h is the scheduled headway, b is the average boarding time per passenger, r is the average number of boardings and alightings per unit of scheduled service time, and x is the current distance (in units of time) between our bus and the bus ahead of us, then within a minute we expect the distance to grow to
The multiplier is 1 + rb/h, which doesn’t seem too bad. However, there are complications. For one, the initial delay may be not 1 minute but longer. In Eric Goldwyn’s interviews with drivers, they cited traffic as the top reason why they believed bunching occurs, and barely mentioned passenger boardings. In math we cannot conflate popular perception with reality, but that the drivers complain about traffic suggests that there is widespread variation in the extent of the initial delays coming from missing a light, drivers blocking the bus lane, etc. If the initial delay is 2 minutes, then all delay numbers are naturally doubled over 1 minute.
But more importantly, our delayed bus will never bunch with the bus ahead. It will bunch with the bus behind. And the effect of the model of cascading delays on the bus behind us is exactly double what I described above. The reason is that if our bus is a minute behind – for example, 11 minutes behind the bus ahead when it should be 10 minutes behind – then the bus behind us, if it starts out on schedule, is now a minute ahead, only 9 minutes behind us when it should be 10 minutes. This means that within 10 minutes, we fall 6 seconds behind (and are thus 11:06 behind the bus ahead of us), but by the same token the bus behind us advances 6 seconds ahead (and is thus 8:48 behind us). In practice, the quantity relevant to bunching is the distance between two successive buses, and behind us, the multiplier is not 1.01 but 1.02. Within an hour a 1-minute delay reduces the gap between our bus and the bus behind us by 3:17, and a 2-minute delay reduces it by 6:34, almost two thirds of the way to catching up with us. If the initial delay is 1 minute, the bus behind us will actually catch up with us within 

And third, the multiplier grows as r grows and h falls – that is, it’s higher when the frequency is higher and when there are more riders per service hour. Keeping r at 2 (again, this is 60 boardings and 60 alightings per hour) but lowering h to 5 raises the multiplier to 1.02 ahead of us and 1.04 behind us. A multiplier of 1.04 with a headway of 5 minutes means the bus behind us will catch us within 
The real limiting factor to the capacity of city buses is not minimum stopping distance, unlike with trains. It’s that as the headway h decreases, bunching becomes so routine that adding more buses does not actually add capacity. If a bus runs every 2.5 minutes, keeping b = 0.05 and r = 2 gives us a multiplier of 1 + 0.05*2/2.5 = 1.04 ahead of us and then 1.08 behind us; the bus behind us will catch our bus within 12 minutes.
4. How to reduce bunching
The formula for the multiplier of the dynamical system formed by bus performance is 1 + rb/h where r is the rate at which passengers board and alight, b is boarding time per passenger, and h is scheduled headway. However, since as our bus gets further and further behind, the bus behind us gets further ahead relative to schedule and certainly relative to us, the multiplier relevant to bunching is 1 + 2rb/h. The bus behind us will catch ours in

minutes, where d is the initial delay (so we start the calculation from x = h + d). On very frequent buses, this will happen very quickly: 2.5-minute headways with New Yorkish assumptions on passenger traffic density and conservative assumptions on boarding speed yield a catchup time of just 12 minutes. So how do we prevent this?
4.1. Reduce boarding time per passenger
Off-board fare collection allows passengers to board the bus more quickly, without paying the driver. This has the effect of greatly reducing b, from 3 seconds to about 1.2 per the TRB. Prepayment also allows all-door boarding, effectively halving the average boarding time per passenger at stops without large volumes of disembarking passengers.
But in addition to prepayment, there are other ways of reducing b. Low-floor buses allow passengers to get on and off more easily; the reason San Francisco’s numbers are higher than the TRB’s is that San Francisco assumes a mostly high-floor bus fleet, whereas on the low-floor fleets boarding is much faster (in fact, faster on low-floor buses without prepayment than on high-floor buses with).
Adding more doors is desirable as well. The typical 12-meter bus has two doors, but some cities have purchased three-door buses, such as Nice and Florence. The typical 18-meter accordion bus has three doors, but in Florence I have seen four-door accordion buses; in contrast, the older accordion buses in New York only had two doors, slowing down boarding and alighting at busy stations. Per TRB data, three-door buses reduce b from 3 seconds to 0.9, or 0.015 minutes. One third the multiplier means roughly three times the time it takes to bunch.
4.2. Use bigger buses
The multiplier depends only on the rate at which passengers wish to board our route. Adding more bus service will reduce r (by spreading boardings across more service-hours) and h (by adding more frequency) at the same rate, but make it take less time for bunching to occur. Just running less service means passengers take longer to get on each bus, but also means that the passenger load per stop is less sensitive to fixed delays occurring upstream.
Of course, running less service is cruel to passengers and can discourage ridership due to a negative frequency-ridership spiral or (on the busiest routes) inadequate capacity. But running bigger buses to compensate can provide the necessary capacity while also helping reduce b through faster access and egress. As noted in section 4.1, accordion buses should have four doors, to minimize loading time.
4.3. Reduce random variability
None of this discussion would matter if we were guaranteed that buses would run exactly on schedule. Of course, they don’t and we cannot get such guarantee. However, we can look for treatments that would make initial delays less common. All-door boarding is one such treatment, in addition to its effect on average boarding time per passenger, because one of the factors that can cause delays is an unexpected wave of passengers all getting on and having to queue one at a time, for example if they come off class or transfer from a full train. Schools with synchronized class times can overload transit networks for the first few minutes after classes end. And in Shanghai, I had to wait 20 minute to buy a metro ticket coming off a full intercity train since two of the three ticket machines were broken and the train was full of visitors who didn’t already have the Shanghai Public Transportation Card.
But as Eric’s interviews with drivers suggest, the biggest single source of variability is traffic and not unusual passenger loads. Bus lanes reduce the impact of traffic, but may not reduce variability, since cars may block them unexpectedly. This suggests that better enforcement of bus lanes could improve schedule regularity and reduce bunching further downstream.
Another source of variability is traffic lights. Traffic lights are discrete: they’re red or green, and a bus that misses the light will be delayed by a full phase, which in New York means about 45 seconds (and in Bangkok means 3 or even 5 minutes). Giving buses signal priority even in its weakest form entails lengthening the green phase in the direction the bus travels in for a few seconds to let a bus through and avoid making it wait a full red phase. This would keep a lid on the maximum variability that a single intersection can produce. Note also that it’s very easy for a bus to be delayed at two successive intersections, for example if traffic is such that it’s a hair slower than usual, forcing it to miss two lights in rapid succession. In this case, 1.5-minute initial delays are routine, setting up bunching later.
4.4. Dispatch buses to maintain even headways at terminals
The most brutal way to eliminate bunching is to have dispatchers tell bus drivers to sit still for a few minutes if the bus either behind or ahead of them is too far behind. The subway in New York would do that to the trains to maintain something that to a manager at control center looked like even headways (“wait assessment”), which multiple independent sources have told me is responsible for falling subway speeds and increased delays. This brutal approach is unlikely to provide better service to riders.
However, telling bus drivers to sit still to maintain even headways has no such downside when it is done at the terminus of the bus route. At most, agencies would have to pay bus drivers some overtime, which is probably swamped by the positive effect reducing bunching has on ridership (or for that matter the fact that reducing bunching permits the transit agency to provide the same effective frequency with fewer service-hours).
4.5. More empirical research is needed
This section is a lot less quantitative than sections 1, 2, and 3, owing to the fact that we are stepping away from strict modeling. While quantifying the effect of low floors, more doors, bigger buses, and prepayment is easy within the confines of the model, quantifying the initial shock to ridership discussed in subsection 4.3 is more difficult. There is a range of plausible shocks, and the serious questions to ask are along the lines of “what is the 90% confidence interval of the travel time on each segment?”.
The literature review I’ve done for signal priority in particular is not comprehensive, but suggestive that there is no research yet in that direction. Figuring out exactly how common initial delays are and which treatments can reduce them by how much must be the next step.
Bus Stop Spacing and Network Legibility
I had an interesting interview of the annoying kind, that is, one where my source says something that ends up challenging me to the point of requiring me to rethink how I conceive of transportation networks. On the surface, the interview reaffirmed my priors: my source, a mobility-limited New Yorker, prefers public transit to cars and is fine with walking 500 meters to a bus stop. But one thing my source said made me have to think a lot more carefully about transit network legibility. At hand was the question of where buses should stop. Ages ago, Jarrett suggested that all other things equal (which they never are), the best stop spacing pattern is as follows:

The bus stops on the north-side arterials are offset in order to slightly improve coverage. The reason Jarrett cites this doesn’t occur much in practice is that there would also be east-west arterials. But maybe there aren’t a lot of east-west arterials, or maybe the route spacing is such that there are big gaps between major intersections in which there’s choice about which streets to serve. What to do then? My source complained specifically about unintuitive decisions about which streets get a bus stop, forcing longer walks.
In the case of the most important streets, it’s easy enough to declare that they should get stops. In Brooklyn, this means subway stations (whenever possible), intersecting bus routes, and important throughfares like Eastern Parkway or Flatbush. Right now the B44 Select Bus Service on Nostrand misses Eastern Parkway (and thus the connection to the 3 train) and the M15 SBS on First and Second Avenues misses 72nd Street (and thus the southernmost connection to Second Avenue Subway). However, there is a bigger question at hand, regarding network legibility.
Bus networks are large. Brooklyn’s current bus network is 550 km, and even my and Eric Goldwyn’s plan only shrinks it to about 340, still hefty enough that nobody can be expected to memorize it. Passengers will need to know where they can get on a stop. For the sake of network legibility, it’s useful to serve consistent locations whenever possible.
This is equally true of sufficiently large subway networks. Manhattan subway riders know that the north-south subway lines all have stops in the vicinity of 50th Street, even though the street itself isn’t especially important, unlike 42nd or 34th. In retrospect, it would have been better to have every line actually stop at 50th, and not at 49th or 51st, but the similarity is still better than if some line (say) stopped at 47th and 54th on its way between 42nd and 59th. A bad Manhattan example would be the stop spacing on the 6 on the Upper East Side, serving 68th and 77th Streets but not the better-known (and more important) 72nd and 79th.
There are similar examples of parallel subway lines, some stopping on consistent streets, and some not. There are some smaller North American examples, i.e. Toronto and Chicago, but by far the largest subway network in the world in a gridded city is that of Beijing. There, subway stops near city center are forced by transfer locations (Beijing currently has only one missed connection, though several more are planned), but in between transfers, they tend to stop on consistent streets when those streets are continuous on the grid.
But outside huge cities (or cities with especially strong grids like Chicago, Philadelphia, and Toronto), consistent streets are mostly a desirable feature for buses, not subways. Bus networks are larger and less radial, so legibility is more important there than on subways. Buses also have shorter stop spacing than subways, so people can’t just memorize the locations of some neighborhood centers with subway stops (“Nation,” “Porte de Vincennes,” etc.).
In the other direction, in cities without strong grids, streets are usually not very long, and the few streets that are long (e.g. Massachusetts Avenue in Boston) tend to be so important that every transit route intersecting them should have a stop. However, streets that are of moderate length, enough to intersect several bus lines, are common even in interrupted grids like Brooklyn’s or ungridded cities like Paris (but in London they’re rarer). Here is the Paris bus map: look at the one-way pair in the center on Rue Reaumur and Boulevard Saint-Denis (and look at how the northbound bus on Boulevard de Strasbourg doesn’t stop at Saint-Denis, missing a Metro transfer). There are a number of streets that could form consistent stops, helping make the Parisian bus network more legible than it currently is.
As with all other aspects of legibility, the main benefits accrue to occasional users and to regular riders who unfamiliar with one particular line or region. For these riders, knowing how to look for a bus stop (or subway station, in a handful of large cities) is paramount; it enables more spontaneous trips, without requiring constantly consulting maps. These occasional spontaneous trips, in turn, are likelier to happen outside the usual hours, making them especially profitable for the transit agency, since they reduce rather than raise the peak-to-base ratio. (Bus operating costs mostly scale with service-hours, but very peaky buses tend to require a lot of deadheading because they almost never begin or end their trip at a bus depot.)
The main takeaway from this is that bus network redesigns should aim to stop buses on parallel routes at consistent streets whenever possible, subject to other constraints including regular stop spacing, serving commercial nodes, and providing connections to the rail network. To the extent cities build multiple parallel subway lines, it’s useful to ensure they serve stations on consistent streets as well when there’s a coherent grid; this may prove useful if New York ever builds a subway under Utica and extends the Nostrand Avenue Line, both of which extensions were on the drawing board as recently as the 1970s.
Radial Metro Networks for Portions of Cities
I’ve harped about the necessity of radial metro networks, looking much like the following schematic:
However, in practice such pure radial networks are rare. Some networks have parallel lines (such as Paris and Beijing), nearly all have lines intersecting without a transfer at least once (the largest that doesn’t is Mexico City), some have chordal lines and not just radial or circular lines, and nearly all have lines that meet twice. Often these variations from pure radii are the result of poor planning or a street network that makes a pure radial system infeasible, but there are specific situations in which it’s reasonable for lines to meet multiple times (or sometimes even be parallel). These come from the need to built an optimal network not just for the whole city but also notable portions of it.
The unsegmented city
The diagram depicted above is a city with a single center and no obvious sub-areas with large internal travel demand. If the city is on a river, it’s not obvious from the subway map where the river passes, and it’s unlikely its non-CBD bank has a strong identity like that of the Left Bank of Paris, South London, or Brooklyn and Queens.
Among the largest metro networks in the world, the one most akin to the diagram above is Moscow. It has seven radial lines through city center (numbered 1-10, omitting the one-sided 4, the circular 5, and the yet-incomplete 8). They have some missed connections between them (3/6, 3/7, 6/9), and one pair of near-parallel lines (2/10, meeting only at Line 10’s southern terminus), but no parallel lines, and no case in which two lines cross twice. And Moscow’s development is indeed oriented toward connecting outlying areas with city center. Connections between areas outside the center are supposed to use the circular lines (5 and 14, with 11 under construction).
In a relatively monocentric city, this is fine. Even if this city is on the river, which Moscow is, it doesn’t matter too much if two neighborhoods are on the same side of the river when planning the network. Even in polycentric cities, this is fine if the sub-centers get connections via circular lines or the odd chordal line (as will eventually happen when Los Angeles builds a real subway network with such chords as Vermont and Sepulveda).
The segmented city
London and Paris are both segmented by their rivers, and their wrong sides (South London, Left Bank) both have strong regional identities, as does to some extent East London. New York, partitioned into boroughs by much wider waterways than the Thames and Seine, has even stronger sub-identities, especially in Brooklyn. I do not know of a single New Yorker whose commute to work or school involves crossing a bridge over a river on foot, nor of any case of anyone crossing a bridge in New York on foot (or bike) except for recreational purposes; in Paris I do so habitually when visiting the Latin Quarter, and at a conference in 2010 another attendee biked from Porte de Vincennes to Jussieu every day.
With a difficult water boundary, the wrong-side part of the city became a center in its own right. Downtown Brooklyn and the Latin Quarter should both be viewed as sub-centers that failed to become CBDs. The Latin Quarter, the oldest part of Paris outside the Ile de la Cite, declined in favor of the more commercial Right Bank as the city grew in the High and Late Middle Ages; Downtown Brooklyn declined in favor of more concentration in Manhattan and more dispersion to other centers (often in Queens) over the course of the 20th century.
Early 20th century New York and Paris were not polycentric cities. There was no everywhere-to-everywhere demand. There was demand specifically for travel within Brooklyn and within the Left Bank. To this day, the connections to the Latin Quarter from Right Bank neighborhoods not on Line 4 are not great, and from Nation specifically the alternatives are a three-seat ride and a long interchange at Chatelet. Ultimately, this situation occurs when you have a region with a strong identity and strong demand for internal travel larger than a neighborhood (which can be served by a few subway stops on a single line) but smaller than an entire city.
In this case, a radial subway network (which neither the New York City Subway nor the Paris Metro is) could justifiably have multiple crossings between two lines, ensuring that lines provide a coherent network for internal travel. South London is a partial example of this principle: not counting the Wimbledon branch of the District line, the South London Underground network is internally connected, and the best route between any two South London stations stays within South London. In particular, the Victoria and Northern lines cross twice, once at Stockwell and once at Euston, in a city that has a generally radial metro system.
Don’t go overboard
The need to serve internal travel within portions of a city is real, and it’s worthwhile to plan metro networks accordingly. But at the same time, it’s easy to go overboard and plan lines that serve only travel within such portions. Most of the examples I give of weak chordal lines – the G train in New York, Line 10 and the RER C in Paris, Line 6 in Shanghai – serve internal demand to the wrong side of a city divided by a river; only Shanghai’s Line 3 is an exception to this pattern, as a weak chordal line that doesn’t come from city segmentation.
In the cases of the G and M10, the problem is partly that the lines have compromises weakening them as radials. The G has too many missed connections to radial lines, including the J/Z and the entire Atlantic-Pacific complex; M10 terminates at Austerlitz instead of extending east to the library, which is the second busiest Left Bank Metro stop (after Montparnasse) and which has a particularly strong connection to the universities in the Latin Quarter.
But Line 6 is constrained because it doesn’t serve Lujiazui, just Century Avenue, and the RER C does serve the library but has exceptionally poor connections to the CBD and other Right Bank destinations. It’s important to ensure the network is coherent enough to serve internal demand to a large segment of the city but also to serve travel demand to the rest of the city well.
Good transfers
Serving the entire city hinges on good transfers. The most important destination remains city center, so lines that aren’t circumferential should still aim to serve the center in nearly all cases. Internal demand should be served with strategic transfers, which may involve two lines crossing multiple times, once in or near city center and once on the wrong side of the river.
The main drawback of multiple crossings is that they are less efficient than a pure radial network with a single city center crossing between each pair of lines, provided the only distinguished part of the city is the center. Once internal travel to a geographic or demographic segment is taken into account, there are good reasons to slightly reduce the efficiency of the CBD-bound network if it drastically raises the efficiency of the secondary center-bound network. While demographic trends may come and go (will Flushing still be an unassimilated Chinese neighborhood in 50 years?), geographic constraints do not, and place identities like “Left Bank” and “Brooklyn” remain stable.
Note the qualifiers: since the CBD remains more important than any secondary center, it’s only acceptable to reduce CBD-bound efficiency if the gain in secondary center-bound efficiency is disproportionate. This is why I propose making sure there are good transfers within the particular portion of the city, even at the cost of making the radial network less perfect: this would still avoid missed connections, a far worse problem than having too many transfer points.
So what?
In New York, London, and Paris, the best that can be done is small tweaks. However, there exist smaller or less developed cities that can reshape their transit networks, and since cities tend to form on rivers and bays, segmentation is common. Boston has at least two distinguished wrong-side segments: East Boston (including Chelsea and Revere) and Greater Cambridge. East Boston can naturally funnel transit through Maverick, but in Greater Cambridge there will soon be two separate subway spines, the Red and Green Lines, and it would be worthwhile to drag a rail connection between them. This is why I support investing in rail on the Grand Junction, turning it into a low-radius circular regional rail line together with the North-South Rail Link: it would efficiently connect the Green Line Extension with Kendall.
More examples of segmented cities include the Bay Area (where the wrong-side segment is the East Bay), Istanbul (where Europe and Asia have separate metro networks, connected only by Marmaray), Stockholm (where Södermalm and Söderort are separated by a wide channel from the rest of the city, and Kungsholmen is also somewhat distinguished), and Washington (where the wrong side is Virginia). In all of these there are various compromises on metro network planning coming from the city segmentation. Stockholm’s solution – making both the Red and Green Lines serve Slussen – is by far the best, and the Bay Area could almost do the same if BART were connected slightly differently around Downtown Oakland. But in all cases, there are compromises.
Guidelines for Driverless Buses
As I’ve said a few months ago in The American Prospect, driverless bus technology does not yet appear ready for mass deployment. However, research into this technology continues. Of particular note is Google’s work at Waymo, which a source within the Bay Area’s artificial intelligence community tells me is more advanced and more serious than the flops at Uber and Tesla; Waymo’s current technology is pretty good on a well-understood closed route, but requires laborious mapping work to extend to new routes, making it especially interesting for fixed-route buses rather than cars. But ultimately, automated vehicles will almost certainly eventually be mature and safe, so it is useful to plan around them. For this, I propose the following dos and don’ts for cities and transit agencies.
Install dedicated, physically-separated bus lanes
A bus with 40 people should get 40 times the priority of a car with one person, so this guideline should be adopted today already. However, it’s especially important with AVs, because it reduces the friction between AV buses and regular cars, which is where the accident in Las Vegas reference in my TAP article happened. The CityMobil2 paradigm involves AVs in increasingly shared traffic, starting from fully enclosed circuits (like the first line in Helsinki, at the zoo) and building up gradually toward full lane sharing. Dedicated lanes are a lower level of sharing than mixed traffic, and physical separation reduces the ability of cars to cut ahead of the bus.
If there is a mixture of AV and manual buses, both should be allowed in the dedicated lanes. This is because bus drivers can be trained to know how to deal with AVs. Part of the problem with AVs in mixed traffic is that human drivers are used to getting certain cues from other human drivers, and then when facing robot drivers they don’t have these cues and misread the car’s intentions. But professional drivers can be trained better. Professional bus drivers are also familiar with their own bus system and will therefore know when the AV is going to turn, make stops, and so on.
Use Kassel curbs to provide wheelchair accessibility
Buses are at a disadvantage compared with trams in wheelchair accessibility. Buses sway too much to have the precise alignment that permits narrow enough gaps for barrier-free access on trains. However, as a solution, some German cities have reconstructed the edges of the bus lane next to the bus stop platform, in order to ease the wheels into a position supporting step-free access on low-floor buses. Potentially, AVs could make this easier by driving more precisely or by having platform extenders similar to those of some regional trains (such as those of Zurich) bridging the remainder of the horizontal gap.
Driverless trains in Vancouver and even on Paris Metro Line 14 have roll-on wheelchair access: passengers in wheelchairs can board the train unassisted. In contrast, older manually-driven trains tend to tolerate large horizontal and vertical gaps blocking passengers in wheelchairs, to the point that New York has to have some special boarding zones for wheelchairs even at accessible stations. If the combination of precision driving and Kassel curbs succeeds in creating the same accessibility on a bus as on SkyTrain in Vancouver, then the bus driver’s biggest role outside of actually driving the bus is no longer necessary, facilitating full automation.
Don’t outsource planning to tech firms
Transit networks work best when they work in tandem. This means full fare and schedule integration within and across different modes, and coordinated planning. Expertise in maintaining such networks lies within the transit agencies themselves as well as with various independent consultancies that specialize in transportation.
In contrast, tech firms have little expertise in this direction. They prefer competition to cooperation, so that there would be separate fleets within each city by company – and moreover, each company would have an incentive to arrange schedules so that buses would arrive just ahead of the other companies to poach passengers, so there wouldn’t be even headways. The culture of tech involves brazen indifference to domain expertise and a preference for reinventing the wheel, hence Uber and Chariot’s slow realization that no, really, fixed-route buses are the most efficient way of carrying passengers on the street in dense cities. Thus, outsourcing planning is likely to lead to both ruinous competition and retarded adoption of best practices. To prevent this, cities should ban private operations competing with their public bus networks and instead run their own AVs.
Most of the world’s richest cities have deep pools of tech workers, especially the single richest, San Francisco. It would be best for Muni, RATP, NYCT, and other rich-city agencies to hire tech talent using the same methods of the private sector, and train them in transit network planning so that they can assist in providing software services to the transit system in-house.
Resist the siren song of attendants
Las Vegas’s trial run involved an attendant on each bus performing customer service and helping passengers in wheelchairs. A bus that has an attendant is no more a driverless bus than a subway with computer-controlled driving and an operator opening and closing doors is a driverless train. The attendant’s work is similar to that of a bus driver. If the hope of some private operators is that relabeling the driver as an attendant will allow them to de-skill the work and hire low-pay, non-union employees, then it’s based on a misunderstanding of labor relations: transit employees are a prime target for unionization no matter whether they are called drivers.
Ultimately, the difficulty of driving a bus is not much greater than that of dealing with annoying customers, being on guard in case passengers act aggressively or antisocially, and operating wheelchair lifts. Bus drivers get back pain at high rates since they’re at the wheel of a large vehicle designed for passenger comfort for many hours a day, but this may still be a problem on AVs, and all other concerns of bus drivers (such as the risk of assault by customers) remain true for attendants. Either get everything right to the point of not needing any employee on the bus, or keep manual driving with just some computer assistance.
Resist the siren song of small vehicles
All AV bus experiments I know of (which I know for a fact is not all AV buses that are trialing) involve van-size vehicles. The idea is that, since about 75% of the cost of running a bus today is the driver’s wage, there’s no real point in running smaller vehicles at greater frequency if there’s a driver, but once the driver is removed, it’s easy enough to run small vehicles to match passenger demand and reduce fuel consumption.
However, vans have two problems. First, they only work on thin routes. Thick routes have demand for articulated buses running at high frequency, and then vans both add congestion to the bus lane and increase fuel consumption (when the vehicles are full, bigger is always more fuel-efficient). And second, they lead to safety problems, as passengers may be afraid of riding a bus alone with 3-4 other passengers but not with 20 or more (Martha Lauren rides full London buses fearlessly but would make sure to sit near the driver on nearly-empty Baltimore buses).
Medium-size buses, in the range of 20-30 seats, could be more useful on thin routes. However, passenger safety problems are likely to remain if only a handful of people ride each vehicle.
Get your maintenance costs under control
If you remove the driver, the dominant factor in bus operating costs becomes maintenance. Assuming maintenance workers make the same average annual wage and get the same benefits as transit workers in general, the wages of maintenance workers are about 15% of the total operating costs of buses in Chicago and 20% in New York.
The importance of fuel economy grows as well, but fuel today is a much smaller proportion of costs. Around 3% in Chicago and 2% in New York. European fuel costs are much higher than Americans, but so are European bus fuel economy rates: in tests, Boris buses got 4.1 km per liter of diesel, which is maybe twice as good as the US average and three times as good as the New York average.
This suggests that with the driver gone, maybe 75% of the remaining variable operating cost is maintenance. Chicago does better than New York here, since it replaces 1/12 of its fleet every year, so every year 1/12 of the fleet undergoes mid-life refurbishment and work is consistent from year to year, whereas in New York the replacement schedule is haphazard and there is more variation in work needs and thus more idle time. The most important future need for AV procurement is not electric traction or small size, but low lifecycle costs.
Update: by the same token, it’s important to keep a lid on vehicle procurement costs. New York spends $500,000 on a standard-length bus and $750,000 on an articulated bus; the Boris buses, which are bilevel and similar in capacity to an artic, cost about $500,000, which is locally considered high, and conventional artic or bilevel buses in London cost $300,000-350,000. American cities replace buses every 12 years, compared with every 15 years in Canada, and the depreciation in New York is around 6% of total bus operating costs. Cutting bus procurement costs to London levels would only save New York a small percent of its cost, but in an AV future the saving would represent around 12% of variable costs.
Plan for higher frequency
AVs represent an opportunity to reduce marginal operating costs. This means transit agencies should plan accordingly:
- Lower marginal costs encourage running buses more intensively, running almost as much service off-peak and on weekends as at rush hour.
- Very high frequency encourages passengers to transfer more, so the value of one-seat rides decreases.
- Higher frequency always increases capacity, but its value to passengers in terms of reduced wait times is higher when the starting frequency is low, which means agencies should plan on running more service on less frequent routes and only add service on routes that already run every 5 minutes or less if the buses are overcrowded.
The Role of Local Expertise in Construction Costs
When I first looked at construction costs, I looked exclusively at developed countries. Eventually I realized that the difference in average costs between rich and poor countries is small. But then I noticed a different pattern in the third world: some places, like India, Bangladesh, Nigeria, and Indonesia, spend much more than China does. Why is that? While I’ve had a bunch of different explanations over the years, I believe today that the difference concerns local expertise versus reliance on first-world consultants.
The facts, as far as I can tell, are as follows:
- Construction costs in China are about $250 million per km, a little more than the average for Continental Europe.
- Construction costs in post-communist Europe are all over, but are the same range as in Western Europe. Bulgaria is pretty cheap; in this post I bring up a line that costs around $200 million/km in today’s money but other extensions built this decade are cheaper, including one outer one at $50 million/km. In contrast, Warsaw’s Line 2 is quite expensive.
- Latin American construction costs have the same range as Europe, but it seems more compressed – I can’t find either $50 million/km lines or $500 million/km ones.
- Africa and the parts of Asia that used to be colonies have high construction costs: India and Egypt are expensive, and here I give two expensive examples from Bangladesh and Indonesia. The Lagos Metro is spending subway money on an el in the middle of a wide road and is reminiscent of American costs.
- When the first world had comparable income levels to those of the third world today, in the early 20th century, its construction costs were far lower, around $30-50 million per underground km. First-world cost growth in the last 100 years has mostly tracked income growth – it’s been somewhat faster in New York and somewhat slower in Paris, but on average it’s been similar.
For a while, I had to contend with the possibility that Chinese autocracy is just better at infrastructure than Indian (or Bangladeshi, or Indonesian, or Nigerian) democracy. The nepotism and corruption in India are globally infamous, and it’s still well-governed compared with Indonesia and Nigeria, which have personality-based politics. But then, in the developed world, authoritarian states aren’t more efficient at construction (Singapore’s construction costs are high); moreover, post-communist democracies like Bulgaria and Romania manage low construction costs.
What I instead think the issue is is where the state’s infrastructure planning comes from. China learned from the USSR and subsequently added a lot of domestic content (such as the use of cut-and-cover in some situations) fitting its particular needs; as a result, its construction costs are reasonable. The post-communist world learned from the USSR in general. There’s a wide range, with Romania near one end and Poland near the other, but the range is comparable to that of Western Europe today. Overall it seems that Eastern Europe can competently execute methods geared to the middle-income world (as the second world was in the Cold War) as well as, thanks to assistance from the EU, the high-income world.
Latin America, too, uses domestically-developed methods. The entire region is infamous in the economic development literature for having begun an inward economic turn in the Great Depression, cutting itself off from global markets and generally stagnating. Government functions are likewise done domestically or maybe outsourced to domestic contractors (and if international ones are involved, it’s in construction, not planning). Evidently, Latin America developed bus rapid transit, a mode of transportation optimally designed for countries with low incomes (so paying armies of bus drivers is cheaper than building rail tracks) and relatively strong currencies (so importing buses from richer countries isn’t ruinously expensive).
The situation in the ex-colonies is completely different. Even relatively protectionist ones outsource much of their planning to the developed world or increasingly to China, out of a combination of cultural cringe and shortage of domestic capital. The metro lines I have data for in India, Bangladesh, and Indonesia all involve Japanese technology and planning, with no attempt to adapt the technology to local conditions. So insistent is Japan on following its domestic recipe exactly that India’s high-speed rail construction is using standard gauge rather than broad gauge and Shinaknsen-size trains rather than larger Indian trains (which are 3.7 meters wide and can fit people 6-abreast). Elsewhere, China contributes capital and planning as part of the Belt and Road Initiative, and then its methods are geared toward middle income and not low income.
The correct way for countries in the per capita income range of Nigeria, India, and Bangladesh to build subways is to open up their main roads, which are often very wide, and put in four tracks in a cut-and-cover scheme similar to that of early-20th century New York. If they can elevate the tracks instead, they should use the same methods used to build Lines 2 and 6 in Paris in the early 20th century, which use concrete columns and are quiet enough that, unlike in New York, people can carry a conversation under the viaduct while a train passes. If the line needs to deviate from roads, then the city should buy property and carve up a new street (as New York did with Seventh Avenue South and Sixth Avenue in the Village) or else learn to implement late Victorian and Edwardian London’s techniques of deep boring.
However, actually implementing Belle Epoque construction methods requires particular knowledge that international consultants don’t have. Most of these consultants’ income comes from the first world, where wages are so high that the optimal construction methods involve extensive automation, using machinery rather than battalions of navvies with shovels. The technical support required for a tunnel boring machine is relatively easy in a rich country with a deep pool of qualified engineers and mechanics and a nightmare in a poor one where all such expertise has to be imported or trained from scratch. Thus, the consultants are likely to recommend the first-world methods they are familiar with, and if they do try to adapt to low wages, they may make mistakes since they have to reinvent ideas or read historical sources (which they are typically not trained to do – they’re consultants, not historians).
The result is that even though open economies tend to grow faster overall, economies with a history of closure tend to do better on this specific topic, where international consultants are not very useful for the needs of the developing world. India in particular needs to get better at indigenizing its construction and avoid mindlessly copying the first world out of cultural cringe, because even though it is almost a middle-income country by now, its wages remain a fraction of those of North America, Western Europe, and Japan, and its future growth trajectory is very different, requiring extensive adaptations. Both the overall extent of planning and the specific construction methods must be tailored to local conditions, and so far India seems bad at both (hence the undersized, expensive high-speed trains).
