Category: Urban Transit
Bus Stop Spacing and Network Legibility
I had an interesting interview of the annoying kind, that is, one where my source says something that ends up challenging me to the point of requiring me to rethink how I conceive of transportation networks. On the surface, the interview reaffirmed my priors: my source, a mobility-limited New Yorker, prefers public transit to cars and is fine with walking 500 meters to a bus stop. But one thing my source said made me have to think a lot more carefully about transit network legibility. At hand was the question of where buses should stop. Ages ago, Jarrett suggested that all other things equal (which they never are), the best stop spacing pattern is as follows:

The bus stops on the north-side arterials are offset in order to slightly improve coverage. The reason Jarrett cites this doesn’t occur much in practice is that there would also be east-west arterials. But maybe there aren’t a lot of east-west arterials, or maybe the route spacing is such that there are big gaps between major intersections in which there’s choice about which streets to serve. What to do then? My source complained specifically about unintuitive decisions about which streets get a bus stop, forcing longer walks.
In the case of the most important streets, it’s easy enough to declare that they should get stops. In Brooklyn, this means subway stations (whenever possible), intersecting bus routes, and important throughfares like Eastern Parkway or Flatbush. Right now the B44 Select Bus Service on Nostrand misses Eastern Parkway (and thus the connection to the 3 train) and the M15 SBS on First and Second Avenues misses 72nd Street (and thus the southernmost connection to Second Avenue Subway). However, there is a bigger question at hand, regarding network legibility.
Bus networks are large. Brooklyn’s current bus network is 550 km, and even my and Eric Goldwyn’s plan only shrinks it to about 340, still hefty enough that nobody can be expected to memorize it. Passengers will need to know where they can get on a stop. For the sake of network legibility, it’s useful to serve consistent locations whenever possible.
This is equally true of sufficiently large subway networks. Manhattan subway riders know that the north-south subway lines all have stops in the vicinity of 50th Street, even though the street itself isn’t especially important, unlike 42nd or 34th. In retrospect, it would have been better to have every line actually stop at 50th, and not at 49th or 51st, but the similarity is still better than if some line (say) stopped at 47th and 54th on its way between 42nd and 59th. A bad Manhattan example would be the stop spacing on the 6 on the Upper East Side, serving 68th and 77th Streets but not the better-known (and more important) 72nd and 79th.
There are similar examples of parallel subway lines, some stopping on consistent streets, and some not. There are some smaller North American examples, i.e. Toronto and Chicago, but by far the largest subway network in the world in a gridded city is that of Beijing. There, subway stops near city center are forced by transfer locations (Beijing currently has only one missed connection, though several more are planned), but in between transfers, they tend to stop on consistent streets when those streets are continuous on the grid.
But outside huge cities (or cities with especially strong grids like Chicago, Philadelphia, and Toronto), consistent streets are mostly a desirable feature for buses, not subways. Bus networks are larger and less radial, so legibility is more important there than on subways. Buses also have shorter stop spacing than subways, so people can’t just memorize the locations of some neighborhood centers with subway stops (“Nation,” “Porte de Vincennes,” etc.).
In the other direction, in cities without strong grids, streets are usually not very long, and the few streets that are long (e.g. Massachusetts Avenue in Boston) tend to be so important that every transit route intersecting them should have a stop. However, streets that are of moderate length, enough to intersect several bus lines, are common even in interrupted grids like Brooklyn’s or ungridded cities like Paris (but in London they’re rarer). Here is the Paris bus map: look at the one-way pair in the center on Rue Reaumur and Boulevard Saint-Denis (and look at how the northbound bus on Boulevard de Strasbourg doesn’t stop at Saint-Denis, missing a Metro transfer). There are a number of streets that could form consistent stops, helping make the Parisian bus network more legible than it currently is.
As with all other aspects of legibility, the main benefits accrue to occasional users and to regular riders who unfamiliar with one particular line or region. For these riders, knowing how to look for a bus stop (or subway station, in a handful of large cities) is paramount; it enables more spontaneous trips, without requiring constantly consulting maps. These occasional spontaneous trips, in turn, are likelier to happen outside the usual hours, making them especially profitable for the transit agency, since they reduce rather than raise the peak-to-base ratio. (Bus operating costs mostly scale with service-hours, but very peaky buses tend to require a lot of deadheading because they almost never begin or end their trip at a bus depot.)
The main takeaway from this is that bus network redesigns should aim to stop buses on parallel routes at consistent streets whenever possible, subject to other constraints including regular stop spacing, serving commercial nodes, and providing connections to the rail network. To the extent cities build multiple parallel subway lines, it’s useful to ensure they serve stations on consistent streets as well when there’s a coherent grid; this may prove useful if New York ever builds a subway under Utica and extends the Nostrand Avenue Line, both of which extensions were on the drawing board as recently as the 1970s.
Radial Metro Networks for Portions of Cities
I’ve harped about the necessity of radial metro networks, looking much like the following schematic:
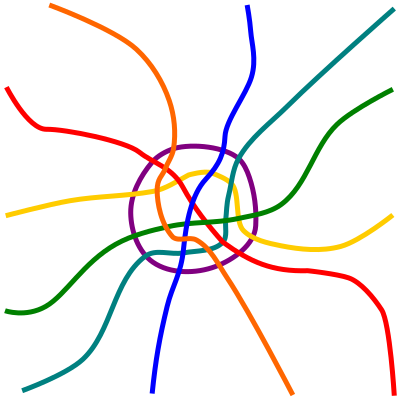
However, in practice such pure radial networks are rare. Some networks have parallel lines (such as Paris and Beijing), nearly all have lines intersecting without a transfer at least once (the largest that doesn’t is Mexico City), some have chordal lines and not just radial or circular lines, and nearly all have lines that meet twice. Often these variations from pure radii are the result of poor planning or a street network that makes a pure radial system infeasible, but there are specific situations in which it’s reasonable for lines to meet multiple times (or sometimes even be parallel). These come from the need to built an optimal network not just for the whole city but also notable portions of it.
The unsegmented city
The diagram depicted above is a city with a single center and no obvious sub-areas with large internal travel demand. If the city is on a river, it’s not obvious from the subway map where the river passes, and it’s unlikely its non-CBD bank has a strong identity like that of the Left Bank of Paris, South London, or Brooklyn and Queens.
Among the largest metro networks in the world, the one most akin to the diagram above is Moscow. It has seven radial lines through city center (numbered 1-10, omitting the one-sided 4, the circular 5, and the yet-incomplete 8). They have some missed connections between them (3/6, 3/7, 6/9), and one pair of near-parallel lines (2/10, meeting only at Line 10’s southern terminus), but no parallel lines, and no case in which two lines cross twice. And Moscow’s development is indeed oriented toward connecting outlying areas with city center. Connections between areas outside the center are supposed to use the circular lines (5 and 14, with 11 under construction).
In a relatively monocentric city, this is fine. Even if this city is on the river, which Moscow is, it doesn’t matter too much if two neighborhoods are on the same side of the river when planning the network. Even in polycentric cities, this is fine if the sub-centers get connections via circular lines or the odd chordal line (as will eventually happen when Los Angeles builds a real subway network with such chords as Vermont and Sepulveda).
The segmented city
London and Paris are both segmented by their rivers, and their wrong sides (South London, Left Bank) both have strong regional identities, as does to some extent East London. New York, partitioned into boroughs by much wider waterways than the Thames and Seine, has even stronger sub-identities, especially in Brooklyn. I do not know of a single New Yorker whose commute to work or school involves crossing a bridge over a river on foot, nor of any case of anyone crossing a bridge in New York on foot (or bike) except for recreational purposes; in Paris I do so habitually when visiting the Latin Quarter, and at a conference in 2010 another attendee biked from Porte de Vincennes to Jussieu every day.
With a difficult water boundary, the wrong-side part of the city became a center in its own right. Downtown Brooklyn and the Latin Quarter should both be viewed as sub-centers that failed to become CBDs. The Latin Quarter, the oldest part of Paris outside the Ile de la Cite, declined in favor of the more commercial Right Bank as the city grew in the High and Late Middle Ages; Downtown Brooklyn declined in favor of more concentration in Manhattan and more dispersion to other centers (often in Queens) over the course of the 20th century.
Early 20th century New York and Paris were not polycentric cities. There was no everywhere-to-everywhere demand. There was demand specifically for travel within Brooklyn and within the Left Bank. To this day, the connections to the Latin Quarter from Right Bank neighborhoods not on Line 4 are not great, and from Nation specifically the alternatives are a three-seat ride and a long interchange at Chatelet. Ultimately, this situation occurs when you have a region with a strong identity and strong demand for internal travel larger than a neighborhood (which can be served by a few subway stops on a single line) but smaller than an entire city.
In this case, a radial subway network (which neither the New York City Subway nor the Paris Metro is) could justifiably have multiple crossings between two lines, ensuring that lines provide a coherent network for internal travel. South London is a partial example of this principle: not counting the Wimbledon branch of the District line, the South London Underground network is internally connected, and the best route between any two South London stations stays within South London. In particular, the Victoria and Northern lines cross twice, once at Stockwell and once at Euston, in a city that has a generally radial metro system.
Don’t go overboard
The need to serve internal travel within portions of a city is real, and it’s worthwhile to plan metro networks accordingly. But at the same time, it’s easy to go overboard and plan lines that serve only travel within such portions. Most of the examples I give of weak chordal lines – the G train in New York, Line 10 and the RER C in Paris, Line 6 in Shanghai – serve internal demand to the wrong side of a city divided by a river; only Shanghai’s Line 3 is an exception to this pattern, as a weak chordal line that doesn’t come from city segmentation.
In the cases of the G and M10, the problem is partly that the lines have compromises weakening them as radials. The G has too many missed connections to radial lines, including the J/Z and the entire Atlantic-Pacific complex; M10 terminates at Austerlitz instead of extending east to the library, which is the second busiest Left Bank Metro stop (after Montparnasse) and which has a particularly strong connection to the universities in the Latin Quarter.
But Line 6 is constrained because it doesn’t serve Lujiazui, just Century Avenue, and the RER C does serve the library but has exceptionally poor connections to the CBD and other Right Bank destinations. It’s important to ensure the network is coherent enough to serve internal demand to a large segment of the city but also to serve travel demand to the rest of the city well.
Good transfers
Serving the entire city hinges on good transfers. The most important destination remains city center, so lines that aren’t circumferential should still aim to serve the center in nearly all cases. Internal demand should be served with strategic transfers, which may involve two lines crossing multiple times, once in or near city center and once on the wrong side of the river.
The main drawback of multiple crossings is that they are less efficient than a pure radial network with a single city center crossing between each pair of lines, provided the only distinguished part of the city is the center. Once internal travel to a geographic or demographic segment is taken into account, there are good reasons to slightly reduce the efficiency of the CBD-bound network if it drastically raises the efficiency of the secondary center-bound network. While demographic trends may come and go (will Flushing still be an unassimilated Chinese neighborhood in 50 years?), geographic constraints do not, and place identities like “Left Bank” and “Brooklyn” remain stable.
Note the qualifiers: since the CBD remains more important than any secondary center, it’s only acceptable to reduce CBD-bound efficiency if the gain in secondary center-bound efficiency is disproportionate. This is why I propose making sure there are good transfers within the particular portion of the city, even at the cost of making the radial network less perfect: this would still avoid missed connections, a far worse problem than having too many transfer points.
So what?
In New York, London, and Paris, the best that can be done is small tweaks. However, there exist smaller or less developed cities that can reshape their transit networks, and since cities tend to form on rivers and bays, segmentation is common. Boston has at least two distinguished wrong-side segments: East Boston (including Chelsea and Revere) and Greater Cambridge. East Boston can naturally funnel transit through Maverick, but in Greater Cambridge there will soon be two separate subway spines, the Red and Green Lines, and it would be worthwhile to drag a rail connection between them. This is why I support investing in rail on the Grand Junction, turning it into a low-radius circular regional rail line together with the North-South Rail Link: it would efficiently connect the Green Line Extension with Kendall.
More examples of segmented cities include the Bay Area (where the wrong-side segment is the East Bay), Istanbul (where Europe and Asia have separate metro networks, connected only by Marmaray), Stockholm (where Södermalm and Söderort are separated by a wide channel from the rest of the city, and Kungsholmen is also somewhat distinguished), and Washington (where the wrong side is Virginia). In all of these there are various compromises on metro network planning coming from the city segmentation. Stockholm’s solution – making both the Red and Green Lines serve Slussen – is by far the best, and the Bay Area could almost do the same if BART were connected slightly differently around Downtown Oakland. But in all cases, there are compromises.
Guidelines for Driverless Buses
As I’ve said a few months ago in The American Prospect, driverless bus technology does not yet appear ready for mass deployment. However, research into this technology continues. Of particular note is Google’s work at Waymo, which a source within the Bay Area’s artificial intelligence community tells me is more advanced and more serious than the flops at Uber and Tesla; Waymo’s current technology is pretty good on a well-understood closed route, but requires laborious mapping work to extend to new routes, making it especially interesting for fixed-route buses rather than cars. But ultimately, automated vehicles will almost certainly eventually be mature and safe, so it is useful to plan around them. For this, I propose the following dos and don’ts for cities and transit agencies.
Install dedicated, physically-separated bus lanes
A bus with 40 people should get 40 times the priority of a car with one person, so this guideline should be adopted today already. However, it’s especially important with AVs, because it reduces the friction between AV buses and regular cars, which is where the accident in Las Vegas reference in my TAP article happened. The CityMobil2 paradigm involves AVs in increasingly shared traffic, starting from fully enclosed circuits (like the first line in Helsinki, at the zoo) and building up gradually toward full lane sharing. Dedicated lanes are a lower level of sharing than mixed traffic, and physical separation reduces the ability of cars to cut ahead of the bus.
If there is a mixture of AV and manual buses, both should be allowed in the dedicated lanes. This is because bus drivers can be trained to know how to deal with AVs. Part of the problem with AVs in mixed traffic is that human drivers are used to getting certain cues from other human drivers, and then when facing robot drivers they don’t have these cues and misread the car’s intentions. But professional drivers can be trained better. Professional bus drivers are also familiar with their own bus system and will therefore know when the AV is going to turn, make stops, and so on.
Use Kassel curbs to provide wheelchair accessibility
Buses are at a disadvantage compared with trams in wheelchair accessibility. Buses sway too much to have the precise alignment that permits narrow enough gaps for barrier-free access on trains. However, as a solution, some German cities have reconstructed the edges of the bus lane next to the bus stop platform, in order to ease the wheels into a position supporting step-free access on low-floor buses. Potentially, AVs could make this easier by driving more precisely or by having platform extenders similar to those of some regional trains (such as those of Zurich) bridging the remainder of the horizontal gap.
Driverless trains in Vancouver and even on Paris Metro Line 14 have roll-on wheelchair access: passengers in wheelchairs can board the train unassisted. In contrast, older manually-driven trains tend to tolerate large horizontal and vertical gaps blocking passengers in wheelchairs, to the point that New York has to have some special boarding zones for wheelchairs even at accessible stations. If the combination of precision driving and Kassel curbs succeeds in creating the same accessibility on a bus as on SkyTrain in Vancouver, then the bus driver’s biggest role outside of actually driving the bus is no longer necessary, facilitating full automation.
Don’t outsource planning to tech firms
Transit networks work best when they work in tandem. This means full fare and schedule integration within and across different modes, and coordinated planning. Expertise in maintaining such networks lies within the transit agencies themselves as well as with various independent consultancies that specialize in transportation.
In contrast, tech firms have little expertise in this direction. They prefer competition to cooperation, so that there would be separate fleets within each city by company – and moreover, each company would have an incentive to arrange schedules so that buses would arrive just ahead of the other companies to poach passengers, so there wouldn’t be even headways. The culture of tech involves brazen indifference to domain expertise and a preference for reinventing the wheel, hence Uber and Chariot’s slow realization that no, really, fixed-route buses are the most efficient way of carrying passengers on the street in dense cities. Thus, outsourcing planning is likely to lead to both ruinous competition and retarded adoption of best practices. To prevent this, cities should ban private operations competing with their public bus networks and instead run their own AVs.
Most of the world’s richest cities have deep pools of tech workers, especially the single richest, San Francisco. It would be best for Muni, RATP, NYCT, and other rich-city agencies to hire tech talent using the same methods of the private sector, and train them in transit network planning so that they can assist in providing software services to the transit system in-house.
Resist the siren song of attendants
Las Vegas’s trial run involved an attendant on each bus performing customer service and helping passengers in wheelchairs. A bus that has an attendant is no more a driverless bus than a subway with computer-controlled driving and an operator opening and closing doors is a driverless train. The attendant’s work is similar to that of a bus driver. If the hope of some private operators is that relabeling the driver as an attendant will allow them to de-skill the work and hire low-pay, non-union employees, then it’s based on a misunderstanding of labor relations: transit employees are a prime target for unionization no matter whether they are called drivers.
Ultimately, the difficulty of driving a bus is not much greater than that of dealing with annoying customers, being on guard in case passengers act aggressively or antisocially, and operating wheelchair lifts. Bus drivers get back pain at high rates since they’re at the wheel of a large vehicle designed for passenger comfort for many hours a day, but this may still be a problem on AVs, and all other concerns of bus drivers (such as the risk of assault by customers) remain true for attendants. Either get everything right to the point of not needing any employee on the bus, or keep manual driving with just some computer assistance.
Resist the siren song of small vehicles
All AV bus experiments I know of (which I know for a fact is not all AV buses that are trialing) involve van-size vehicles. The idea is that, since about 75% of the cost of running a bus today is the driver’s wage, there’s no real point in running smaller vehicles at greater frequency if there’s a driver, but once the driver is removed, it’s easy enough to run small vehicles to match passenger demand and reduce fuel consumption.
However, vans have two problems. First, they only work on thin routes. Thick routes have demand for articulated buses running at high frequency, and then vans both add congestion to the bus lane and increase fuel consumption (when the vehicles are full, bigger is always more fuel-efficient). And second, they lead to safety problems, as passengers may be afraid of riding a bus alone with 3-4 other passengers but not with 20 or more (Martha Lauren rides full London buses fearlessly but would make sure to sit near the driver on nearly-empty Baltimore buses).
Medium-size buses, in the range of 20-30 seats, could be more useful on thin routes. However, passenger safety problems are likely to remain if only a handful of people ride each vehicle.
Get your maintenance costs under control
If you remove the driver, the dominant factor in bus operating costs becomes maintenance. Assuming maintenance workers make the same average annual wage and get the same benefits as transit workers in general, the wages of maintenance workers are about 15% of the total operating costs of buses in Chicago and 20% in New York.
The importance of fuel economy grows as well, but fuel today is a much smaller proportion of costs. Around 3% in Chicago and 2% in New York. European fuel costs are much higher than Americans, but so are European bus fuel economy rates: in tests, Boris buses got 4.1 km per liter of diesel, which is maybe twice as good as the US average and three times as good as the New York average.
This suggests that with the driver gone, maybe 75% of the remaining variable operating cost is maintenance. Chicago does better than New York here, since it replaces 1/12 of its fleet every year, so every year 1/12 of the fleet undergoes mid-life refurbishment and work is consistent from year to year, whereas in New York the replacement schedule is haphazard and there is more variation in work needs and thus more idle time. The most important future need for AV procurement is not electric traction or small size, but low lifecycle costs.
Update: by the same token, it’s important to keep a lid on vehicle procurement costs. New York spends $500,000 on a standard-length bus and $750,000 on an articulated bus; the Boris buses, which are bilevel and similar in capacity to an artic, cost about $500,000, which is locally considered high, and conventional artic or bilevel buses in London cost $300,000-350,000. American cities replace buses every 12 years, compared with every 15 years in Canada, and the depreciation in New York is around 6% of total bus operating costs. Cutting bus procurement costs to London levels would only save New York a small percent of its cost, but in an AV future the saving would represent around 12% of variable costs.
Plan for higher frequency
AVs represent an opportunity to reduce marginal operating costs. This means transit agencies should plan accordingly:
- Lower marginal costs encourage running buses more intensively, running almost as much service off-peak and on weekends as at rush hour.
- Very high frequency encourages passengers to transfer more, so the value of one-seat rides decreases.
- Higher frequency always increases capacity, but its value to passengers in terms of reduced wait times is higher when the starting frequency is low, which means agencies should plan on running more service on less frequent routes and only add service on routes that already run every 5 minutes or less if the buses are overcrowded.
The Role of Local Expertise in Construction Costs
When I first looked at construction costs, I looked exclusively at developed countries. Eventually I realized that the difference in average costs between rich and poor countries is small. But then I noticed a different pattern in the third world: some places, like India, Bangladesh, Nigeria, and Indonesia, spend much more than China does. Why is that? While I’ve had a bunch of different explanations over the years, I believe today that the difference concerns local expertise versus reliance on first-world consultants.
The facts, as far as I can tell, are as follows:
- Construction costs in China are about $250 million per km, a little more than the average for Continental Europe.
- Construction costs in post-communist Europe are all over, but are the same range as in Western Europe. Bulgaria is pretty cheap; in this post I bring up a line that costs around $200 million/km in today’s money but other extensions built this decade are cheaper, including one outer one at $50 million/km. In contrast, Warsaw’s Line 2 is quite expensive.
- Latin American construction costs have the same range as Europe, but it seems more compressed – I can’t find either $50 million/km lines or $500 million/km ones.
- Africa and the parts of Asia that used to be colonies have high construction costs: India and Egypt are expensive, and here I give two expensive examples from Bangladesh and Indonesia. The Lagos Metro is spending subway money on an el in the middle of a wide road and is reminiscent of American costs.
- When the first world had comparable income levels to those of the third world today, in the early 20th century, its construction costs were far lower, around $30-50 million per underground km. First-world cost growth in the last 100 years has mostly tracked income growth – it’s been somewhat faster in New York and somewhat slower in Paris, but on average it’s been similar.
For a while, I had to contend with the possibility that Chinese autocracy is just better at infrastructure than Indian (or Bangladeshi, or Indonesian, or Nigerian) democracy. The nepotism and corruption in India are globally infamous, and it’s still well-governed compared with Indonesia and Nigeria, which have personality-based politics. But then, in the developed world, authoritarian states aren’t more efficient at construction (Singapore’s construction costs are high); moreover, post-communist democracies like Bulgaria and Romania manage low construction costs.
What I instead think the issue is is where the state’s infrastructure planning comes from. China learned from the USSR and subsequently added a lot of domestic content (such as the use of cut-and-cover in some situations) fitting its particular needs; as a result, its construction costs are reasonable. The post-communist world learned from the USSR in general. There’s a wide range, with Romania near one end and Poland near the other, but the range is comparable to that of Western Europe today. Overall it seems that Eastern Europe can competently execute methods geared to the middle-income world (as the second world was in the Cold War) as well as, thanks to assistance from the EU, the high-income world.
Latin America, too, uses domestically-developed methods. The entire region is infamous in the economic development literature for having begun an inward economic turn in the Great Depression, cutting itself off from global markets and generally stagnating. Government functions are likewise done domestically or maybe outsourced to domestic contractors (and if international ones are involved, it’s in construction, not planning). Evidently, Latin America developed bus rapid transit, a mode of transportation optimally designed for countries with low incomes (so paying armies of bus drivers is cheaper than building rail tracks) and relatively strong currencies (so importing buses from richer countries isn’t ruinously expensive).
The situation in the ex-colonies is completely different. Even relatively protectionist ones outsource much of their planning to the developed world or increasingly to China, out of a combination of cultural cringe and shortage of domestic capital. The metro lines I have data for in India, Bangladesh, and Indonesia all involve Japanese technology and planning, with no attempt to adapt the technology to local conditions. So insistent is Japan on following its domestic recipe exactly that India’s high-speed rail construction is using standard gauge rather than broad gauge and Shinaknsen-size trains rather than larger Indian trains (which are 3.7 meters wide and can fit people 6-abreast). Elsewhere, China contributes capital and planning as part of the Belt and Road Initiative, and then its methods are geared toward middle income and not low income.
The correct way for countries in the per capita income range of Nigeria, India, and Bangladesh to build subways is to open up their main roads, which are often very wide, and put in four tracks in a cut-and-cover scheme similar to that of early-20th century New York. If they can elevate the tracks instead, they should use the same methods used to build Lines 2 and 6 in Paris in the early 20th century, which use concrete columns and are quiet enough that, unlike in New York, people can carry a conversation under the viaduct while a train passes. If the line needs to deviate from roads, then the city should buy property and carve up a new street (as New York did with Seventh Avenue South and Sixth Avenue in the Village) or else learn to implement late Victorian and Edwardian London’s techniques of deep boring.
However, actually implementing Belle Epoque construction methods requires particular knowledge that international consultants don’t have. Most of these consultants’ income comes from the first world, where wages are so high that the optimal construction methods involve extensive automation, using machinery rather than battalions of navvies with shovels. The technical support required for a tunnel boring machine is relatively easy in a rich country with a deep pool of qualified engineers and mechanics and a nightmare in a poor one where all such expertise has to be imported or trained from scratch. Thus, the consultants are likely to recommend the first-world methods they are familiar with, and if they do try to adapt to low wages, they may make mistakes since they have to reinvent ideas or read historical sources (which they are typically not trained to do – they’re consultants, not historians).
The result is that even though open economies tend to grow faster overall, economies with a history of closure tend to do better on this specific topic, where international consultants are not very useful for the needs of the developing world. India in particular needs to get better at indigenizing its construction and avoid mindlessly copying the first world out of cultural cringe, because even though it is almost a middle-income country by now, its wages remain a fraction of those of North America, Western Europe, and Japan, and its future growth trajectory is very different, requiring extensive adaptations. Both the overall extent of planning and the specific construction methods must be tailored to local conditions, and so far India seems bad at both (hence the undersized, expensive high-speed trains).
The Formula for Frequent Transit Networks
As I’m working on refining a concrete map for Brooklyn buses, I’m implementing the following formula:
Daily service hours * average speed per hour = daily frequencies * network length
In this post I’m going to go over what this formula really means and where it is relevant.
Operating costs
The left-hand side represents costs. The operating costs of buses are proportional to time, not distance. A few independent American industry sources state that about 75-80% of the cost of bus service is the driver’s wage; these include Jarrett Walker as well as a look at the payrolls in Chicago. The remaining costs are fuel, which in a congested city tracks time more than distance (because if buses run slow it’s because of stop-and-go traffic and idling at stops or red lights), and maintenance, which tracks a combination of time and distance because acceleration and braking cycles stress the engine.
This means that the number of service hours is fixed as part of the budget. My understanding is that the number in Brooklyn is 10,000 per weekday. I have seen five different sources about bus speeds and service provision in New York (or Brooklyn) and each disagrees with the others; the range of hours is between 9,500 and 12,500 depending on source, and the range of average speeds is between 9.7 km/h (imputed from the NTD and TransitCenter’s API) and 11 km/h (taken from schedules). The speed and hours figures are not inversely correlated, so some sources believe there are more service-km than others.
On a rail network, the same formula applies but the left-hand side should directly include service-kilometers, since rail operating costs (such as maintenance and energy) are much more distance- than time-dependent; only the driver’s wage is time-dependent, and the driver’s wage is a small share of the variable costs of rail operations.
Creating more service
Note that on a bus network, the implication of the formula is that higher speed is equivalent to more service-hours. My current belief, based on the higher numbers taken from schedules, is that 14 km/h is a realistic average speed for a reformed bus network: it’s somewhat lower than the average scheduled speed of the B44 SBS and somewhat higher than that of the B46 SBS, and overall the network should have somewhat denser stop spacing than SBS but also higher-quality bus lanes canceling out with it. The problem is that it’s not clear that SBS actually averages 14 km/h; my other sources for these two routes are in the 12-13 km/h range, and I don’t yet know what is correct. This is on top of the fact that faster transit attracts more paying riders.
Another way to create more service is to reduce deadheading and turnaround times. This is difficult. Bus depots are not sited based on optimal service. They are land-intensive and polluting and end up in the geographic and socioeconomic fringes of the city. The largest bus depot in New York (named after TWU founder Mike Quill) is in Hudson Yards, but predates the redevelopment of the area. In Brooklyn the largest depots appear to be East New York (more or less the poorest neighborhood in the city) and Jackie Gleason (sandwiched between a subway railyard and a cemetery). Figuring out how to route the buses in a way that lets them begin or end near a depot so as to reduce deadheading is not an easy task, but can squeeze more revenue-hours out of an operating cost formula that is really about total hours including turnaround time and non-revenue moves.
Service provision
The right-hand side of the equation describes how much service is provided. The network length is just the combined length of all routes. Daily frequency is measured in the average number of trips per day, which is not an easily understandable metric, so it’s better to convert it to actual frequencies:
| Frequency | Daily trips |
| 15 minutes 6 am-9 pm, 30 minutes otherwise 5-1 am | 70 |
| 15 minutes 24/7 | 96 |
| 5 minutes 7-9 am, 5-7 pm, 10 minutes otherwise 6 am-10 pm, 30 minutes 10 pm-12 am | 124 |
| 5 minutes 7-9 am, 5-7 pm, 7.5 minutes otherwise 6 am-10 pm, 15 minutes 10 pm-12 am, 30 minutes overnight | 164 |
| 6 minutes 6 am-10 pm, 10 minutes otherwise 5-12 am, 30 minutes overnight | 188 |
| 5 minutes 6 am-10 pm, 10 minutes otherwise 5-12 am, 20 minutes overnight | 228 |
| 3 minutes 7-9 am, 5-7 pm, 5 minutes otherwise 6 am-10 pm, 10 minutes otherwise 5-12 am, 20 minutes overnight | 260 |
Daily trips are given per direction; for trips in both directions, multiply by 2. There are internal tradeoffs to each number of daily trips between peak and off-peak frequency and between midday frequency and span. But for the most part the tradeoff is between the average number of daily trips per route and the total route-length. This is the quantitative version of Jarrett’s frequency-coverage tradeoff. In reality it’s somewhat more complicated – for example, average speeds are lower at the peak than off-peak and lower in the CBD than outside the CBD, so in practice adding more crosstown routes with high off-peak frequency costs less than providing the same number of revenue-km on peaky CBD-bound buses.
It’s also important to understand that this calculation only really works for frequent transit, defined to be such that the ratio of the turnaround time to the frequency and length of each route is small. On low-frequency routes, or routes that are so short that their total length is a small multiple of the headway, the analysis must be discrete rather than continuous, aiming to get the one-way trip time plus turnaround time (including schedule padding) to be an even multiple of the headway, to avoid wasting time. On regional rail, which often has trains coming every half hour on outer tails and which is much more precisely scheduled than a street bus ever could be, it’s better to instead get the length of every route from the pulse point to the outer end to be an integer or half-integer multiple of the clockface headway minus the turnaround time.
Where is New York?
All of my numbers for New York so far should be viewed as true up to a fudge factor of 10-15% in each direction, as my source datasets disagree. But right now, Brooklyn has about 10,500 revenue-hours per weekday (slightly more on a school day, slightly fewer on a non-school day) and an average speed of about 10.5 km/h, for a total of 110,000 revenue-km. Its bus network is 550 km long, counting local and limited versions of the same bus route as a single route but counting two bus routes that interline (such as the B67 and B69) separately; interlining is uncommon in Brooklyn, and removing it only shortens the network by a few km. This means that the average bus gets 200 runs per day, or 100 per direction.
Based on the above table, 100 runs per direction implies a frequency somewhat worse than every 5 minutes peak and every 10 off-peak. This indeed appears to be the case – nearly half of Brooklyn’s network by length has off-peak weekday frequency between 10 and 15 minutes, and the median is 12. At the peak, the median frequency, again by route-length, is 7 minutes. 7 minutes peak, 12 off-peak with some extra evening and night service works out to just less than 100 runs a day in each direction.
This exercise demonstrates the need to both shrink the network via rationalization to reduce the number of route-km and increase speed to raise the left-hand side of the equation. SBS treatments increased the speed on the B44 and B46 by 30-40% relative to the locals (not the limiteds), but just keeping the network as is would onl permit 130-140 buses per weekday per direction, which is more frequency but not a lot of frequency. The 7.5-minute standard that appears to be used in Toronto and Vancouver requires more; Barcelona’s range of 3-8 minutes implies an average of 5-6 and requires even more.
Where could New York be?
It’s definitely possible to get the number of daily frequencies on the average Brooklyn bus route to more than 200 in each direction. In Manhattan this appears true as well (the big question is whether the avenues can get two-way service), and in the Bronx 250 is easy. But even 200 in Brooklyn (which implies perhaps 350 km of network) requires some nontrivial choices about which routes get buses and which don’t, cutting some buses that are too close to other routes or to the subway. I’m not committing to anything yet because the margin calls happen entirely within the 10-15% fudge factor in my datasets.
The main reason I post this now is that I believe the formula is of general interest. In any city that wants to rationalize its transit system (bus or rail), the formula is a useful construction for the tradeoffs involved in transit provision. You can look at the formula and understand why some systems choose to branch: at the same average frequency the busiest parts of the network would get more service. You can also understand why some systems choose not to branch: at some ranges of frequency, the outer ends would get so little frequency that it would discourage ridership.
What is high frequency?
I’m using 5-6 minutes as a placeholder value beyond which there’s no point in raising frequency if there’s no capacity crunch. This isn’t quite true – on a 15-minute bus trip, going from 6 minutes between buses to 3 is a 14% cut in worst-case trip time including wait – but at this point higher frequency is at best a second-order factor. It’s not like now, when going from 15 minutes to 6 would reduce the worst-case trip time on the same bus trip by 30%.
The actual values depend on trip length. An intercontinental flight every hour is frequent; a regional train every hour is infrequent; a city bus every hour might as well not exist. One fortunate consequence is that bus trips tend to be shorter in precisely the cities that can most afford to run intensive service: dense cities with large rail networks for the buses to feed. New York’s average NYCT bus trip (excluding express buses) is 3.5 km; Chicago’s is 4.1 km; Los Angeles’s is 6.7 km. Los Angeles can’t afford to run 6-minute service on its grid routes, but trips are long enough that 10-minute service may be good enough to start attracting riders who are not too poor to own a car.
I Saw a Stampede on the Metro
France won the World Cup. Once the final ended, people all over Paris went out to the streets to celebrate. At Nation I saw impromptu dancing, drivers waving tricolore flags, and car passengers climbing out of their cars to wave their own flags. But the real celebration was elsewhere, on Champs-Elysees in the central business district. This was well covered in the media; the Guardian cites an estimate of one million people going to Champs-Elysees to celebrate, and ESPN reports riots (which I didn’t witness but can easily believe happened given the general conduct I did see) and 110,000 police and gendarmerie officers.
The sidewalks were crowded and it was difficult to move; there were too few street closures, so pedestrians were confined to narrow zones for the most part. But the crowding was worst at the Metro stations, and RATP should learn from this example and do better next time there are large celebrations, perhaps next Bastille Day.
The problem is cascading closures. In London, where the Underground platforms are narrower and have fewer cross-passageways than the Metro platforms here, closures are routine at Bank because often the passageways get dangerously overcrowded. These closures cascade: once Bank is closed to limit crowding, passengers swarm the adjacent stations, such as Moorgate and London Bridge, which are not built to handle the typical Bank crowds, forcing TfL to close them as well.
France won the game around 7 in the evening Paris time. By 8, some stations on Champs-Elysees were closed, and as I sat on my severely delayed Metro Line 1 train, with passengers banging on the train’s walls and ceiling, I heard that they were closing more, ultimately going express from Palais-Royal to Argentine and skipping all the CBD stations, including Etoile. I got off at Argentine, as did practically the entire train. Not designed to handle the crowds of the entire CBD at once, Argentine’s platform was jammed. I spent maybe ten minutes trying to make my way from where I got off to the front end of the platform, where the only exits were, and failed, and at a few points the mass of passengers was such that I thought a stampede was likely. The only reason nobody fell onto the tracks was the platform edge doors, installed during the automation of Line 1.
Trains kept serving the station, dumping more and more people. The only mechanism preventing more passengers from getting on was that the crowding was so intolerable that some people started getting back onto the trains, including eventually me. I couldn’t even get off at the next stop, Porte Maillot – the platform was fine but the train was too crowded – so I got off in the suburbs, at Les Sablons, and walked back east.
Perhaps RATP did eventually close Argentine. But both RATP and the city made crucial mistakes that evening, which they should fix in the future.
First, they should have made the trains free to improve passenger circulation. Paying at the turnstiles takes time. This is especially bad in Paris, where there are separate gates for entry (which are turnstiles) and exit (which are one-way doors), unlike the two-way turnstiles of New York. Moreover, unlike New York, Paris has no large emergency doors that can be opened. All passengers were going in one direction – out – so RATP should have propped the exit doors open to let passengers out more smoothly.
Free transit for special events is routine in Paris. The trains are free around New Year’s, in order to encourage people to take the train rather than add to car traffic and pollution (and perhaps drunk driving). Bastille Day celebrations and any future victory at the World Cup or Euro Cup should be added to the list of free transit events, not to discourage people from driving but to prevent stampedes.
And second, the city should have closed the surrounding area to non-emergency car traffic. Champs-Elysees was closed, but there wasn’t much place to spill over; the side street I took once I tried leaving had a narrow sidewalk, and police cars were parked in a way to restrict people to a constrained exit path. There is no parallel street that can act as a spillover route, and between the Rond-Point and Etoile there is only one crossing street wider than about 25 meters, Avenue George V on the south side (whereas almost all rail alternatives to the Metro Line 1 are on the north side). With narrow side streets, it’s especially important to dedicate space to pedestrians and emergency vehicles and not to cars. This was as far as I can tell not done, making it hard for people to leave the most crowded areas. In contrast, Etoile itself, with twelve avenues radiating from its circle, was not so crowded, as people had escape routes.
World Cup victories are rare enough that cities understandably don’t design their entire layout based on them. But when they do happen, it’s critical to have a plan, and the same is true of other big celebrations, which often occur annually on national days. If passengers are overwhelming the subway, it’s critical to quickly do whatever the agency can to increase throughput at station passageways as well as on the tracks. And if pedestrians are overwhelming the streets above ground, it’s critical to give them more street space, including for entry and exit.
Bus Branching
There are two standard reasons why public transit should limit branching. The first is that it reduces frequency on the branches; this is Jarrett Walker’s reason, and distantly the reason why New York doesn’t interline more than two subway services anywhere except 60th Street Tunnel. The second is that it makes schedules more fragile, first because services have to be scheduled more precisely to alternate among branches, and second because delays on one branch propagate to the others. And yet, rail and bus networks still employ branching, due to benefits including better coverage and focusing frequency where demand is the highest. This is especially common on regional rail, where all services are scheduled and often interact with the mainline network, so the second problem of branching is present no matter what. Metro systems instead have less branching, often because they only serve dense areas so that the main benefits of branching are absent. But what about buses?
I posit that bus branching is more valuable in low-density areas than in high-density areas. If an area only has demand for a bus every 30 minutes, and some farther-out places only have demand for an hourly bus, then it’s fine to branch the route in two. The bus would only be useful with some timed transfers at the inner end – maybe it’s feeding a regional train station with a train every half hour – but the Zurich suburbs have half-hourly clockface schedules with timed bus/rail connections and maintain high mode share for how low their density is.
In the other direction, look at Manhattan specifically. I’ve been looking at its bus network even though I’m only supposed to redesign Brooklyn’s. I’ve mentioned before that my epistemology is that if the presence of factor A makes solution B better, then the absence of factor A should make solution B worse. I noticed that the Brooklyn bus network has very little branching: the only route numbers that branch are the B41 and B38, and the only routes with different numbers that share the majority of their lengths are the B67 and B69 (which reverse-branch). However, Manhattan has extensive branching: the M1/2/3/4 share the Madison and Fifth Avenue one-way pair, and the M101/102/103 share the Third and Lexington one-way pair. Understanding why would be useful even if I only care about Brooklyn: if there is a good reason for Manhattan buses to branch then I should consider adding branching in Brooklyn where appropriate, and even if it’s inappropriate, it’s useful to understand what special circumstances make branching good in Manhattan but not in Brooklyn.
As it is, I don’t believe the branching in Manhattan is useful for Brooklyn. This comes from several reasons, at least one of which implies it’s not really useful for Manhattan either, and by extension for other high-density regions.
Base frequency
You can run a bus that comes every half hour on a schedule, making it possible to interline two hourly routes evenly. With some discipline you can go down to 15 minutes, or possibly even 10: Vancouver runs 12-minute limited buses on 4th Avenue on a clockface schedule with on-board fare collection and shared lanes, but there is signal priority at nearly all intersections and relatively little car traffic since the West Side’s street network is rich in arterial roads and distributes cars across other routes (i.e. Broadway, 12th, and 16th Avenues).
In contrast, it’s not really feasible to run buses on a schedule when they come every 5 minutes. There can be a printed schedule, but buses won’t follow it reliably. Once frequency hits about once every 3 minutes, regular street buses bunch so much that adding more buses doesn’t increase passenger capacity, but even in the 5-10 minute range, schedules are less important than headway management, unless the bus has extensive BRT treatments reducing schedule variance. This means that if a bus comes every 10 minutes and is scheduled on headway management, then branching the route means each branch gets service every 20 minutes scheduled on headway management as well. Few passengers would want to ride such a route. This is the worst region for branching, the 7.5-15 minute range in which branches force passengers to use buses that are both infrequent and irregular.
The highest-frequency routes can branch with less risk. If a 5-minute bus branches in two, then each branch gets 10-minute service, at which point reliable schedules are still desirable but not absolutely necessary. How much service do the Manhattan bus trunks run? In the following scheme, peak means the busiest hour in the morning in the peak direction, and off-peak means the lowest frequency between the morning and afternoon peaks, which is usually around 11 am.
M1: 13 buses per hour peak (8 limited, 5 local), 5 off-peak (all local)
M2: 9 peak, 4 off-peak
M3: 6 peak, 6 off-peak
M4: 12 peak (5 limited, 7 local), 6 off-peak (all local)
M101: 6 peak, 6 off-peak (8 in the busiest off-peak hour, 2-3 pm)
M102: 5 peak, 4 off-peak
M103: 5 peak, 4 off-peak
What we see is that Manhattan branches precisely in the worst frequency range. The buses are frequent enough that it’s not possible to run them on a timetable without either much better segregation from traffic than is feasible (even waving away politics) or massive schedule padding, but they still require passengers in Upper Manhattan to wait 10-15 minutes for their specific branch. One might expect that Bus Time would make it easier on passengers by telling them where the bus is, but no, ridership has actually fallen since apps were introduced (and this fall predates the entry of app-hailed TNCs into the city). It turns out passengers like being able to rely on easily memorable clockface schedules, or else on frequencies so high that they only need to wait 5 minutes, not 15.
The street network
Even one-time visitors to New York notice that the avenues in Manhattan are all one-way. This features prominently in the Manhattan bus network, which employs consistent one-way pairs on First/Second, Third/Lex, Madison/Fifth, and Ninth/Tenth. Moreover, again as every visitor to New York knows, Central Park occupies a large blob of land in the middle, interrupting Sixth and Seventh Avenues.
The upshot is that there are more north-south routes north of 110th Street than south of it. This is roughly the branch point on the three trunks that branch (First/Second only carries the M15). In Harlem, there’s demand for buses on Lenox (i.e. Sixth) and Seventh, both of which are two-way there. There’s also commerce on an interpolating route, Manhattan/St. Nicholas, which is effectively 8.5th Avenue in most of Harlem. Farther west, Ninth/Columbus is no longer a useful through-route north of 110th, but instead Tenth/Amsterdam is two-way, and one of the two buses using the Columbus/Amsterdam one-way pair on the Upper West Side, the M11, indeed goes two-way on Amsterdam north of 110th.
This situation occurs very frequently in cities without gridded street networks. One trunk route will split in two, heading to different former villages that were incorporated into the city as it industrialized and grew. Manhattan is unusual among gridded cities in that its avenues are one-way, forcing buses into one-way pairs south of Harlem that, together with Central Park, ensure there are more useful routes north of 110th than south of it. But among cities without a planned street network this is typical.
As a check, let’s look at the bus networks in two ungridded American cities: Boston and Providence. Do they have a lot of interlining, involving one trunk route splitting in two farther out? Yes, they do!
Here is Providence. Going west of Downcity, there are two major routes to Olneyville, Westminster and Broadway, but beyond Olneyville there are four main streets, so each of the two inner corridors carries two bus routes, and one of these four routes even splits in two farther out. Going north, Charles Street carries four routes, branching off at various locations. Going east there’s a bus tunnel to College Hill carrying many routes, but even outside the tunnel, the one-way pair on Angell and Waterman carries three buses, which split in East Providence. And going south and southwest, Broad Street carries multiple routes, and one of its branches, Elmwood, carries two, splitting farther south.
Here is Boston. Unlike in Providence, buses don’t converge on city center, but on subway stations, so the map is much less clean. However, we see the same pattern of trunk routes splitting into branches. For example, going south of Ruggles, many routes go southeast to Dudley and then south on Warren Street, splitting to various destinations in Dorchester, Mattapan, and Hyde Park on the way. Going southwest of Forest Hills we see many routes use Washington Street, some staying on it and branching in Dedham and some veering west to West Roxbury and branching there. Elsewhere in the system we see the same pattern going north of Maverick and Oak Grove, northeast of Malden, west of Harvard (briefly on Mount Auburn), and northwest of Alewife.
One-seat rides and reverse-branching
I have repeatedly criticized the practice of reverse-branching on subway networks, especially New York, in which two train routes share tracks in an outlying area (such as Queens Boulevard) and then split heading into the center (such as Eighth Avenue on the E versus Sixth Avenue on the F). I did so on the same grounds that any branching is suspect: it reduces frequency on specific routes, and makes the schedule more fragile as delays propagate to more of the network. Moreover, the issue of schedule fragility gets worse if many routes share tracks at some point during their journey, whereas with conventional branching there are only two or three branches per trunk and the trunks form self-contained systems. Finally, reverse-branching lacks the main benefit of conventional branching, as it does not concentrate traffic in the core, where there’s most demand.
These issues are present on bus networks, with two modifications:
- The value of one-seat rides is somewhat higher. Transferring between buses is less nice than transferring between subways: in a Dutch study about location decisions, people’s disutility of out-of-vehicle time on buses was 1.5 times as high as on trains.
- Buses can overtake each other and, even without overtakes, run much closer together than trains. The limiting factor to capacity on buses is schedule fragility and bunching and not stopping distances. This means that reverse-branching is less likely to lead to cascading delays – buses do not have a 2-minute exclusion zone behind them in which no buses may enter.
This means that reverse-branching is more defensible on buses than on trains. However, even then, I don’t think it’s a good idea. At least in Manhattan, reverse-branching consists of avenues in Upper Manhattan that have buses going to both the East Side and the West Side: the M7 (serving the Ninth/Tenth pair) and the M102 both run on Lenox, and the M4 and M104 (running on Broadway to Midtown) both run on Broadway in Morningside Heights. These splits both reduce the frequency available to bus riders and should be eliminated. East-west service should be provided with high-quality bus routes on the main streets, especially 125th (which needs a full subway) but also 116th, 135th, 145th, and 155th.
The snag is that grids don’t work well unless they are complete. The Manhattan grid isn’t complete through Upper Manhattan, because 116th and 135th are discontinuous, without a direct connection from Central Harlem to Morningside Heights and West Harlem. However, the M7 route duplicates the 2 and 3 trains, so it’s not necessary for east-west connectivity. The M4 route doesn’t duplicate the subway, but does duplicate the M101, which runs on 125th Street and Amsterdam (and isn’t a reverse-branch because the M11 terminates shortly after 125th), so it’s not useful by itself.
Should buses branch?
There is one solid reason for buses to branch: if the street network has more major routes closer to the center than in outlying areas, then buses running on the outer arterials should come together close to the core. This is common enough on cities with haphazard street networks. It may also be reinforced if there are weak circumferential streets (Sydney is one such example). In contrast, cities with gridded street plans, even broken grids like those of Brooklyn and Tel Aviv, should have little to no bus branching.
If a bus does branch, it should ideally be extremely frequent on the trunk, so that even the branches have decent headway-based service. I’m not willing to commit to a maximum headway, but Barcelona and Toronto both have at worst 8-minute headways on their bus grids, so if that is indeed the maximum then a bus shouldn’t branch if its off-peak frequency is worse than every 4 minutes and better than every 10-20 (the more reliable the timetable is, the lower the upper limit is, since it’s possible to run on a timetable at higher frequency). In my case of interest, Brooklyn, there is exactly one bus route that comes at least every 4 minutes off-peak: the B46 on Utica runs 16 buses per hour in each direction, counting both local and limited (SBS) routes.
The area in which buses absolutely should not branch – strong interconnected networks of arterials (not necessarily grids – Paris’s network counts too), running buses every 5-15 minutes off-peak – is exactly where most strong bus networks are. It’s rare to have a bus that has extremely high frequency all day, because in most functional city such a bus would be a subway already; as it is, Utica has long been New York’s second priority for subway service, after Second Avenue. So for the most part, the places where buses are the strongest are precisely those where branching is the most deleterious. Low-frequency networks, perhaps connecting to a suburban train station with a timed transfer, should add bus branching to their planning toolkit, but high-frequency urban networks should not.
Why is Tramlink So Weak?
I’ve mentioned on Twitter that I’m visiting London. I’m taking a lot of railfan trips, one of which was on Tramlink, London’s circumferential light rail service. Tramlink runs in South London, from Wimbledon in the west to Croydon in the east and thence along several branches to southeastern outer neighborhoods. Much of the route uses former mainline rail rights-of-way that were only partly grade-separated. The trains satisfy all of TransitCenter’s principles for good light rail operating practices, but their ridership is lackluster by the standards of Paris, TransitCenter’s comparison city. Tramlink has 30 million annual riders on 28 km of route, or about 3,500 per km per weekday; Ile-de-France’s system had 900,000 daily riders in 2015 on about 100 km route, or 9,000 per km. My goal is to explain why. One reason involves route choice, but the main reason is lack of development; this problem is very common in other cities, and must be added to the other pitfalls that TransitCenter mentions.
The operating practices on Tramlink are not bad. The frequency is high: every 5 minute off-peak. There’s no fare integration with the proper rail network (including the Underground), but the buses in London have no fare integration with the trains either and still have high ridership. The connections with radial train lines are decent, though there’s one big miss (with the Northern line) and one smaller one (with West Croydon, which points to train stations that are served by other lines that do get interchanges); the two most important transfers, Wimbledon and East Croydon, require relatively little walking between platforms. The right-of-way quality is high by light rail standards, mostly in a private right-of-way with only a small extent of street running within Croydon; the average speed is 21 km/h (higher than the Parisian tramways – T3 averages 18 km/h). And yet, ridership is not so strong. London is a big city with high rail ridership, so it’s not a matter of a small city underperforming Paris on raw ridership; something deeper is wrong with Tramlink.
Part of the problem has to involve route layout. East of East Croydon, the route has three branches. Two, heading to Elmers End and Beckenham Junction, keep the route’s circumferential character; in theory it should be faster to take mainline rail and change trains than to ride Tramlink, but in reality the mainline routes that would be used have missed connections and therefore are not useful for diagonal trips. Each of these two branches runs every ten minutes, interlining to a train every five minutes between East Croydon and Wimbledon. However, a third route connects East Croydon and New Addington, a radial line, running every 7.5 minutes. This route does not run through to Wimbledon (which would be a radial-circumferential mix) and exists as an orphaned feeder line, sharing tracks with the two main branches just east of East Croydon (thus, creating schedule conflict due to the uneven frequency on the shared trunk).
But the main difference between Tramlink and the Parisian tramways is adjacent density. London is generally a less dense city than Paris. London has two- and three-story rowhouses with back gardens where Paris has five- to nine-story buildings with high lot coverage. The Tramlink route itself is even less dense, passing through suburbia, industrial sites, and golf courses. The Parisian tramways are all in the suburbs (except for T3), but serve high-density clusters, surrounded by a mixture of mid-rise buildings and social housing towers. This is especially true on the workhorse Parisian routes – T1, T2, and T3, which collectively have about three quarters of the system’s total ridership – but even the other routes, while much weaker than the main three, serve denser areas than Tramlink and get higher ridership per kilometer.
Here is a randomly-selected station on T2, Meudon-sur-Seine:

Compare it with Mitcham, one of the more populated stations on Tramlink between Wimbledon and Croydon:

Also compare both with the site of the missed connection with the Northern line, Morden Road:
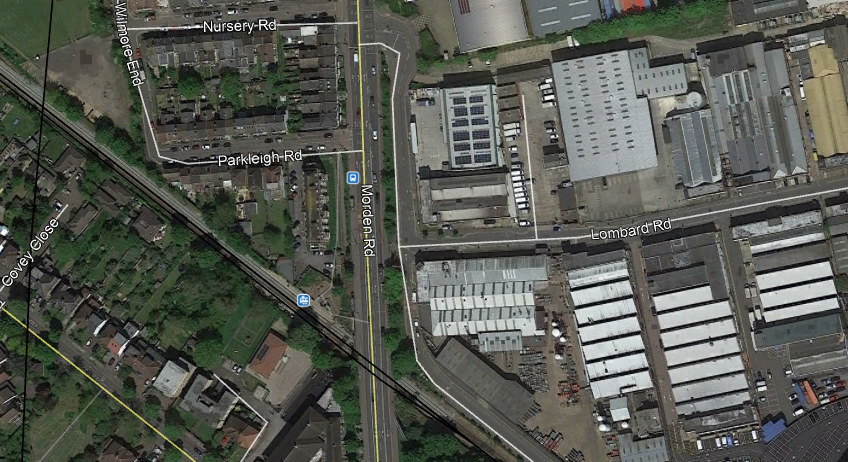
I want to make it very clear that the two satellite maps of Mitcham and Morden Road are not representative of all of South London, certainly not when weighting by population. East Croydon is full of mid- and high-rise TOD, and to some extent so is Wimbledon; the two stations rank fifth and sixth in ridership in London excluding the Central London terminals. The problem is that a circumferential line is rarely used over a long stretch. The longer the angle subtended on a circumferential line, the more favorable it is to take the radials and transfer.
London in particular has four-track mainlines on most rail routes, including the London and South Western Main (serving Wimbledon) and the Brighton Main (serving East Croydon), making it easy to run express routes. Every hour, there are 9 trains running nonstop between East Croydon and Clapham Junction, and 16 trains running between Wimbledon and Clapham Junction with two intermediate stops. The diagonal commuter rail trip is faster than Tramlink, even counting transfer time at Clapham Junction.
Paris is full of express trains, represented by the RER. But T3 misses nearly all of the RER connections, which weakens the route but also means that there is no express alternative on the outer margin of Paris; but one would still not take it all the way, especially since there is a forced transfer at Porte de Vincennes. But T1 and T2 have better RER and Transilien connections. The high density all along these routes, and not just at widely-separated key junctions, ensures that there is high demand even on short segments.
In fact, there is circumstantial evidence that T1, T2, and T3 have extensive short-range ridership: their ridership levels per kilometer are very high (respectively 11,000, 12,000, and 15,000 per weekday), and if they had low turnover they would not have capacity for such high ridership. New York has 15,000 weekday subway riders per route-km, and this is with long trains, extensive four-tracking, and higher peak frequency than on the Parisian tramways. It’s hard to imagine comparable ridership levels on a surface tramway without very high turnover, which I have in fact observed riding T3.
In contrast, I saw relatively little turnover between Wimbledon and East Croydon on Tramlink. I saw some, generally involving a small net decrease in passengers on the tram at the first few stations past Wimbledon, but a large proportion of passengers who got on at Wimbledon stayed on until Croydon. To them, the tram is perhaps a slower but cheaper alternative to mainline rail. Some would also ride until one or two stations before East Croydon, within the built-up cluster of Croydon; perhaps their exact destination was closer to one of these tram stations than to East Croydon, where the tram loses a lot of time due to circuitous street running.
Reinforcing the importance of turnover, the tram was crowded. I took it at 4:30 in the afternoon, on the shoulders of rush hour, and it was standing-room only for my entire trip, with considerable crowding among the standees for the first few stations. And yet, despite the crowding, ridership per kilometer is a fraction of that achieved by Paris’s top three tramways, which do not appear more crowded.
I wrote about turnover in the context of Vancouver buses, talking about patterns of development along north-south arterials (Main, Fraser, and Commercial) versus east-west ones (King Edward and 49th). Here we see how it interacts with development on a circumferential tramway within the context of a rapid transit network with fast radial lines. It’s common in a large city to have strong demand for circumferential transit but not so much that full rapid transit is justifiable, leading to tramway networks such as Tramlink and the tramways of Ile-de-France. In this context, it’s important to attract short-hop ridership and not just end-to-end ridership, where the tramway would struggle with the radial rapid transit network. This in turn requires the region to ensure that the intermediate stops generate ample ridership, which requires either uniformly high density (as is the case in and around Paris) or a deliberate effort at TOD in the middle.
This is true for more than just tramways. The fundamental fact about Tramlink and the Ile-de-France tramways is that they are slower than their respective cities’ radial rail networks. The same fundamental fact is true of circumferential buses, even in cities where the radial rail network is light rail rather than rapid transit. In theory this could even happen in an all-bus city, provided the buses’ right-of-way quality were such that the radials were faster than the circumferentials; but in reality this is hard to arrange, since buses get stuck in traffic even when they’re BRT, and there’s more traffic near city center than outside.
Focus on What’s Common to Good Transit Cities, not on Differences
Successful transit cities are not alike. There are large differences in how the most expansive transit networks are laid out. It takes multiple series of posts across several blogs (not just mine but also Human Transit and others) covering just one of them, for example stop spacing or how construction contracts are let. With so much variation, it’s easy to get caught up in details that differentiate the best systems. After all, the deepest communities of railfans tend to sprout in the cities with the largest rail networks; arguing with railfans with experience with London, Tokyo, or Paris is difficult because they know intricate details of how their systems work that I am catching up on but only know in the same depth for New York. Add in the fact that London and Paris view each other as peer cities and from there the route to arguing minutiae about two cities that by most standards have good public transit is short.
But what if this is wrong? What if, instead of or in addition to figuring out differences among the top transit cities, it’s useful to also figure out what these transit cities have in common that differentiates them from auto-oriented cities? After all, in other aspects of development or best practices this is well-understood: for example, a developing country can choose to aim to be hyper-capitalist like Singapore or the US or social democratic like Sweden or France, but it had better develop the institutions that those four countries have in common that differentiate them from the third world.
Unfortunately, before discussing what the common institutions to transit cities are, it’s necessary to discuss things that may be common but don’t really matter.
The US as a confounding factor
The biggest problem with figuring out things all good transit cities have in common is that in the developed world, the US (and to some extent Canada and Australia) is unique in having bad transit. Frequent commenter Threestationsquare has a list of cities by annual rapid transit ridership (counting BRT but not infrequent commuter rail, which lowballs parts of the US); New York is near the top, but the second highest in the US, a near-tie between Boston, Chicago, and Washington, would rank #22 in Europe. As a result, some social, political, and technical features that appear to differentiate good and bad transit are not really about transit but about the US and must be discarded as confounding factors. Fortunately, most of these confounding factors are easy to dispose of since they also occur in New York.
The more difficult question concerns factors that are distantly related to the weakness of US transit but are not direct explanations. I wrote about racism as such a factor a few months ago, arguing that high US construction costs come from weak civil service, which in turn comes from the way American segregation works. The US is not uniquely racist or even uniquely segregated; the unique aspect is that it a) has a long-settled oppressed minority and not just immigrants who arrived after the characteristic of the state was established, and b) has segregation within metro areas (unlike Singapore, which has social but not spatial segregation) but not between them (unlike Israel, where the built-up area of Tel Aviv has very few Arabs). But while this can explain why institutions developed in a way that’s hostile to transit, it’s not a direct explanation for poor US transit except in Atlanta, where the white state underinvests in the black city. White people in Boston, Los Angeles, Houston, and other cities with little to no public transit do not avoid the bus or the train out of stereotypes that match typical American racial stereotypes, such as crime; they avoid the train because it doesn’t go where they’re going and the bus because it is slow and unreliable.
There are two ways to avoid confounding factors. The first is the sanity check, where available: if some feature of transit exists across major transit cities but is absent in auto-oriented cities not just in the US but also in Canada, Australia, New Zealand, Israel, and Italy, then it’s likely to be relevant. Unfortunately, clean examples are rare. The second and more difficult method is to have theoretical understanding of what matters.
Size artifacts
London and Paris are transit cities. So are Prague and Stockholm. I’ve stressed the importance of scale-variance before: features that work in larger cities may fail in smaller ones and vice versa. Thus, it’s best to look at common features of successful transit cities within each size class separately.
In fact, one way cities can fail is by adopting transit features from cities of the wrong size class. China is making the mistake in one direction: Beijing and Shanghai have no express subway trains or frequent regional rail services acting as express urban rail, and as a result, all urban travel has to slow down to an average speed of about 35 km/h, whereas Tokyo has express regional lines averaging 60 km/h. China’s subway design standards worked well for how big its cities were when those standards were developed from the 1970s to the 1990s, but are too small for the country’s megacities today.
In contrast, in the developed world, the megacities with good public transit all have frequent express trains: Tokyo and Osaka have four-track (or even eight-track!) regional lines, Paris has the RER, New York has express subways (and the premium-price LIRR trains from Jamaica to Penn Station), London has fast regional rail lines and Thameslink and will soon have Crossrail, Seoul has a regional rail network with express trains on Subway Line 1, and Moscow stands alone with a strictly two-track system but has such wide stop spacing that the average speed on the Metro is 41 km/h. Smaller transit cities sometimes have frequent express trains (e.g. Zurich and Stockholm) and sometimes don’t (e.g. Prague), but it’s less important for them because their urban extent is such that a two-track subway line can connect the center with the edge of the built-up area in a reasonable amount of time.
And if China failed by adopting design standards fitting smaller cities than it has today, the US fails in the other direction, by adopting design standards fitting huge megacities, i.e. New York. Small cities cannot hope to have lines with the crowding levels of the Lexington Avenue Line. This has several implications. First, they need to scale their operating costs down, by using proof of payment ticketing and unstaffed stations, which features are common to most European transit cities below London and Paris’s size class. Second, they need to worry about train frequency, since it’s easy to get to the point where the frequency that matches some crowding guideline is so low that it discourages riders. And third, they need to maximize network effects, since there isn’t room for several competing operations, which means ensuring buses and trains work together and do not split the market between them.
The best example of an American city that fails in all three aspects above is Washington. While railfans in Washington lament the lack of express tracks like those of New York, the city’s problems are the exact opposite: it copied aspects of New York that only succeed in a dense megacity. With interlining and reverse-branching, Washington has low frequency on each service, down to 12 minutes off-peak. The stations are staffed and faregated, raising operating costs. And there is no fare integration between Metro and the buses, splitting the market in areas with price-sensitive riders (i.e. poor people) like Anacostia.
The political situation
While I’ve written before about what I think good metro design standards are, these standards themselves cannot separate the major transit cities from cities like Los Angeles (which has about two and a half rail trunks in a metro area larger than that of London or Paris) or Tel Aviv (which has no metro at all). Instead, it’s worth asking why these cities have no large subway systems to begin with.
In the case of Tel Aviv, Israel has had an official policy of population dispersal since independence. After independence the North and South of the country had Arab majorities, and the government wished to encourage Jews to settle there to weaken any Palestinian claims to these areas. As a result, Prime Minister David Ben Gurion rejected a plan to develop an urban rail network centered on Tel Aviv and instead encouraged low-income Jewish immigrants to move far away, either to depopulated Arab towns or to new towns (“development towns”) built at strategic points for national geopolitics. Decentralization was national policy, and with it came auto-oriented urbanism. A less harsh but equally politicized environment led to Malaysia’s auto-centric layout: Paul Barter’s thesis outlines how Malaysia choked informal transit and encouraged auto-oriented suburbanization in order to create an internal market for state-owned automakers.
In the case of the US, the situation is more complex, since there were several distinct political trends in different eras favoring cars. In postwar suburbia (and in Los Angeles going back to the 1920s) it was the association of cars with middle-class normality, and in California also with freedom from hated railroads; it’s related to the fact that American suburbanization was led by the middle class rather than by the working class as with more recent exurbanization. In Israel suburbanization was led by the working class, but the deliberate government policy of decentralization meant that the urban middle class’s demands for better transportation were ignored until the 1990s.
Without enough of an urban middle class to advocate for more transit, US transit withered. New cities in the Sunbelt had little demand for public transit, and in the older cities the middle class cared little for any transit that wasn’t a peak-only commuter train from the suburbs to the CBD. Moreover, in existing transit cities the middle class demanded that the urban layout change to fit its suburban living situation, leading to extensive job sprawl into office parks that are difficult to serve on transit. This paralleled trends in Canada, Australia, and New Zealand; Sydney in particular saw middle-class suburbanization early, like Los Angeles.
The political situation changed in the 1970s, 80s, and 90s, but by then high construction costs, NIMBYism constraining the extent of TOD (unlike in Canada), and indifference to leveraging regional rail for urban transit (as in Canada and until recently Israel but unlike in Australia) made it difficult to build more public transit lines.
Regional rail and TOD
The largest transit cities in the rich and middle-income world all make extensive use of regional rail, with the aforementioned exception of Chinese cities, where the lack of regional rail is creating serious travel pain, and New York, where the city itself is transit-oriented but its suburbs are not. Smaller transit cities usually make use of regional rail as well, but this isn’t universal, and to my understanding is uncommon in Eastern Europe (e.g. Kyiv has one semi-frequent ring line) even in cities with very high metro and tramway usage.
However, smaller transit cities that do not have much regional rail have full metro systems and not just tramways, let alone BRT. Curitiba and Bogota are famous for their BRT-only transit networks, but both instituted their systems in a context with low labor costs and both are building metro systems right now.
The other common element to transit cities is TOD. Here, we must distinguish old cities like London, Paris, Berlin, and Vienna, whose urban layout is TOD because it was laid out decades before mass motorization, and newer cities like Stockholm, Tokyo, and every city in Eastern Europe or the East Asian tiger states. The latter set of cities built housing on top of train stations, often public housing (as in the communist world or in Stockholm) but not always (as in Tokyo and to some extent Hong Kong), in an era when the global symbol of prosperity was still the American car-owning middle class.
The importance of TOD grows if we compare countries with relatively similar histories, namely, the US and Canada. Neither country does much regional rail, both have had extensive middle-class suburbanization (though Canada’s major cities have maintained bigger inner-urban middle classes than the US’s), and English Canada’s cities came into the 1970s with low urban density. The difference is that Canada has engaged in far more TOD. Calgary built up a large CBD for how small the city is, without much parking; Vancouver built up Downtown as well as transit-oriented centers such as Metrotown, New Westminster, Lougheed, and Whalley, all on top of the Expo Line. Nowhere in the US did such TOD happen. Moreover, American examples of partial TOD, including Arlington on top of the Washington Metro and this decade’s fast growth in Seattle, have led to somewhat less awful transit usage than in the rest of the country.
Most cities in the developed world are replete with legacy rail networks that can be leveraged for high-quality public transit. We see cities that aim at transit revival start with regional rail modernization, including Auckland and to some extent Tel Aviv (which is electrifying its rail network and building new commuter lines, but they run in freeway medians due to poor planning). Moreover, we see cities that are interested in transit build up high-rise CBDs in their centers and high- and mid-rise residential development near outlying train stations.
“Regional rail and TOD” is not a perfect formula; it elides a lot of details and a lot of historical factors that are hard to replicate. But both regional rail and TOD have been major elements in the construction of transit cities over the last 60 years, and while they both have exceptions, they don’t have many exceptions. In the other direction, I don’t know of examples of failed TOD – that is, of auto-oriented cities that aggressively built TOD on top of new or existing rail lines but didn’t manage to grow their transit ridership. I do know some examples of failed regional rail, but usually they make glaring mistakes in design standards, especially frequency but also station siting and fare integration.
At a closer in level of zoom, it’s worthwhile to talk about the unique features of each transit city. But when looking at the big picture, it’s better to talk about what all transit cities of a particular size class have in common that auto-oriented cities don’t. Only this way can an auto-oriented city figure out what it absolutely must do if it wants to have better public transit and what are just tools in its kit for achieving that goal.
Reverse-Branching Does not Save You the Transfer
I wrote a detailed proposal about why New York should deinterline, and how. I got a lot of supportive comments (in the transit blogging sense, i.e. nitpicking), but also some pushback, arguing that people like their one-seat rides, and making them transfer under a more coherent system would make their riding experience worse. I could go on about how London is facing the same problem and is choosing to invest a lot of money into deinterlining in order to increase train capacity, but in the case of New York, there’s a blunter answer: what one-seat ride? The extent of reverse-branching on the subway does not really give people one-seat rides, and New York City Transit is making service decisions that do not maximize one-seat rides even when doing so would be relatively painless.
Outer branches
Most outer branches with just one route naturally offer direct service to the route’s trunk line. Let’s look at the current subway_map, and compare it with my proposed deinterlining, which is again this:

Today, riders on the West End Line only have service on the D, so they only have a one-seat ride to Sixth Avenue. Riders on the Sea Beach Line only have the N, and riders on the local Brighton Line trains only have the Q, so they only have one-seat rides to the Broadway express trains, and if they want to travel to Prince Street or 8th Street-NYU on the R they have to change trains at Canal, which is not a cross-platform transfer. Only a handful of stations get genuine choice between the two trunk lines: 36th Street on the D and N, and the inner few express stops on the B and Q, say up to Newkirk Avenue. These are express stops, with more ridership than the locals, but they’re not the majority of ridership on the subway in Southern Brooklyn. The majority of riders have to deal with the drawbacks of both reverse-branching (slow, infrequent trains) and coherent service (fewer one-seat rides).
Queens Boulevard has the same situation: local and express patterns mix up in a way that makes the choice of one-seat rides much weaker than it appears on the map. Riders at the local stations can choose between the M and the R, two trains that are never more than a few blocks apart in Midtown; only one station on either line is inconvenient to access from the other, 57th Street/7th Avenue, the least busy stop on the Broadway Line in Midtown on a passengers per platform basis (49th and 5th have less ridership but have two platform tracks and no Q service). The express stops get more serious choice, between the E and F, but those are just three stations: Jackson Heights-Roosevelt Avenue, Forest Hills-71st Avenue, and Kew Gardens-Union Turnpike. Queens Plaza has E, M, and R service, but passengers actually getting on at Queens Plaza can equally get on at Queensboro Plaza and ride the N, W, or 7.
Genuine choice between two relatively widely-separated trunk lines on the same trunk only exists in two and a half places in New York: the Central Park West Line offers a choice between the B and C trains, the Nostrand Avenue Line offers a choice between the 2 and 5 trains, and the inner half of the White Plains Line offers a choice between the 2 and 5 trains off-peak (at the peak the 5 runs express, so local stations only get the 2).
Cross-platform transfers
New York is blessed with cross-platform interchanges, usually between local and express trains on the same line. Riders on the 1 train are used to transferring to the 2 and 3 trains cross-platform at 96th Street; in the morning, the 1 train’s busiest point is actually from 103th Street to 96th, and not heading into Midtown. With 170,000 boardings at its stations north of 96th per weekday, the 1 is much busier than Nostrand (with 60,000 weekday boardings) or the combined total of local Central Park West stations from 72nd to 116th (with 65,000 boardings). It’s also slightly busier than the White Plains Road Line, let alone the inner segment with both 2 and 5 service (which has 95,000 boardings).
In Queens, a similar situation occurs on the 7. The stations east of Queensboro Plaza, excluding 74th Street-Broadway (where the transfer to the Queens Boulevard Line is), have a total of 215,000 weekday boardings. The trains fill at the outer end and then discharge at 74th Street as most passengers transfer, not cross-platform, to the faster Queens Boulevard Line; then they fill again at the stations to the west and discharge at Queensboro Plaza, which has a cross-platform transfer to the N and W.
This is relevant to some of the few segments of the subway where reverse-branching offers choice between different trunk lines. Passengers on the Nostrand Avenue Line could transfer cross-platform at Franklin Avenue, where the platforms aren’t much narrower than at 96th Street and Broadway, where passenger volumes are almost three times as high. Similarly, passengers on the Central Park West Line and its branches to Washington Heights and Grand Concourse could transfer cross-platform at 125th Street or at Columbus Circle; Columbus Circle is extremely busy already with origin-and-destination traffic, and the interchanges between local and express passengers could not possibly overwhelm it.
Only one place has a difficult connection: 149th Street-Grand Concourse, the interchange between the 2, 4, and 5 trains. This also happens to be the most difficult deinterlining project in general, because of the merger of the 2 and 3 further south; it requires either closing the northernmost two stations on the 3, or opening up a few blocks of Lenox Avenue to construct a pocket track. Because of the disruption involved, this project can be left for last, and come equipped with more passageways at 149th Street, just as London is first deinterlining the Northern line to the south (raising peak capacity on the Bank branch from 26 trains per hour to 32) and leaving the north for later (which would raise capacity further to 36 tph).
NYCT has deinterlined in the past
Upper Manhattan witnessed two deinterlinings in the second half of the 20th century, one in the 1950s and another in the 1990s. The service NYCT inherited from its three predecessor networks had systematic route nomenclature taking into account conventional and reverse branching.
On the IRT, West Side trains were numbered 1 (to Van Cortlandt Park), 2 (to the White Plains Road Line), and 3 (to Harlem-148th Street), and Lexington trains were numbered 4 (to the Jerome Avenue Line), 5 (to the White Plains Road Line), and 6 (to the Pelham Line); 2, 4, and 5 trains ran express, 3 and 6 trains ran local, and 1 trains could be either local or express. In the 1950s, NYCT changed this system on the West Side so that all 1 trains became local and all 3 trains became express. This was the result of track layout: the junction at 96th Street is flat if 3 trains have to cross over to the local tracks and 1 trains have to cross over to the express tracks, but under today’s present service pattern there are no at-grade conflicts. NYCT chose capacity and reliability over offering one-seat rides from West Harlem and Washington Heights to the express tracks.
On the IND, trains were identified by letters. A, C, and E trains ran on Eighth Avenue and B, D, and F trains on Sixth Avenue; A and B trains went to Washington Heights, C and D trains to Grand Concourse, and E and F trains to the Queens Boulevard Line. Local and express trains were identified using letter doubling: a single letter denoted an express train, a doubled one (e.g. AA) a local. The single vs. double letter system ended up discontinued as few trains consistently run express (just the A and D) and several run a combination of local and express (the B, E, F, N, and Q), and NYCT slowly consolidated the trains on Eighth and Sixth Avenue until there were only seven services between them. Eventually the B and C switched northern terminals, so that now the C runs as the local version of the A and the B as something like the local version of the D. Passengers in Washington Heights who wish to use Sixth Avenue Line have to transfer.
The situation on the IND wasn’t as clean as the deinterlining on the IRT. But it shows two important things. First, changes in train service have made the original reverse-branching less tenable from an operational perspective. And second, the value of a one-seat ride from Washington Heights or Central Harlem to local tracks is limited, since everyone takes the express train and transfers at Columbus Circle.

