Circumferential Lines and Express Service
In a number of large cities with both radial and circumferential urban rail service, there is a curious observation: there is express service on the radial lines, but not the circumferential ones. These cities include New York, Paris, and Berlin, and to some extent London and Seoul. Understanding why this is the case is useful in general: it highlights guidelines for urban public transport design that have implications even outside the distinction between radial and circumferential service. In brief, circumferential lines are used for shorter trips than radial lines, and in large cities connect many different spokes so that an express trip would either skip important stations or not save much time.
The situation
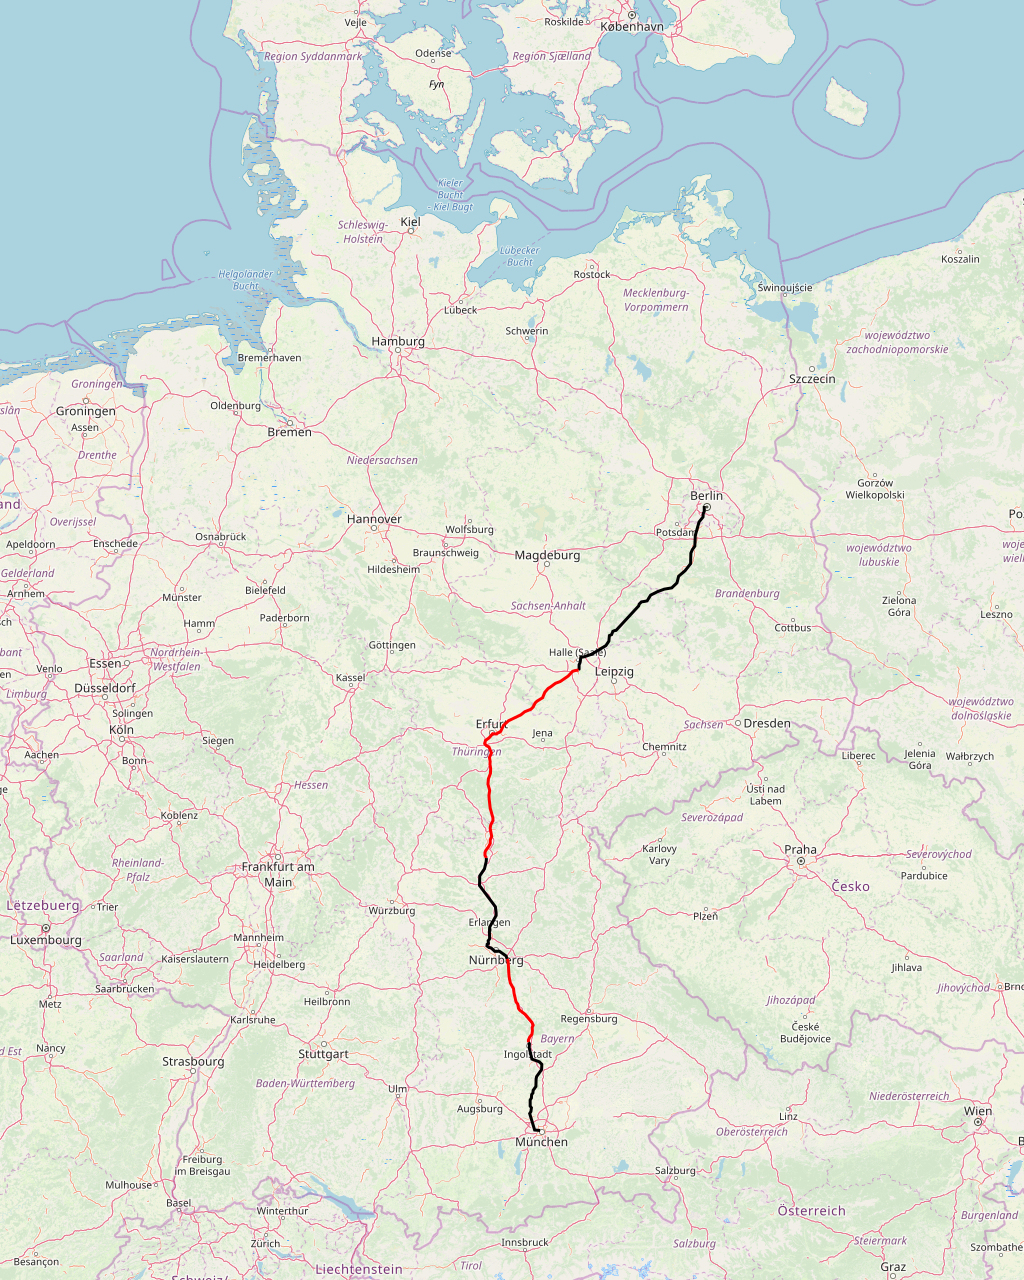
Berlin has three S-Bahn trunk lines: the Ringbahn, the east-west Stadtbahn, and the North-South Tunnel. The first two have four tracks. The last is a two-track tunnel, but has recently been supplemented with a parallel four-track North-South Main Line tunnel, used by regional and intercity trains.
The Stadtbahn has a straightforward local-express arrangement: the S-Bahn uses the local tracks at very high frequency, whereas the express tracks host less frequent regional trains making about half as many stops as well as a few intercity trains only making two stops. The north-south system likewise features very frequent local trains on the S-Bahn, and a combination of somewhat less frequent regional trains making a few stops on the main line and many intercity trains making fewer stops. In contrast, the Ringbahn has no systemic express service: the S-Bahn includes trains running on the entire Ring frequently as well as trains running along segments of it stopping at every station on the way, but the only express services are regional trains that only serve small slivers on their way somewhere else and only come once or twice an hour.
This arrangement is mirrored in other cities. In Paris, the entire Metro network except Line 14 is very local, with the shortest interstations and lowest average speeds among major world metro systems. For faster service, there is Line 14 as well as the RER system, tying the suburbs together with the city. Those lines are exclusively radial. The busiest single RER line, the RER A, was from the start designed as an express line parallel to Line 1, the Metro’s busiest, and the second busiest, the RER B, is to a large extent an express version of the Metro’s second busiest line, Line 4. However, there is no RER version of the next busiest local lines, the ring formed by Lines 2 and 6. For non-Metro circumferential service, the region went down the speed/cost tradeoff and built tramways, which have been a total success and have high ridership even though they’re slow.
In New York, the subway was built with four-track main lines from the start to enable express service. Five four-track lines run north-south in Manhattan, providing local and express service. Outside the Manhattan core, they branch and recombine into a number of three- and four-track lines in Brooklyn, Queens, and the Bronx. Not every radial line in New York has express service, but most do. In contrast, the circumferential Crosstown Line, carrying the G train, is entirely local.
In Seoul, most lines have no express service. However, Lines 1, 3, and 4 interline with longer-range commuter rail services, and Lines 1 and 4 have express trains on the commuter rail segments. They are all radial; the circumferential Line 2 has no express trains.
Finally, in London, the Underground has few express segments (all radial), but in addition to the Underground the city has or will soon have express commuter lines, including Thameslink and Crossrail. There are no plans for express service parallel to the Overground.
Is Tokyo really an exception?
Tokyo has express trains on many lines. On the JR East network, there are lines with four or six tracks all the way to Central Tokyo, with local and express service. The private railroads usually have local and express services on their own lines, which feed into the local Tokyo subway. But not all express services go through the primary city center: the Ikebukuro-Shibuya corridor has the four-track JR Yamanote Line, with both local services (called the Yamanote Line too, running as a ring to Tokyo Station) and express services (called the Saikyo or Shonan-Shinjuku Line, continuing north and south of the city); Tokyo Metro’s Fukutoshin Line, serving the same corridor, has a timed passing segment for express trains as well.
However, in three ways, the area around Ikebukuro, Shinjuku, and Shibuya behaves as a secondary city center rather than a circumferential corridor. The job density around all three stations is very high, for one. They have extensive retail as well, as the private railroads that terminated there before they interlined with the subway developed the areas to encourage more people to use their trains. This situation is also true of some secondary clusters elsewhere in Tokyo, like Tobu’s Asakusa terminal, but Asakusa is in a historically working-class area, whereas the Yamanote area was historically and still is wealthier, making it easier for it to attract corporate jobs.
Second, from the perspective of the transportation network, they are central enough that railroads that have the option to serve them do so, even at the expense of service to Central Tokyo. When the Fukutoshin Line opened, Tokyu shifted one of its two mainlines, the Toyoko Line, to connect to it and serve this secondary center, where it previously interlined with the Hibiya Line to Central Tokyo; Tokyu serves Central Tokyo via its other line, the Den-en-Toshi Line, which connects to the Hanzomon Line of the subway. JR East, too, prioritizes serving Shinjuku from the northern and southern suburbs: the Shonan-Shinjuku Line is a reverse-branch of core commuter rail lines both north and south, as direct fast service from the suburbs to Shibuya, Shinjuku, and Ikebukuro is important enough to JR East that it will sacrifice some reliability and capacity to Tokyo Station for it.
Third, as we will discuss below, the Yamanote Line has a special feature missing from circumferential corridors in Berlin and Paris: it has distinguished stations. A foreigner looking at satellite photos of land use and at a map of the region’s rail network without the stations labeled would have an easy time deciding where an express train on the line should stop: Ikebukuro, Shinjuku, and Shibuya eclipse other stations along the line, like Yoyogi and Takadanobaba. Moreover, since these three centers were established to some extent before the subway was built, the subway lines were routed to serve them; there are 11 subway lines coming from the east as well as the east-west Chuo Line, and of these, all but the Tozai and Chiyoda Lines intersect it at one of the three main stations.
Interstations and trip length
The optimal stop spacing depends on how long passenger trips are on the line: keeping all else equal, it is proportional to the square root of the average unlinked trip. The best formula is somewhat more delicate: widening the stop spacing encourages people to take longer trips as they become faster with fewer intermediate stops and discourages people from taking shorter ones as they become slower with longer walk distances to the station. However, to a first-order approximation, the square root rule remains valid.
The relevance is that not all lines have the same average trip length. Longer lines have longer trips than short lines. Moreover, circular lines have shorter average trips than straight lines of the same length, because people have no reason to ride the entire way. The Ringbahn is a 37-kilometer line on which trains take an hour to complete the circuit. But nobody has a reason to ride more than half the circle – they can just as well ride the shorter way in the other direction. Nor do passengers really have a reason to ride over exactly half the circle, because they can often take the Stadtbahn, North-South Tunnel, or U-Bahn and be at their destinations faster.
Circumferential lines are frequently used to connect to radial lines if the radial-radial connection in city center is inconvenient – maybe it’s missing entirely, maybe it’s congested, maybe it involves too much walking between platforms, maybe happens to be on the far side of city center. In all such cases, people are more likely to use the circumferential line for shorter trips than for longer ones: the more acute the angle, the more direct and thus more valuable the circle is for travel.
The relevance of this discussion to express service is that there’s more demand for express service in situations with longer optimum stop spacing. For example, the optimum stop spacing for the subway in New York based on current travel patterns is the same as that proposed for Second Avenue Subway, to within measurement error of parameters like walking speed; on the other trunk lines, the local trains have denser stop spacing and the express trains have wider stop spacing. On a line with very short optimum spacing, there is not much of a case for express service at all.
Distinguished stops versus isotropy
The formula for optimal stop spacing depends on the isotropy of travel demand. If origins and destinations are distributed uniformly along the line, then the optimal stop spacing is minimized: passengers are equally likely to live and work right on top of a station, which eliminates walk time, as they are to live and work exactly in the middle between two stations, which maximizes walk time. If the densities of origins and destinations are spiky around distinguished nodes, then the optimal stop spacing widens, because planners can place stations at key locations to minimize the number of passengers who have to walk longer. If origins are assumed to be perfectly isotropic but destinations are assumed to be perfectly clustered at such distinguished locations as city center, the optimum stop spacing is larger than if both are perfectly isotropic by a factor of 
Circumferential lines in large cities do not have isotropic demand. However, they have a great many distinguished stops, one at every intersection with a radial rail service. Out of 27 Ringbahn stops, 21 have a connection to the U-Bahn, a tramway, or a radial S-Bahn line. Express service would be pointless – the money would be better spent increasing local frequency, as ridership on short-hop trips like the Ringbahn’s is especially sensitive to wait time.
On the M2/M6 ring in Paris, there are 49 stops, of which 21 have connections to other Metro lines or the RER, one more doesn’t but really should (Rome, with a missed connection to an M14 extension), and one may connect to a future extension of M10. Express service is not completely pointless parallel to M2/M6, but still not too valuable. Even farther out, where the Paris region is building the M15 ring of Grand Paris Express, there are 35 stops in 69 kilometers of the main ring, practically all connecting to a radial line or located at a dense suburban city center.
The situation in New York is dicier, because the G train does have a distinguished stop location between Long Island City and Downtown Brooklyn, namely the connection to the L train at Bedford Avenue. However, the average trip length remains very short – the G misses so many transfers at both ends that end-to-end riders mostly stay on the radials and go through Manhattan, so the main use case is taking it a few stops to the connection to the L or to the Long Island City end.
Conclusion
A large urban rail network should be predominantly radial, with circumferential lines in dense areas providing additional connectivity between inner neighborhoods and decongesting the central transfer points. However, that the radial and circumferential lines are depicted together on the same metro or regional rail map does not mean that people use them in the same way. City center lies ideally on all radials but not on the circumferentials, so the tidal wave of morning commuters going from far away to the center is relevant only to the radials.
This difference between radials and circumferentials is not just about service planning, but also about infrastructure planning. Passengers make longer trips on radial lines, and disproportionately travel to one of not many distinguished central locations; this encourages longer stop spacing, which may include express service in the largest cities. On circumferential lines, they make shorter trips to one of many different connection points; this encourages shorter stop spacing and no express service, but rather higher local frequency whenever possible.
Different countries build rapid transit in radically different ways, and yet big cities in a number of different countries have converged on the same pattern: express service on the strongest radial corridors, local-only service on circumferential ones no matter how busy they are. There is a reason. Transportation planners in poorer cities that are just starting to build their rapid transit networks as well in mature cities that are adding to their existing service should take heed and design infrastructure accordingly.

