Rapid Transit in Low-Density Boomtowns
Most of my thinking about public transit comes from large, dense cities, especially New York. In those cities, transit ridership is not a problem; only cost is. When such cities have decent cost control, they can build massive expansion programs, as Paris is. But most of the developed world is not New York, Paris, London, Tokyo, or other transit cities. A large and (thanks to differential national population growth rates) growing share of the developed world lives in fast-growing, low-density city regions with no public transit to speak of, such as the American Sunbelt and its counterparts in Canada and Australia.
I’ve had to intellectually grapple with public transit in two American Sunbelt cities in which current transit usage is a rounding error and the built form is wholly auto-oriented: Orlando (which I was asked about by a Twitter mutual) and Nashville (which just voted against a flawed light rail plan by an overwhelming margin). In those areas, there is no chance for any public transit, provided the urban form stays as it is – but fortunately such cities can leverage their high growth rates to change their urban form, as Calgary did in the 1980s and 90s.
Density versus growth
A few months ago I made this chart:
![]()
The density and growth demand axes are not meant to come from a single quantitative metric; density is a subjective mix of residential and job density, whereas growth demand refers to either population growth or the demand for more housing as expressed by price signal. In San Francisco, most likely the richest metro area in the world, density is middling, and growth demand is higher than even in New York and London; in the American Rust Belt, density is fairly low and there is also little demand for more; in some cities on the margin of the first world there is little demand for more growth but high preexisting density. It goes without saying that it’s easier to build new rapid transit lines on the upper right corner than on the lower left one.
The situation of the American Sunbelt, most of which goes in the bubble of Texas and Georgia, is difficult. Residential density is extremely low, so the ridership base near potential rail lines is low. Moreover, streets are usually designed exclusively around auto use, so passengers are unlikely to walk a kilometer to the train station the way they routinely do in transit cities. At the destination end, things aren’t much better – American cities have high-rise CBDs, but few jobs locate there or in surrounding dense neighborhoods.
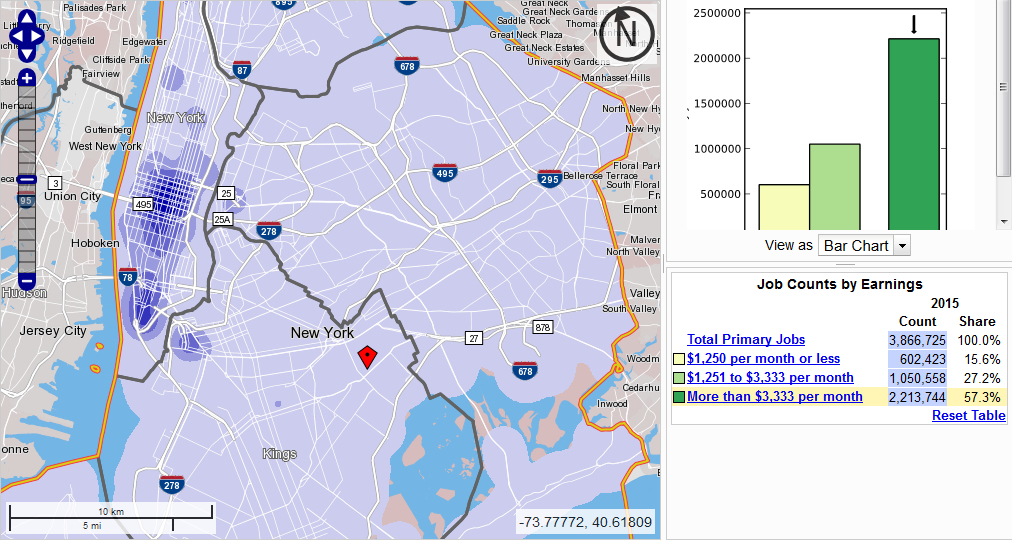
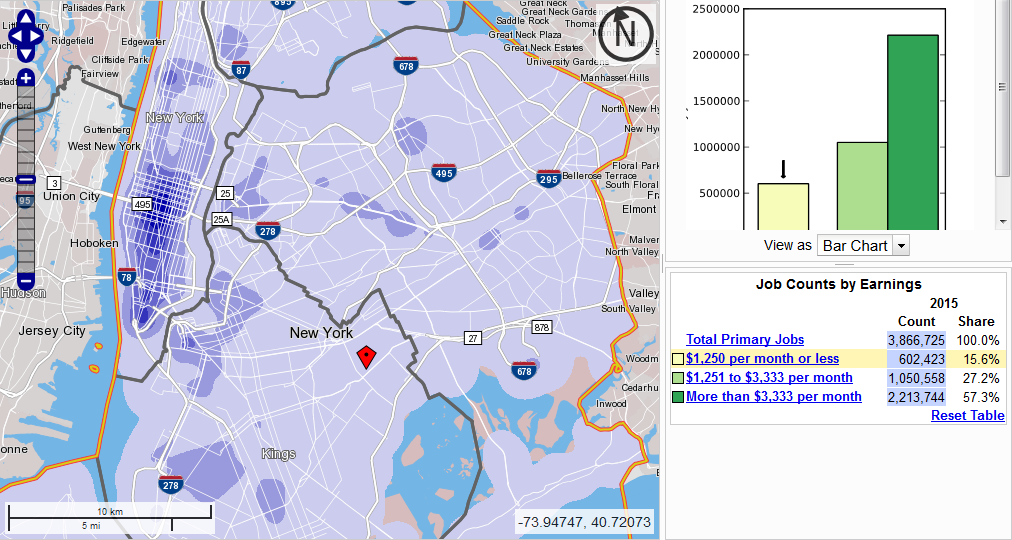
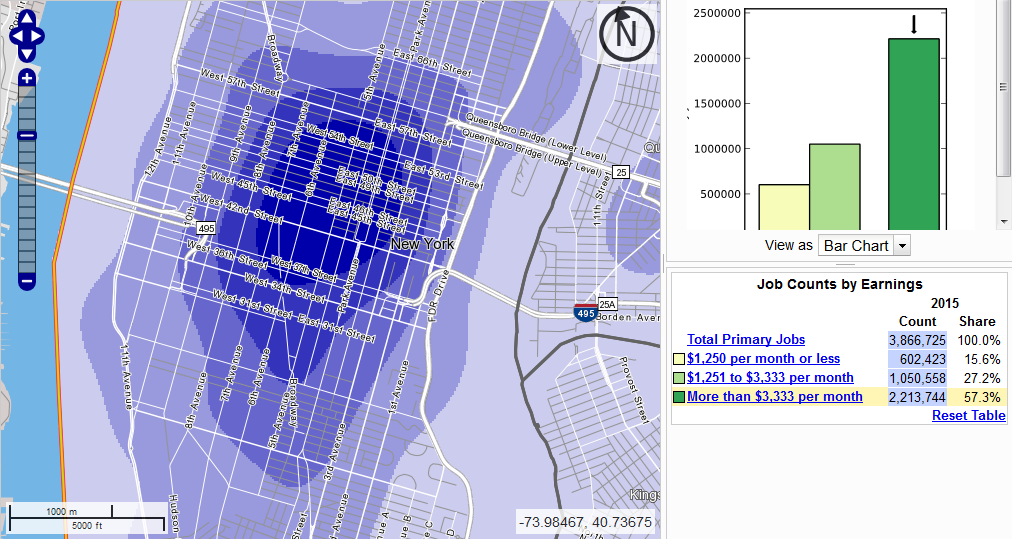
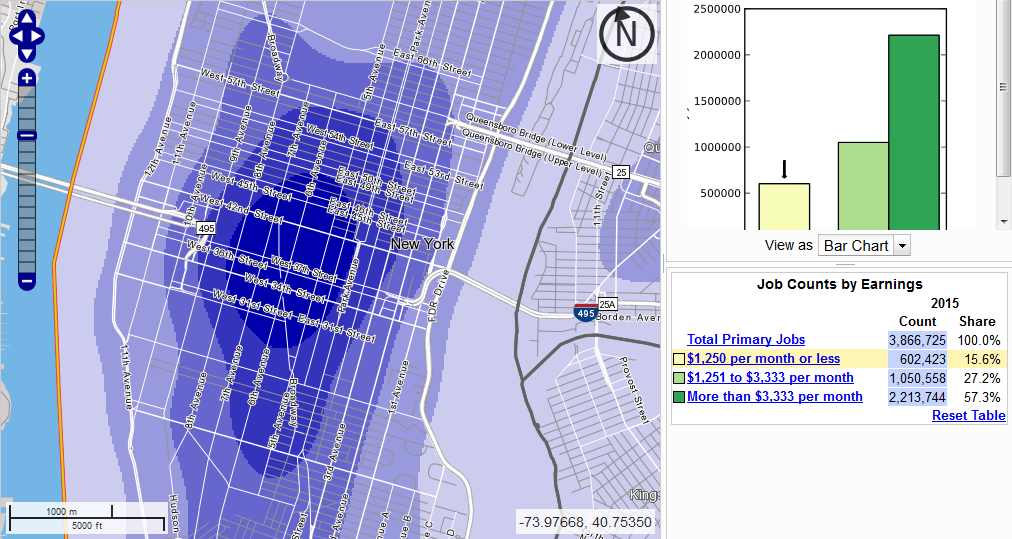
The Orlando CBD has about 80,000 jobs, in a metro area of 2.5 million people. Disney World adds another 37,000, but is not surrounded by any serviceable residential neighborhoods, and has to be at the end of any reasonable transit service coming from the CBD. Nashville, a metro area of nearly 2 million, has a CBD with 36,000 jobs. The medical center to the southwest adds another 33,000, and this time it could plausibly lie on a rail trunk, but most of the useful urban arterials converge on the CBD and not on the medical center. In contrast, Washington, with 5.5 million people, has 280,000 people working at the CBD (from the Green and Yellow Lines to just beyond Dupont Circle and Foggy Bottom), 77,000 in the Rosslyn-Ballston corridor, and 33,000 in Crystal City and at National Airport and the Pentagon. Both the percentages and the absolute numbers (including job density) count: there is a great mass of people who would be interested in taking rail to Washington CBD jobs but not to Orlando or Nashville CBD jobs.
Can regional rail work?
No.
High-growth areas are likely to have been small a few decades ago. For the most part the metro areas in question were too small in the heyday of rail transportation to have inherited a large legacy rail network. Even the ones that did, including Atlanta and Perth, have less legacy rail than older cities of comparable size – compare Atlanta with Philadelphia, or Perth with Brisbane. And most North American boomtowns are not Atlanta. Miami has two north-south mainlines and a handful of east-west connections, none at the right place for commuter rail. Orlando has a north-south trunk with a branch to the north, and Nashville a few branches, but they’re surrounded by industrial land use and not by the sort of suburbs that developed around commuter rail in the Northeast.
A commuter rail-based network can still work, but only with extensive greenfield lines. Disney World is not on any legacy rail line, because it developed long after rail stopped being a relevant mode of transportation outside large urban areas. But even then, gaps in coverage are unavoidable, as the dense neighborhoods of such cities did not develop around legacy rail.
Can transit-oriented development work?
Sort of.
The big question about TOD is, who is it for? In Nashville specifically, the far left opposed the light rail plan, essentially because it would cannibalize funding that could go to public housing. Now, public housing could be used to beef up density along rail corridors. Stockholm built public housing simultaneously with the subway, placing housing projects on top of rail branches, and as a result has per capita ridership today that’s not much lower than the level of Paris, Berlin, or Munich.
The problem is that public housing is horrendously expensive. A house in low-cost American cities costs around $150,000, but apartments cost more, so $200,000 per household is more likely even with some economies about size. Most of this cost is impossible to recover through rent – if low-income households made enough money to pay market rent in nice apartments, they’d just rent these apartments on the open market. The American Sunbelt does not lack for developable suburban land.
Market-rate housing is much easier to construct – for one, developers make a profit on it, and so are eager to put up their own money. The problem is that in cities like Nashville and Orlando, the middle class has close to 100% car ownership, and a large majority of households have one car per adult. The real estate industry is not going to spontaneously build housing with less parking or pedestrian-oriented retail.
In San Diego, developers build more parking than the minimum at University Avenue and 30th Street, according to Duncan McFetridge of the Cleveland National Forest Foundation. University is a bus corridor and not a light rail corridor, but the bus frequency there isn’t terrible, and the area is pretty walkable for a low-density city. In Los Angeles, I’ve read analysis that blames the region’s falling transit ridership on gentrification, explaining that in gentrifying inner neighborhoods like Boyle Heights, the middle class drives whereas the working class takes transit. It’s not like here or in New York, where recent gentrifiers rarely own cars.
How did Calgary make it work?
Calgary is a metro area of somewhat more than a million people. Its economy is based on oil, and when oil prices were higher earlier this decade its average income was comparable to that of San Francisco; its politics is thoroughly conservative, which means there is no progressive impetus for walkability or green transit. Nonetheless, it built light rail lines that get about 100 million annual riders today. Its transit mode share is 16%, higher than that of any American metro area except New York (or, in the most restrictive definition, San Francisco). This is with no residential TOD to speak of: the vast majority of housing in Calgary is single-family and low-density, and from what I’ve seen there’s almost no dense residential development near the stations.
The big thing Calgary did was develop its CBD to be high-rise. In the early 1980s Calgary was a small, monocentric city, and since then it’s grown more monocentric, developing downtown parking lots as high-rise buildings. When I visited it had a more prominent high-rise downtown than Providence, a bigger and older metro area, and walking between the high-rises was reasonably pleasant.
In low-density cities with demand for more growth, the best opportunity appears to be centralizing jobs in the CBD. The straightforward application involves developing parking lots, as in Calgary, and relying on the private market to do the rest of the job. In both Nashville and Orlando, there are also more proactive approaches, specific to their urban layouts. In Nashville, the high job density at the medical center calls for developing a continuous corridor from the CBD, about 3 km long. This corridor could plausibly get an east-west subway, in contrast with the north-south subway in the rejected light rail plan. In Orlando, the Disney World cluster calls for some residential upzoning and sprawl repair around that area, which would strengthen the case for building a rail line between that area and the CBD.
Growing cities can use their growth to support more auto-oriented development (as the big American cities did in the postwar era) or to support more public transit. This is understood in cities that already have a transit-oriented core, but it’s equally true in cities that don’t really have any public transit, like the entire American Sunbelt. Calgary, starting with very low population, managed to build a decent if not great public transit network centered on its light rail system, and the same should be doable in American cities of comparable size and age.