Category: New York
Off-Peak Public Transport Usage
Earlier this year, I slowly stumbled across something that I don’t think is well-known in comparative public transportation: European cities have much higher public transport ridership than someone experienced with American patterns would guess from their modal splits. From another direction, Europe has much lower mode share than one would guess from ridership. The key here is that the mode share I’m comparing is for work trips, and overall ridership includes all trip purposes. This strongly suggests that non-work public transportation usage is much higher in European than in American cities even when the usage level for work trips is comparable. Moreover, the reason ought to be better off-peak service in Europe, rather than other factors like land use or culture, since the comparison holds for New York and not only for truly auto-oriented American cities.
Modal shares and ridership levels
My previous post brings up statistics for work trip mode share in England and France. For the purposes of this post, I am going to ignore England and focus on France and wherever I can find data out of Germany and Austria; the reason is that in the secondary cities of England, public transport is dominated by buses, which are hard to find any ridership data for, let alone data that doesn’t have severe double-counting artifacts for transfer passengers. For the same reason, I am not going to look at Canada – too many transfer artifacts.
In contrast, French and German-speaking metro areas with rail-dominated public transport make it relatively convenient to count rail trips per capita, as do the more rail-oriented American metro areas, namely Boston, New York, and Washington. A secondary check involving both bus and rail can be obtained from The Transport Politic, comparing the US with France.
| City | Population | Definition | Trips/year | Trips/person | Mode share |
| Boston | 4,900,000 | Subway, commuter rail | 204,000,000 | 42 | 12% |
| New York | 20,000,000 | Subway, PATH, LIRR, MN, NJT Rail | 2,050,000,000 | 103 | 31% |
| Washington | 6,200,000 | Metro, MARC (daily*280), VRE (daily*250) | 245,000,000 | 40 | 12% |
| Vienna | 3,700,000 | U-Bahn, trams, S-Bahn (PDF-p. 44) | 822,000,000 | 222 | 40% |
| Berlin | 5,000,000 | U-Bahn, trams, S-Bahn | 1,238,000,000 | 248 | 35% |
| Hamburg | 3,100,000 | U-Bahn, S-Bahn | 531,000,000 | 171 | 26% |
| Stuttgart | 2,400,000 | Stadtbahn, S-Bahn, Regionalbahn | 223,000,000 | 93 | 26% |
| Lyon | 2,300,000 | Métro, trams, funiculars, 0.5*TER | 325,000,000 | 141 | 20% |
| Marseille | 1,800,000 | Métro, trams (daily*280), 0.5*TER | 139,000,000 | 77 | 16% |
| Toulouse | 1,300,000 | Métro, trams | 125,700,000 | 97 | 13% |
| Bordeaux | 1,200,000 | Light rail | 105,500,000 | 88 | 13% |
| Lille | 1,200,000 | Métro, trams | 108,500,000 | 90 | 17% |
Note that New York, with a 31% mode share, has not much more rail ridership per capita than French metro areas with mode shares in the teens, and is a quarter below Lyon, whose mode share is only 20%. This is not an artifact of transfers: just as the subway dominates ridership in New York, so does the metro dominate Lyon, Toulouse, and Lille, and so does the tram dominate Bordeaux. If anything, it’s Stuttgart, the only European city on this list with comparable ridership per unit of mode share to the US, that should have the most overcounting due to transfers.
Also note that French rail ridership nosedives in the summer, when people go on their 5-week vacations, and I presume that this equally happens in Germany and Austria. The ratio of annual to weekday ridership in France where it is available is fairly low, not because weekend ridership is weak, but because the weekday chosen to represent daily ridership is never in the summer vacation season.
Why?
Off-peak public transportation in the United States is quite bad. In New York, 10-minute frequency on most lettered routes is the norm. In Washington, the off-peak frequency is 12 minutes. In Boston, it varies by line; on the Red Line each branch is supposed to come every 12-13 minutes off-peak, but in practice trains don’t run reliably and often leave the terminal bunched, alternating between 3- and 10-minute gaps.
Moreover, commuter trains are so useless except for peak-hour commutes to city center that they might as well not exist. Hourly gaps and even worse are routine, and even the busiest New York commuter lines have at best half-hourly off-peak frequency. These lines are only about 15% of rail ridership in New York and Boston and 6% of rail ridership in Washington, but they contribute a decent volume of commuters who drive for all non-work purposes.
In Berlin, the off-peak frequency on the U-Bahn is a train every 5 minutes most of the day on weekdays. On Sundays it drops to a train every 8 minutes, and in the evening it drops to a train every 10 minutes far too early, leading to overcrowding on the first train after the cut in frequency around 9 pm. The S-Bahn trunks run frequently all day, but the branches in the suburbs only get 10-minute frequency, and the Ring has a 2-hour midday period with 10-minute gaps. The suburban areas with only S-Bahn service get comparable service to neighborhoods on New York subway branches, while closer-in areas get better service. No wonder people use it for more than just work – the train is useful for shopping and socializing at all hours of the day.
Why?
The people who manage public transportation in the United States do not have the same profile as most riders. They work traditional hours, that is 9 to 5 on weekdays only, at an office located in city center. Many senior managers do not use their own system. That NYCT President Andy Byford does not own a car or know how to drive and takes the subway and buses to events is unusual for such a senior person, and early media reports noted that some managers looked askance at his not driving.
Growing segments of the American middle class commute by public transportation. In Boston and Washington, transit commuters slightly outearn solo drivers, and in New York they do not but it is close. But those segments have different travel behavior from public-sector planners. For example, lawyers work long hours and depend on the subway at 8 or 9 pm, and programmers work shifted hours and both show up to and leave work hours after the traditional times. But public transportation agencies still work 9 to 5, and thus the middle-class transit-using behavior they are most familiar with is that of the denizen of the segregated suburb, who drives to all destinations but city center.
In such an environment, off-peak service is treated as a luxury. When there is a deficit, agencies cut there first, leading to frequency-ridership spirals in which lower frequency deters riders, justifying further cuts in service until little is left. In New York, there are guidelines for frequency that explicitly state it is to be adjusted based on ridership at the most crowded point of the route, without regard for whether cuts depress ridership further. There is a minimum acceptable frequency in New York, but it is set at 10 minutes on weekdays and 12 on weekends. For a similar reason, the planners tend to split buses between local and limited routes if each can support 10-12 minute headways, at which point the buses are not useful for short trips.
In contrast, in Germany and France, there is a mixture of drivers and public transportation users among managers. German planning stresses consistent schedules throughout the day, so the midday off-peak often gets the same frequency as the peak. French planning does vary frequency, but maintains a higher base frequency even late into the night. The Paris Métro runs every 5 to 7 minutes at 11 pm. The idea of running a big city metro line every 12 minutes is unthinkable.
The Brooklyn Bus Redesign is Out!
Marron just published my and Eric Goldwyn’s Brooklyn bus redesign proposal (with many thanks to Juliet Eldred for doing the graphics and design). The substance isn’t really changed from what we discussed last year. The delay in publication has had a few causes, of which I believe the biggest is that I completely missed that the links to many of the references in the lit review were dead and thus could not be typeset.
Instead of retyping an old blog post, I want to emphasize a few things that have come up in the last year. Some are specific to New York, others more general within the US. The idea of a bus redesign, introduced to the American discourse by Jarrett at the beginning of this decade, has gotten steadily more popular, and New York is beginning its own process, starting with the Bronx; in that context, it’s worthwhile pointing out specifics that Eric and I have learned from the Brooklyn process.
The redesign is a process, not a one-and-done program
Cities change. The point of a bus redesign is to let the bus network reflect the city of today and not that of when bus routes were set, typically when the streetcars were removed in the postwar era. The upshot is that the city can expect to change in the future, which means further bus redesigns may be necessary.
Instead of letting bus networks drift away from serving the city as is and doing a big redesign once in a generation, cities should change buses on an ongoing basis. American transit agencies are learning the principles of bus redesign this decade. They can and should use these principles for forward planning, tweaking bus routes as needed. Any of the following changes can trigger small changes in bus service:
- New development
- Shifts in commuting patterns even without new development
- Changes in traffic patterns
- Changes in the urban rail network
- Long-term changes in driver labor, maintenance, etc.
- Changes in bus technology, such as ride quality, dispatching, or pollution levels
In New York, the biggest ongoing change is probably the urban rail network. There are no subway extensions planned for Brooklyn, but there is expansion of subway accessibility, which changes the optimal bus network since some buses, like the B25 and B63, have no reason to exist if the subway lines they parallel are made accessible. There has been extensive activism about priorities here. To its credit, the MTA is accelerating accessibility retrofits, even though construction costs are extremely high.
New York’s current redesign process is flawed
Eric and I have heard negative feedback from various people involved in the process. Some are planners. One is a community activist, enough of a railfan and busfan not to NIMBY changes for the sake of NIMBYism, but nonetheless disaffected with how the Bronx redesign went.
As far as I can tell, the problem with the current process is that it’s too timid. In the Bronx, this timidity is understandable. The borough’s bus network is mostly good enough. The most important change in the Bronx is to speed up the buses through off-board fare collection, stop consolidation, bus lanes on main streets, and conditional signal priority, and plug the extra speed into higher frequency.
The MTA treats it as part of a separate process – select bus service (“SBS”) – and even though planning these two aspects separately is workable, the MTA does not understand that they are related and that speedups provide crucial resources for higher frequency. The problem here is with operating cost estimation. Like the other American agencies where I’ve asked, the MTA assumes bus costs scale with service-km, and thus higher speeds don’t change frequency. In reality, bus costs, dominated by driver wages, scale with service-hours. Higher speeds can be plugged one-to-one into higher frequency. In Brooklyn, only 30% of the benefits we estimate come from changing the network, and the other 70% come from speeding up the buses.
But Brooklyn is not the Bronx. The Bronx is largely good enough, in ways Brooklyn isn’t. Brooklyn is not terrible, but the bus network has too many circuitous or duplicative routes. Eric and I have consolidated about 530 km of bus route down to 350, without any of the coverage vs. ridership tradeoffs common to areas with less isotropic population density than Brooklyn. The MTA needs to be bolder in Brooklyn, and even bolder than that in Queens, if the redesign is to succeed.
The 14th Street bus lane
Eric and I encountered some political resistance to the idea of mass installation of bus lanes. Local interests listen to people with local connections, who are usually drivers. Transit riders are disproportionately riding to city center jobs, and have citywide rather than local political identities. When I went to an Open New York meeting, people began with a round of introductions in which people say their names and where they live, and the about 20 attendees represented maybe 15 different city neighborhoods. The upshot is that like Open New York’s mission of building more housing, the mission of diverting scarce street space from drivers to bus riders is best done on a citywide rather than street-by-street basis.
There is some hope of such a transformation happening. The bus lane on 14th Street survived a nuisance lawsuit, and ridership rose 17% almost immediately after it opened. The success is stark enough that a citywide increase in installation is plausible. City council speaker Corey Johnson promised to install 48 km of bus lane per year were he to be elected mayor, which is too passive but could do some good on the busiest routes.
I’m Giving a Talk About Construction Costs Tomorrow
By popular demand, I’m giving the talk I gave 2 weeks ago at NYU, again. The database will be revised slightly to include more examples (like Ukraine, which I added between when I gave the talk and when I blogged about it), and I may switch around a few things, but it should be similar to what I already said.
Where? Halyards in Brooklyn at 3rd Avenue and 6th Street, near the 4th Avenue/9th Street subway stop where the F/G and R intersect.
When? Monday December 2nd at 9 pm, for an hour.
Do I need to RSVP? No.
Will there be food? To some extent – the bar has minimal selection, although what it does have on the menu seems better for the price than most American bar food (which, to be fair, is like saying “better public transportation than Los Angeles”).
What Does Private Affluence, Public Squalor Mean?
I’d like to compare three cities: Paris, New York, Boston. They’re about equally wealthy, and I’ve lived years in two and spent a lot of time in the third. Americans dismiss New York and Boston too often as Not Real America, but they’re both excellent examples of how the US differs from Europe.
Private affluence and squalor at home
Visit the home of a middle-class person in the city. (I mean “middle-class” in the European sense of “reasonably educated professional,” not the American one of “not homeless.”) If you’re used to a certain suburban American standard of normality then the New York apartment will look small to you, but the one in Boston will not, and a few years seeing how Europeans live will disabuse you of any notion that New York apartments are small.
Parisian apartments are tiny. I had 40 square meters near Nation, but the citywide average is 31 per person; in New York, it’s 50 if I understand the Census Factfinder correctly. There are studios in Paris well below 20 m^2 – even Stockholm tends to stick to micro-units in the 20-25 m^2 area. There is something called studettes going down to 9 m^2 in the most extreme cases, many inherited from servant attic units built in the Second Empire and Belle Epoque. In New York it’s more or less prohibited by regulation, with the attendant high rents, but the regulations are about bedrooms, not unit size, hence the common experience of living 3 or 4 people to a large apartment, one that in Continental Europe is largely restricted to lower-income cities like Lisbon or Berlin.
In the 1950s, when John Galbraith coined the expression private affluence and public squalor, the American home had amenities unheard of in Europe, like universal ownership of appliances. This is not as stark a distinction today. Europeans have televisions and fast Internet connections for cheaper prices than in the US. But Europeans don’t have driers or air conditioning and don’t have dishwashers as commonly as Americans. I don’t want to exaggerate the difference in housing quality – for one, insulation is a lot better in Paris (and Berlin) than in New York and Boston, so the experience of living on the 3rd floor facing a city street is a lot noisier west of the Pond than east of it. For another difference, American air conditioning is window units in all but the highest-end apartments, which would have central air in Europe too. But the difference exists, and is noticeable.
Public affluence and squalor on the street
Let’s leave the inside of our houses now. How does the public sphere look?
The recent reporting of New York as trash city can make people think that this is literally about the street. To some extent, this is – but it’s not just about trash. For one, the street lighting is better in Paris, and better in Manhattan than in Cambridge, in what I think is an artifact of high density and not just wealth. For two, I don’t remember having to dodge puddles in the rain in Paris; in New York and Boston it’s a common occurrence whenever there’s heavier rain than a drizzle. For three, in the snow, Cambridge becomes mostly impassable to pedestrians, and while Paris does not get serious enough snow for shoveling to ever be a big issue, Stockholm does and the sidewalks in Central Stockholm are shoveled just fine.
The importance of Paris’s wealth and density is that Berlin is not this nice. The street lighting in Berlin is not great by Parisian standards (or, as I recall, by Stockholm ones?). Walking around Bernauer Strasse (let alone Neukölln, one of inner Berlin’s poorest neighborhoods), one never gets the feeling the area is as well-off as Nation, which is itself lower middle-class by Parisian standards. I’m saying this knowing the comparative income levels of Berlin and Paris, and perhaps it’s unfair, but from what I’ve seen, it’s fairly easy to compare France and Germany, their relative levels of public and private affluence are similar.
Public services
Most Americans know, on some level, that various public services are better in Western Europe. Life expectancy in France is higher than in the US by 3-4.5 years depending on source, and life expectancy in Germany is higher by 2-3 years. New York and Massachusetts are wealthy states and outlive the rest of the country by a margin, but they’re still not French, let alone Parisian.
Public health is there in various statistics, but the same is true of transportation. This is not even just public transportation – my recollection of the handful of times I’ve found myself in a taxi in Paris is that it’s a much more pleasant experience than the potholed American streets I’ve taken taxis or ridden with other people on. But it’s much more glaring in public transit than on roads, because public transit inherently requires more public competence. Parisians do not think the RER is particularly good, but it’s a marvel compared with any American commuter rail network, and involves a level of interagency coordination in fares, schedules, and services that is unheard of in the United States.
Worse, public transit in the United States has the reputation of a social service. In metro New York the incomes of transit and car commuters are very close, and in metro Boston transit commuters slightly outearn car commuters, but in both areas, anything that is not a segregated suburban middle-class commuter line is treated as a social service, run by managers who do not use their own system and do not consider use cases beyond their own 9-to-5 work travel.
Squalor and incompetence
Squalor and incompetence feed each other. This does not mean poverty is a moral failing or a result of weakness or stupidity. But it does mean that someone who is denied access to good work will, over a lifetime, learn to do lower-value things and, even if the job denial at 18 was entirely random or a matter of discrimination, be worse at high-value jobs by 50. I don’t think it’s a coincidence that countries with more income mobility and less persistent poverty – for examples, Canada, Australia, and the Nordic countries – do not determine people’s careers by how they did at 18 at the university admissions the way the US, UK, and France do. Talented Canadians who get worse grades in high school because of obstructive teachers will have opportunities to shine at 23 that their French or American counterparts, denied the ability to go to the most prestigious universities, will simply not get.
I bring this up because the US has a cycle of public squalor. Public-sector wages are uncompetitive, so workers are either nerds with particular personal or social interest in the field (sanitation, public transit, etc.), or people who couldn’t get better private-sector work – and this is particularly acute at the management level, especially senior management, since the best managers can leak to the private sector and get better pay there. Weak civil service in turns reduces the political will to pay civil servants high salaries, especially among politicians, who encounter senior managers much more often than they do hard-working train drivers, sanitation workers, and individual teachers.
There’s perhaps an analog of private affluence and public squalor, in which Americans are individually diligent and collectively lazy. Some of this has to be political: ambitious politicians get ahead by doing nothing and packaging it as bravery. I can name multiple national Republicans who became nationally famous by saying no to spending, and not a single Democrat who became nationally famous by successfully pushing through a major government program, such statewide universal health care or a green transition. But it’s not just politicians and their political appointees – there’s punch-clock behavior and agency turf battles below that level.
Is there a solution?
Unambiguously, yes. It’s not evident from just reading about the history of the Anglosphere, since Britain took forever to develop its civil service and thus assumes the process would be equally long in South Korea or Finland (“first 500 years are hardest“). It requires political will, and often a good model – I suspect Finland was able to develop good government so quickly because it consciously imitated Swedish governance. It doesn’t even require setting everything on fire first – South Korea and Taiwan engaged in land reform but did not kill the entire middle class the way some communist countries did.
The good news is that most public-sector workers in the US are not incompetent political appointees. The people I talk to in New York and Boston are sharp and informed and often difficult to keep up with because of how much they understand that I don’t, and for the most part I get the impression that they don’t think their colleagues are morons. The competence level on average decreases as one goes upward, partly because of negative selection of management, but it’s possible and desirable to internally promote people and raise wages to retain talent.
Fundamentally, the US needs to let go of the idea that the public is inferior to the private. But this isn’t just about what’s in Americans’ heads. They need to treat the public commons well, and I don’t just mean building monuments that look nice now and will rust in 10 years. I mean investing in public services, and paying the people who provide them competitively. Public squalor is a choice the US makes every day that it can stop making.
Fare Evasion
There’s a moralistic discourse in the United States about fare evasion on public transport that makes it about every issue other than public transport or fares. It’s a proxy for lawlessness, for police racism, for public safety, for poverty. In lieu of treating it as a big intra-urban culture war, I am going to talk about best practices from the perspective of limiting revenue loss to a minimum.
This is an issue where my main methodology for making recommendations for Americans – looking at peer developed countries – is especially useful. The reason is that Americans practically never look at other countries on hot-button culture war issues, even less than (say) the lip service the center-left pays to foreign universal health care systems. Americans who support immigration liberalization practically never listen when I try bringing up the liberal work visa, asylum, and naturalization policies of Germany or Sweden. Knowing stuff about the rest of the world is a type of competence, and competence is not a factor in a culture war. The upshot is that successful policies regarding fare collection in (for example) Germany are obscure in the United States even more than policies regarding wonkier transportation issues like train frequency.
The current situation in New York
In the summer, Governor Cuomo announced a new initiative to hire 500 cops to patrol the subway. The justification for this scheme has varied depending on who was asking, but the primary goal appears to be to defeat fare evasion. Per Cuomo’s office, fare evasion costs $240 million a year on the subway and buses, about 5% of total revenue. The MTA has also mentioned a higher figure, $300 million; I do not know if the higher figure includes just urban transit or also commuter rail, where conductors routinely miss inspections, giving people free rides.
But New York fare evasion is mostly a bus problem: the rate on buses is 22%. On the subway the rate is only 4%, and there is somewhat more revenue loss on buses than on subways. This, in turn, is because bus fares are enforced by drivers, who for years have complained that fare disputes lead to assaults on them and proposed off-board fare collection as an alternative. On many buses, drivers just let it go and let passengers board without paying, especially if nearly all passengers are connecting from the subway and therefore have already paid, as on the B1 between the Brighton Beach subway station and Kingsborough Community College or on the buses to LaGuardia.
So realistically the subway fare evasion level is closer to $110 million a year. The total cost of the new patrol program is $56 million in the first year, escalating by 8% annually thanks to a pre-agreed pay hike scale. Whereas today the program is a net revenue generator if it halves subway fare evasion, a level that already seems strained, within ten years, assuming normal fare escalation, it will need to cut fare evasion by about 90%, which is a complete fantasy. A sizable proportion of riders who do not pay would just stop riding altogether, for one. The governor is proposing to spend more on fare enforcement than the MTA can ever hope to extract.
The American moral panic about fare evasion regrettably goes far beyond New York. Two years ago, BART announced that it would supplement its fare barriers with proof-of-payment inspections, done by armed cops, and lied to the public about the prevalence of such a belts-and-suspenders system. More recently, it trialed a new turnstile design that would hit passengers in the face, but thankfully scrapped it after public outcry. Boston, too, has its moral panic about fare evasion, in the form of campaigns like the Keolis Ring of Steel on commuter rail or Fare is Fair.
There is another way
In talking to Americans about fare evasion, I have found that they are generally receptive to the idea of minimizing revenue loss net of collection costs. However, what I’ve encountered more resistance about is the idea that people should just be able to walk onto a bus or train.
In the urban German-speaking world, everyone with a valid fare can walk onto a bus, tram, or train without crossing fare barriers or having to pay a driver. This system has been copied to American light rail networks, but implementation on buses and subways lags (except on San Francisco buses). In New York, the SBS system uses proof of payment (POP), but passengers still have to validate fares at bus stops, even if they already have paid, for example if they have a valid monthly pass.
In the vast majority of cities, no excuse exists to have any kind of overt fare control. Tear down these faregates. They are hostile to passengers with disabilities, they cost money to maintain, they constrain passenger flow at busy times, and they don’t really save money – evidently, New York’s subway fare evasion rate is within the range of Berlin, Munich, and Zurich. Fare enforcement should be done with POP alone, by unarmed civilian inspectors, as in Berlin. Some people will learn to dodge the inspectors, as is the case in Berlin, and that’s fine; the point is not to get fare evasion to 0%, but to the minimum level net of enforcement costs.
New York itself may have an excuse to keep the faregates: its trains are very crowded, so peak-hour inspections may not be feasible. The question boils down to how New York crowding levels compare with those on the busiest urban POP line, the Munich S-Bahn trunk. But no other American city has that excuse. Tear down these faregates.
What’s more, the fare inspection should be a low-key affair. The fine in Berlin is €60. In Paris on the RER I can’t tell – I believe it’s three figures of which the first is a 1. Inspectors who can’t make a citation without using physical violence should not work as inspectors.
Make it easy to follow the law
The most important maxim when addressing a low-level crime is to make it easy to follow the law. Mistakes happen; I’ve accidentally fare-dodged in Berlin twice, only realizing the error at the end of the trip. This is much more like parking violations or routine mistakes in tax filing.
The turnstile acts as a reminder to everyone to pay their fare, since it’s not possible to fare-dodge without actively jumping it. (I did turnstile-jump in Paris once, with a valid transfer ticket that the turnstile rejected, I think because Paris’s turnstile and magnetic ticket technology is antediluvian.) However, turnstiles are not necessary for this. A better method is to ensure most passengers have prepaid already, by offering generous monthly discounts. My fare dodges in Berlin happened once before I got monthlies and once on my way to the airport on my current trip, in a month when I didn’t get a monthly since I was only in Berlin 6 days.
New York does poorly on the metric of encouraging monthlies. Passengers need to swipe 46 times in a 30-day period to justify getting a monthly pass rather than a pay-per-ride. This is bad practice, especially for passengers who prefer to refill at a ticketing machine rather than at home or on their phone with an app, since it means passengers visit the ticketing machines more often, requiring the agency to buy more to avoid long lines. In Berlin, the breakeven point is 36 trips. In Zurich, it’s 20 trips; ZVV does whatever it can to discourage people from buying single tickets. In both cities, there are further discounts for annual tickets.
Unfortunately, the problem of indifference to monthlies on urban rail is common around the Anglosphere. Singapore has no season passes at all. In Vancouver, Cubic lobbying and a New Right campaign about fare evasion forced TransLink to install faregates on SkyTrain, and when the faregate project had predictable cost overruns, the campaigners took that as evidence the agency shouldn’t get further funding. London’s fare capping system is weekly rather than monthly – there are no monthly passes, and all fares are set at very high levels. Britain generally overuses faregates, for example on the commuter trains in London. London generally gives off an impression of treating everyone who is not a Daily Mail manager as a criminal. Paris is better, but not by much. The German-speaking world, as irrational as Britain and France about urban crime rates that are far lower than they were a generation ago, still treats the train and bus rider as a law-abiding customer unless proven otherwise.
Social fares
American transit agencies and activists resist calls for large monthly discounts, on a variety of excuses. The most common excuse is revenue loss, which is weird since realistically New York would transition to a large discount through holding the monthly fare constant and hiking the single-ride fare. It’s the second most common excuse that I wish to deal with here: social fares, namely the fact that many low-income riders don’t have the savings to prepay for an entire month.
On social fares, as on many other socioeconomic issues, it is useful for Americans to see how things work in countries with high income compression and low inequality under the aegis of center-left governments. In Paris, various classes of low-income riders, such as the unemployed, benefit from a solidarity fare discount of 50-75%. In both Paris and Stockholm, the monthly pass is flat regionwide, an intentional program of subsidizing regular riders in the suburbs, which are on average poorer than the city.
The flat fare is not really applicable to American cities, except possibly the Bay Area on BART. However, the large fare reductions to qualifying low-income riders are: a number of cities have used the same definition, namely Medicaid eligibility, and give steep discounts for bikeshare systems. On the same principle, cities and states can discount fares on buses and trains.
The right way to view fares
Fares are an important component of public transport revenue; the taxes required to eliminate fares are significant enough that there are probably better uses for the money. By the same token, the issue of fare evasion should be viewed from the lens of revenue loss, rather than that of crime and disorder. The transit agency is not an individual who is broken by being mugged of $100; it should think in terms of its own finances, not in terms of deterrence.
Nor is making it easier to follow the law going to encourage more crime – to the contrary. Transit agencies should aim at a fare system, including enforcement, that allows passengers to get on and off trains quickly, with minimum friction. Turnstiles do not belong in any city smaller than about 10 million people. The fare structure should then encourage long-term season passes, including annual passes, so that nearly all residents who take public transport have already paid. Random inspections with moderate fines are the layer of enforcement, but the point is to make enforcement largely unneeded.
And tear down the faregates.
When Reliability Matters Above All Else
This post is about situations in which the most important thing for transportation is reliability, more so than average speed or convenience. It’s inspired by two observations, separated by a number of years: one is my own about flying into or out of Boston, the other is from a New York Times article from yesterday describing a working-class subway rider’s experience.
My observation is that over the years, I’ve used Logan Airport a number of times, sometimes choosing to connect via public transportation, which always involves a bus as the airport is not on the rail network, and other times via taxi or pickup. My choice was always influenced by idiosyncratic factors – for example, which Boston subway line my destination is on, or whether I was visiting someone with a car and free time. However, over the last eight years, a consistent trend is that I am much more likely to use the bus arriving at the airport to the city than departing. I know my own reasoning for this: the bus between South Station and the airport is less reliable than a cab, so when in a crunch, I would take a train to South Station (often from Providence) and then hail a taxi to the airport.
The New York Times article is about a work commute, leading with the following story:
Maribel Burgos barely has time to change into her uniform before she has to clock in at the McDonald’s in Lower Manhattan where she works, even though she gives herself 90 minutes to commute from her home in East Harlem.
It does not take 90 minutes to get between East Harlem and Lower Manhattan on the subway. The subway takes around half an hour between 125th Street and Bowling Green, and passengers getting on at one of the local stations farther south can expect only a few minutes longer to commute with a cross-platform change at Grand Central. Taking walking and waiting time into account, the worst case is around an hour – on average. But the subway is not particularly reliable, and people who work somewhere where being five minutes late is a firing offense have to take generous margins of error.
When is reliability the most important?
What examples can we think of in which being late even by a little bit is unacceptable? Let us list some, starting with the two motivating examples above:
- Trips to the airport
- Work trips for highly regimented shift work
- Trips to school or to an external exam
- Work trips for safety-critical work such as surgery
- Trips to an intercity train station
In some of these cases, typically when the riders are of presumed higher social class, the system itself encourages flexibility by arranging matters so that a short delay is not catastrophic. At the airport, this involves recommendations for very early arrival, which seasoned travelers know how to ignore. At external exams, there are prior instructions of how to fill in test forms, de facto creating a margin of tolerance; schools generally do not do this and do mark down students who show up late. Doctors as far as I understand have shifts that do not begin immediately with a life-critical surgery.
But with that aside, we can come up with the following commonalities to these kinds of trips:
- They are trips to a destination, not back home from it
- They are trips to a fairly centralized and often relatively transit-oriented destination, such as a big workplace, with the exception of regimented shift work for retail (the original NY Times example), which pays so little nobody can afford to drive
- They are disproportionately not peak trips, either because they are not work trips at all, or because they are work trips for work that is explicitly not 9-to-5 office work
- They are disproportionately not CBD-bound trips
The first point means that it’s easy to miss this effect in mode choice, because people can definitely split choice between taxis and transit or between different transit modes, but usually not between cars and transit. The second means that driving is itself often unreliable, except for people who cannot afford to drive. The third means that these trips occur at a point in time in which frequency may not be very high, and the fourth means that these trips usually require transfers.
What does reliability mean?
Reliability overall means having low variance in door-to-door trip time. But for the purposes of this discussion, I want to stress again that trips to destinations that require unusual punctuality are likely to occur outside rush hour. Alas, “outside rush hour” does not mean low traffic, because midday and evening traffic in big cities is still quite bad – to take one New York example with shared lanes, the B35 steadily slows down in the first half of the day even after the morning peak is over and only speeds up to the 6 am timetable past 7 pm. Thus, there are twin problems: frequency, and traffic.
Traffic means the vagaries of surface traffic. Buses are generally inappropriate for travel that requires any measure of reliability, or else passengers have to use a large cushion. Everything about the mixed traffic bus is unreliable, from surface traffic to wait times, and bunching is endemic. Dedicated lanes improve things, but not by enough, and unreliable frequency remains a problem even on mostly segregated buses like the Silver Line to the airport in Boston.
Frequency is the harsher problem. The worker commuting from Harlem to Lower Manhattan is if anything lucky to have a straight-short one-seat ride on the 4 and 5 trains; most people who need to be on time or else are not traveling to city center and thus have to transfer. The value of an untimed transfer increases with frequency, and if every leg of the trip has routine 10-minute waits due to bunching or just low off-peak frequency guidelines, the trip gets intolerable, fast.
What’s the solution?
Bus redesigns are a big topic in the US right now, often pushed by Jarrett Walker; the latest news from Indianapolis is a resounding success, boasting 30% increase in ridership as a result of a redesign as well as other changes, including a rapid bus line. However, they only affect the issue of reliability on the margins, because they are not about reliability, but about making base frequency slightly better. New York is replete with buses and trains that run every 10-15 minutes all day, but with transfers, this is not enough. Remember that people who absolutely cannot be late need to assume they will just miss every vehicle on the trip, and maybe even wait a few minutes longer than the maximum advertised headway because of bunching.
Thus, improving reliability means a wider toolkit, including all of the following features:
- No shared lanes in busy areas, ever – keep the mixed traffic to low-traffic extremities of the city, like Manhattan Beach.
- Traffic signals should be designed to minimize bus travel time variance through conditional signal priority, focusing on speeding up buses that are running slow; in combination with the above point, the idea of giving a late bus with 40 passengers the same priority at an intersection as a single-occupant car should go the way of the dodo and divine rights of kings.
- Off-peak frequency on buses and trains needs to be in the 5-8 minute range at worst.
- Cross-platform transfers on the subway need to be timed at key transfer points, as Berlin manages routinely at Mehringdamm when it’s late and trains run every 10 minutes (not so much when they run every 5); in New York it should be a priority to deinterline and schedule a 4-way timed pulse at 53rd/7th.
- Branch scheduling should be designed around regular gaps, rather than crowding guidelines – variation between 100% and 130% of seats occupied is less important to the worker who will be fired if late than variation between waiting 4 and waiting 8 minutes for a train.
- Suburban transit should run on regular clockface schedules every 30, 20, or 15 minutes, with all transfers timed, including with fare-integrated commuter trains.
New York City Zoning and Subway Capacity
I got a bunch of accolades and a bunch of flaming replies over a tweetstorm imagining a bigger, better New York. Some people complained about my claim that subway trains in Brooklyn are underfull; I urge everyone to read my analysis of data from 2016 – it’s still relevant today, as the only big change is that Second Avenue Subway has reduced Upper East Side crowding. The point of this post is to demonstrate where zoning should definitely focus on adding more apartments, to fill trains that are not yet full.
The map
Instead of using the current subway map, let us start with a deinterlined map:

The reason for using this map is that it’s cleaner than the real map, since there is no track-sharing between routes of different colors, and not much route-sharing (one color local, one express). Getting from here to this map is cheap but not free, as it requires certain junction rebuilds, especially on the 2/3. I ask that my commenters resist the temptation to argue over the details of this map, since the point about zoned capacity does not really depend on questions like whether the E runs local in Queens and the F runs express or the reverse.
Where there is capacity
In 2016, three directions on the subway were truly at capacity, surpassing 4 standees per square meter: the 2/3 and 4/5 coming into Midtown from Uptown, and the L. The analysis looks at crowding on trains entering the Manhattan core, so it lumps lines from Queens based on which tunnel they enter from, which underestimates crowding on the E, since it shares tracks with the under-capacity M. Counted properly, the express Queens Boulevard trains should be viewed as near or at capacity as well, the F having 3.33 standees per square meter and the E having somewhat more.
Additional lines with capacity crunches, with about 3 standees per square meter or more, include the A/D coming in from Uptown, the 6, and the Astoria Line (then the N/Q, now the N/W). The 1 and 7 trains have capacity crunches as well in outlying areas: the 7 is overcrowded until it hits the transfer points to the E/F and N/W but has plenty of space in Long Island City, and the 1 is fairly crowded north of the junction with the express trains and then unloads passengers onto the overcrowded 2/3. These areas should not be deemed to have much spare capacity until such time as operations on the subway improve, permitting higher frequency and eventually more lines.
In contrast, the remaining lines have space, often plenty of space. Everything in Brooklyn except the L and to some extent the J/M/Z is underfull: these trains have high frequency as determined by crowding guidelines at the Uptown or Queens end, but in Brooklyn there are fewer people today so the ridership is weaker. The local lines on the Upper West Side both have plenty of space on the trains as well as space on the tracks for more trains if need be. The 7 downstream of Queensboro Plaza has plenty of space, and the local Queens Boulevard trains downstream of Jackson Heights have nowhere for passengers to transfer to an overcrowded express service.
Since I’m relying on data from 2016, there’s no accounting for Second Avenue Subway. Even then, the 4/5 was only the third most overcrowded trunk line entering the Manhattan core, and it’s likely that there’s additional capacity coming from the new line. There’s certainly space on the tracks for more trains on Second Avenue, and one of the goals of deinterlining specifically is to make it feasible to run more service on this line, which currently only runs a train every 6-8 minutes at rush hour.
The map of where New York could add housing
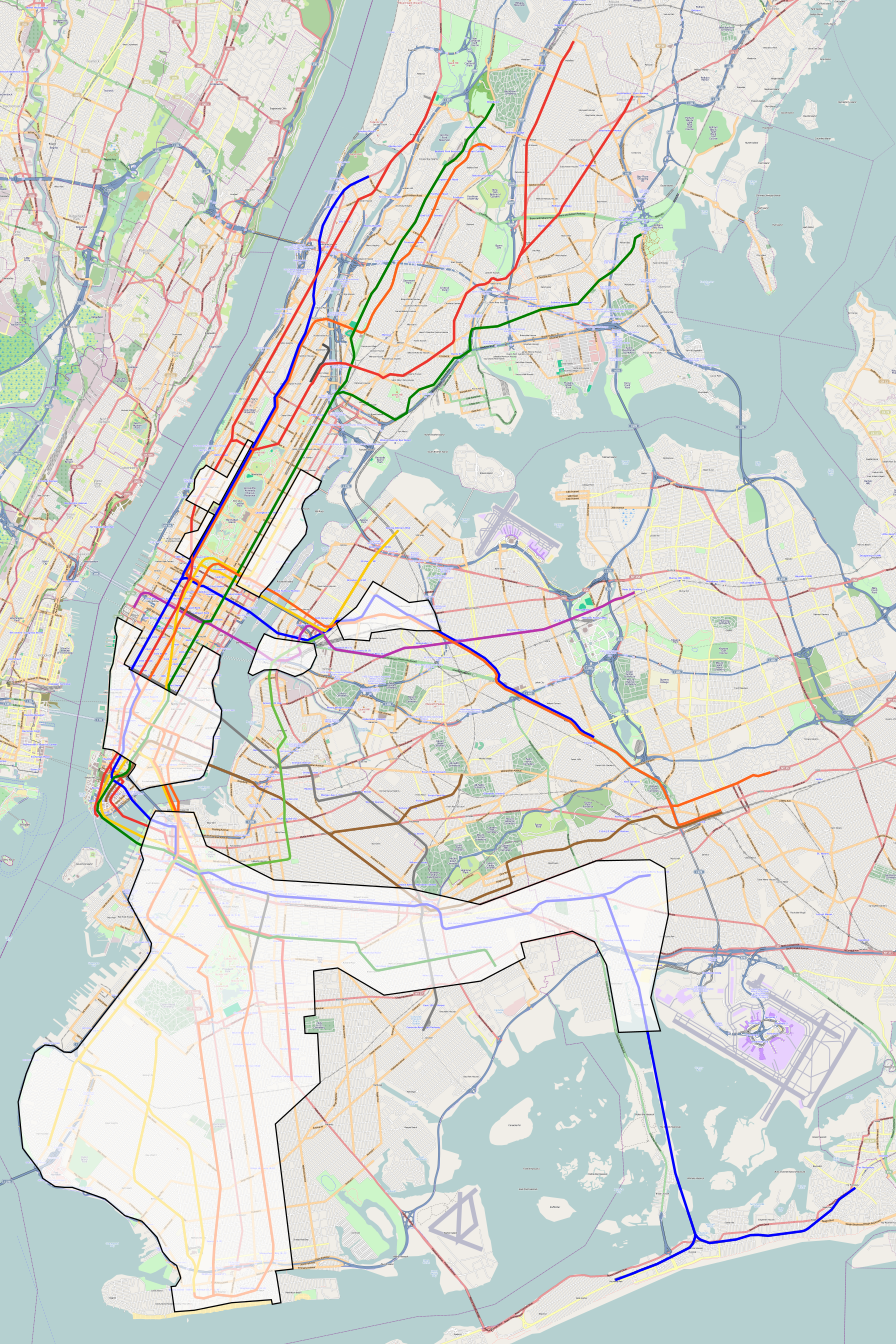
The map excludes parts of Lower and Midtown Manhattan where the highest and best use is commercial rather than residential. But the boundaries there are deliberately crude: Downtown Brooklyn, NYU, and the Meatpacking District are drawn, to avoid excessive fragmentation of the drawn area, while Chelsea and Hell’s Kitchen are excluded as too close to Midtown.
The map also does not look at considerations other than capacity. Some of the highlit areas on the Upper East and West Sides and Lower East Side are already built to very high density, at least on the avenues and major streets; these areas should be the template of how the rest of the city should look. At the other end, East New York has too weak demand for massive construction, especially if everything to its west is upzoned.
However, large swaths of desirable, close-in areas with relatively short buildings are highlit. Rich inner Brooklyn neighborhoods like Park Slope and South Brooklyn are currently built to missing middle density, with a floor area ratio of about 1.5 away from corner lots. A more appropriate floor area ratio in these neighborhoods is 12, corresponding to tapering buildings in the 20-30 story range, as on the avenues on the Upper East and West Sides. Park Slope is half an hour from Midtown by subway, and less than that from Lower Manhattan. The population of these neighborhoods is perhaps 150,000, and should be more than a million given their proximity to job centers.
Subway deserts and future additions
The map is designed to work with more or less the same service as today, maybe with slightly more frequency on lines that could handle it easily (that is, Second Avenue Subway). But what about future service? The L train is overcrowded, but only runs 19 trains per hour at the peak due to electrical limitations, and could go up to 26 with better electrical capacity, or for that matter lighter trains drawing less power during acceleration. Further extensions of Second Avenue Subway could more effectively relieve pressure off the 4/5, to the point of creating more capacity in the Bronx, which remains well below peak population. Commuter rail modernization opens up large swaths of Queens. Decades in the making extensions on Nostrand and Utica fill in the transit desert in southeast Brooklyn, currently served by buses that nominally come every 2 minutes and in practice comes in platoons of 4 every 8 minutes.
As with the map above, a hypothetical map of development sites assuming reasonable subway expansion includes areas that would be unlikely to actually see new development. Williamsburg and Greenpoint may turn into forests of towers given the opportunity, but in neighborhoods like Sheepshead Bay and East Flatbush developers might well stick to the occasional 6-to-10-story mid-rise building that would not look out of place in Paris. In Eastern Queens, the desired density is probably spiky, with clusters of tall buildings around LIRR stations surrounded by single-family houses and missing middle, much like the structure of density in Toronto and Vancouver.
How Fast New York Regional Rail Could Be Part 3
In the third and last installment of my series posting sample commuter rail schedules for New York (part 1, part 2), let’s look at trains in New Jersey. This is going to be a longer post, covering six different lines, namely all New Jersey Transit lines that can go to Penn Station, including one that currently does not (Raritan Valley) but could using dual-mode locomotives.
As on Metro-North and the LIRR, very large improvements can be made over current schedules, generally reducing trip times by 30-43%, without straightening a single curve. However, electrification is required, as is entirely new rolling stock, as the electric locomotives used by NJ Transit are ill-fit for a fast schedule with many stops. Moreover, all low platforms must be raised to provide level boarding and some must be lengthened to avoid overuse of selective door opening, which may require a few new grade separations on the North Jersey Coast Line. As a first-order estimate, 50-something trainsets are required, each with 8-12 cars. This is not quite free, but the cost is low single-digit billions: about $1.5 billion for trains, maybe $400 million for 160 km of electrification, and around $700 million for what I believe is 70 low- or short-platform stations.
The timetables
Here is a spreadsheet detailing speed zones for all New Jersey Transit lines passing through Newark. In support of previous posts, here are other similar spreadsheets:
- New Haven Line (express schedule, add stop penalties as appropriate for locals) – the spreadsheet is about a minute too fast, missing some slowdowns in the terminal, and the version in my post (part 1) corrects for that
- Harlem Line
- Hudson Line locals and expresses
- LIRR Main Line (including Port Jefferson, not covered in my posts)
Line by line schedules
The New Jersey Transit timetables are less consistent than the east-of-Hudson ones; I attempted to look at local midday off-peak outbound trains whenever possible.
Northeast Corridor
| Station | Current time | Future time |
| New York | 0:00 | 0:00 |
| Secaucus | 0:09 | 0:06 |
| Newark Penn | 0:18 | 0:10 |
| Newark South Street | — | 0:12 |
| Newark Airport | 0:24 | 0:15 |
| North Elizabeth | 0:27 | 0:17 |
| Elizabeth | 0:30 | 0:19 |
| Linden | 0:35 | 0:23 |
| Rahway | 0:39 | 0:25 |
| Metropark | 0:45 | 0:29 |
| Metuchen | 0:49 | 0:32 |
| Edison | 0:54 | 0:36 |
| New Brunswick | 0:59 | 0:39 |
| Jersey Avenue | 1:03 | 0:41 |
| Monmouth Junction | — | 0:47 |
| Princeton Junction | 1:16 | 0:53 |
| Hamilton | 1:23 | 0:58 |
| Trenton | 1:35 | 1:01 |
This fastest rush hour express trains do the trip in 1:12-1:13, and Amtrak’s Regionals range between 0:55 and 1:04, with trains making all nominal Amtrak stops (including rarely-served New Brunswick and Princeton Junction) taking 1:15.
North Jersey Coast Line
| Station | Current time | Future time |
| New York | 0:00 | 0:00 |
| Secaucus | 0:09 | 0:06 |
| Newark Penn | 0:19 | 0:10 |
| Newark South Street | — | 0:12 |
| Newark Airport | 0:24 | 0:15 |
| North Elizabeth | — | 0:17 |
| Elizabeth | 0:29 | 0:19 |
| Linden | 0:35 | 0:23 |
| Rahway | 0:39 | 0:25 |
| Avenel | 0:45 | 0:29 |
| Woodbridge | 0:48 | 0:31 |
| Perth Amboy | 0:55 | 0:34 |
| South Amboy | 1:00 | 0:37 |
| Aberdeen | 1:08 | 0:42 |
| Hazlet | 1:12 | 0:45 |
| Middletown | 1:19 | 0:49 |
| Red Bank | 1:25 | 0:53 |
| Little Silver | 1:29 | 0:56 |
| Monmouth Park | — | 0:59 |
| Long Branch | 1:39-1:42 | 1:01 |
| Elberon | 1:46 | 1:04 |
| Allenhurst | 1:50 | 1:07 |
| Asbury Park | 1:54 | 1:09 |
| Bradley Beach | 1:57 | 1:11 |
| Belmar | 2:01 | 1:14 |
| Spring Lake | 2:05 | 1:16 |
| Manasquan | 2:09 | 1:19 |
| Point Pleasant Beach | 2:15 | 1:22 |
| Bay Head | 2:24 | 1:23 |
In electric territory, that is up to Long Branch, my schedule cuts 38% from the trip time, but in diesel territory the impact of electrification nearly halves the trip time, cutting 48%.
Raritan Valley Line
| Station | Current time | Future time |
| New York | (0:00) | 0:00 |
| Secaucus | (0:09) | 0:06 |
| Newark Penn | (0:18) | 0:10 |
| Newark South Street | — | 0:12 |
| Union | 0:27 | 0:17 |
| Roselle Park | 0:30 | 0:19 |
| Cranford | 0:35 | 0:22 |
| Garwood | 0:38 | 0:24 |
| Westfield | 0:41 | 0:25 |
| Fanwood | 0:46 | 0:28 |
| Netherfields | 0:49 | 0:30 |
| Plainfield | 0:53 | 0:32 |
| Dunellen | 0:58 | 0:35 |
| Bound Brook | 1:03 | 0:39 |
| Bridgewater | 1:06 | 0:41 |
| Somerville | 1:12 | 0:44 |
| Raritan | 1:15 | 0:47 |
| North Branch | 1:21 | 0:50 |
| Whitehouse | 1:28 | 0:54 |
| Lebanon | 1:34 | 0:58 |
| Annandale | 1:39 | 1:01 |
| High Bridge | 1:52 | 1:04 |
The Raritan Valley Line does not run through to Manhattan but rather terminates at Newark Penn because of capacity constraints on the mainline, so the New York-Newark trip times are imputed from Northeast Corridor trains. So really the trip time difference is 1:34 versus 0:54, a reduction of 42% in the trip time thanks to electrification.
Morristown Line
| Station | Current time | Future time |
| New York | 0:00 | 0:00 |
| Secaucus | 0:10 | 0:06 |
| Newark Broad Street | 0:19 | 0:11 |
| Newark 1st Street | — | 0:13 |
| East Orange | — | 0:15 |
| Brick Church | 0:25 | 0:17 |
| Orange | 0:28 | 0:19 |
| Highland Avenue | — | 0:21 |
| Mountain | — | 0:23 |
| South Orange | 0:33 | 0:25 |
| Maplewood | 0:38 | 0:27 |
| Millburn | 0:42 | 0:29 |
| Short Hills | 0:45 | 0:31 |
| Summit | 0:49-0:50 | 0:34 |
| Chatham | 0:55 | 0:39 |
| Madison | 0:59 | 0:41 |
| Convent | 1:03 | 0:44 |
| Morristown | 1:07 | 0:47 |
| Morris Plains | 1:11 | 0:50 |
| Mount Tabor | 1:18 | 0:54 |
| Denville | 1:21 | 0:56 |
| Dover | 1:32 | 1:00 |
| Mount Arlington | 1:40 | 1:06 |
| Lake Hopatcong | 1:45 | 1:09 |
| Netcong | 1:53 | 1:12 |
| Mount Olive | 1:58 | 1:15 |
| Hackettstown | 2:14 | 1:22 |
This timetable is cobbled from two different train runs, as electric wires only run as far out as Dover, so trains from New York only go as far as Dover, and trains to Hackettstown serve Hoboken instead. Observe the 35% reduction in trip time in electric territory despite making a few more stops, and the 48% reduction in trip time in diesel territory.
Gladstone Branch
| Station | Current time | Future time |
| New York | (0:00) | 0:00 |
| Secaucus | (0:10) | 0:06 |
| Newark Broad Street | (0:19) | 0:11 |
| Newark 1st Street | — | 0:13 |
| East Orange | 0:24 | 0:15 |
| Brick Church | 0:26 | 0:17 |
| Orange | 0:29 | 0:19 |
| Highland Avenue | 0:31 | 0:21 |
| Mountain | 0:33 | 0:23 |
| South Orange | 0:36 | 0:25 |
| Maplewood | 0:39 | 0:27 |
| Millburn | 0:42 | 0:29 |
| Short Hills | 0:45 | 0:31 |
| Summit | 0:50 | 0:34 |
| New Providence | 0:55 | 0:37 |
| Murray Hill | 0:58 | 0:40 |
| Berkeley Heights | 1:02 | 0:43 |
| Gillette | 1:05 | 0:46 |
| Stirling | 1:08 | 0:48 |
| Millington | 1:11 | 0:50 |
| Lyons | 1:14 | 0:53 |
| Basking Ridge | 1:17 | 0:56 |
| Bernardsville | 1:20 | 0:57 |
| Far Hills | 1:26 | 1:02 |
| Peapack | 1:30 | 1:06 |
| Gladstone | 1:37 | 1:08 |
As the line is entirely electrified, the time saving is only 30%. Note that Gladstone Branch trains do not run through to Penn Station except at rush hour, so I’m imputing New York-Newark Broad trip times using the Morristown Line.
Montclair-Boonton Line
| Station | Current time | Future time |
| New York | (0:00) | 0:00 |
| Secaucus | (0:09) | 0:06 |
| Newark Broad Street | (0:20) | 0:11 |
| Newark 1st Street | — | 0:13 |
| Newark Park Street | — | 0:15 |
| Watsessing Avenue | 0:26 | 0:18 |
| Bloomfield | 0:28 | 0:19 |
| Glen Ridge | 0:31 | 0:21 |
| Bay Street | 0:34 | 0:23 |
| Walnut Street | 0:37 | 0:24 |
| Watchung Avenue | 0:40 | 0:26 |
| Upper Montclair | 0:43 | 0:28 |
| Mountain Avenue | 0:45 | 0:30 |
| Montclair Heights | 0:47 | 0:31 |
| Montclair State U | 0:50 | 0:33 |
| Little Falls | 0:56 | 0:37 |
| Wayne-Route 23 | 1:00 | 0:40 |
| Mountain View-Wayne | 1:02 | 0:43 |
| Lincoln Park | 1:07 | 0:46 |
| Towaco | 1:11 | 0:49 |
| Boonton | 1:18 | 0:53 |
| Mountain Lakes | 1:22 | 0:56 |
| Denville | 1:27 | 0:59 |
| Dover | 1:34 | 1:04 |
Beyond Dover, a handful of evening trains continue to Hackettstown. Interestingly, the saving from electrification is only 32% – and the train I drew the current schedule from is a Hoboken diesel train. Electric trains run from New York to Montclair State University, but are for some reason actually slightly slower today than the Hoboken diesels on the shared Newark-MSU segment. I suspect that like the LIRR, NJ Transit does not timetable electric trains to be any faster than diesels on shared segments even though their performance is better.
Discussion
There are specific patterns to where my schedule outperforms the existing one by the largest margin and where it does so by the smallest margin.
Terminal zone
Between New York and Newark, I am proposing that trains take 10-11 minutes, down from 18-20 today, cutting 45% from the trip time. This comes from several factors. The first is avoiding unnecessary slowdowns in terminal zones: Penn Station should be good for about 50 km/h, ideally even more if there are consistent enough platform assignments that the turnouts can be upgraded to be faster; Newark should not impose any speed limit whatsoever beyond that of right-of-way geometry.
The second is increasing superelevation and cant deficiency. The worst curve is the turn from Harrison to Newark; its radius is just shy of 500 meters, good for around 110 km/h at normal cant and cant deficiency (150 mm each), or even 120 km/h if the cant is raised to 200 mm in support of higher-speed intercity service. But the current speed limit is a blanket 45 mph, even on Amtrak, whose cant deficiency is fine. The Newark approach is then even slower, 35 mph, for no reason. It’s telling that on my schedule, the Secaucus-Newark speedup is even greater than the New York-Secaucus speedup, despite the Penn Station interlocking morass.
The third is reducing schedule padding. The schedules appear extremely padded for what NJ Transit thinks is a capacity problem but is not really a problem in the midday off-peak period. Between 9 am and noon, 18 trains depart Penn Station going west, 10 on the Northeast Corridor and North Jersey Coast and 8 on the Morris and Essex Lines and the Montclair Line.
Unelectrified lines
On lines without electrification, the time savings from electrification are considerable, with the exception of the Boonton Line. This is especially notable on the tails of the North Jersey Coast and Morristown Lines, both of which allow for 48% reductions in trip time, nearly doubling the average speed.
This is related to the issue of low platforms. These tails have low platforms, whereas the inner segment of the Raritan Valley Line (up to Westfield), which already has mostly high platforms, does not exhibit the same potential speed doubling. Outer segments may also not be well-maintained, leading to non-geometric speed limits. Between Long Branch and Bay Head the tracks are fairly straight, but the existing speed limits are very low, at most 60 mph with most segments limited to 40 or even 25 or less.
Upgraded lines
In contrast with the enormous slowdowns between New York and Newark and on unelectrified tails, the workhorse inner segments (including the entire Northeast Corridor Line) radiating out of Newark are only about 1.5 times as slow as they can be, rather than twice as slow. The Gladstone Branch, which runs EMUs rather than electric locomotive-hauled trains, manages to be only about 1.37 times as slow, in large part courtesy of low platforms.
Of course, 1.5 times as slow is still pretty bad. This is because no line on NJ Transit is truly modern, that is running all EMUs serving high platforms. But the electric lines manage to be less bad than the diesel lines, and the suburbs less bad than the New York-Newark segment with its excessive timetable padding and terminal zone slowdowns.
How to get there from here
NJ Transit has a problem: perhaps unaware of the new FRA regulations, it just ordered bilevel EMUs compliant with the old rather than new regulations. If it can cancel the order, it should do so, and instead procure standard European EMUs stretched to the larger clearances of the American (or Nordic) railway network.
Simultaneously, it should complete electrification of the entire Penn Station-feeding system, including the Raritan Valley Line even though right now it does not run through to New York. This includes some outer branches with low traffic, not enough to justify electrification on their own; that is fine, since the 31 km of wire between Dover and Hackettstown, 25 km between Long Branch and Bay Head, 27 between Raritan (where semi-frequent service ends) and High Bridge, and 30 between MSU and Denville permit a uniform or mostly uniform fleet with no diesel under catenary. EMUs are far more reliable than anything that runs on diesel, and if NJ Transit retires diesels and only runs EMUs on the most congested segment of the network, it will be able to get away with far less schedule padding.
In Boston, at Transit Matters we’ve likewise recommended full systemwide electrification, but with priority to lines that connect to already-electric infrastructure, that is the Stoughton branch of the Providence Line, the Fairmount Line (which is short enough to use Northeast Corridor substations), and subsequently the entire South Station-feeding system. By the same token, it is more important to electrify the outer edges of the Morristown and North Jersey Coast Lines and the entire Raritan Valley Line than to electrify the Erie lines not analyzed in this post, since the Erie lines’ infrastructure points exclusively toward Hoboken and not New York.
In addition to electrification, NJ Transit must replace all low platforms with high platforms. This should generally be doable with ramp access rather than elevators to save money, in which case a double-track station should be doable for about $10 million, if Boston and Philadelphia costs are any indication. In addition to speeding up general boarding, high platforms permit wheelchair users to board trains without the aid of an attendant or conductor.
All of this costs money – the infrastructure should cost somewhat more than $1 billion, and new rolling stock should cost about $1.5 billion at European costs, or somewhat more if there’s an American premium for canceling the in-progress contract for inferior equipment. But none of this costs a lot of money. New Jersey is ready to sink $2.75 billion of state money as part of an $11 billion Gateway tunnel that would do nothing for capacity (since it four-tracks the tunnel but not the surface segments to Newark); it should be ready to spend about the amount of money on a program that is certain to cut 25-50% off of people’s travel time and perhaps halve operating costs.
How Fast New York Regional Rail Could Be Part 2
In my last post about New York regional rail schedules, I covered the New Haven and Harlem Lines of Metro-North and the Main Line and Hempstead Branch of the LIRR. I was hoping to cover more lines tonight, but due to time constraints only the Hudson Line is available.
This post should be viewed as considerably more accurate than the previous one, because I’ve obtained a Metro-North track chart with exact curve radii. I had to use measuring tools in the previous posts, and although the results were generally accurate, they were not completely so, and a few short, sharp curves cost a few more seconds than depicted. I do not believe the total slowdown between New York and either New Haven or Southeast to be worse than one minute relative to the track chart, but it is a slight slowdown, more than countermanding my tendency to round all fractional seconds up in speed zones.
Capital expenses
One key difference with my last post is that the Hudson Line is not entirely electrified. It is only electrified south of Croton-Harmon; farther north, trains run with diesel locomotives, changing to electric mode only in Manhattan. My timetable assumes electrification. This is a project Metro-North should be pursuing anyway, since the outer Hudson Line is one of the busiest diesel lines in New York, alongside the outer Port Jefferson Branch and the Raritan Valley Line.
This lack of electrification extends to part of the express tracks south of Croton-Harmon as well. As a result, this schedule, while relying on cheap investments, is not quite the near-zero cost improvement on the express line. On the local line it is, since the trains are electrified.
As before, I am not assuming any curve is straightened, merely that track geometry trains fix the tracks to have higher superelevation (150 mm) and that trains run at 150 mm cant deficiency rather than today’s 3″. In metric units, this means acceleration in the horizontal plane is 2 m/s^2, so curves obey the formula

One big-ticket item that Metro-North should look into, in addition to completing electrification, is grade-separating the interlocking at CP 5, between the Hudson and Harlem Lines. The flat junction is extremely busy – it may plausibly have higher peak throughput than the flat junctions that plague South London’s commuter rail network – and hinders a simple 2-tracks-in, 2-tracks-out operation. This is not strictly speaking a speedup, but I would be more comfortable writing aggressive, high-frequency timetables if trains did not conflict at-grade.
Local schedule
Local trains run up to Croton-Harmon, making all stops.
| Station | Current time | Future M-7 time | Future Euro time |
| Grand Central | 0:00 | 0:00 | 0:00 |
| Harlem-125th | 0:10 | 0:06 | 0:06 |
| Yankees-153rd | 0:15 | 0:09 | 0:09 |
| Morris Heights | 0:18 | 0:12 | 0:12 |
| University Heights | 0:20 | 0:14 | 0:14 |
| Marble Hill | 0:22 | 0:16 | 0:16 |
| Spuyten Duyvil | 0:24 | 0:18 | 0:17 |
| Riverdale | 0:28 | 0:21 | 0:20 |
| Ludlow | 0:30 | 0:24 | 0:23 |
| Yonkers | 0:33 | 0:26 | 0:25 |
| Glenwood | 0:35 | 0:28 | 0:27 |
| Greystone | 0:38 | 0:31 | 0:29 |
| Hastings-on-Hudson | 0:42 | 0:34 | 0:31 |
| Dobbs Ferry | 0:45 | 0:36 | 0:33 |
| Ardsley-on-Hudson | 0:47 | 0:39 | 0:36 |
| Irvington | 0:49 | 0:41 | 0:38 |
| Tarrytown | 0:53 | 0:44 | 0:41 |
| Sleepy Hollow | 0:55 | 0:47 | 0:43 |
| Scarborough | 0:59 | 0:50 | 0:46 |
| Ossining | 1:02 | 0:53 | 0:48 |
| Croton-Harmon | 1:11 | 0:56 | 0:52 |
The 9-minute interstation between Ossining and Croton-Harmon represents end-of-line schedule padding – in the southbound direction, trains are scheduled to take only 4 minutes.
Observe that the travel time difference is smaller than on the other lines presented in my previous post. Current equipment could shave 21% off the travel time, which is considerable but a far cry from the 33-40% elsewhere in the system. The reason is that the Hudson Line is maintained to higher standards, with cruise speeds of 80 mph on much of the line; I am assuming a speedup to 160 km/h, but the stop spacing along the Hudson is so short that trains can’t even hit 160 km/h while accelerating. The curves are still insufficiently superelevated – the Spuyten Duyvil curve where the fatal derailment happened has only 2.5″ of superelevation – and trains are only rated for low cant deficiency. However, the other aspects of the speedup on other lines are less conspicuous.
I also suspect that there is less schedule padding on the Hudson Line than on the other lines. Its frequency is lower, the line is four-track for most of its length, and the one significant flat junction equally affects the other two Metro-North mainlines. So the schedule may already be stable enough that padding, while considerable, is less outrageous than on the LIRR.
Express schedule
Express trains on the Hudson Line run a variety of stopping patterns, especially at rush hour. The line’s infrastructure is set up for intermediate express stops at Harlem, Marble Hill, Yonkers, Tarrytown, Ossining, and Croton-Harmon, but the standard off-peak pattern makes slightly fewer stops. My assumption is that all the above stations will receive express service.
| Station | Current time | Future M-7 time | Future Euro time |
| Grand Central | 0:00 | 0:00 | 0:00 |
| Harlem-125th | 0:11 | 0:06 | 0:06 |
| Marble Hill | — | 0:13 | 0:13 |
| Yonkers | — | 0:18 | 0:18 |
| Tarrytown | 0:39 | 0:27 | 0:26 |
| Ossining | 0:47 | 0:32 | 0:31 |
| Croton-Harmon | 0:53 | 0:35 | 0:34 |
| Cortlandt | 1:01 | 0:41 | 0:39 |
| Peekskill | 1:06 | 0:44 | 0:42 |
| Manitou | — | 0:50 | 0:48 |
| Garrison | 1:17 | 0:54 | 0:51 |
| Cold Spring | 1:21 | 0:57 | 0:55 |
| Breakneck Ridge | — | 1:00 | 0:58 |
| Beacon | 1:30 | 1:05 | 1:02 |
| New Hamburg | 1:38 | 1:10 | 1:07 |
| Poughkeepsie | 1:55 | 1:15 | 1:12 |
This is a 35-38% reduction in travel time while making four more stops, two on the inner part of the line and two on the outer part that currently only see occasional seasonal use for hiking trails. The explanation for this is simple: the rolling stock used today is not M-7 EMUs but diesel locomotives. Rush hour trains running nonstop between Manhattan and Beacon connect Grand Central with Poughkeepsie in 1:36-1:37, a stop penalty of about 2.5 minutes, twice as high as what a European regional EMU can achieve at a top speed of 160 km/h.
Moreover, the 80-90 mph speed limit, which is dead letter on local trains for most of the way because they stop so frequently, consumes a few minutes relative to 160 km/h when trains run nonstop for long stretches. Thus, an increase in top speed is necessary in addition to an increase in curve superelevation and cant deficiency.
What about Grand Central?
My schedules consistently depict 6-minute trip times between Grand Central and Harlem, compared with current timetables that have them do it in 10-11 minutes. On most of the line, the top speed is the same – 60 mph, against 100 km/h in my timetable. The difference is entirely in the last mile out of Grand Central, where the limit today is 10 mph for no good reason.
The constrained environment of Grand Central does not leave room for high-speed switches. Nonetheless, the existing switches, called #8 switches, have a curve radius of about 140 meters, which is good enough for 40 km/h with no superelevation and a cant deficiency of 150 mm. American switches are generally rated for twice their number in miles per hour, assuming no superelevation and a 2″ cant deficiency; but higher cant deficiency is possible, and is really important as the difference between 25 and 40 km/h for a few hundred meters is considerable.
Moreover, 40 km/h is only the governing speed for a very short distance, about half a kilometer. Farther out, trains can always take the straight direction on turnouts, with one exception, turnout number 309B on the southbound local track (track 4), which is a triangular switch, i.e. one without a straight direction. Fixing the switch to have a straight direction from track 4 to track J, the westernmost approach track to the lower level of the station, should be a priority, plausibly saving 3 minutes for all trains using this track.
With trains taking the straight direction wherever possible, the central express tracks in the Park Avenue Tunnel (tracks 1 and 2) should exclusively feed the upper level, and the outer local tracks should exclusively feed the lower level; this way, there would not be any conflict. The station was originally designed for local trains to use the lower level and express trains to use the upper level, so this is nothing new, just a more rigid way of running service than today. Each of the two levels has ladder tracks permitting access to about 10 platform tracks, which is more enough for a train every 2 minutes; for reference, the 4 platform tracks of Haussmann-Saint Lazare on the RER E turn 16 trains per hour at the peak today, and were constructed with the ability to turn 18.
The upshot is that very little station reconstruction is needed at this stage. Some reconstruction is required for through-running, as it would require all approach tracks to go to the lower level, but even that would be much cheaper than the through-running tunnels. But with terminating service, only one switch needs to be changed. This is not expensive; the limiting resource is imagination to do better than today’s slow service.
How Fast New York Regional Rail Could Be
A few years ago, when I started writing timetables for proposed regional rail lines, I realized how much faster they were than current schedules. This goes beyond the usual issues in Boston with electrification, which can cut the Boston-Providence trip from the current 1:10 or so to around 45 minutes. In New York the trains are already electrified, but trip times are slow, due to a combination of weak rolling stock, low platforms in New Jersey, poor maintenance in Connecticut, and obscene schedule padding in Long Island. This post collects a few before-and-after comparisons of how fast regional rail in New York could be.
Due to time constraints, not all lines are included in this post; by popular demand I can complete this and make it a two-part post. In this post I am going to focus on the New Haven and Harlem Lines and the LIRR’s Ronkonkoma and Hempstead Branches.
The LIRR and Metro-North both have reasonable if conservative equipment. Thus, it is valuable to look at the trip times that current equipment could achieve, that is the M-8s on the New Haven Line and the M-7s on the other lines. Future equipment should be higher-performance, and in particular both railroads should procure modular platforms based on proven European regional rail designs, rather than stick with overweight, overpriced equipment as in the upcoming capital plan. Thus the following tables include trip times with both current equipment and a notional regional electric multiple unit (EMU) with the specs of a Talent 2, FLIRT, Coradia Continental, DBAG Class 425, or similar train.
As a note of caution, these trip times are not achievable at zero cost, only at low cost. No curve needs to be straightened, but some curves need to be superelevated, and in some areas, particularly Connecticut, additional track work is required. All of this is quite cheap based on European maintenance regimes, though perhaps not based on American ones, but it is not literally a day one timetable – figure a few months’ worth of work systemwide. Schedules would also need to be simpler, with fewer creative express patterns, to facilitate low schedule padding, 7% as in Switzerland rather than the LIRR’s current 30% pad.
Much of this work comes from this post about the LIRR and this one about the New Haven Line, but here I’m covering the Harlem and Hudson Lines as well, and using more recent computations for acceleration.
New Haven Line
Locals to Stamford:
| Station | Current time | Future M-8 time | Future Euro time |
| Grand Central | 0:00 | 0:00 | 0:00 |
| Harlem-125th | 0:10 | 0:06 | 0:06 |
| Fordham | 0:18 | 0:12 | 0:11 |
| Mount Vernon East | 0:27 | 0:18 | 0:16 |
| Pelham | 0:30 | 0:20 | 0:18 |
| New Rochelle | 0:33 | 0:23 | 0:21 |
| Larchmont | 0:37 | 0:26 | 0:24 |
| Mamaroneck | 0:40 | 0:29 | 0:27 |
| Harrison | 0:43 | 0:32 | 0:29 |
| Rye | 0:48 | 0:35 | 0:31 |
| Port Chester | 0:51 | 0:37 | 0:33 |
| Greenwich | 0:55 | 0:40 | 0:36 |
| Cos Cob | 0:59 | 0:43 | 0:39 |
| Riverside | 1:02 | 0:45 | 0:41 |
| Old Greenwich | 1:04 | 0:47 | 0:42 |
| Stamford | 1:15 | 0:50 | 0:45 |
Some of the numbers are interpolated, but the end-to-end times as well as those to New Rochelle, Port Chester, and Riverside are exact. No curve is straightened, but all non-geometric speed limits, including those on the Cos Cob Bridge, are removed; the Cos Cob Bridge is not straight enough for high-speed rail, but a regional train could squeeze 150 km/h out of it, or 160 if it is replaced.
Expresses to New Haven are faster, as detailed in my older post on the subject:
| Station | Current time | Future M-8 time | Future Euro time |
| Grand Central | 0:00 | 0:00 | 0:00 |
| Harlem-125th | 0:10 | 0:06 | 0:06 |
| New Rochelle | — | 0:18 | 0:17 |
| Stamford | 0:51 | 0:31 | 0:30 |
| Noroton Heights | 0:56 | 0:35 | 0:34 |
| Darien | 1:00 | 0:38 | 0:36 |
| Rowayton | 1:03 | 0:40 | 0:38 |
| South Norwalk | 1:07 | 0:43 | 0:41 |
| East Norwalk | 1:10 | 0:46 | 0:43 |
| Westport | 1:14 | 0:49 | 0:46 |
| Greens Farms | 1:18 | 0:53 | 0:49 |
| Southport | 1:23 | 0:56 | 0:52 |
| Fairfield | 1:26 | 0:58 | 0:54 |
| Fairfield Metro | 1:30 | 1:01 | 0:57 |
| Bridgeport | 1:38 | 1:05 | 1:00 |
| Stratford | 1:45 | 1:10 | 1:04 |
| Milford | 1:52 | 1:14 | 1:08 |
| West Haven | 1:59 | 1:20 | 1:14 |
| New Haven | 2:09 | 1:24 | 1:18 |
Numbers differ from my older post by a minute to allow for slightly slower approaches to the Grand Central stub-end, at 50 km/h rather than 100 km/h as with any future through-running. This is still several minutes faster than the current 10 mph speed limit out to a mile out of the station. It doesn’t matter too much; at the end of the day, this is a difference of 1:18 vs. 2:09, with one extra station. I repeat: better track maintenance, less conservative terminal approach speeds, higher superelevation on curves, modern schedule padding, and (on the margin) higher-performance equipment could reduce trip times from 2:09 to 1:18, a cut of 40% in trip time, without straightening a single curve.
Harlem Line
The Harlem Line today runs local and express trains, but this involves a long stretch from north of Mount Vernon West to North White Plains with three and two rather than four tracks; trains just don’t run frequently enough today that it’s a problem, but in the future they will need to. Therefore, my timetable below is all-local. Nonetheless, trip times to White Plains on the local train are comparable to those of today’s express trains.
| Station | Current time (local) | Current time (express) | Future M-7 time | Future Euro time |
| Grand Central | 0:00 | 0:00 | 0:00 | 0:00 |
| Harlem-125th | 0:10 | 0:10 | 0:06 | 0:06 |
| Melrose | 0:14 | — | 0:09 | 0:09 |
| Tremont | 0:17 | — | 0:12 | 0:11 |
| Fordham | 0:20 | — | 0:14 | 0:13 |
| Botanical Gardens | 0:22 | — | 0:16 | 0:15 |
| Williams Bridge | 0:25 | — | 0:18 | 0:17 |
| Woodlawn | 0:28 | — | 0:21 | 0:19 |
| Wakefield | 0:30 | — | 0:23 | 0:21 |
| Mount Vernon West | 0:32 | — | 0:24 | 0:23 |
| Fleetwood | 0:35 | — | 0:27 | 0:25 |
| Bronxville | 0:37 | — | 0:29 | 0:27 |
| Tuckahoe | 0:39 | — | 0:31 | 0:28 |
| Crestwood | 0:42 | — | 0:33 | 0:30 |
| Scarsdale | 0:46 | — | 0:36 | 0:33 |
| Hartsdale | 0:49 | — | 0:38 | 0:35 |
| White Plains | 0:53 | 0:36 | 0:41 | 0:38 |
| North White Plains | 1:01 | 0:41 | 0:44 | 0:40 |
| Valhalla | 0:45 | 0:47 | 0:43 | |
| Hawthorne | 0:49 | 0:50 | 0:46 | |
| Pleasantville | 0:53 | 0:53 | 0:49 | |
| Chappaqua | 0:56 | 0:56 | 0:52 | |
| Mount Kisco | 1:02 | 1:00 | 0:55 | |
| Bedford Hills | 1:06 | 1:04 | 0:59 | |
| Katonah | 1:09 | 1:07 | 1:01 | |
| Goldens Bridge | 1:13 | 1:10 | 1:04 | |
| Purdy’s | 1:17 | 1:13 | 1:08 | |
| Croton Falls | 1:20 | 1:16 | 1:10 | |
| Brewster | 1:26 | 1:20 | 1:15 | |
| Southeast | 1:37 | 1:22 | 1:16 |
Observe that the current schedule has very long trip times before the end station – 8 minutes from White Plains to North White Plains on the local, 11 from Brewster to Southeast on the express. Southbound, both segments are timetabled to take only 4 minutes each. This is additional padding used to artificially inflate on-time performance, in lieu of the better practice of spacing out the pad throughout the schedule, at 1 minute per 15 minutes.
LIRR Main Line
The LIRR has a highly-branched system, and I’m only going to portray the Main Line to Ronkonkoma among the long express lines. This is because in the long term, the South Side lines shouldn’t be going to Penn Station but to Downtown Brooklyn and Lower Manhattan. The Port Jefferson Branch could benefit from a side-by-side comparison of trip times, but that is partly a matter of electrifying the outer part of the line, a project that is perennially on the LIRR’s wishlist.
| Station | Current time | Future M-7 time | Future Euro time |
| Penn Station | 0:00 | 0:00 | 0:00 |
| Sunnyside Junction | — | 0:05 | 0:05 |
| Woodside | 0:10 | — | — |
| Jamaica | 0:20 | 0:12 | 0:12 |
| Floral Park | — | 0:17 | 0:17 |
| New Hyde Park | — | 0:20 | 0:19 |
| Merillon Avenue | — | 0:22 | 0:21 |
| Mineola | 0:37 | 0:24 | 0:23 |
| Carle Place | — | 0:28 | 0:26 |
| Westbury | — | 0:30 | 0:28 |
| Hicksville | 0:45 | 0:33 | 0:31 |
| Bethpage | 0:51 | 0:37 | 0:34 |
| Farmingdale | 0:55 | 0:40 | 0:37 |
| Pinelawn | 1:00 | 0:43 | 0:40 |
| Wyandanch | 1:02 | 0:46 | 0:43 |
| Deer Park | 1:06 | 0:50 | 0:47 |
| Brentwood | 1:11 | 0:54 | 0:50 |
| Central Islip | 1:15 | 0:57 | 0:53 |
| Ronkonkoma | 1:22 | 1:01 | 0:57 |
The fastest Main Line train of the day runs between Penn Station and Ronkonkoma stopping only at Hicksville, Brentwood, and Central Islip, not even stopping at Jamaica; it does the trip in 1:08, a few minutes worse than the M7 could with less schedule padding and small speedups at terminal zones (Penn Station throat slowdowns add 1-2 minutes, it’s not the mile-long slog of Grand Central).
Hempstead Branch
Finally, for local service supplementing the rapid Main Line, we can look at the Hempstead Branch, which under my regional rail maps should keep serving Penn Station along today’s alignment, continuing north along the Empire Connection to the Hudson Line. Today, only a handful of peak trains run between Penn Station and Hempstead – off-peak, Hempstead diverts to Atlantic Terminal. Here are side-by-side schedules, using the fastest peak train as a comparison:
| Station | Current time | Future M-7 time | Future Euro time |
| Penn Station | 0:00 | 0:00 | 0:00 |
| Sunnyside Junction | — | 0:05 | 0:05 |
| Woodside | 0:11 | 0:08 | 0:07 |
| Forest Hills | — | 0:12 | 0:11 |
| Kew Gardens | — | 0:14 | 0:13 |
| Jamaica | 0:20 | 0:16 | 0:15 |
| Hollis | 0:28 | 0:19 | 0:18 |
| Bellerose | 0:31 | 0:22 | 0:20 |
| Queens Village | 0:33 | 0:24 | 0:22 |
| Floral Park | 0:35 | 0:26 | 0:24 |
| Stewart Manor | 0:38 | 0:28 | 0:26 |
| Nassau Boulevard | 0:41 | 0:30 | 0:28 |
| Garden City | 0:43 | 0:32 | 0:30 |
| Country Life Press | 0:47 | 0:34 | 0:32 |
| Hempstead | 0:51 | 0:36 | 0:33 |
Conclusion
Across the four lines examined – New Haven, Harlem, Main, Hempstead – trains could run about 50-66% faster, i.e. taking 33-40% less time. This is despite the fact that the rolling stock today is already EMUs: the vast majority of the speedup does not come from upgrading to higher-end trains, but rather from running faster on curves as all EMUs can, avoiding unnecessary slowdowns in station throats, and reducing schedule padding through more regular timetables.
The speedup is so great that the Harlem Line could achieve the same trip times of present-day nonstop trains on locals making 14 more stops between Manhattan and North White Plains, a distance of 38 km, and the LIRR could achieve substantially faster trip times than today’s nonstops on semi-rapid trains. In fact, the LIRR could even make additional local stops on the Main Line like Forest Hills and Hollis and roughly match the fastest peak trains, but expected traffic volumes are such that it’s best to leave the locals to the Hempstead Branch and put the Main Line on the express tracks.
Good transit activists in and around New York should insist that the managers prioritize such speedups. If locals can match today’s express trip times, there is no need to run creative express stopping patterns that force trains into complex patterns of overtakes. Just run frequent local service, using the maxim that a line deserves express service if and only if it has four tracks, as the New Haven Line and shared Main Line-Hempstead Branch segment do. With the slowest speed zones sped up, curve speeds raised to the capabilities of modern EMUs (including the conservative M-7s and M-8s), and schedule padding shrunk to where it should be, the suburbs could be so much closer to Manhattan at rush hour as well as off-peak, stimulating tighter metropolitan connections.

