Category: New York
Missed Connections
I’ve discussed before the topic of missed connections on subway systems, both here and on City Metric. I’ve for the most part taken it for granted that on a rapid transit network, it’s important to ensure that whenever two lines intersect, they offer a transfer. This seems like common sense. The point of this post is not to argue for this principle, but to distinguish two different kinds of missed connections: city center misses, and outlying misses. Both are bad; if I had to say which is worse I’d say it’s the city center miss, but city center misses and outlying misses are bad for distinct reasons.
A useful principle is that every pair of rapid transit lines should intersect, unless one is a shuttle, or both are circumferential. If the city is so large that it has multiple circular lines at different radii (Beijing has two, and London vaguely has two as well depending on how one counts the Overground), then they shouldn’t intersect, but rapid transit networks should be radial, and every radial line should connect to every other line, with all radial-radial transfers ideally located within the center. City center misses weaken the network by making some radials not connect, or perhaps connect at an inconvenient spot. Outlying misses often permit more central transfers, and their problem is that they make it harder to transfer to the better or less crowded radial on the way to the center. London supplies a wealth of examples of the latter without the former.
What counts as a missed connection?
Fundamentally, the following picture is a missed subway connection:
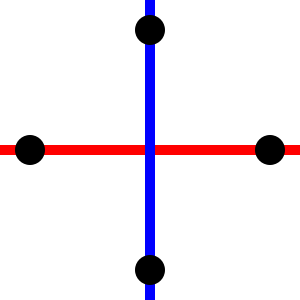
The red and blue lines intersect without a transfer. Even if a few stations later there is a transfer, this is a miss. In contrast, the following picture is not a missed connection:
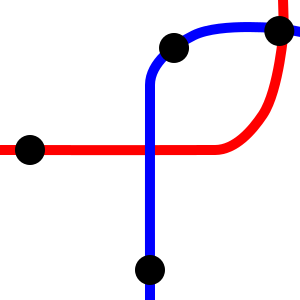
It might be faster for riders to transfer between the southern and western leg if there were a station at the exact physical intersection point, but as long as the next station on the red line has a transfer to the blue line it counts, even if the blue line has one (or more) stations in the middle. Washington supplies an example of this non-miss: it frustrates riders that there’s no connection between Farragut West and Farragut North, but at the next station south from the intersection on the Red Line, Metro Center, there is a transfer to the Blue and Orange Lines. London supplies another pair of examples: the Northern line and the Waterloo and City line appear to intersect the District line without a transfer, but their next station north from the physical intersection point, Bank, has an in-system transfer to Monument on the District.
There are still a few judgment calls in this system. One is what to do at the end of the line. In this case, I rule it a missed connection if the terminal clearly has an intersection without a transfer; if the terminal is roughly between the two stations on the through-line, it doesn’t count. Another is what to do about two lines that intersect twice in close succession, such as the Bakerloo and Hammersmith and City lines in London, and Metro Lines 4 and 10 in Paris. In such cases, I rule that, if there’s just one station on the wrong side (Paddington on Bakerloo, Mabillon on M10) then I rule it a single intersection and allow transfers at the next station over, by which standard London has a missed connection (Edgware Road has no Bakerloo/H&C transfer) and Paris doesn’t (Odeon has an M4/M10 transfer).
How many missed connections are there?
In Paris, there are three missed connections on the Metro there is one missed connection on the Metro (update: see comments below): M9/M12, M5/M14, M9/M14. As I discuss on City Metric, it’s no coincidence that two of these misses involve this miss involves Line 14, which has wide stop spacing. Narrow stop spacing makes it easier to connect within line-dense city centers, and Paris famously has the densest stop spacing of any major metro system. M9/M12 and M9/M14 morally should connect at Saint-Augustin and Saint-Lazare, but in fact there is no in-system transfer. M5/M14 should connect at Gare de Lyon, but when M5 was built it was not possible to get the line to the station underground and then have it cross the Seine above-ground, so instead it meets M1 at Bastille, while M14 doesn’t serve since it expresses from Gare de Lyon to Chatelet. A fourth missed connection is under construction: the extension of M14 to the north misses M2 at Rome, prioritizing long stop spacing over the connection to the M2/M6 circumferential.
In Tokyo, there are many misses. I am not sure why this is, but judging by line layout, Tokyo Metro and Toei try to stick to major roads whenever possible, to avoid tunneling under private property, and this constrains the ability of newer lines to hit station locations on older lines. If I understand this map correctly, there are 19 missed connections: Ginza/Hibiya (Toranomon and Kasumigaseki should connect), Ginza/Mita, Ginza/Yurakucho, Ginza/Shinjuku, Marunouchi/Mita (Ginza and Hibiya should connect), Marunouchi/Yurakucho, Asakusa/Yurakucho, Asakusa/Hanzomon, Hibiya/Namboku, Hibiya/Yurakucho (Tsukiji and Shintomicho should connect), Hibiya/Hanzomon, Hibiya/Shinjuku, Hibiya/Oedo, Tozai/Oedo, Tozai/Fukutoshin, Mita/Oedo, Chiyoda/Oedo twice, and Oedo/Fukutoshin. Oedo is particularly notable for being a circumferential line that misses a large number of transfers.
In New York, there are even more misses. Here the culprit is clear: the two older layers of the subway, the IRT and BMT, have just two missed connections. One, 3/L at Junius Street and Livonia Avenue, is an outlying miss. The other is central: Bowling Green on the 4-5 and Whitehall on the R-W should connect. But the newer layer, the IND, was built to drive the IRT and BMT into bankruptcy through competition rather than to complement them, and has a brutal number of misses: ABCD/2-3, ACE/1-2-3, AC-F/2-3-4-5, AC-G/2-3-4-5-BQ-DNR, BD/NQRW, BDFM/NQRW, BD/JZ, E/1, E/F, M/NW, R/7, F/BD-NQ, F/NRW, F-Q/4-5-6, F/NW, G/7, G/JMZ. Counting individual track pairs, this is 46 misses, for a total of 48 including the two IRT/BMT misses; I’m excluding local-only transfers, such as Columbus Circle and 53rd/Lex, and counting the 42nd Street Shuttle as an express version of the 7, so it doesn’t miss the BDFM transfer.
Finally, London only has eight misses. In Central London there are three: the Metropolitan or Hammersmith and City line misses the Bakerloo line as discussed above, and also the Victoria line and Charing Cross branch of the Northern line at Euston. The other five are outlying: the Central line misses the Hammersmith and City line at Wood Lane/White City, and its branches miss the Piccadilly line’s Uxbridge branch three times; the fifth miss is Metropolitan/Bakerloo. But one more miss is under construction: the Battersea extension of the Northern line is going to intersect the Victoria line without a transfer.
The difference between the two kinds of miss
Many misses are located just a few stations away from a transfer. In New York, some misses are just a station away from a transfer, including the G/7 miss in Long Island City, the E/1 miss between 50th Street and 59th Street, and several more are a few stations away, such as the various BDFM/NQRW misses. In London, these include two of the three Central London transfers: there is an H&C/Bakerloo transfer at Baker Street and an H&C-Met/Victoria transfer at King’s Cross-St. Pancras. As a result, not counting the Waterloo and City line, only two trunk lines in the system do not have any transfer: the Charing Cross branch of the Northern line and the Metropolitan/H&C line.
On a radial network, if two lines don’t have any transfer, then the network is degraded, since passengers can’t easily connect. In New York, this is a huge problem: some station pairs even within the inner networks require two transfers, or even three counting a cross-platform local/express transfer. My interest in subway networks and how they function came about when I lived in Morningside Heights on the 1 and tried socializing with bloggers in Williamsburg near the JMZ.
In Paris the three misses are also a problem. Line 4 is the only with a transfer to every other main line. Line 9 intersects every other line, and Line 14 will when its northern extension opens, but both miss connections, requiring some passengers to take three-seat rides, in a city infamous for its labyrinthine transfer stations. Fundamentally, the problem is that the Paris Metro is less radial than it should be: some lines are laid out as grid routes, including Lines 3, 5, and 10; moreover, Lines 8, 9, 12, and 13 are radial but oriented toward a different center from Lines 1, 4, 7, and 11.
In London, in contrast, there is almost no pair of stations that require a three-seat ride. The Charing Cross branch of the Northern line doesn’t make any stop that passengers from the H&C or Met line can’t get to from another line with one interchange (Goodge Street is walking distance to Warren Street). A bigger problem is the lack of interchange to the Central line on the west, which makes the connections between the H&C stations on the west and some Central line stations awkward, but it’s still only a small number of stations on each line. So the problem in London is not network robustness.
Rather, the problem in London is severe capacity limitations on some lines. Without good outlying interchanges, passengers who want to get between two lines need to ride all the way to the center. Most likely, passengers between the Piccadilly and Central line branches to the west end up driving, as car ownership in West London is relatively high. Passengers without a car have to instead overload the Central line trunk.
The same problem applies to misses that are strictly speaking not missed connections because the two lines do not actually intersect. In Paris, this occurs on Line 7, which swings by the Opera but doesn’t go far enough west to meet Lines 12 and 13. In London, the best example is Hammersmith station: the H&C and District lines have separate stations without an interchange, but they do not intersect since it’s the terminus of the H&C line and therefore I don’t count it as a miss. But morally it’s an outlying miss, preventing District line riders from changing to the H&C line to reach key destinations like Euston, King’s Cross, and Moorgate without overloading the Victoria or Northern line.
In New York this problem is much less acute. The only outlying misses are the 3/L and the ABCD/2-3; the 3/L connects two very low-ridership tails, so the only serious miss is on the Upper West Side. There, passengers originating in Harlem can walk to either line, since the two trunks are two long blocks apart, and passengers originating in Washington Heights can transfer from the A-C to the 1 at 168th Street; at the other end, passengers bound for Midtown can transfer at Columbus Circle, using the underfull 1 rather than the overcrowded 2 and 3.
The role of circumferential lines
Outlying transfers are useful in distributing passengers better to avoid capacity crunches, but they are incidental. They occur when formerly competing suburban lines get shoehorned into the same subway network, or when two straight roads intersect, as in Queens. But the task of distributing passengers between radial lines remains important and requires good connections between as many pairs of radials as possible.
The usual solution to this is a circumferential line. In Moscow, there are several missed connections in the center (Lines 3/6, 3/7, 6/9) and one more planned (8/9), but the Circle Line helps tie in nearly all the radii together, with just one missed connection (to Line 10 to the north) and one more under construction (to Line 8 to the west). The point of the Circle Line is to allow riders to connect between two outlying legs without congesting the center. This is especially important in the context of Moscow, where there are only a handful of interchange stations in the center, most of which connect more than two lines.
In London, the Overground is supposed to play this role. However, the connections between the Underground and Overground are weak. From Highbury and Islington clockwise, the Overground misses connections to the Central line, the Victoria line, the main line of the District line, the Piccadilly line, the Hammersmith and City line, both branches of the Northern line, and the Piccadilly line (it also misses the Metropolitan line, but that’s on a four-track stretch where it is express and local service is provided by the Jubilee line, with which there is a transfer). Much of this is an unforced error, since the Underground lines are often above-ground this far out, and stations could be moved to be better located for transfers.
In New York, the only circumferential line is the G train, which has uniquely bad transfers, legacy of the IND’s unwillingness to build a system working together with the older subways. Triboro RX (in the original version, not the more recent version) would play this role better: with very little tunneling, it could connect to every subway line going counterclockwise from the R in Bay Ridge to the B-D and 4 at Yankee Stadium. On the way, it would connect to some major intermediate centers, including Brooklyn College and Jackson Heights, but the point is not just to connect to these destinations in the circumferential direction but also to facilitate transfers between different lines.
Going forward, cities with large metro network should aim to construct transfers where feasible. In New York there are perennial proposals to connect the 3 and L trains; these should be implemented. In London, the missed outlying transfers involve above-ground stations, which can be moved. The most important miss, White City/Wood Lane, is already indicated as an interchange on the map, but does not to my understanding have an in-system transfer; this should be fixed.
Moreover, it is especially important to have transfers from the radial lines to the circumferential ones. These improve network connectivity by allowing passengers to change direction (from radial to circumferential, e.g. from east-west to north-south within Queens), but also help passengers avoid congested city centers like outlying radial-radial transfers. Where circumferential lines don’t exist, they should be constructed, including Triboro in New York and Line 15 in Paris; where they do, it’s important to ensure they don’t miss connections the way the Overground does.
The MTA Genius Challenge is as Bad as Expected
A year ago, Governor Andrew Cuomo declared a competitive $2.5 million grant, to be disbursed by what he dubbed the Genius Challenge. I wrote about it at the time, expressing skepticism that it would lead to anything useful. The panel of eight judges had only one person with background in the transportation industry, a former FRA administrator. The word “genius” itself is a tech mainstay that to me mostly means “I don’t know any Fields Medalists.” And the topics within the scope of the grant seemed more about what the tech industry thought were the most pressing issues and not what the lowest-hanging actually were. I had very low expectations, and the announcement of the winning entries met them.
The grant has three topics: signaling, rolling stock (interpreted broadly), and underground mobile or wireless service. The last three is by far the least important; it also got only half a million dollars, whereas each of the other two got a full million. Each of the two main ideas shows how weak the very concept of the genius grant is, but they do so in dramatically different ways.
The rolling stock winners included a vendor asking for a grant for New York to use its rolling stock (CRRC); the problems with that idea are more akin to those of the signaling section, so I will cover them there. A second rolling stock winner was a proposal to use better data collection to facilitate preventive maintenance; this idea may or may not work, it’s hard to tell from layers of obfuscating business language. It’s the third idea that deserves the most attention, and the most scorn: lengthening trains but not platforms.
The crank Idea: lengthening trains
The genius competition gave a $330,000 grant for the idea of lengthening trains from 10 to 14 cars without lengthening the platforms. Trains would alternate between only berthing the first 10 cars and only berthing the last 10. Transit Twitter has already dumped on this idea, and for good reason: the proposal reads like a crank paper purporting to prove the Riemann hypothesis or another famous result, starting with a lot of trivial observations and then making a leap of logic buried somewhere in the middle.
The basic problem with running trains that are longer than the platforms is that passengers need to be able to move to the correct car, which takes time. The report says that this is done on the London Underground, which is true, but only at outlying stations – as is the case on the subway in New York. The conductor announcement “only the first five cars will open” is familiar to anyone riding the 3 train and was familiar to anyone riding the 1 train before the new South Ferry station opened. This is fine as long as the station in question is low-volume enough that the extra dwell time does not interfere with operations. Lengthening trains beyond the platforms at busier stations than Harlem-148th Street 145th Street or South Ferry would result in a shuffle forcing passengers to scramble within the train (if moving between cars is possible) or on the platform (if it isn’t). The dwell times would be brutal and would almost certainly reduce capacity measured in passengers per hour.
The proposal handwaves this critical flaw by saying that dwell times would decrease because crowding would decrease. This assumes that dwell times are a function exclusively of on-train crowding, rather than of the number of passengers getting on or off the train. The same number of passengers would have the same platform space, but would actually only be able to use a fraction of it: many would only be able to use the 6 cars that go to their chosen destination, and at those cars, the volume of passengers per unit of platform length would rise.
The second handwave is unlimited stations, with longer platforms. Acknowledging that the busiest stations should have all doors open, the proposal says,
[P. 20] Third, 18.5% of rides occur through just 10 stations in Manhattan. In the medium term, the platforms can, and should, be extended at these 10 stations to enable customers that embark and disembark at them to use any car at both ends of their trip. Accordingly, 9.25% of the customers that presently need to use the middle cars could instead use the end cars.
This is the equivalent of the logical leap from trivial to wrong in a crank paper. First, the number of central stations that would need to be lengthened is much more than 10, including some key origins (86th/Lex, Jamaica Center, etc.) and transfer points (West 4th, Canal, 96th/Broadway). And second and more importantly, the busiest stations are multilevel complexes, where just adding more pedestrian circulation is hard; London is spending a considerable amount of money on that at Bank. Lengthening platforms at these stations is prohibitively expensive. This problem is discussed in cities with constrained underground platforms in the CBD, such as Vancouver, where nearly all Expo Line stations are above-ground (thus, relatively easy to lengthen), but the most crowded in Downtown Vancouver are in a tunnel, where platform reconstruction costs too much to be economic.
The bigger question is why the judges did not catch the error. The proposal brings up London as an example, which serves to bring the magic of the foreign to people who are unfamiliar with best industry practices. Saying that New York does the same is equally true, and in a way more relevant to the proposal (since New York doesn’t let people move between cars, making this more challenging than in London), but would raise questions like “can the dwell times of relatively light stations like South Ferry or Harlem-145th be replicated at the top 40 stations?”. London is Anglophone and some reformist New Yorkers have used it as a source of foreign ideas the way they wouldn’t use non-Anglophone cities. But the judges didn’t do the basic due diligence of checking whether London really implements the idea as widely as the proposal implies, and if not, then why not.
The rent-seeking idea: CBTC by another name
New York State awarded four applicants $250,000 each for ideas about signaling. All four ideas boiled down to the same thing: introducing new technology for communication between trains permitting the functional equivalent of moving-block signaling, at a lower cost than preexisting communication-based train control (CBTC) installations.
The grantees all have experience in the transportation industry. Rail signaling vendors Thales and Ansaldo propose to use cameras to read automated signals; train sensor provider Metrom Rail and veteran rail manager and consultant Robert James propose ultra-wide broadband to improve train location precision. There’s nothing obviously wrong about their proposals. Nor is there anything outlandish, which is why each of the two technologies has two independent applicants behind it. Thales and Ansaldo in particular have experience in advanced signaling – Thales supplied CBTC to the L 7 train in New York and to Metro Line 13 in Paris, and Ansaldo supplied rail automation to Copenhagen and CBTC to a number of Paris Metro lines.
Even then, questions about cost remain. Robert James’ and Metrom’s proposals leave a bad taste in my mouth for their cost estimates. James has a systemwide cost estimate somewhat less than $200 million, not much more than $500,000 per km; Metrom says its system costs “$3 million per mile” and compares itself positively with legacy CBTC systems at $20 million per mile. Actual costs of CBTC without automation in Paris on Line 13 were about 5 million euros per km according to Wikipedia, and this includes modification of the railyards and not just the signaling system. So the Metrom system’s claimed figure is still cheaper, but not by quite as much. Metrom also complains that in Boston, CBTC would not improve capacity much because it would prohibit double-berthing, an issue that is only relevant to a subway-surface system and not to a full metro.
The broader problem with this part of the grant is that if the MTA put out an RFP about CBTC on the subway, it would get bids from Ansaldo, Thales, and Metrom, and James might well bid or consult for a bidder. It would be able to judge the technical merit of each proposal in much closer detail than given in the competition. Instead, the state is paying vendors to market their technology to the public, which would influence future procurement.
While the grant asks about whether the technology is proprietary, it makes no attempt at establishing a multi-vendor standards. Such standards exist: Thales and Ansaldo are both listed as ERTMS vendors. In France there’s already a discussion in the trade press about whether using ERTMS is better than using CBTC; the discussion specifically mentions New York’s uniqueness as a network with connected rather than isolated lines, and says CBTC is designed for isolated lines whereas ERTMS is designed for shared lines, such as the RER system. European experts might well recommend that New York use ERTMS for the subway, even though it’s a system originally designed for mainline rail.
New York’s highly-branched system means it must be more conservative with new technology – there’s nowhere to test it, now that the L and 7 already have CBTC. The shuttles might be useful test cases, or the 1 and 6 trains on weekdays, but without isolated lines, the cost of a mistake in procurement or technological failure is much higher. This suggests the MTA should try to reduce the complexity of branching (which is what I would’ve proposed if it had been within the grant’s scope), and until then concentrate on imitating proven technology rather than innovating. This is especially important given the potential for rent-seeking, in which the vendors use the grant to market themselves to the state over competitors selling similar product.
The judges don’t know any better
Would a panel of judges with more familiarity with metro operations around the first world have come to better decisions? Probably. Through blogs, railfan forums, and comments, I know people with great knowledge of existing operations in a number of cities in the first world, and for the most part they think highly enough of their local systems that they’d ask of any innovation, “why hasn’t it been implemented here already?”.
I wrote in 2011 that people in the US who make technical arguments in favor of public transit tend to be skeptical of many proposals, to the point of finding existing US agencies incompetent. This is US-specific: London Reconnections is a technical blog but it tends to support Transport for London’s process, Swiss and Japanese railfans seem to trust their local rail operators, and even Transport Paris is more positive about STIF’s capital investment than New York-based blogs are about the MTA’s. Experts (and not just bloggers like me) could point out innovations their cities have that can be imported into New York, as well as shoot down bad ideas for which “why doesn’t London/Paris/Tokyo do it?” is a useful sanity check.
Note that sometimes there is a legitimate reason to do something that nobody else has tried. New York’s highly branched network makes ERTMS a better deal there than on other metro systems, and an RFI would be prudent. But because the details of implementation matter more than the idea of innovative genius, it has to go through the regular procurement process.
Cuomo attempted to inject the inventions of the American tech industry into the subway. Instead, he created space for cranks to promulgate their ideas and for vendors to have a leg up over their competitors in any future bid. In effect, his attempt to improve the economic productivity of the public sector to be more in line with that of the American tech industry is going to make the public sector less productive, through weaker institutions (namely, a less robust CBTC bid) and distraction (namely, the useless train lengthening idea).
New Hudson Tunnels Are Canceled. Again.
Amtrak’s Gateway project, spending $30 billion on new tunnels from New Jersey to Penn Station, just got its federal funding yanked. Previously the agreement was to split funding as 25% New York, 25% New Jersey, 50% federal; the states had committed to $5.5 billion, which with a federal match would build the bare tunnels but not some of the ancillary infrastructure (some useful, some not).
When Chris Christie canceled ARC in 2010, then estimated at $10-13 billion, I cheered. I linked to a YouTube video of the song Celebration in Aaron Renn‘s comments. ARC was a bad project, and at the beginning Gateway seemed better, in the sense that it connected the new tunnels to the existing station tracks and not to a deep cavern. But some elements (namely, Penn Station South) were questionable from the start, and the cost estimate was even then higher than that of ARC, which I attributed to both Amtrak’s incompetence and likely cost overruns on ARC independent of who managed it.
But I’m of two minds about to what extent good transit advocates should cheer Gateway’s impending demise. The argument for cheering is a straightforward cost-benefit calculation. The extra ridership coming from Gateway absent regional rail modernization is probably around 170,000 per weekday, a first-order estimate based on doubling current New Jersey Transit ridership into Penn Station. At $40,000 per weekday rider, this justifies $7 billion in construction costs, maybe a little more if Gateway makes it cheaper to do maintenance on the old tunnels. Gateway is $30 billion, so the cost is too high and the tunnel should not be built.
Moreover, it’s difficult to raise the benefits of Gateway using regional rail modernization. On the New Jersey side, population density thins fast, so the benefits of regional rail that do not rely on through-running (high frequency, fare integration, etc.) are limited. The main benefits require through-running, to improve access on Newark-Queens and other through-Manhattan origin-destination pairs. Gateway doesn’t include provisions for through-running – Penn Station South involves demolishing a Manhattan block to add terminal tracks. Even within the existing Penn Station footprint, constructing a new tunnel eastward to allow through-running becomes much harder if the New Jersey Transit tracks have heavy terminating traffic, which means Gateway would make future through-running tunnels more expensive.
But on the other hand, the bare tunnels are not a bad project in the sense of building along the wrong alignment or using the wrong techniques. They’re just extremely expensive: counting minor shoring up on the old tunnels, they cost $13 billion for 5 km of tunnel. Moreover, sequencing Gateway to start with the tunnels alone allows dropping Penn South, and might make it possible to add a new tunnel for through-running mid-project. So it’s really a question of how to reduce costs.
The underground tunneling portion of Second Avenue Subway is $150 million per km, and that of East Side Access is $200 million (link, PDF-p. 7). Both figures exclude systems, which add $110 million per km on Second Avenue Subway, and overheads, which add 37%. These are all high figures – in Paris tunneling is $90 million per km, systems $35 million, and overhead a premium of 18% – but added up they remain affordable. A station-free tunnel should cost $350 million per km, which has implications to the cost of connecting Penn Station with Grand Central. Gateway is instead around $2 billion per km.
Is Gateway expensive because it’s underwater? The answer is probably negative. Gateway is only one third underwater. If its underwater character alone justifies a factor of six cost premium over Second Avenue Subway, then other underwater tunnels should also exhibit very high costs by local standards. There aren’t a lot of examples of urban rail tunnels going under a body of water as wide as the Hudson, but there are enough to know that there is not such a large cost premium.
In the 1960s, one source, giving construction costs per track-foot, finds that the Transbay Tube cost 40% more than the bored segments of BART; including systems and overheads, which the source excludes, BART’s history gives a cost of $180 million, equivalent to $1.38 billion today, or $230 million per km. The Transbay Tube is an immersed tube and not a bored tunnel, and immersed tubes are overall cheaper, but a report by Transport Scotland says on p. 12 that immersed tubes actually cost more per linear meter and are only overall cheaper because they require shorter approaches, which suggests their overall cost advantage is small.
Today, Stockholm is extending the T-bana outward in three direction. A cost breakdown per line extension is available: excluding the depot and rolling stock, the suburban tunnel to Barkarby is $100 million per km, the outer-urban tunnel to Arenastaden in Solna is $138 million per km, and the part-inner urban, part-suburban tunnel to Nacka is $150 million per km. The tunnel to Nacka is a total of 11.5 km, of which about 1 is underwater, broken down into chunks using Skeppsholmen, with the longest continuous underwater segment about 650 meters long. A 9% underwater line with 9% cost premium over an underground line is not by itself proof of much, but it does indicate that the underwater premium is most likely low.
Based on the suggestive evidence of BART and the T-bana, proposing that bare Hudson tunnels should cost about $2-2.5 billion is not preposterous. With an onward connection to Grand Central, the total cost should be $2.5-3 billion. Note that this cost figure does not assume that New York can build anything as cheaply as Stockholm, only that it can build Gateway for the same unit cost as Second Avenue Subway. The project management does not have to be good – it merely has to be as bad as that of Second Avenue Subway, rather than far worse, most likely due to the influence of Amtrak.
The best scenario coming out of canceling Gateway is to attempt a third tunnel project, this time under a government agency that is not poisoned by the existing problems of either Amtrak or Port Authority. The MTA could potentially do it; among the agencies building things in the New York area it seems by far the least incompetent.
If Gateway stays as is, just without federal funding, then the solution is for Amtrak to invest in its own project management capacity. The cost of the Green Line Extension in Boston was reduced from $3 billion to $2.3 billion, of which only $1.1 billion is actual construction and the rest is a combination of equipment and sunk cost on the botched start of the project; MBTA insiders attribute this to the hiring of a new, more experienced project manager. If Gateway can be built for even the same unit cost as Second Avenue Subway, then the existing state commitments are enough to build it to Grand Central and still have about half the budget left for additional tunnels.
Transit and Scale Variance Part 3: Grids
This is my third post about scale variance in transit planning; see parts 1 and 2. In part 1, I discussed how good bus networks exist at a certain scale, which can’t easily be replicated at larger scale (where the slowness of city buses makes them less useful). In part 2, I went over a subway planning feature, especially common in the communist bloc, that again works only at a specific scale, namely cities with enough population for 3-4 subway lines; it gets more complex in larger cities, and cannot be imported to bus networks with 3-4 lines. In this post, I will focus on one scale-variant feature of surface transit: the grid.
The grid works only for surface transit and not for rapid transit, and only at a specific scale, so constrained as to never be maximally useful in an entire city, only in a section of a city. This contrasts with what Jarrett Walker claims about grids. Per Jarrett, grids are the perfect form of a transit network and are for the most part scale-invariant (except in very small networks). One of the impetuses for this post is to push back against this: grids are the most useful at the scale of part of a transit city.
Grid Networks Versus Radial Networks
I’ve written a few posts exhorting subway planners to build their networks in a certain way, which, in the most perfect form, is radial. In particular, tangential subway lines, such as the G train in New York (especially when it ran to Forest Hills), Line 10 in Paris, and Lines 3 and 6 in Shanghai, are weak. When the G train was running to Forest Hills, most local passengers would switch from it to the next Manhattan-bound train, leading New York City Transit to send more Manhattan-bound local subways to Forest Hills and eventually to cut back the G to Long Island City. Based on these examples, I contend that on a subway network, every line should be either radial, serving the CBD, or circumferential, going around the CBD.
My post about New York light rail proposes a network with some lines that are neither: in the Bronx, my proposal is essentially a grid, with north-south routes (Grand Concourse, Webster, 3rd) and east-west ones (161st, Tremont, Fordham) and one that combines both (145th-Southern). Regular commenter NewtonMARunner criticized me for this on Twitter. I answered that the lines in my proposal are based on the busiest buses in the Bronx, but this simply shifts the locus of the question to the existing network: if transit lines should be radial or circumferential, then why are the tangential Bx19 bus (145th-Southern) or the Bx40/42 and Bx36 (Tremont, with a long radial eastern tail) so successful?
To answer this requires thinking more carefully about the role of circumferential routes, which by definition don’t serve the most intensely-used nodes. In Paris, Lines 2 and 6 form a ring that misses five out of six train stations and passes just outside the CBD, and yet they are both busy lines, ranking fourth and fifth in ridership per km. The reason is that they are useful for connecting to radial Metro lines and to some RER lines (namely, the RER A and the southern half of the RER B). Tangential lines miss connections much more easily: in the west, Line 10 here has a decent transfer to Line 9 and a somewhat decent one to Line 8, but to Lines 12 and 13 it’s already not very direct. The G train in New York has the same problem to the south – few connections to lines that actually do go into Manhattan.
Consider the following three possible networks:


The radial network is a typical subway network. The full grid lets you go from everywhere to everywhere with just one transfer, at the cost of having far more route length than the radial network. The partial grid no longer lets you go from everywhere to everywhere easily, and has the outer two lines in each service direction missing city center, but still has more overall route-length than the radial network. The principle here is that a grid plan is useful only if the grid can be complete.
The scale, then, is that rapid transit is so expensive that there’s no money for a complete grid, making a radial plan more appropriate. But surface transit, especially by bus, can be spread across a grid more readily. The Bronx’s size, density, and bus ridership patterns are such that a mostly complete grid is feasible within the western two-thirds of the borough, supplemented by the subway. In this environment, a tangential route is fine because it hits all the radial routes it could, and could provide useful two-seat rides to a large variety of destinations.
Are Grids Really Grids?
Chicago has a relentless bus grid. The three busiest north-south routes are the tangential 8 (Halsted), 9 (Ashland), and 49 (Western), which are 22, 29, and 26 km long respectively. None enters the Loop; Halsted, the easternmost, is at the closest approach 800 meters from the Loop, across a freeway. The two busiest east-west routes, the 77 (Belmont) and 79 (79th), are also far from the Loop.
However, I contend that these routes don’t really form a grid, at least not in the sense that passengers ride between two arbitrary points in Chicago by riding a north-south bus and connecting to an east-west bus. Instead, their outer ends form tails, which people ride to the L, while their inner ends are standard circumferentials, linking two L branches. The L in turn is purely radial and doesn’t follow the Chicago grid, with the Blue Line’s O’Hare Branch, the Orange Line, and the Brown Line all running diagonally.
Vancouver is similar. The north-south routes are radial, veering to enter Downtown. The east-west ones are more circumferential than tangential: they connect the Expo and Canada Lines, and most also connect to UBC. The Broadway buses (9 and 99) pass so close to Downtown Vancouver they’re more tangential, but they also offer the shortest path between the Expo and Canada Lines (making them a strong circumferential) while at the same time serving high job density on Central Broadway (giving them some characteristics of a radial).
In the absence of a radial rail network to connect to, long grid routes are less useful. Cities have a center and a periphery, and the center will always get more ridership, especially transit ridership. The outermost grid routes are often so weak that they should be pruned, but then they weaken the lines they connect to, making it necessary to prune even more lines until the grid is broken.
The Optimal Scale for a Grid
A strong transit grid will not form in a city too small for it. There needs to be a large enough center with enough demand for transit ridership to justify more than a purely radial bus network with a timed transfer. At the same time, the city cannot be too big, or else the arterial buses are too slow to be useful for ordinary work and leisure trips, as in Los Angeles.
What’s more, there is no Goldilocks zone, just right for a grid. Chicago is already too big for a bus grid without the radial rail layer. It’s also too big for what Jarrett calls grid accelerators – that is, rapid transit routes that replace bus grid lines: the Red Line is plausibly a grid accelerator, but the other lines in Chicago are not, and if there were L lines only at grid points, then the Red Line and the one east-west route would get overcrowded heading toward the Loop. Even Vancouver, a compact metro area hemmed by mountains and the ocean, relies on the diagonal Expo Line to serve Downtown and doesn’t really have a grid beyond city limits. A less dense city in the same land area could have a grid, but without much traffic or a strong CBD, cars would always beat transit on time and only the poor would ride the bus.
The scale in which grid networks work more or less on their own seems to be that of Vancouver proper, or that of the Bronx. Vancouver is 115 km^2 and the Bronx is 110 km^2; Vancouver’s bus grid spills over to Metrotown and the Bronx’s to Upper Manhattan, but in both cases these are small increases in the relevant land area.
Tellingly, Vancouver still relies on the bus network to feed SkyTrain; the Canada Line is a grid accelerator, but the Expo Line is not. The Bronx is the more interesting case, because it is not a city or even the center of the city, but rather a dense outlying portion of the city with an internal arterial grid. In both cases, the grid is supplementary to the radial rail core, even if the routes that use it have a lot of independent utility (Metro Vancouver has higher bus ridership than rail ridership, and the Bronx buses combined have slightly more ridership than the combined number of boardings on the Bronx subway stations).
Geographical constraints matter as well. The Bronx and Upper Manhattan are hemmed by water and by the administrative border of the city (which also includes a sharp density gradient), and Vancouver is hemmed by water and by a density gradient in the east. This makes it easier to equip both with grids that are close enough to the complete grid in the middle image above rather than the incomplete one in the third image. The Bronx’s lower-density eastern tails happen to meet up with those of Queens, forming circumferential routes, and also have enough north-south subway lines to feed that they remain useful.
In a transit city, the grid cannot come first. Even if there is a street grid, the spine of the network has to be radial as soon as there is demand for more than two rapid transit lines. The role of surface transit remains feeding rapid transit. Grids look attractive, but the optimal scale for them is awkward: large-scale surface transit grids are too slow, forcing the city to have a rapid transit backbone, and if the city is too small for that then the arterial grid provides too good auto access for public transit to be useful.
The RPA Construction Cost Report
A much-awaited Regional Plan Association report about construction costs in New York has come out, as a supplement to the Fourth Regional Plan, and I’m unimpressed. I thought that I would either enjoy reading the RPA’s analysis, or else be disappointed by it. Instead, I’ve found myself feeling tepid toward most of the analysis; my objections to the report are that its numbers have serious mistakes, that the recommendations at the end conflict with the analysis, and that it seems to overvalue other English-speaking countries, even when their construction costs are the highest in the world outside the US.
The big contrast is with Brian Rosenthal’s expose in the New York Times. The main comparison city to New York there is Paris, where the extension of Metro Line 14 resembles New York’s subway extensions; for the article, Brian talked to construction managers here, and either visited the site himself or talked to people who did, to compare the situation with that of New York. As a result, I learned things from Brian’s article that I did not know before (namely, that the excavation per station for the Line 14 extension wasn’t less voluminous than for Second Avenue Subway). The RPA report gives a few details I wasn’t familiar with, such as escalators’ share of construction costs, but nothing that seems big.
I feel like I slag on the RPA a lot nowadays – it started with their report from three years ago about Outer Borough transit and continued with their wrong approach to Triboro, but more recently I didn’t think much of their take on suburban TOD, or the Gateway project, or the Fourth Regional Plan in general. This isn’t out of malice or jealousy; when I talked to Tom Wright six months ago I sympathized with the political constraints he was operating under. The problem is that sometimes these constraints lead either to unforced errors, or to errors that, while I understand where they come from, are big enough that the organization should have pushed and made sure to avoid them. In the case of the construction cost report, the errors start small, but compound to produce recommendations that are at times counterproductive; agency officials reading this would have no way of reducing costs.
Mistakes in the Numbers
The RPA is comparing New York’s costs unfavorably with those of other cities around the world, as well as one American city (Los Angeles). However, at several points, the numbers appear different from the ones I have seen in the news media. Three places come to mind – the first is a nitpick, the second is more serious but still doesn’t change the conclusions, the third is the most egregious in its implications.
The first place is right at the beginning of the report. In the executive summary, on page 2, the RPA gives its first example of high New York costs:
The Second Avenue Subway (SAS), for example, has the distinction of being the world’s most expensive subway extension at a cost of $807 million per track mile for construction costs alone. This is over 650% more per mile than London’s Northern Line extension to Battersea — estimated at $124 million per track mile.
Both sets of numbers are incorrect – in fact, contradicted by the rest of the document. SAS is $1.7 billion per route-km, which is $850 million per track-km. The Northern line extension to Battersea is also much more expensive. I can’t tell whether these figures are missing something, such as stations or overheads, but as headline numbers, they’re both lowballed.
The second place is when the report discusses station construction costs. Not having seen any advance copy, I wrote about this issue two weeks ago, just before the report came out: the three new SAS stations cost $821, $649, and $802 million, according to the Capital Program Dashboard. In contrast, on pp. 16-17, the RPA gives lower figures for these stations: just $386 million, $244 million, and $322 million. The RPA’s source is “Capital Construction Committee reports,” but my post on station costs looked at some of those and found costs that are not much lower than those reported in the Dashboard. The RPA figures for the last two stations, 86th and 72nd, seem close to the costs of finishes alone, and it’s possible that the organization made a mistake and confused the cost of just finishes (or perhaps just excavation) with the total cost, combining both excavation and finishes.
With the correct costs, the difference from what Paris spends on a station (about $110 million on average) seems so stark that the recommendations must center station construction specifically, and yet they don’t.
The third and most problematic mistake is table 10 on page 50, which lists a number of subway projects and their costs. The list is pretty short, with just 11 items, of which 3 are in New York, another is in Los Angeles, one is in Toronto, and 2 are in London. The Toronto project, the Spadina subway extension to Vaughan, and one of the London projects, the Northern line extension, are both lowballed. The RPA says that the Northern line extension’s cost is $1.065 billion, but the most recent number I’ve seen is £1.2 billion, which in PPP terms is $1.7 billion. And the Vaughan extension, listed as $1.961 billion in the report, is now up to C$3.2 billion, about $2.55 billion in PPP terms. Perhaps the RPA used old numbers, before cost escalations, but in such a crucial report it’s important to update cost estimates even late in the process.
But most worryingly, the costs on table 10 also include mistakes in the other direction, in Paris and Tokyo. The cost estimate listed for Line 14 South in Grand Paris Express is $4.39 billion. But the Cour des Comptes’ report attacking Grand Paris Express’s cost overruns lists the line’s cost as only €2.678 billion, or about $3.3 billion; this is in 2012 euros, but French inflation rates are very low, well below 1% a year, and at any rate, even applying American inflation rates wouldn’t get the cost anywhere near $4 billion. In Tokyo, the RPA similarly inflates the cost of the Fukutoshin Line: it gives it as $3.578 billion, but a media report after opening says the cost was ¥250 billion, or about $2.5 billion in today’s PPP conversion, with even less inflation than in France.
I can understand why there would be downward mistakes. Reports like this take a long time to produce, and then they take even longer to revise even after they are supposedly closed to further edits; I am working on a regional rail report for TransitMatters that has been in this situation for three months, with last-minute changes, reviews by stakeholders, and printing delays. However, the upward mistakes in Paris and Tokyo are puzzling. It’s hard to explain why, since the RPA’s numbers are unsourced; it’s possible they heard them from experts, but didn’t bother to write down who those experts were or to check their numbers.
The Synthesis Doesn’t Follow the Analysis
Manuel Melis Maynar’s writeup in Tunnelbuilder about how as CEO of Madrid Metro he delivered subway construction for, in today’s money, around $60 million per km, includes a number of recommendations. The RPA report cites his writeup on several occasions, as well as his appearance at the Irish Parliament. It also cites secondary sources about Madrid’s low construction costs, which appear to rely on Melis’s analysis or at least come to the same conclusions independently. However, the RPA’s set of recommendations seems to ignore Melis’s advice entirely.
The most glaring example of this is design-build. Melis is adamant that transit agencies separate design from construction. His explanation is psychological: there are always some changes that need to be made during construction (one New York-based construction manager, cited on p. 38 of the RPA study, says “there is no 100% design”), and contractors that were involved in the design are more likely to be wedded to their original plans and less flexible about making little changes. This recommendation of Melis’s is absent from the report, and on the contrary, the list of final recommendations includes expansion of design-build, a popular technique among reformers in New York and in a number of English-speaking cities.
Another example is procurement. I have heard the same explanation for high New York costs several times since I first brought up the issue in comments on Second Avenue Sagas: the bidding process in New York picks the lowest-cost proposal regardless of technical merit (Madrid, in contrasts, scores proposals 50% on technical merit, 30% on cost, and 20% on speed), and to avoid being screwed by dishonest contractors, the state writes byzantine, overexacting specs. As a result, nobody wants to do business with public works in New York, which means that in practice very few companies bid, leading to one-bid contracts. Brian’s article in the New York Times goes into how contractors have an MTA premium since doing business with the MTA is so difficult, and there’s also less competition, so they charge monopoly rates.
The RPA report’s analysis mentions this (pp. 3-4):
In addition, the MTA’s practice of selecting the lowest qualified bidder, even though they are permitted to issue Requests-for-Proposals, has resulted in excessive rebidding and the selection of teams that cannot deliver, resulting in millions of dollars in emergency repairs.
However, the list of recommendations at the end does not include any change to procurement practices to consider technical merit. The recommendations include post-project review for future construction, faster environmental review, reforms to labor rules, and value capture, but nothing about reforming the procurement process to consider technical merit.
Finally, the report talks about the problem of change orders repeatedly, on pp. 3, 15-16, and 38-39, blaming the proliferation of change orders for part of the cost escalation on SAS. Melis addresses this question in his writeup, saying that contracts should not be awarded for a lump sum but rather be itemized, so that change orders come with pre-agreed costs per item. None of this made it to the final recommendations.
There’s a World Outside the Anglosphere
If the report’s recommendations are not based on its own analysis, or on correct construction cost figures, then what are they based on? It seems that, like all failed reform ideas around the US, the RPA is shopping for ideas from other American cities or at least English-speaking ones that look good. Its recommendations include “adopt London’s project delivery model” and “expand project insurance and liability models,” the latter of which is sourced to the UK and Australia. Only one recommendation so much as mentions a non-English-speaking city: “develop lessons learned and best-practice guidance as part of a post-project review” mentions Madrid in passing, but focuses on Denver and Los Angeles.
This relates to the pattern of mistakes in the cost figures. Were the numbers on table 10 right, the implication would be that London, Paris, and Tokyo all have similar construction costs, at $330, $350, and $400 million per km, and Toronto is cheaper, at $230 million per km. In this situation, London would offer valuable lessons. Unfortunately, the RPA’s numbers are wrong. Using correct numbers, London’s costs rise to $550 million per km, while those of Paris and Tokyo fall to $260 and $280 million. Toronto’s costs rise to $300 million per km, which would be reasonable for an infill subway in a dense area (like the Fukutoshin Line and to some extent the Metro Line 14 extension), but are an outrage for a suburban extension to partly-undeveloped areas.
Using correct numbers, the RPA should have known to talk to people in countries that don’t speak English. Many of the planners and engineers in those countries speak English well as a second language. Many don’t, but New York is a large cosmopolitan city with immigrants with the required language skills, especially Spanish.
Nonetheless, the RPA report, which I am told cost $250,000 to produce, does not talk to experts in non-English-speaking countries. The citations of Melis are the same two English-language ones I have been citing for years now; there is no engagement with his writings on the subject in Spanish or his more recent English-language work (there’s a paper he coauthored in 2015 that I can’t manage to get past the paywall update: kind souls with academic access sent me a copy and it’s not as useful as I’d hoped from the abstract), nor does the RPA seem to have talked to managers in Madrid (or Barcelona) today. Across more than 200 footnotes, 30-something are sourced to “expert interviews,” and of those all but a handful are interviews with New York-based experts and the rest are interviews with London-based ones.
As a result, while the report is equipped to explain New York’s internal problems, it fails as a comparative piece. The recommendations themselves are primarily internal, based on things Americans have been discussing among themselves for years: streamlining environmental review, simplifying labor rules, expanding design-build.
The labor reforms mentioned include exactly one specific case of excessive staffing, reported in the New York Times (and, beforehand, on an off-hand remark by then-MTA Capital Construction chief Michael Horodniceanu), about the number of workers it takes to staff a tunnel-boring machine. The New York Times article goes into more detail about the entire process, but the RPA report ignores that in favor of the one comparison that had been going around Transit Twitter for years. Instead of proposing specifics for reducing headcounts, the report talks about changing the way workers are paid for each day, relying on internal reforms proposed by people dissatisfied with the unions rather than on any external analysis.
The Cycle of Failure
I’ve been reading policy papers for maybe a decade – mostly American, a few Israeli or Canadian or British or French. There’s a consistent pattern in that they often treat the practices of what they view as a peer city or country as obvious examples of what to do. For example, an American policy paper on Social Security privatization might explain the Chilean system, and recommend its implementation, without much consideration of whether it’s really best industry practice. Such papers end up at best moving sideways, and at worst perpetuate the cycle of failure, by giving governments the appearance of reform while they in fact cycle between bad options, or occasionally stumble upon a good idea but then don’t understand how to implement it correctly.
If New York wants to study whether design-build is a good idea, it’s not enough to put it in the list of recommendations. It needs to do the legwork and read what the best experts say (e.g. Melis is opposed to it) and look at many cities at once to see what they do. I would feel embarrassed writing a long report like this with only 7 case studies from outside the US. I’d want to examine many more: on the cheap side, Stockholm, Milan, Seoul, Barcelona, Madrid, Athens, Naples, Helsinki; on the expensive side, London, Singapore, Hong Kong, Toronto, Melbourne, Munich, Amsterdam; in between, Paris, Tokyo, Brussels, Zurich, Copenhagen, Vienna. On anything approaching the RPA’s budget for the paper, I’d connect with as many people in these places as I could in order to do proper comparative analysis.
Instead, the RPA put out a paper that acknowledges the cost difference, but does not make a real effort to learn and improve. It has a lot of reform ideas, but most come from the same process that led to the high construction costs New York faces today, and the rest come from London, whose construction costs would astound nearly everyone in the world outside the US.
One of the things I learned working with TransitMatters is that some outside stakeholders, I haven’t been told who, react poorly to non-American comparison cases, especially non-English-speaking ones. Ignorant of the world beyond their borders, they make up excuses for why knowledge that they don’t have is less valuable. Even within the group I once had to push back against the cycle of failure when someone suggested a nifty-looking but bad idea borrowed from a low-transit-use American city. The group’s internal structure is such that it’s easy for bad ideas to get rejected, but this isn’t true of outside stakeholders, and from my conversation with Tom Wright about Gateway I believe the RPA feels much more beholden to the same stakeholders.
The cycle of failure that the RPA participates in is not the RPA’s fault, or at least not entirely. The entire United States in general and New York in particular is resistant to outside ideas. The political system in New York as well as the big nonprofits forms an ecosystem of Americans who only talk to other Americans, or to the occasional Canadian or Brit, and let bad ideas germinate while never even hearing of what best industry practices are. In this respect the RPA isn’t any worse than the average monolingual American exceptionalist, but neither is it any better.
The Subway in New York is not at Capacity
It seems to be common wisdom that the subway in New York is at capacity. Last year, the New York Times ran an article that repeated the MTA’s claims that growing delays come from overcrowding (which they don’t). A few weeks ago the NY Times quoted Riders Alliance campaign manager Rebecca Bailin saying “Our system is at capacity” and “subways are delayed when people can’t fit in them.” So far so good: some parts of the subway have serious capacity issues, which require investment in organization and electronics (but not concrete) to fix. But then some people make a stronger claim saying that the entire system is at capacity and not just parts of it, and that’s just wrong.
A few days ago there was an argument on Twitter involving the Manhattan Institute’s Nicole Gelinas and Alex Armlovich on one side and Stephen Smith on the other. Stephen made the usual YIMBY point that New York can expect more population growth in the near future. Nicole argued instead that no, there’s no room for population growth, because the subway is at capacity. Alex chimed in,
People are not going to be willing to pay market rents for places they can’t commute from. A large number of folks underestimate the self-regulation of NYC housing–it just can’t get that bad, because people can always just move to Philly
Like, if upzone Williamsburg, people who move into new housing aren’t going to try to ride the L–they’ll only come if they can walk/bike or ride in off-peak direction. Just like people are leaving in response to the shutdown. Neighborhoods and cities are in spatial equilibrium!
I responded by talking about rents, but in a way my response conceded too much, by focusing on Williamsburg. The L train has serious crowding problems, coming from lack of electrical capacity to run more than 20 trains per hour per direction (the tracks and signals can handle 26 trains, and could handle more if the L train had tail tracks at its 8th Avenue terminal). However, the L train is atypical of New York. The Hub Bound Report has data on peak crowding into the Manhattan core, on table 20 in appendix II. The three most crowded lines entering the Manhattan core, measured in passengers per floor area of train, are the 2/3, 4/5, and L. Those have 3.6-3.8 square feet per passenger, or about 3 passengers per m^2, counting both seated and standing passengers; actual crowding among standees is higher, around 4 passengers per m^2. Using a study of seating and standing capacity (update 2020-2-25: this is a non-link-rotted version of the study), we can get exact figures for average space per standee, assuming all seats are occupied:
| Line | Peak tph | Seats | Standee area | Passengers | Passengers/m^2 |
| 1 | 18 | 7,920 | 3,312 | 13,424 | 1.66 |
| 2/3 Uptown | 23 | 9,200 | 4,393 | 28,427 | 4.38 |
| A/D | 17 | 9,792 | 3,980 | 23,246 | 3.38 |
| B/C | 13 | 6,994 | 2,899 | 12,614 | 1.94 |
| 4/5 Uptown | 24 | 8,640 | 4,752 | 28,230 | 4.12 |
| 6 | 21 | 9,240 | 3,864 | 21,033 | 3.03 |
| F Queens | 13 | 5,967 | 3,560 | 17,816 | 3.33 |
| N/Q/R | 23 | 10,908 | 6,179 | 29,005 | 2.93 |
| E/M | 22 | 8,568 | 5,856 | 22,491 | 2.38 |
| 7 | 24 | 9,504 | 5,227 | 20,895 | 2.18 |
| L | 19 | 6,080 | 4,321 | 23,987 | 4.14 |
| J/M/Z | 19 | 6,384 | 4,363 | 16,657 | 2.68 |
| F Brooklyn | 14 | 6,426 | 3,834 | 14,280 | 2.05 |
| B/D/N/Q (4 tracks) | 38 | 18,612 | 10,008 | 43,550 | 2.49 |
| A/C | 20 | 10,112 | 4,504 | 21,721 | 2.58 |
| 2/3 Brooklyn | 16 | 6,400 | 3,056 | 13,536 | 2.34 |
| R | 8 | 4,608 | 1,873 | 5,595 | 0.53 |
| 4/5 Brooklyn | 20 | 7,200 | 3,960 | 16,504 | 2.35 |
Three additional snags are notable: crowding in 53rd Street Tunnel looks low, but it averages high crowding levels on the E with low crowding levels on the M (see review), and the 1 and 7 achieve peak crowding well outside Midtown (the 1 at 96th at the transfer to the 2/3 and the 7 at Jackson Heights at the transfer to the E/F) whereas the table above only counts crowding entering Manhattan south of 59th Street. But even with these snags in mind, there is a lot of spare capacity on the Upper West Side away from 72nd and Broadway, and in Queens in Long Island City, where passengers can take the undercrowded 7 or M. Crowding in Brooklyn is also low, except on the L. In both Brooklyn and on the West Side locals there’s also track capacity for more trains if they are needed, but New York City Transit doesn’t run more trains since peak crowding levels are well below design guidelines.
This isn’t a small deal. Williamsburg is where there is the most gentrification pressure, but the Upper West Side is hardly a slum – it’s practically a byword for a rich urban neighborhood. The trains serving Brooklyn pass through some tony areas (Park Slope) and gentrified ones (South Brooklyn), as well as more affordable middle-class areas further south. From NYCT’s perspective, developing South Brooklyn and Southern Brooklyn is especially desirable, since these areas are served by trains that run through to Queens, Uptown Manhattan, and the Bronx, and with the exception of the B are all much more crowded at the other end; in effect, lower subway demand in Brooklyn means that NYCT is dragging unused capacity because of how its through-service is set up.
Actual perceived crowding is always higher than the average. The reason is that if there is any variation in crowding, then more passengers see the crowded trains. For example, if half the trains have 120 passengers and half have 40, then the average number of passengers per train is 80 but the average perceived number is 100, since passengers are three times likelier to be on a 120-person train than on a 40-person train.
Subway in New York has high variation in crowding, probably unusually high by international standards, on account of the extensive branching among the lines. The E/M example is instructive: not only are the E trains more crowded than the M trains, but also they come more often, so instead of a perfect E-M alternation through 53rd Street, there are many instances of E-E-M, in which an E train following the M is more crowded than an E train following another E train. I criticized NYCT’s planning guidelines on this account in 2015, and believe it contributes to higher crowding levels on some lettered lines than the table shows. However, the difference cannot be huge. Evidently, in the extreme example of trains with 40 or 120 passengers, the perceived crowding is only 25% higher than the actual average, and even the maximum crowding is only 50% higher. Add 50% to the crowding level of every branching train in Brooklyn and you will still be below the 2/3 and 4/5 in Uptown Manhattan.
So on the Upper West Side and in Long Island City and most of Brooklyn, there is spare capacity. But there’s more: since the report was released, Second Avenue Subway opened, reducing crowding levels on the Upper East Side. Second Avenue Subway itself only has the Q, and could squeeze additional trains per hour by shuffling them around from other parts of the system. In addition, the 4/5 and 6 have reportedly become much more tolerable in the last year, which suggests there is spare capacity not only on the Upper East Side but also in the Bronx.
Moreover, because the local trains on Queens Boulevard aren’t crowded, additional development between Jackson Heights and Queens Plaza wouldn’t crowd the E or F trains, but the underfull M and R trains. This creates a swath of the borough, starting from Long Island City, in which new commuters would not have a reason to use the parts of the system that are near capacity. It’s especially valuable since Long Island City has a lot of new development, which could plausibly spill over to the east as the neighborhood fills; in contrast, new development on the Upper West Side runs into NIMBY problems.
Finally, the residential neighborhoods within the Manhattan core, like the Village, are extremely desirable. They also have active NIMBY groups, fighting tall buildings in the guise of preservation. But nowhere else is it guaranteed that new residential development wouldn’t crowd peak trains: inbound trains from Brooklyn except the 4/5 are at their peak crowding entering Lower Manhattan rather than Midtown, so picking up passengers in between is free, and of course inbound trains from Uptown and Queens drop off most of their peak morning load in Midtown.
It’s not just a handful of city neighborhoods where the infrastructure has room. It’s the most desirable residential parts of Manhattan and Brooklyn, and large swaths of middle-class areas in Brooklyn and parts of Queens. In those areas, the subway is not at capacity or even close to it, and there is room to accommodate new commuters at all hours of day. To the extent there isn’t new development there, the reason is, in one word, NIMBYism.
Construction Costs: Metro Stations
It is relatively easy to come up with a database of urban rail lines and their construction costs per kilometer. Construction costs are public numbers, reported in the mass media to inform citizens and taxpayers of the costs of public projects. However, the next step in understanding what makes American construction costs (and to a lesser extent common law construction costs) so high is breaking down the numbers. The New York Times published an excellent investigative piece by Brian Rosenthal looking at why Second Avenue Subway specifically is so expensive, looking at redundant labor and difficulties with contractors. But the labor examples given, while suggestive, concern several hundred workers, not enough for a multibillion dollar cost difference. More granularity is needed.
After giving examples of high US construction costs outside New York, I was asked on social media whether I have a breakdown of costs by item. This motivated me to look at station construction costs. I have long suspected that Second Avenue Subway splurged on stations, in two ways: first, the stations have full-length mezzanines, increasing the required amount of excavation; and second, the stations were mostly excavated from inside the tunnel, with only a narrow vertical access shaft, whereas most subway lines not crossing under older lines have cut-and-cover stations. The data I’m going to present seems to bear this out.
However, it is critical to note that this data is much sparser than even my original post about construction costs. I only have data for three cities: New York, London, and Paris.
In New York, Second Avenue Subway consisted of three new stations: 96th Street, 86th Street, and 72nd Street. Their costs, per MTA newsletters: 72nd Street cost $740 million, 86th Street cost $531 million, 96th Street cost $347 million for the finishes alone (which were 40% of the costs of 72nd and 86th). MTA Capital Construction also provides final numbers, all somewhat higher: 72nd Street cost $793 million, 86th Street cost $644 million, 96th Street cost $812 million. The 96th Street cost includes the launch box for the tunnel-boring machine, but the other stations are just station construction. The actual tunneling from 96th to 63rd Street, a little less than 3 km, cost $415 million, and systems cost another $332 million. Not counting design, engineering, and management costs, stations were about 75% of the cost of this project.
In Paris, Metro stations are almost a full order of magnitude cheaper. PDF-p. 10 of a report about Grand Paris Express gives three examples, all from the Metro rather than GPX or the RER, and says that costs range from €80 million to €120 million per station. Moreover, the total amount of excavation, 120,000 m^3, is comparable to that involved in the construction of 72nd Street, around 130,000 m^3, and not much less than that of 86th Street, around 160,000 m^3 (both New York figures are from an article published in the Gothamist).
A factsheet about the extension of Metro Line 1 to the east breaks down construction costs as 40% tunneling, 30% stations, 15% systems, and 15% overheads. With three stations and a total cost of €910 million over 5 km, this is within the range given by the report for GPX. The tunneling itself is according to this breakdown €364 million. An extension of Line 12 to the north points toward similar numbers: it has two stations and costs €175 million, with all tunneling having already been built in a previous extension. Piecing everything together, we get the following New York premiums over Paris:
Tunneling: about $150 million per km vs. $90 million, a factor of 1.7
Stations: about $750 million per station vs. $110 million, a factor of 6.5
Systems: about $110 million per km vs. $35 million, a factor of 3.2
Overheads and design: 27% of total cost vs. 15%, which works out to a factor of about 11 per km or a factor of 7 per station
Rosenthal’s article documents immense featherbedding in staffing the TBMs in New York, explaining much more than a factor of 1.7 cost difference. This is not by itself surprising: Parisian construction costs are far from Europe’s lowest, and there is considerable featherbedding in operations (for example, train driver productivity is even lower than in New York). It suggests that Paris, too, could reduce headcounts to make tunnel construction cheaper, to counteract the rising construction costs of Grand Paris Express.
But the situation with the stations is not just featherbedding: the construction technique New York chose is more expensive. The intent was to reduce street disruption by avoiding surface construction. Having lived on East 72nd Street for a year during construction, I can give an eyewitness account of what reducing disruption meant: there was a giant shaft covering about half the width of Second Avenue, reducing sidewalk width to 7 feet, between 72nd and 73rd Streets. This lasted for years after I’d moved away, since this method is so expensive and time-consuming. Under cut-and-cover, this disruption would cover several blocks, over the entire length of the station, but it would be finished quickly: the extension of Line 12 is currently in the station digging phase, estimated to take 18 months.
London provides a useful sanity check. Crossrail stations are not cut-and-cover, since the line goes underneath the entirety of the Underground network in Central London. Canary Wharf is built underwater, with 200,000 m^3 of excavation and 100,000 m^3 of water pumped; it’s technically cut from the top, but is nothing like terrestrial cut-and-cover techniques. The cost is £500 million. It’s a more complex project than the comparably expensive stations of Second Avenue Subway, but helps showcase what it takes to build stations in areas where cut-and-cover is not possible.
Another useful sanity check comes from comparing subway lines that could use cut-and-cover stations and subway lines that could not. Crossrail is one example of the latter. The RER A’s central segment, from Nation to Auber, is another: Gare de Lyon and Chatelet-Les Halles were built cut-and-cover, but in the case of Les Halles this meant demolishing the old Les Halles food market, excavating a massive station, and moving the Metro Line 4 tunnel to be closer to the newly-built station. The total excavated volume for Les Halles was about 560,000 m^3, and photos show the massive disruption, contributing to the line’s cost of about $750 million per km in today’s money, three times what Paris spends on Metro extensions. In London, all costs are higher than in Paris, but without such difficult construction, the extension of the Underground to Battersea is much cheaper than Crossrail, around $550 million per km after cost overruns and mid-project redesigns.
The good news is that future subway extensions in the United States can be built for maybe $500-600 million per km rather than $1.5-2 billion if stations are dug cut-and-cover. This is especially useful for Second Avenue Subway’s phase 2, where the segments between the station boxes already exist thanks to the aborted attempt to build the line in the 1970s, and thus cut-and-cover stations could simply connect to already-dug tunnels. It could also work for phases 3 and 4, which cross over rather than under the east-west lines connecting Manhattan with Queens and Brooklyn. The same technique could be used to build outer extensions under Utica and Nostrand in Brooklyn. Among the top priorities for New York, only a crosstown subway under 125th Street, crossing under the north-south line, would need the more expensive station construction technique; for this line, a large-diameter TBM would be ideal, since there would be plenty of space for vertical circulation away from the crossing subway lines.
There would still be a large construction cost premium. Changing the construction method is not enough to give New York what most non-English-speaking first-world cities have: getting down to $200 million per kilometer would require changes to procurement and labor arrangements, to encourage competition between the contractors and more efficient use of workers. Evidently, overheads are a larger share of Second Avenue Subway cost than of Parisian costs. But saving money on stations could easily halve construction costs, and aspirationally reduce them by a factor of three or four.
High-Speed Rail from New Rochelle to Greens Farms: Impacts, Opportunities, and Analysis
I was asked by Greg Stroud of SECoast to look at HSR between New Rochelle and Greens Farms. On this segment (and, separately, between Greens Farms and Milford), 300+ km/h HSR is not possible, but speedups and bypasses in the 200-250 area are. The NEC Future plan left the entire segment from New York to New Haven as a question mark, and an inside source told me it was for fear of stoking NIMBYism. Nonetheless, SECoast found a preliminary alignment sketched by NEC Future and sent it to me, which I uploaded here in Google Earth format – the file is too big to display on Google Maps, but you can save and view it on your own computer. Here’s my analysis of it, first published on SECoast, changed only on the copy edit level and on English vs. metric units.
The tl;dr version is that speeding up intercity trains (and to some extent regional trains too) on the New Haven Line is possible, and requires significant but not unconscionable takings. The target trip time between New York and New Haven is at the lower end of the international HSR range, but it’s still not much more than a third of today’s trip time, which is weighed down by Amtrak/Metro-North agency turf battles, low-quality trains, and sharp curves.
The New Haven Line was built in the 1840s in hilly terrain. Like most early American railroads, it was built to low standards, with tight curves and compromised designs. Many of these lines were later replaced with costlier but faster alignments (for example, the Northeast Corridor in New Jersey and Pennsylvania), but in New England this was not done. With today’s technology, the terrain is no problem: high-speed trains can climb 3.5-4% grades, which were unthinkable in the steam era. But in the 170 years since the line opened, many urban and suburban communities have grown along the railroad right of way, and new construction and faster alignments will necessarily require significant adverse impacts to communities built along the Northeast Corridor.
This analysis will explain some of the impacts and opportunities expanding and modernizing high-speed rail infrastructure on or near the New Haven Line—and whether such an investment is worthwhile in the first place. There are competing needs: low cost, high speed, limited environmental impact, good local service on Metro-North. High-speed rail can satisfy each of them, but not everywhere and not at the same time.
The Northeast Corridor Future (NEC Future) preferred alternative, a new plan by the Federal Railroad Administration to modernize and expand rail infrastructure between Washington and Boston, proposes a long bypass segment parallel to the New Haven Line, between Rye and Greens Farms. The entire segment is called the New Rochelle-Greens Farms bypass; other segments are beyond the scope of this document.
Structure and Assumptions
The structure of this write-up is as follows: first, technical explanations of the issues with curves, with scheduling commuter trains and high-speed trains on the same track, and with high-speed commuting. Then, a segment-by-segment description of the options:
- New Rochelle-Rye, the leadup to the bypass, where scheduling trains is the most difficult.
- Rye-Cos Cob, the first bypass.
- The Cos Cob Bridge, a decrepit bridge for which the replacement is worth discussing on its own.
- Cos Cob-Stamford, where the preferred alternative is a bypass, but a lower-impact option on legacy track is as fast and should be studied.
- Stamford-Darien, where another bypass is unavoidable, with significant residential takings, almost 100 houses in one possibility not studied in the preferred alternative.
- Norwalk-Greens Farms, a continuation of the Darien bypass in an easier environment.
The impacts in question are predominantly noise, and the effect of takings. The main reference for noise emissions is a document used for California High-Speed Rail planning, using calibrated noise levels provided by federal regulators. At 260 km/h, higher than trains could attain in most of the segment in question, trains from the mid-1990s 45 meters away would be comparable to a noisy urban residential street; more recent trains, on tracks with noise barriers, would be comparable to a quiet urban street. Within a 50-meter (technically 150 feet) zone, adverse impact would require some mitigation fees.
At higher speed than 260 km/h, the federal regime for measuring train noise changes: the dominant factor in noise emissions is now air resistance around the train rather than rolling friction at the wheels. This means two things: first, at higher speed, noise emissions climb much faster than before, and second, noise barriers are less effective, since the noise is generated at the nose and pantograph rather than the wheels. At only one place within the segment are speeds higher than about 260 km/h geometrically feasible, in Norwalk and Westport, and there, noise would need to be mitigated with tall trees and more modern, aerodynamic trains, rather than with low concrete barriers.
This analysis excludes impact produced by some legacy trains, such as the loud horns at grade crossings; these may well go away in a future regulatory reform, as the loud horns serve little purpose, and the other onerous federal regulations on train operations are being reformed. But in any case, the mainline and any high-speed bypass would be built to high standards, without level crossings. Thus noise impact is entirely a matter of loud trains passing by at high speed.
Apart from noise and takings, there are some visual impacts coming from high bridges and viaducts. For the most part, these are in areas where the view the aerials block is the traffic on I-95. Perhaps the biggest exception is the Mianus River, where raising the Cos Cob Bridge has substantial positive impact on commuter train operations and not just intercity trains.
Curves
The formula for the maximum speed on a curve is as follows:

If all units are metric, and speed is in meters per second, this formula requires no unit conversion. But as is common in metric countries, I will cite speed in kilometers per hour rather than meters per second; 1 m/s equals 3.6 km/h.
Lateral acceleration is the most important quantity to focus on. It measures centrifugal force, and has a maximum value for safety and passenger comfort. But railroads decompose it into two separate numbers, to be added up: superelevation (or cant), and cant deficiency (or unbalanced superelevation, or underbalance).
Superelevation means banking the tracks on a curve. There is an exact speed at which trains can run where the centrifugal force exactly cancels out the banking, but in practice trains tend to run faster, producing additional centrifugal force; this additional force is called cant deficiency, and is measured as the additional hypothetical cant required to exactly balance.
If a train sits still on superelevated track, or goes too slowly, then passengers will feel a downward force, toward the inside of the curve; this is called cant excess. On tracks with heavy freight traffic, superelevation is low, because slow freight trains would otherwise be at dangerous cant excess. But the New Haven Line has little freight traffic, all of which can be accommodated on local tracks in the off-hours, and thus superelevation can be quite high. Today’s value is 5” (around 130 mm), and sometimes even less, but the maximum regulatory value in the United States is 7” (around 180 mm), and in Japan the high-speed lines can do 200 mm, allowing tighter curves in constrained areas.
Cant deficiency in the United States has traditionally been very low, at most 3” (75 mm). But modern trains can routinely do 150 mm, and Metro-North should plan on that as well, to increase speed. The Acela has a tilting mechanism, allowing 7”; the next-generation Acelas are capable of 9” cant deficiency (230 mm) at 320 km/h; this document will assume the sum total of cant and cant deficiency is 375 mm (the new Acela trainsets could do 200 mm cant deficiency with 175 mm cant, or Japanese trainsets could do 175 mm cant deficiency with 200 mm cant). This change alone, up from about 200 mm today, enough to raise the maximum speed on every curve by 37%. At these higher values of superelevation and cant deficiency, a curve of radius 800 meters can support 160 km/h.
Scheduling and Speed
The introduction of high-speed rail between New York and New Haven requires making some changes to timetabling on the New Haven Line. In fact, on large stretches of track on this line, especially in New York State, the speed limit comes not from curves or the physical state of the track, but from Metro-North’s deliberately slowing Amtrak down to the speed of an express Metro-North train, to simplify scheduling and dispatching. This includes both the top speed (90 mph/145 km/h in New York State, 75 mph/120 km/h in Connecticut) and the maximum speed on curves (Metro-North forbids the Acela to run at more than 3”/75 mm cant deficiency on its territory).
The heart of the problem is that the corridor needs to run trains of three different speed classes: local commuter trains, express commuter trains, and intercity trains. Ideally, this would involve six tracks, two per speed class, much like the four-track mainlines with two speed classes on the subway in New York (local and express trains). However, there are only four tracks. This means that there are four options:
- Run only two speed classes, slowing down intercity trains to the speed of express commuter trains.
- Run only two speed classes, making all commuter trains local.
- Expand the corridor to six tracks.
- Schedule trains of three different speed classes on just four tracks, with timed overtakes allowing faster trains to get ahead of slower trains at prescribed locations.
The current regime on the line is option #1. Option #2 would slow down commuters from Stamford and points east too much; the New Haven Line is too long and too busy for all-local commuter trains. Option #3 is the preferred alternative; the problem there is the cost of adding tracks in constrained locations, which includes widening viaducts and rebuilding platforms.
Option #4 has not been investigated very thoroughly in official documents. The reason is that timed overtakes require trains to be at a specific point at a specific time. Amtrak’s current reliability is too poor for this. However, future high-speed rail is likely to be far more punctual, with more reliable equipment and infrastructure. Investing in this option would require making some targeted investments toward reliability, such as more regular track and train maintenance, and high platforms at all stations in order to reduce the variability of passenger boarding time.
Moreover, at some locations, there are tight curves on the legacy New Haven Line that are hard or impossible to straighten in any alignment without long tunnels. South of Stamford, this includes Rye-Greenwich.
This means that, with new infrastructure for high-speed rail, the bypass segments could let high-speed trains overtake express commuter trains. The Rye-Greenwich segment is especially notable. High-speed rail is likely to include a bypass of Greenwich station. Thus, express commuter trains could stop at Greenwich, whereas today they run nonstop between Stamford and Manhattan, in order to give intercity trains more time to overtake them. A southbound high-speed trains would be just behind an express Metro-North train at Stamford, but using the much greater speed on the bypass, it would emerge just ahead of it at Rye. This segment could be built separately from the rest of the segment, from Stamford to Greens Farms and beyond, because of its positive impact on train scheduling.
It is critical to plan infrastructure and timetable together. With a decision to make express trains stop at Greenwich, infrastructure design could be simpler: there wouldn’t be a need to add capacity by adding tracks to segments that are not bypassed.
High-Speed Commuting
A junior consultant working on NEC Future who spoke to me on condition of anonymity said that there was pressure not to discuss fares, and at any rate the ridership model was insensitive to fare.
However, this merits additional study, because of the interaction with commuter rail. If the pricing on high-speed rail is premium, as on Amtrak today, then it is unlikely there will be substantial high-speed commuting to New York from Stamford and New Haven. But if there are tickets with low or no premium over commuter rail, with unreserved seating, then many people would choose to ride the trains from Stamford to New York, which would be a trip of about 20 minutes, even if they would have to stand.
High-speed trains are typically longer than commuter trains: 16 cars on the busier lines in Japan, China, and France, rather than 8-12. This is because they serve so few stops that it is easier to lengthen every platform. This means that the trains have more capacity, and replacing a scheduled commuter train with a high-speed train would not compromise commuter rail capacity.
The drawback is that commuters are unlikely to ride the trains outside rush hour, which only lasts about 2 or 3 hours a day in each direction. In contrast, intercity passengers are relatively dispersed throughout the day. Capital investment, including infrastructure and train procurement, is based on the peak; reducing the ratio of peak to base travel reduces costs. The unreserved seat rule, in which there is a small premium over commuter rail for unreserved seats (as in Germany and Japan) and a larger one for reserved seats, is one potential compromise between these two needs (flat peak, and high-speed commuter service).
New Rochelle-Rye
The track between New Rochelle and Rye is for the most part straight. Trains go 145 km/h, and this is because Metro-North slows down intercity trains for easier dispatching. The right-of-way geometry is good for 180 km/h with tilting trains and high superelevation; minor curve modifications are possible, but save little time. The big item in this segment concerns the southern end: New Rochelle.
At New Rochelle, the mainline branches in two: toward Grand Central on the New Haven Line, and toward Penn Station on the Hell Gate Line, used by Amtrak and future Penn Station Access trains. This branching is called Shell Interlocking, a complex of track switches, all at grade, with conflicts between trains in opposite directions. All trains must slow down to 30 mph (less than 50 km/h), making this the worst speed restriction on the Northeast Corridor outside the immediate areas around major stations such as Penn Station and Philadelphia 30th Street Station, where all trains stop.
The proposed (and only feasible) solution to this problem involves grade-separating the rails using flyovers, a project discussed by the FRA at least going back to 1978 (PDF-p. 95). This may involve some visual impact, or not—there is room for trenching the grade-separation rather than building viaducts. It is unclear how much that would cost, but a flyover at Harold Interlocking in Queens for East Side Access, which the FRA discussed in the same report, cost $300 million dollars earlier this decade. Harold is more complex than Shell, since it has branches on both sides and is in a more constrained location; it is likely that Shell would cost less than Harold’s $300 million. Here is a photo of the preferred alignment:
The color coding is, orange is viaducts (including grade separations), red is embankments, and teal is at-grade. This is the Northeast Corridor, continuing south on the Hell Gate Line to Penn Station, and not the Metro-North New Haven Line, continuing west (seen in natural color in the photo) to Grand Central.
A Shell fix could also straighten the approach from the south along the Hell Gate Line, which is curvy. The curve is a tight S, with individual curves not too tight, but the transition between them constraining speed. The preferred alignment proposes a fix with a kilometer of curve radius, good for 180 km/h, with impact to some industrial sites but almost no houses and no larger residential buildings. It is possible to have tighter curves, at slightly less cost and impact, or wider ones. Slicing a row of houses in New Rochelle, east of the southern side of the S, could permit cutting off the S-curve entirely, allowing 240 km/h; the cost and impact of this slice relative to the travel time benefit should be studied more carefully and compared with the cost per second saved from construction in Connecticut.
The main impact of high-speed rail here on ordinary commuters is the effect on scheduling. With four tracks, three train speed classes, and heavy commuter rail traffic, timetabling would need to be more precise, which in turn would require trains to be more punctual. In the context of a corridor-wide high-speed rail program, this is not so difficult, but it would still constrain the schedule.
Without additional tracks, except on the bypasses, there is capacity for 18 peak Metro-North trains per hour into New York (including Penn Station Access) and 6 high-speed trains. Today’s New Haven Line peak traffic is 20 trains per hour (8 south of Stamford, 12 north of which 10 run nonstop from Stamford to Manhattan), so this capacity pattern argues in favor of pricing trains to allow commuters to use the high-speed trains between Stamford and New York.
Rye-Greenwich
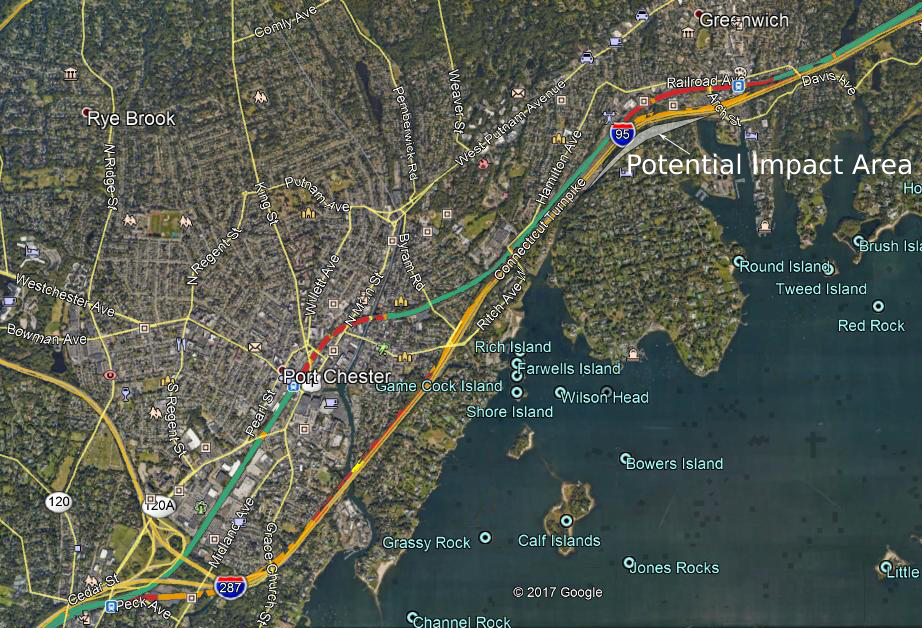
Rye is the first place, going from the south, where I-95 is straighter than the Northeast Corridor. This does not mean it is straight: it merely means that the curves on I-95 in that area are less sharp than those at Rye, Port Chester, and Greenwich. Each of these three stations sits at a sharp S-curve today; the speed zone today is 75 mph (120 km/h), with track geometry that could allow much more if Metro-North accepted a mix of trains of different speed, but Rye and Greenwich restrict trains to 60 mph/95 km/h, and Port Chester to 45 mph/70 km/h at the state line. The segment between the state line and Stamford in particular is one of the slowest in the corridor.
As a result, the NEC Future plan would bypass the legacy line there alongside the Interstate. Currently, the worst curve in the bypassed segment, at Port Chester, has radius about 650 meters, with maximum speed much less than today’s trains could do on such a curve because of the sharp S. At medium and high speed, it takes a few seconds of train travel time to reverse a curve, or else the train must go more slowly, to let the systems as well as passengers’ muscles adjust to the change in the direction of centrifugal force. At Rye, the new alignment has 1,200-meter curves, with gentle enough S to allow trains to fully reverse, without additional slowdowns; today’s tracks and trains could take it at 140 km/h, but a tilting train on tracks designed for higher-speed travel could go up to 195.
Within New York State, the bypass would require taking a large cosmetics store, and some houses adjacent to I-95 on the west; a few townhouses in Rye may require noise walls, as they would be right next to the right-of-way where trains would go about 200-210 km/h, but at this speed the noise levels with barriers are no higher than those of the freeway, so the houses would remain inhabitable.
In Connecticut, the situation is more delicate. When the tracks and I-95 are twinned, there is nothing in between, and thus the bypass is effectively just two extra tracks. To the south, just beyond the state line, the situation is similar to that of Rye: a few near-freeway houses would be acquired, but nothing else would, and overall noise levels would not be a problem.
But to the north, around Greenwich station, the proposed alignment follows the I-95 right-of-way, with no residential takings, and one possible commercial taking at Greenwich Plaza. This alignment comes at the cost of a sharp curve: 600 meters, comparable to the existing Greenwich curve. This would provide improvements in capacity, as intercity trains could overtake express commuter trains (which would also stop at Greenwich), but not much in speed.
Increasing speed requires a gentler curve than on I-95; eliminating the S-curve entirely would raise the radius to about 1,600 meters, permitting 225 km/h. This has some impact, as the inside of the curve would be too close to the houses just south of I-95, requiring taking about seven houses.
However, the biggest drawback of this gentler curve is cost: it would have to be on a viaduct crossing I-95 twice, raising the cost of the project. It is hard to say by exactly how much: either option, the preferred one or the 225 km/h option, would involve an aerial, costing about $100 million according to FRA cost items, so the difference is likely to be smaller than this. It is a political decision whether saving 30 seconds for express trains is worth what is likely to be in the low tens of millions of dollars.
Cos Cob Bridge
The Cos Cob Bridge restricts the trains, in multiple ways. As a movable bridge, it is unpowered: trains on it do not get electric power, but must instead coast; regular Metro-North riders are familiar with the sight of train lights, air conditioning, and electric sockets briefly going out when the train is on the bridge. It is also old enough that the structure itself requires trains to go more slowly, 80 km/h in an otherwise 110 km/h zone.
Because of the bridge’s age and condition, it is a high priority for replacement. One cost estimate says that replacing the bridge would cost $800 million. The Regional Plan Association estimates the cost of replacing both this bridge and the Devon Bridge, at the boundary between Fairfield and New Haven Counties, at $1.8 billion. The new span would be a higher bridge, fully powered, without any speed limit except associated with curves; Cos Cob station has to be rebuilt as well, as it is directly on the approaches, and it may be possible to save money there (Metro-North station construction costs are very high—West Haven was $105 million, whereas Boston has built infill stations for costs in the teens).
In any high-speed rail program, the curves could be eased as well. There are two short, sharp curves next to the bridge, one just west to the Cos Cob station and the other between the bridge and Riverside. The replaced bridge would need long approaches for the deck to clear the Mianus River with enough room for boats to navigate, and it should not cost any more in engineering and construction to replace the two short curves with one long, much wider curve. There is scant information about the proposed clearance below and the grades leading up to the bridge, but both high-speed trains and the high-powered electric commuter trains used by Metro-North can climb steep grades, up to 3.5-4%, limiting the length of the approaches to about 400 meters on each side. This is the alternative depicted as the potential alternative below; the Cos Cob Bridge is the legacy bridge, and the preferred alignment is a different bypass (see below for the Riverside-Stamford segment):
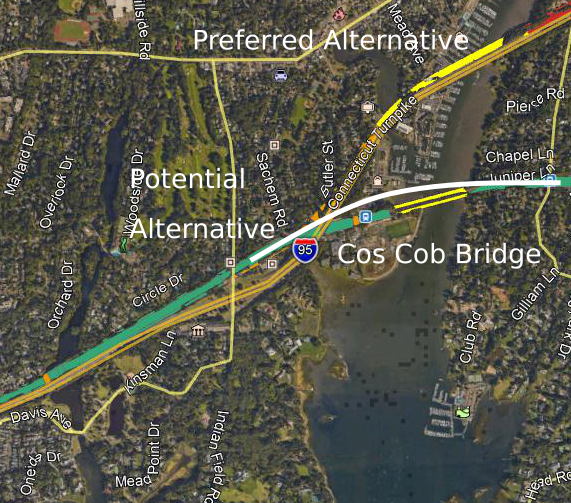
The color coding is the same as before, but yellow means major bridge. White is my own drawing of an alternative.
The radius of the curve would be 1,700 meters. A tilting train could go at 235 km/h. Commuter rail would benefit from increased speed as well: express trains could run at their maximum speed, currently 160 km/h, continuing almost all the way east to Stamford. The cost of this in terms of impact is the townhouses just north of the Cos Cob station: the viaduct would move slightly north, and encroach on some, possibly all, of the ten buildings. Otherwise, the area immediately to the north of the station is a parking lot.
The longer, wider curve alternative can be widened even further. In that case, there would be more impact on the approaches, but less near the bridge itself, which would be much closer in location to the current bridge and station. This option may prove useful if one alignment for the wider curve turns out to be infeasible due to either unacceptable impact to historic buildings or engineering difficulties. The curve radius of this alternative rises to about 3,000 meters, at which point the speed limit is imposed entirely by neighboring curves in Greenwich and Stamford; trains could go 310 km/h on a 3,000-meter curve, but they wouldn’t have room to accelerate to that speed from Greenwich’s 225 km/h.
Riverside-Stamford
Between the Mianus River and Stamford, there are two possible alignments. The first is the legacy alignment; the second is a bypass alongside I-95, which would involve a new crossing of the Mianus River as well. The NEC Future alignment appears to prefer the I-95 option:

The main benefit of the I-95 option is that it offers additional bypass tracks for the New Haven Line. Under this option, there is no need for intercity trains and express commuter trains to share tracks anywhere between Rye and Westport.
However, the legacy alignment has multiple other benefits. First, it has practically no additional impact. Faster trains would emit slightly more noise, but high-speed trains designed for 360 km/h are fairly quiet at 210. In contrast, the I-95 alignment requires a bridge over the Greenwich Water Club, some residential takings in Cos Cob, and possibly a few commercial takings in Riverside.
Second, it is cheaper. There would need to be some track reconstruction, but no new right-of-way formation, and, most importantly, no new crossing of the Mianus River. The Cos Cob Bridge is in such poor shape that a replacement is most likely necessary even if intercity trains bypass it. The extra cost of the additional aerials, berms, and grade separations in Riverside is perhaps $150-200 million, and that of the second Mianus River crossing would run into many hundreds of millions. This also means somewhat more visual impact, because there would be two bridges over the river rather than just one, and because in parts of Riverside the aerials would be at a higher level than the freeway, which is sunken under the three westernmost overpasses
In either case, one additional investment in Stamford is likely necessary, benefiting both intercity and commuter rail travelers: grade-separating the junction between the New Canaan Branch and the mainline. Without at-grade conflicts between opposing trains on the mainline and the New Canaan Branch, scheduling would be simpler, and trains to and from New Canaan would not need to use the slow interlocking at Stamford station.
The existing route into Stamford already has the potential to be fast. The curves between the Mianus and Stamford station are gentle, and even the S-curve on the approach to Stamford looks like a kilometer in radius, good enough for 180 km/h on a tilting train with proper superelevation.
Stamford-Darien
Between New York and Stamford, the required infrastructure investments for high-speed rail are tame. Everything together except the Mianus crossing should be doable, based on FRA cost items, on a low 9-figure budget.
East of Stamford, the situation is completely different. There are sharp curves periodically, and several in Darien and Norwalk are too tight for high-speed trains. What’s more, I-95 is only available as a straight alternative right-of-way in Norwalk. In Darien, and in Stamford east of the station, there is no easy solution. Everything requires balancing cost, speed, and construction impact.
The one saving grace is that there is much less commuter rail traffic here than between New York and Stamford. With bypasses from Stamford until past Norwalk, only a small number of peak express Metro-North trains east of Greens Farms would ever need to share tracks with intercity trains. Thus the scheduling is at least no longer a problem.
The official plan from NEC Future is to hew to I-95, with all of its curves, and compromise on speed. The curve radius appears to be about 700-750 meters through Stamford and most of Darien, good for about 95 mph over a stretch of 5.5 miles. This is a compromise meant to limit the extent of takings, at the cost of imposing one of the lowest speed limits outside major cities. While the official plan is feasible to construct, the sharp curves suggest that if Amtrak builds high-speed rail in this region, it will attempt a speedup, even at relatively high cost.
There is a possible speedup, involving a minimum curve radius of about 1,700-2,000 meters, good for 235-255 km/h. This would save 70-90 seconds, at similar construction cost to the preferred alignment. The drawback is that it would massively impact Darien, especially Noroton. It would involve carving a new route through Noroton for about a mile. In Stamford, it would require taking an office building or two, depending on precise alignment; in Noroton, the takings would amount to between 55 and 80 houses. The faster option, with 2,000-meter curves, does not necessarily require taking more houses in Noroton: the most difficult curves are farther east. In the picture, this speedup is in white, the preferred alternative is in orange, and the legacy line in teal:
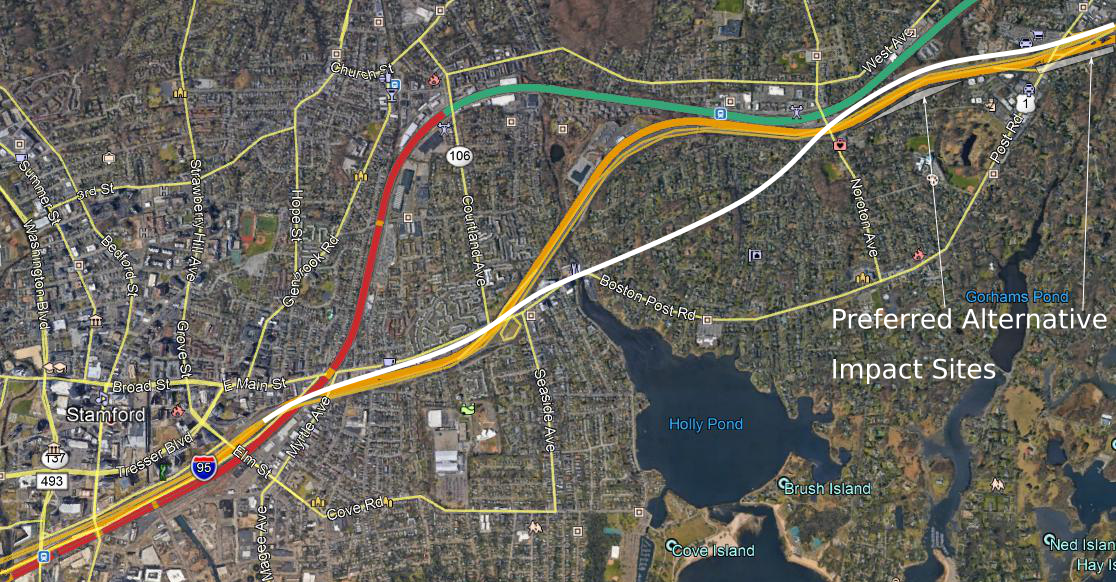
Fortunately, east of Norton Avenue, there is not much commercial and almost no residential development immediately to the north of I-95, making things easier:
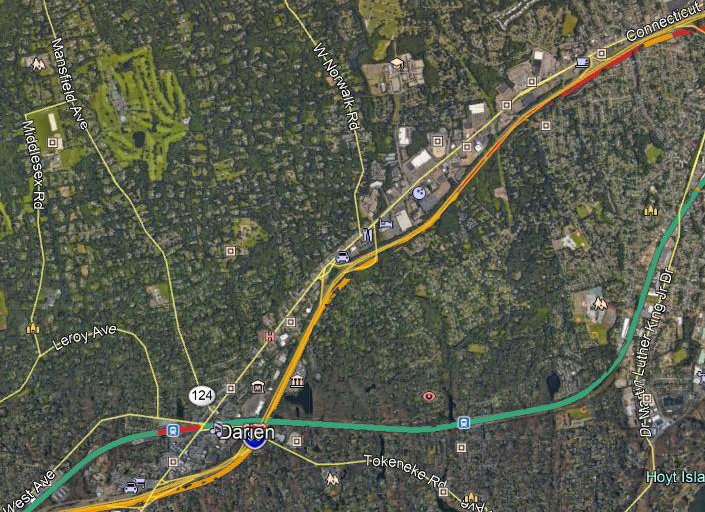
The preferred alignment stays to the south of the Turnpike. This is the residential side; even with tight curves, some residential takings are unavoidable, about 20 houses. Going north of I-95 instead requires a few commercial takings, including some auto shops, and one or two small office buildings east of Old Kings Highway, depending on curve radius. Construction costs here are slightly higher, because easing one curve would require elevated construction above I-95, as in one of the Greenwich options above, but this is probably a matter of a few tens of millions of dollars.
The main impact, beyond land acquisition cost, is splitting Noroton in half, at least for pedestrians and cyclists (drivers could drive in underpasses just as they do under highways). Conversely, the area would be close enough to Stamford, with its fast trains to New York, that it may become more desirable. This is especially true for takings within Stamford. However, Darien might benefit as well, near Noroton Heights and Darien stations, where people could take a train to Stamford and change to a high-speed train to New York or other cities.
As in Greenwich, it is a political decision how much a minute of travel time is worth. Darien houses are expensive; at the median price in Noroton, 60-80 houses would be $70-90 million, plus some extra for the office buildings. Against this extra cost, plus possible negative impact on the rest of Noroton, are positive impacts coming from access, and a speedup of 70-90 seconds for all travelers from New York or Stamford to points north.
Norwalk-Greens Farms
In Norwalk, I-95 provides a straight right-of-way for trains. This is the high-speed rail racetrack: for about ten kilometers, until Greens Farms, it may be possible for trains to run at 270-290 km/h.
Here is a photo of Norwalk, with the Walk and Saga Bridges in yellow, a tunnel in the preferred alternative in purple, a possible different alignment in white, and impact zones highlighted:
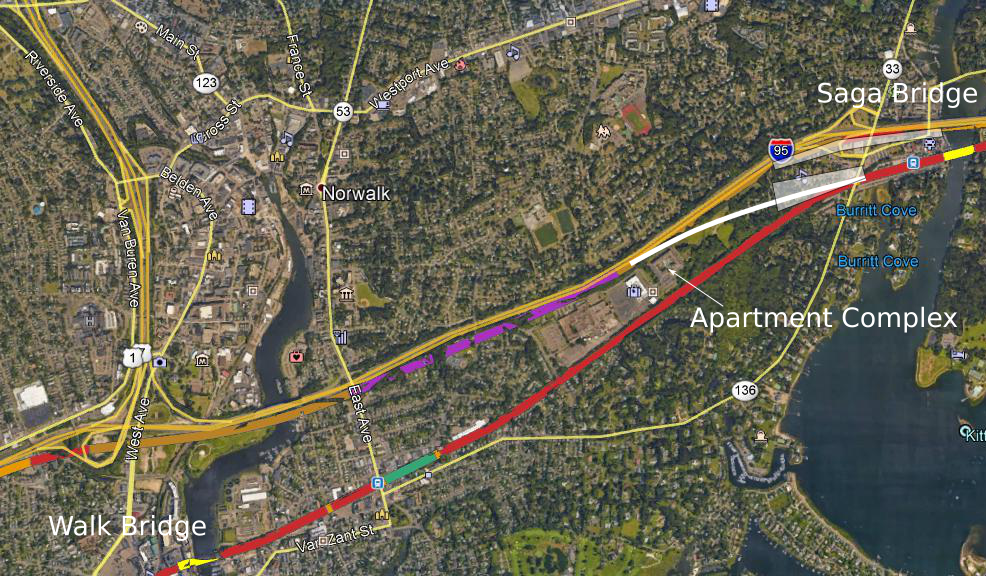
Three question marks remain about the preferred alignment.
The first question is, which side of the Turnpike to use? The preferred alignment stays on the south side. This limits impact on the north side, which includes some retail where the Turnpike and U.S. 1 are closely parallel, near the Darien/Norwalk boundary; a north side option would have to take it. But the preferred alignment instead slices Oyster Shell Park. A third option is possible, transitioning from the north to the south side just east of the Norwalk River, preparing to rejoin the New Haven Line, which is to the south of I-95 here.
The second question is, why is the transition back to the New Haven Line so complex? The preferred alignment includes a tunnel in an area without any more impacted residences than nearby segments, including in Greenwich and Darien. It also includes a new Saga Bridge, bypassing Westport, with a new viaduct in Downtown Westport, taking some retail and about six houses. An alternative would be to leverage the upcoming Saga Bridge reconstruction, which the RPA plan mentions is relatively easy ($500 million for Saga plus Walk, on the Norwalk River, bypassed by any high-speed alignment), and transition to the legacy alignment somewhat to the west of Westport.
A complicating factor for transitioning west of Westport is that the optimal route, while empty eight years ago, has since gotten a new apartment complex with a few hundred units, marked on the map. Alternatives all involve impact to other places; the options are transitioning north of the complex, taking about twenty units in Westport south of the Turnpike and twenty in Norwalk just north of it.
The third question, related to the second, is, why is Greens Farms so complicated? See photo below:
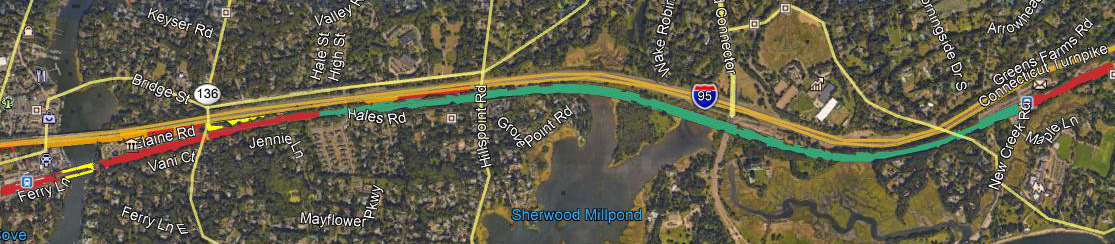
The area has a prominent S-curve, and some compromises on curve radius are needed. But the preferred alternative doesn’t seem to straighten it. Instead, it builds an interlocking there, with the bypass from Darien and points west. While that particular area has little impact (the preferred alignment transitions in the no man’s land between the New Haven Line and the Turnpike), the area is constrained and the interlocking would be expensive.
No matter what happens, the racetrack ends at Greens Farms. The existing curve seems to have a radius of about a kilometer or slightly more, good for about 190 km/h, and the best that can be done if it is straightened is 1,300-1,400 meters, good for about 200 km/h.
These questions may well have good answers. Unlike in Darien, where all options are bad, in Norwalk and Westport all options are at least understandable. But it’s useful to ask why go south of the Turnpike rather than north, and unless there is a clear-cut answer, both options should be studied in parallel.
RPA Fourth Regional Plan: LaGuardia Airport and the Astoria Line
This is the second post based on a Patreon poll about the RPA Fourth Regional Plan. See the first post, about Third Avenue, here.
The most worrisome part of the RPA Fourth Regional Plan is the LaGuardia Airport connector. The regional rail system the RPA is proposing includes some truly massive wastes of money, but what the RPA is proposing around LaGuardia showcases the worst aspects of the plan. On Curbed I explained that the plan has an unfortunate tendency to throw in every single politically-supported proposal. I’d like to expand on what I said in the article about the airport connector:
The most egregious example is another transit project favored by a political heavyweight: the LaGuardia AirTrain, championed by Governor Andrew Cuomo. Though he touts it as a one-seat ride from Midtown to LaGuardia, the vast majority of airport travelers going to Manhattan would have to go east to Willets Point (a potential redevelopment site) before they could go west. Even airport employees would have to backtrack to get to their homes in Jackson Heights and surrounding neighborhoods. As a result, it wouldn’t save airport riders any time over the existing buses.
Once again, it’s proven unpopular with transit experts and advocates: [Ben] Kabak mocked the idea as vaporware, and Yonah Freemark showed how circuitous this link would be. When Cuomo first proposed this idea, Politico cited a number of additional people who study public transportation in the region with negative reactions. Despite its unpopularity—and the lack of an official cost for the proposal—the AirTrain LaGuardia is included in the RPA’s latest plan.
But there is an alternative to Cuomo’s plan: an extension of the N/W train, proposed in the 1990s, which would provide a direct route along with additional stops within Astoria, where there is demand for subway service. Community opposition killed the original proposal, but a lot can change in 15 years; Astoria’s current residents may well be more amenable to an airport connector that would put them mere minutes from LaGuardia. Cuomo never even tried, deliberately shying away from this populated area.
And the Fourth Plan does include a number of subway extensions, some of which have long been on official and unofficial wishlists. Those include extensions under Utica and Nostrand avenues (planned together with Second Avenue Subway, going back to the 1950s), which also go under two of the top bus routes in the city, per [Jarrett] Walker’s maxim [that the best argument for an urban rail line is an overcrowded bus line, as on Utica and Nostrand].
There is also an extension of the N/W trains in Astoria—though not toward LaGuardia, but west, toward the waterfront, where it would provide a circuitous route to Manhattan. In effect, the RPA is proposing to stoke the community opposition Cuomo was afraid of, but still build the easy—and unsupported—airport connector Cuomo favors.
My views of extending the Astoria Line toward LaGuardia have evolved in the last few years, in a more positive direction. In my first crayon, which I drew in 2010, I didn’t even have that extension; I believed that the Astoria Line should be extended on Astoria Boulevard and miss the airport entirely, because Astoria Boulevard was the more important corridor. My spite map from 2010, give or take a year, connects LGA to the subway via a shuttle under Junction, and has a subway branch under Northern, a subway extension that I’ve been revising my views of negatively.
The issue, to me, is one of branching and capacity. The Astoria Line is a trunk line on the subway, feeding an entire tunnel to Manhattan, under 60th Street; the Queens Boulevard Line also feeds the same tunnel via the R train, but this is inefficient, since there are four trunk lines (Astoria, Flushing, and Queens Boulevard times two since it has four tracks), four tunnels (63rd, 60th, 53rd, Steinway/42nd), and no way to get from the Astoria Line to the other tunnels. This was one of my impetuses for writing about the problems associated with reverse-branching. Among the four trunks in Queens, the Astoria Line is the shortest and lowest-ridership, so it should be extended deeper into Queens if it is possible to do so.
The RPA is proposing to extend the Astoria Line, to its credit. But its extension goes west, to the waterfront. This isn’t really a compelling destination. Development isn’t any more intense than farther east, and for obvious reasons it isn’t possible to extend this line further; the RPA’s proposal would only add one stop to the subway. In contrast, an eastern extension toward LGA could potentially rebuild the line to turn east on Ditmars (with some takings on the interior of the curve at Ditmars and 31st), with stops at Steinway and Hazen before serving the airport. The intensity of development at Steinway is similar to that at 31st and Ditmars or at 21st, and Hazen also has some housing, albeit at lower density. Then, there is the airport, which would be about 8 minutes from Astoria, and 26 minutes from 57th and 7th in Manhattan. This is a different route from that proposed in the Giuliani administration, involving going north above 31st and then east farther out, running nonstop to the airport (or perhaps serving a station or two) through less residential areas, but I believe it is the best one despite the added impact of running elevated on Ditmars.
LGA is not a huge ridership generator; total O&D ridership according to the Consumer Airfare Report is around 55,000 per day, and 33% mode share is aspirational even with fast direct service to Manhattan hotels and an easy connection to the Upper East Side. But it still provides ridership comparable to that of Astoria Boulevard or Ditmars on the line today, and Steinway and Hazen are likely to add more demand. If the MTA closes the 11th Street Connection, taking the R from 60th Street Tunnel to the Queens Boulevard Line, in order to reduce the extent of reverse-branching, then the Astoria Line will run under capacity and need this additional demand. The total number of boardings at all stations, including Queensboro Plaza, is 80,000 per weekday today, plus some transfer volumes from the 7, which empties at Queensboro Plaza as 60th Street Tunnel provides a faster route to most Manhattan destinations than the Steinway Tunnel. An LGA extension should add maybe 40,000 or 50,000 weekday riders, without much of a peak since airport travel isn’t peaky, and make it easier to isolate the Astoria Line from the other Queens lines. This is not possible with a short extension to the waterfront as the RPA proposes.
I’ve seen someone suggest somewhere I don’t remember, perhaps on Twitter, that the reason the RPA plan involves an extension of the Astoria line to the west is to insidiously get the correct extension to LGA passed. If the RPA can propose an el in Astoria and not be killed by NIMBYs, then it will prove to Cuomo that NIMBYism is not a problem and thus he can send the subway to the airport directly, without the circuitous air train project that even less acerbic transit writers like Ben and Yonah hate.
I disagree with this line, on two different grounds. The first is that the RPA has two other reasons to support a western extension of the Astoria Line: it connects to the waterfront (which, following de Blasio and his support for the waterfront tramway, the RPA wants to develop further), and it got a station on Triboro in the Third Regional Plan, in the 1990s. I can no longer find the map with the stations on Mike Frumin’s blog, but the plan was to have a station every 800 meters, with a station to the west of Ditmar/31st still in Queens, around 21st Street; only in the more recent plan did the RPA redesign the idea as Crossboro, with much wider stop spacing.
The second grounds for disagreement is that the RPA presented a long-term vision. If Cuomo’s flawed LGA connector is there, then it will embolden him to find money to build this connection, even though it’s slower than taking a bus to the subway today. It will not embolden anyone to look for funding for the extension of the Astoria Line to the west, since there is no force clamoring for such extension – not the neighborhood, and not even the RPA, which includes this line on a long list of proposals.
As I said on Curbed, the RPA has been around for 90 years. Cuomo is just a governor, not even the leader of a real political movement (unlike Bernie Sanders, who seems to be interested in his leftist agenda more than in himself). There is no reason for an organization so venerable to tether itself to a politician who isn’t likely to be around for more than a few more years. On the contrary, it can provide cover for Cuomo to change his plan, if it does some legwork to prove that people in Astoria actually are interested in subway expansion to the east.
RPA Fourth Regional Plan: the Third Avenue Trunk Line
Based on a Patreon poll, the top two priorities for this blog for critiquing the RPA Fourth Regional Plan are its mess of the LGA connection and the Astoria Line, and the proposed commuter rail trunk line on Third Avenue. The third priority is multi-tracking existing lines and timetable-infrastructure integration.
New York’s existing regional rail network suggests a north-south trunk line, starting from the Harlem Line in the north and continuing south to Lower Manhattan and beyond. Such a line would run parallel to the Lexington Avenue Line, providing additional express service, running fast not just between 125th Street and City Hall but also farther north and south. Going back to 2009, I have proposed such a line, controversially continuing on to Staten Island:
Of note, the depicted regional rail network makes use of the entirety of Grand Central’s approach tracks. There are four tracks, two used by Line 2 to Penn Station (the green line) and two by Line 4 (the blue line), the north-south trunk under discussion. In contrast, here is the RPA version:
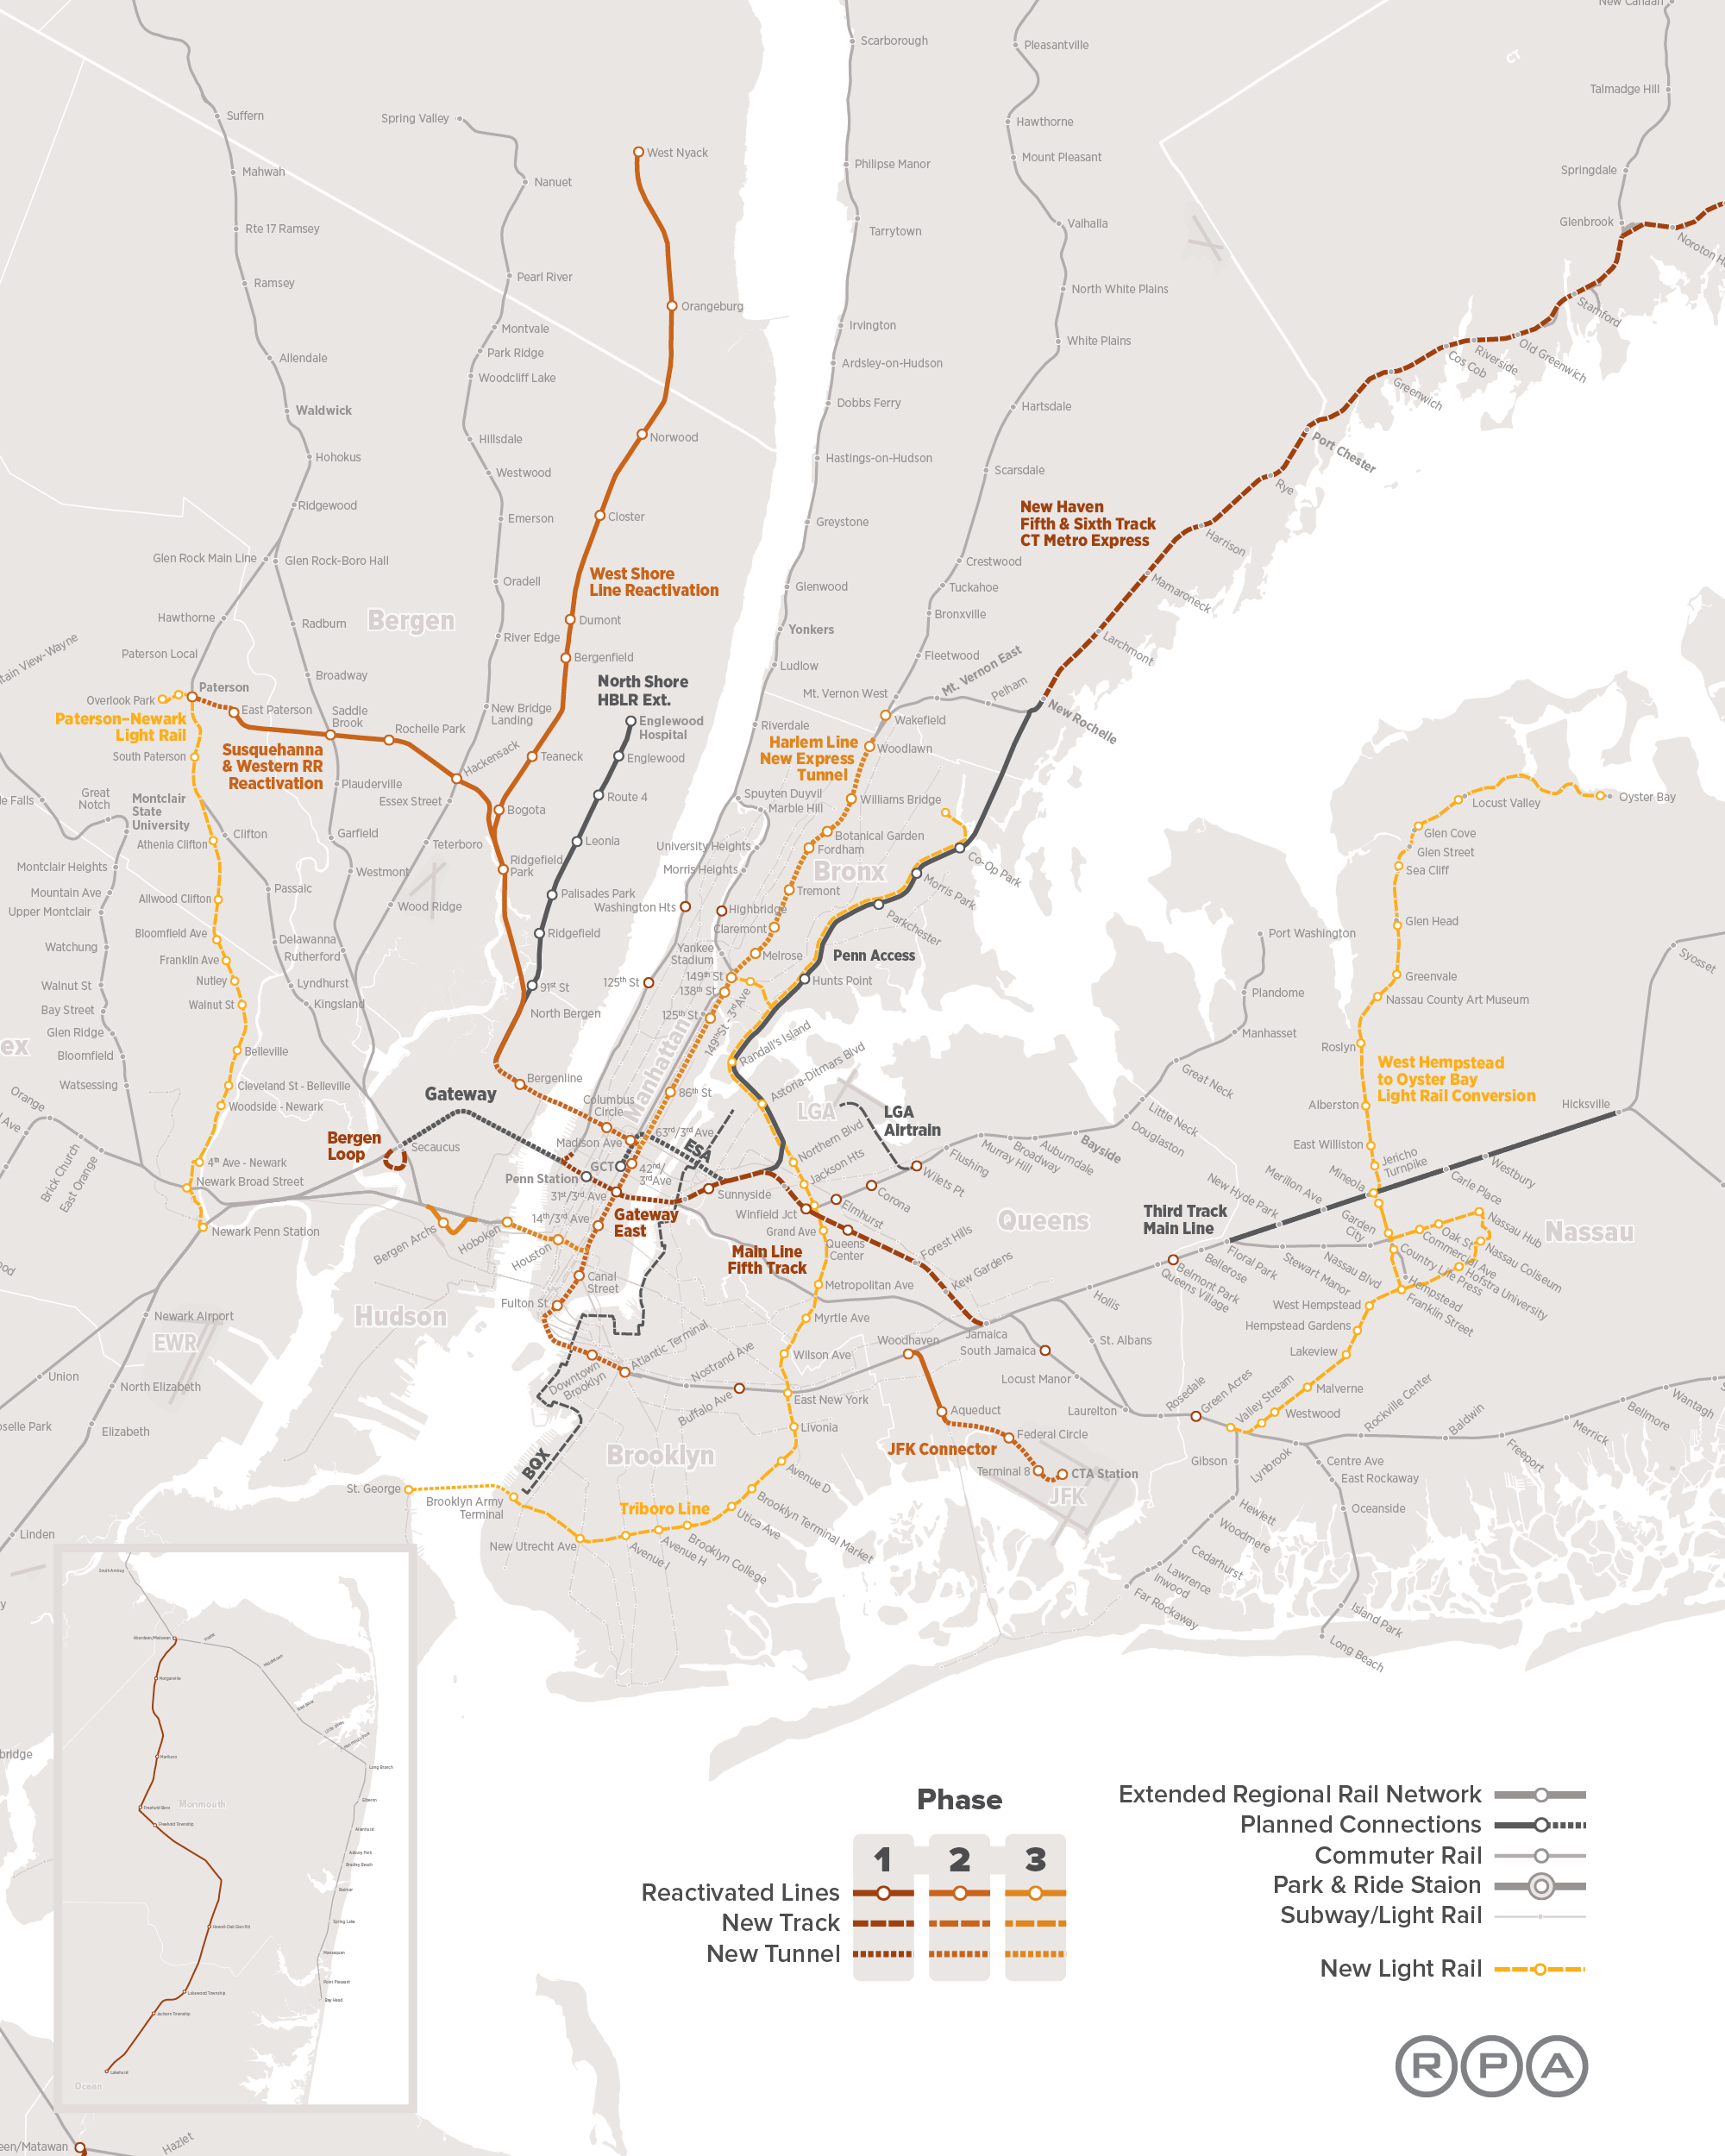
There is a lot more going on in the RPA version – more tunnels, some light rail lines – but the important thing to focus on in this post is the north-south trunk. The RPA is proposing the following items:
- A north-south trunk line under Third Avenue, with an onward connection to Brooklyn.
- Stops at 125th, 86th, 42nd, 31st, 14th, Canal, and Fulton Street.
- Two tunnels to New Jersey (in addition to Gateway), at 57th and Houston Streets, using Third Avenue to connect between them.
- A tunnel directly under the Harlem Line in the Bronx, called an express tunnel but making more stops, with infill at 138th and 149th Street, to intersect the 6 and 2/5 trains respectively.
I contend that all three elements are problematic, and should not be built without major changes.
1. Third Avenue
The RPA plan bypasses the existing tracks to Grand Central entirely. This simplifies scheduling, in the sense that all trains using Third Avenue are captive to the reorganized system from the start. It also serves the Upper East Side and East Harlem slightly better: there is more population density east of Third Avenue than west of it, so it materially benefits riders to have a commuter rail station on Third rather than on Park, where the current line goes.
Unfortunately, these advantages are swamped by the fact that this means the Fourth Regional Plan is proposing about 8 kilometers of tunnel, from 138th Street to 42nd, redundant with the existing Grand Central approach. At the cost I think is appropriate for urban tunnels, this is around $2 billion. At what New York seems to actually spend, start from $13 billion and go up.
Because this trunk line would have to be built from scratch, it also has necessarily limited capacity. The Grand Central approach has four tracks; Third Avenue is as far as I can tell based on the plan just two. Many trains on the Hudson and New Haven Lines would need to keep terminating at the existing Grand Central station, with no through-service; any transfer to the Third Avenue trunk would involve walking a long block between Park and Third Avenues, 310 meters apart.
The capacity limitation, in turn, forces some reverse-branching onto Metro-North, on top of that coming from future Penn Station Access lines (the connections from the New Haven and Hudson Lines to Penn Station, depicted on both the RPA map and my map). It is possible to avoid this by connecting just one of Metro-North’s line to the new trunk, probably the Harlem Line, and then make passengers from the other two lines go to the existing Grand Central. But at least as depicted in the map, this service pattern seems unlikely: the High Bridge infill stop suggests some Hudson Line trains would go to the trunk, too. Unfortunately, even without reverse-branching, service would not be great, since connections between the old and new system (especially with the Hudson Line) would require a long walk at 125th Street or Grand Central.
The long walk is also a problem for the trunk line from Grand Central south. According to OnTheMap, the center of gravity of Midtown jobs seems to be between Fifth and Sixth Avenues, with few jobs east of Third. While this trunk line is good for scooping Upper East Side passengers, it isn’t good for delivering them to their exact destination.
2. Stop Spacing
The RPA stop spacing is too local. The 4 and 5 trains stop at 125th, 86th, 59th, Grand Central, Union Square, City Hall, and Fulton Street. It’s for this reason that my map’s Line 4 is so express, stopping only at 125th Street, Grand Central, Union Square, and Fulton Street: the line parallels the Lexington Avenue Line so closely that it should offer a different stopping pattern. For the same reason, observe that I do not include any infill on the LIRR Main Line west of Jamaica, where is it closely parallel to the Queens Boulevard Line with its E and F express trains; on lines not so close to express subways, I have extensive infill instead.
In contrast, the RPA wants trains to make the same number of stops between Harlem and Lower Manhattan as the 4 and 5 subway lines, just at slightly different locations: 31st instead of 59th, Canal instead of City Hall.
The Canal Street location is understandable. Chinatown is a major destination, overshadowed by Midtown and Lower Manhattan but important in its own right; the Canal Street complex on the 6, N/Q/R/W, and J/Z is the 18th busiest subway station in New York on weekdays and the 11th busiest on weekends. It’s also an intersection point between the north-south trunk line and the N/Q trains (in addition to Union Square) and the J/Z trains (in addition to Fulton Street). I think it’s overall not a good idea to include this location, because the 4/5/6 exist, and the connections to the N/Q and J/Z also exist elsewhere, but I think the alternatives analysis for this project should include this station as an option.
In contrast, 31st Street is inexcusable. On the surface, the rationale for it is clear: provide a transfer point with the east-west tunnels feeding Penn Station. In practice, it is weak. The area is just frustratingly out of walking range from Midtown jobs for train riders. The transfer is good in theory, but in practice requires a new tunnel from Penn Station to Long Island, one that the RPA included because Long Island’s turf warriors wanted it despite complete lack of technical merit; the cost of this tunnel, according to RPA head Tom Wright, would be $7 billion. The only reason to include this connection in the first place is that RPA decided against a connection between Grand Central and Penn Station.
3. The New Jersey Tunnels
In New Jersey, the RPA believes in making no little plans, proposing three two-track Hudson crossings: Gateway, and two new tunnels, one connecting Bergen and Passaic Counties with 57th Street, and one from Hoboken to Houston Street. Tunnels in the general vicinity of these are good ideas. But in this plan, there’s one especially bad element: those tunnels link into the same Third Avenue trunk line.
The RPA has a tendency, going back to at least the Third Regional Plan, to hang many elements on one central piece of infrastructure. The Third Plan proposed Second Avenue Subway as a four-track line, with many branches hitting all the other priorities: regional rail, an express rail connection to JFK, more lines in Brooklyn and the Bronx – see schematic on PDF-p. 13 of the executive summary and more detail on PDF-pp. 204-207 of the full plan. Most of these elements were good on their own, but the connection to Second Avenue Subway made them more awkward, with extensive conventional- and reverse-branching, and a JFK connection that would miss all Midtown hotels.
On this plan, the need to link the new elements to the Third Avenue trunk leads to incoherent lines. High-frequency east-west trunks would make a lot of sense, complementing the north-south trunk, but instead of connecting Hoboken with Brooklyn and 57th Street with Long Island, both end up hooking to the north-south trunk and loop back to connect to each other. The proposed tunnels are already there, in the form of Gateway East and the trunk connection to Brooklyn, they just don’t align. Instead, the only east-west alignment that fully goes through is Gateway, with just one stop in Manhattan at Penn Station, except in the tunnel that also has an additional stop at off-Midtown 31st and 3rd.
4. Harlem Line Tunnel
Between Grand Central and Wakefield, the Harlem Line has four tracks. In the South Bronx, the Hudson Line splits off, but the rest of the Harlem Line still has four tracks. Thus, the Bronx effectively has six tracks feeding four in Manhattan. It is this configuration that probably led the RPA to believe, in error, that two additional regional rail tracks in Manhattan were required. In this situation, it is unlikely there will ever be capacity problems on the Harlem Line in the Bronx – the bottleneck is further south. So why is the RPA proposing to add two more tracks to the Harlem Line, in a tunnel?
In section 1 of this post, I defined the Third Avenue trunk’s unnecessary part as running from Grand Central to 138th Street, a total of 8 km. This tunnel, from 138th to the depicted northern end at Woodlawn, where the Harlem and New Haven Lines split, is 11 km. In a city with reasonable cost control, this should be around $2.5 billion. In New York, it would be much more – I can’t tell how much, since it is likely to be cheaper than the recent subway projects (Second Avenue Subway Phase 1, and the 7 extension), both of which were in Manhattan, but I would guess about $10 billion is in line with existing New York costs. Is there any valid reason to spend so much money on this tunnel?
When I interviewed Tom Wright and Foster Nichols for my above-linked Streetsblog piece, I only saw the plans around Gateway, and was aware of the Third Avenue trunk idea but not of any of the details, so I never got a chance to ask about the Harlem Line express tunnel. So I can only guess at why the RPA would propose such a line: it got some pushback from the suburbs about wanting more express trains. The RPA could try to explain to suburbanites that the new system would not be so slow in the Grand Central throat: Metro-North does the 6.6 km from 125th to Grand Central in 10 minutes; the trains are capable of doing it in 5-6 minutes, but the last 15 blocks are excruciatingly slow, which slowness would be eliminated with any through-running, via the existing tunnels or via Third Avenue. Instead, for the same reason the organization caved to Long Island pressure to include Gateway East, it caved to Westchester pressure to include more express tracks.
In reality, this tunnel has no merit at all. The way the existing suburban lines are laid out points to a clear service pattern: the Harlem Line on the local tracks, the New Haven Line on the express tracks (regardless if those trains run local or express on the New Haven Line farther out). Wakefield has four tracks and two platforms, but the Harlem and New Haven Lines split just short of it; perhaps new local platforms on the New Haven Line could connect to it, or perhaps the junction could be rebuild north of Wakefield, to enable transfers. With much of the New Haven Line capacity occupied by the reverse-branch to Penn Station Access, there wouldn’t be much of a capacity crunch on the express tracks; in a counterfactual in which reverse-branching is not a problem, some Harlem Line trains could even be routed onto the spare capacity on the express tracks.
Build a Network, Not One Line With Branches
In the short run, the biggest thing the RPA is proposing for regional rail in New York is Gateway plus tie-ins. But this doesn’t really distinguish it from what the politicians want. The real centerpiece of the Fourth Plan, as far as regional rail goes, is the Third Avenue trunk line – even taking over some functionality of Second Avenue Subway, which the RPA proposes to not build south of 63rd Street.
Unfortunately, this trunk line, while almost good, doesn’t quite work. It has 19 km of superfluous tunneling, from Grand Central to Woodlawn, adding no new service to the system, nor new connections to existing service, nor more capacity on lines that really need it. And it insists on linking new east-west tunnels beyond Gateway to the same trunk, ensuring that they couldn’t really work as east-west trunks from New Jersey to Brooklyn, Queens, and Long Island. In centering the trunk, the RPA is in effect ruining the possibility for additional trunks creating a bigger system.
Building a north-south trunk leveraging the Harlem Line is a no-brainer. When I sent Yonah Freemark my first regional rail proposal in 2009, he responded with some draft he’d been working on, I think as an RPA intern, proposing a through-running network using the Harlem Line, with an extension to the south with an onward connection to Brooklyn much like the RPA’s current Third Avenue trunk south of 42nd Street. It’s something that different people with an interest in improving New York’s transit system could come up with independently. What matters is the details, and here, the Fourth Regional Plan falls short.

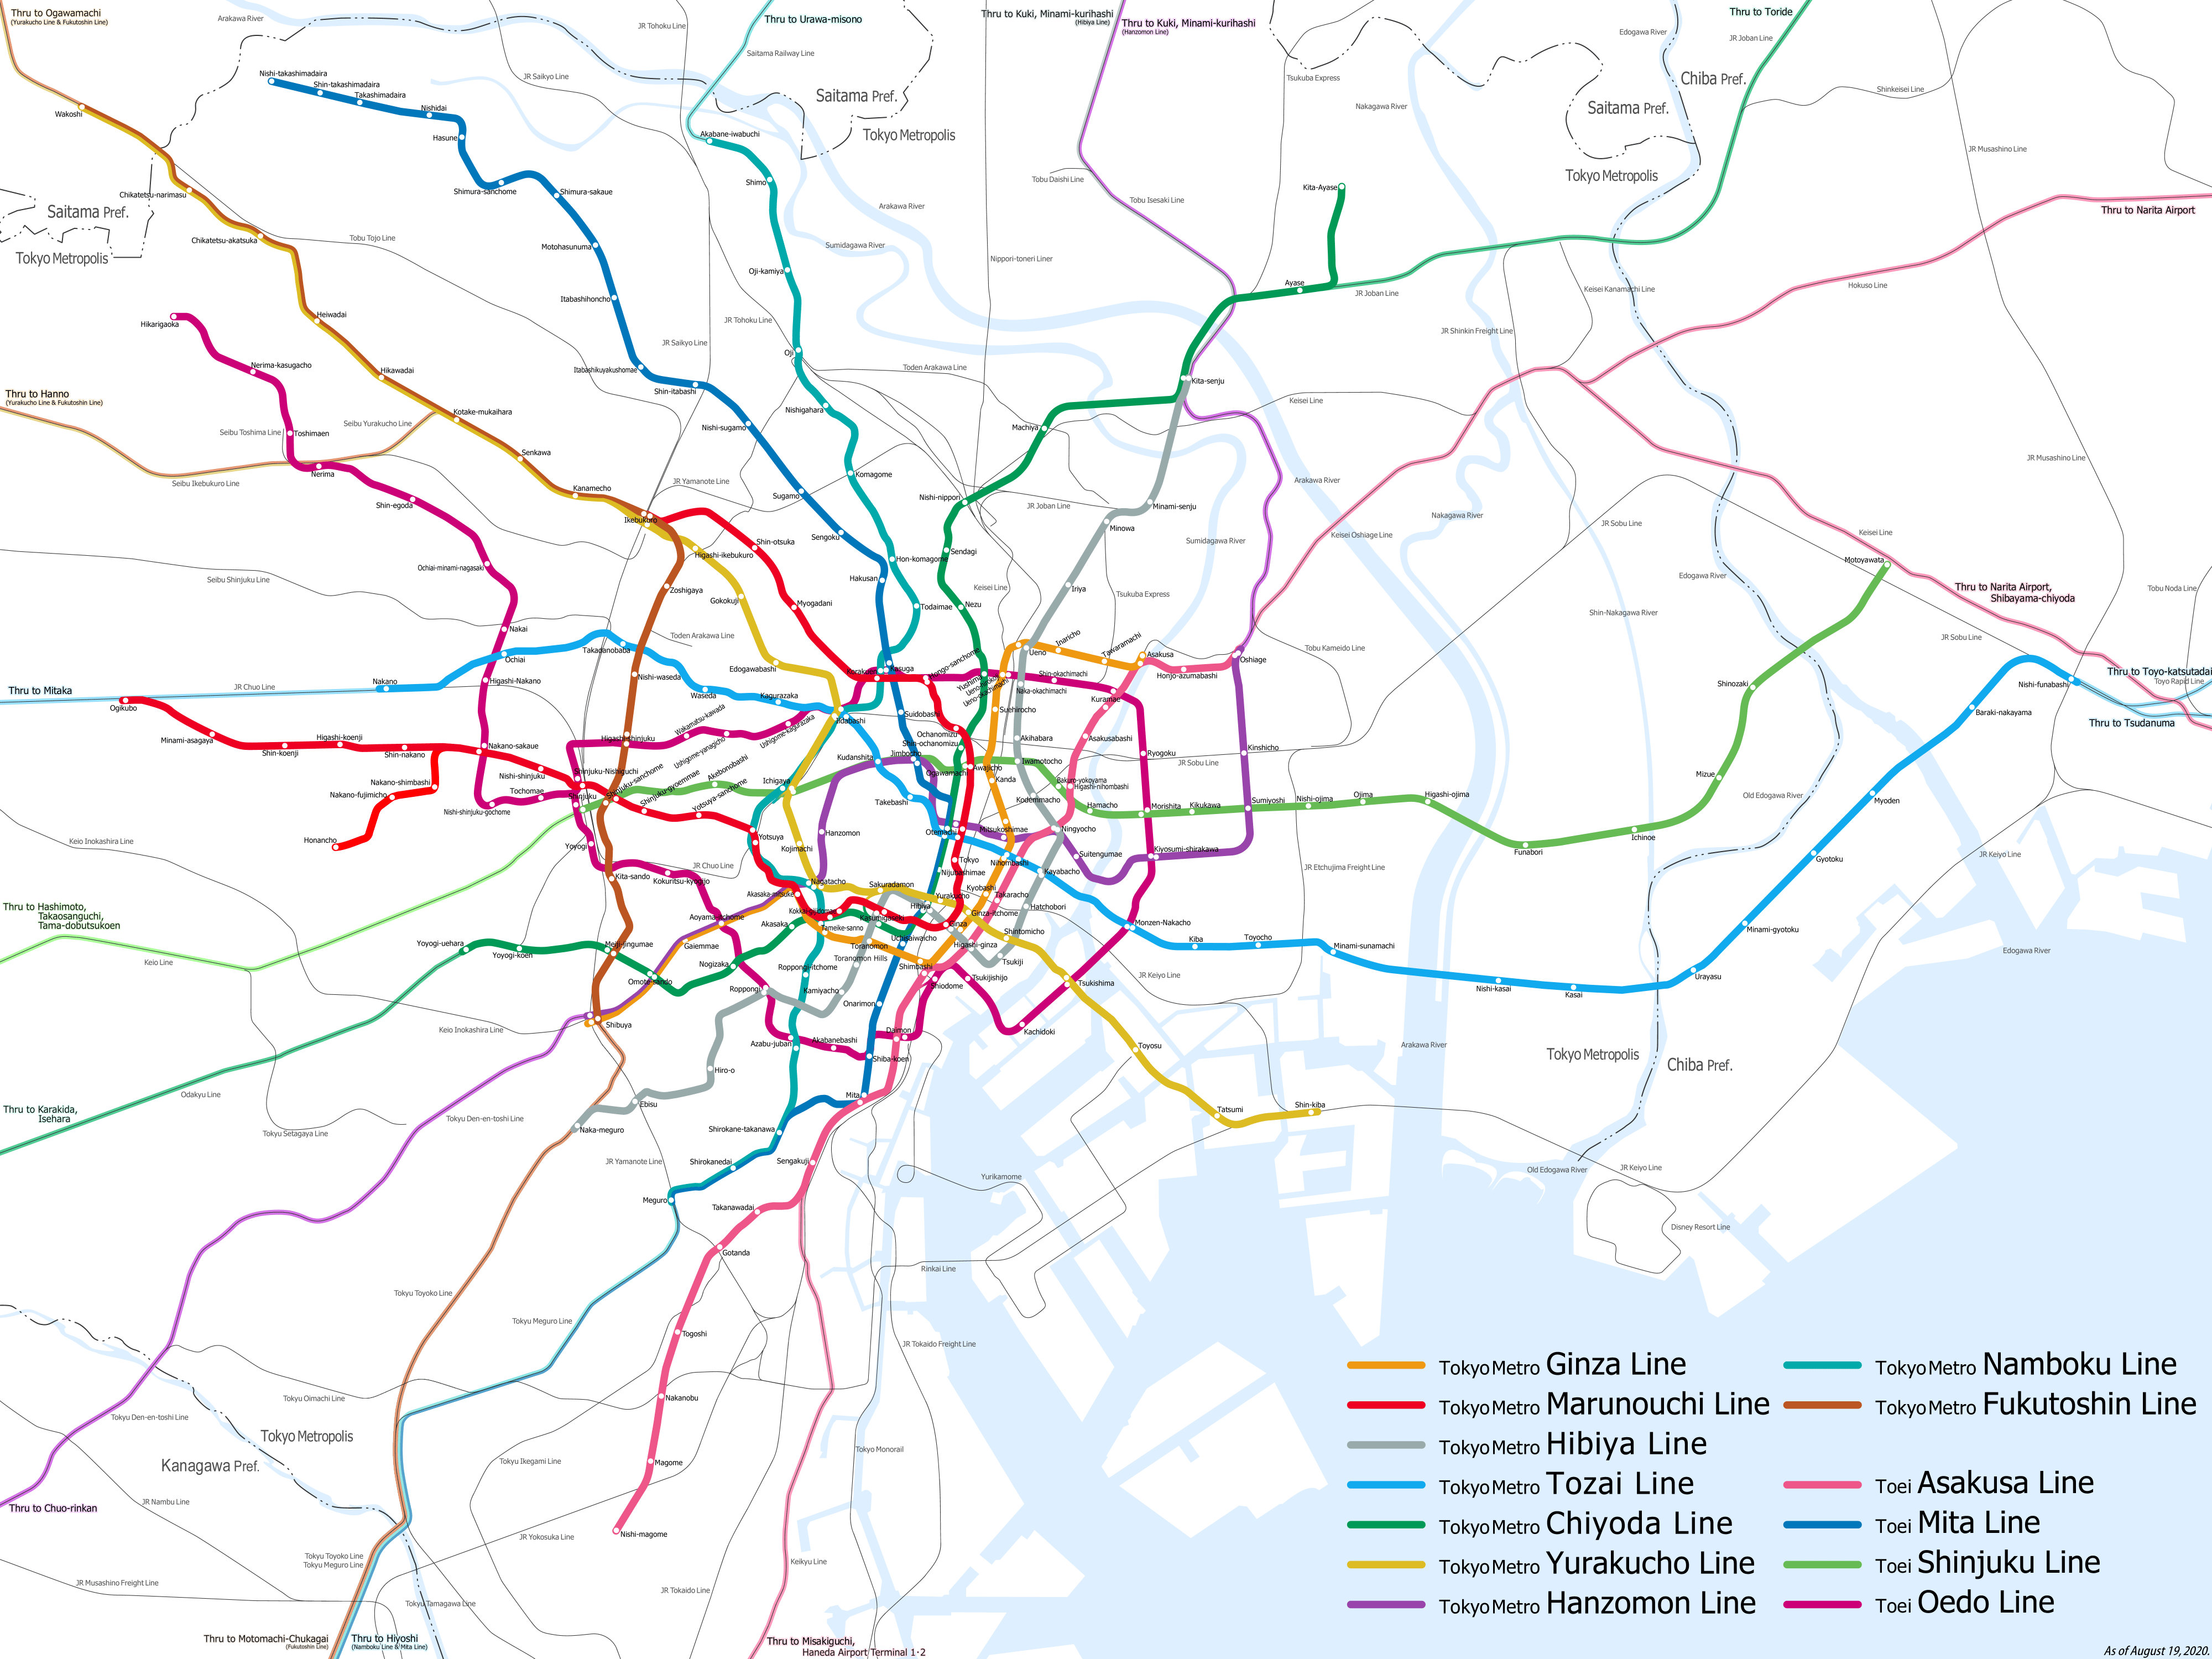