Category: Transportation
Massachusetts Sandbags Rail Electrification
In the last year, Massachusetts has been studying something called the Rail Vision, listing several alternatives for commuter rail modernization. This has been independent of the North-South Rail Link study, and one of the options that the Rail Vision considered was full electrification. Unfortunately, the report released yesterday severely sandbags electrification, positing absurdly high costs. The state may well understand how bad its report is – at least as of the time of this writing, it’s been scrubbed from the public Internet, forcing me to rely on screencaps.
In short: the alternative that recommends full system electrification was sandbagged so as to cost $23 billion. This is for electrification, systems, and new equipment; the NSRL tunnel is not included. All itemized costs cost a large multiple of their international cost. The Americans in my feed are even starting to make concessions to extremely expensive projects like the Caltrain electrification, since the proposed MBTA electrification is even costlier than that.
But the telltale sign is not the cost of the wires, but rolling stock. The report asserts that running electrified service requires 1,450 cars’ worth of electric multiple units (“EMUs”), to be procured at a cost of $10 billion. More reasonable figures are 800 and $2 billion respectively.
Why 1,450 cars?
The all-electric option assumes that every line in the system will get a train every 15 minutes, peak and off-peak. What counts as a line is not clear, since some of the MBTA’s commuter lines have branches – for example, the Providence and Stoughton Lines share a trunk for 24 km, up to Canton Junction. However, we can make reasonable assumptions about which branches are far enough out; overall rolling stock needs are not too sensitive to these assumptions, as most lines are more straightforward.
The MBTA is capable of turning trains in 10 minutes today. In making schedules, I’ve mostly stuck to this assumption rather than trying to go for 5-minute turnarounds, which happen in Germany all the time (and on some non-mainline American subways); occasionally trains steal 1-2 minutes’ worth of turnaround time, if there’s a longer turn at the other end. Thus, if the one-way trip time is up to 50 minutes, then 8 trainsets provide 15-minute service.
To me, high-frequency regional rail for Boston means the following peak frequencies:
Providence/Stoughton: a train every 15 minutes on each branch. Service south of Providence is spun off to a Rhode Island state service, making more stops and running shorter trains as demand is weaker than commuter volumes to Boston. With this assumption, the Providence Line requires 7-8 trainsets. The Stoughton Line, with the South Coast Rail expansion to New Bedford and Fall River, each served every half hour, requires around 9-10. Say 18 sets total.
Worcester: the big question is whether to exploit the fast acceleration of EMUs to run all-local service or mix local and express trains on tracks in Newton that will never be quadrupled unless cars are banned. The all-local option has trains doing Boston-Worcester in just under an hour, so 9-10 trainsets are required. The mixed option, with a train every 15 minutes in each pattern, and local trains only going as far as Framingham, requires 14 sets, 8 express and 6 local.
Franklin/Fairmount: a train every 15 minutes on the Franklin Line, entering city center via the Fairmount Line, would do the trip in around 50 minutes. It may be prudent to run another train every 15 minutes on the Fairmount Line to Readville, a roughly 17-minute trip by EMU (current scheduled time with diesel locomotives: 30 minutes). Overall this is around 12 trainsets.
Old Colony Lines: there are three lines, serving very low-density suburbs. The only destinations that are interesting for more than tidal commuter rail are Plymouth, Brockton, Bridgewater State, and maybe an extension to Cape Cod. Each branch should get a train every 30 minutes, interlining to a train every 10 from Quincy Center to the north. About 10-12 trainsets are needed (2 more if there’s an hourly train out to Cape Cod); this is inefficient because with three branches, it’s not possible to have all of them depart South Station at :05 and :35 and arrive :25 and :55, so even if there’s a train every 15 minutes per branch, the requirement doesn’t double.
Fitchburg Line: a local train to Wachusett every 15 minutes would require around 12 sets (75 minutes one-way). The number may change a little if there’s an overlay providing service every 7.5 minutes to Brandeis, or if trains beyond South Acton only run every half hour.
Lowell Line: an EMU to Lowell would take about 27 minutes, depending on the stop pattern; 5 trainsets provide 15-minute frequency.
Haverhill Line: an EMU to Haverhill running the current route (not via the Wildcat Branch) would take about 40 minutes, so 7 trainsets provide a train every 15 minutes.
Eastern Lines: like the Old Colony Lines, this system has very low-density outer branches, with only one semi-reasonable outer anchor in Newburyport. Trains should run to Beverly every 10 minutes, and then one third should turn, one third should go to Rockport, and one third should go to Newburyport. With the same inherent inefficiency in running this service on a symmetric schedule as the Old Colony, around 10-12 sets are needed.
This is about 90 sets total. At eight cars per set, and with a spare ratio of 11%, the actual requirement is 800 cars, and not 1,450. The difference with the state’s assumption is likely that I’m assuming trains can run at the acceleration rates of modern EMUs; perhaps the state thinks that EMUs are as slow and unreliable as diesel locomotives, so a larger fleet is necessary to provide the same service.
Rolling stock costs
Reducing the cost of infrastructure is complicated, because it depends on local factors. But reducing the cost of industrial equipment is easy, since there are international vendors that make modular products. Factories all over Europe, Japan, and South Korea make this kind of equipment, and the European factories barely require any modifications to produce for the American market under current federal regulations.
It is not hard to go to Railway Gazette and search for recent orders for EMUs; names of trainsets include Talent, FLIRT, Mireo (cost information here) and Coradia. The linked Coradia order is for €96,500 per meter of train length, the other three orders are for about €70,000. A US-length (that is, 25 meters) car would cost around $2.5 million at this rate. 800 cars times $2.5 million equals $2 billion, not the $10 billion the MBTA claims.
Railway Gazette also discusses a maintenance contract: “Vy has awarded Stadler a contract worth nearly SFr100m for the maintenance in 2020-24 of more than 100 five-car Flirt EMUs.” These trains are 105 meters long; scaled to US car length, this means the annual maintenance cost of an EMU car is around $50,000, or $40 million for the entire fleet necessary for electrified service.
The actual net cost is even lower, since the MBTA needs to replace its rolling stock very soon anyway. If the choice is between 800 EMUs and a larger diesel fleet, the EMUs are cheaper; in effect, the rolling stock cost of electrification is then negative.
Why are they like this?
I struggle to find a problem with Boston’s transportation network that would not be alleviated if Massachusetts’ secretary of transportation Stephanie Pollack and her coterie of hacks, apparatchiks, and political appointees were all simultaneously fired.
There is a chain of command in the executive branch of the Massachusetts state government. Governor Charlie Baker decides that he does not want to embark on any big project, such as NSRL or rail electrification, perhaps because he is too incompetent to manage it successfully. He then intimates that such a project is unaffordable. Secretary Pollack responds by looking for reasons why the project is indeed unaffordable. Under pressure to deliver the required results, the planners make up outrageously high figures: they include fleet replacement in the electrified alternative but not in the unelectrified one (“incremental cost”), and then they lie about the costs by a factor of five.
Good transit activists can pressure the state, but the state has no interest in building good transit. The do-nothing governor enjoys no-build options and multi-billion dollar tweaks – anything that isn’t transformative is good to him. The do-nothing state legislature enjoys this situation, since it is no more capable of managing such a project, and having a governor who says no to everything enables it to avoid taking responsibility.
New Report on Construction Costs Misses the Mark
In the last few years, ever more serious and powerful actors have begun investigating the fact of high American infrastructure construction costs. First it was Brian Rosenthal’s excellent New York Times exposé, and then it was the Regional Plan Association’s flop of a study. At the same time, I was aware that the congressional Government Accountability Office, or GAO, was investigating the same question, planning to talk to sources in the academic world as well as industry in order to make recommendations.
The GAO report is out now, and unfortunately it is a total miss, for essentially the same reason the RPA’s report was a miss: it did not go outside the American (and to some extent rest-of-Anglosphere) comfort zone. Its literature review is if anything weaker than the RPA’s. Its interviews with experts are telling: out of nine mentioned on PDF-p. 47, eight live in English-speaking countries. Even when more detailed information about non-English-speaking countries is readily available, even in English, the GAO report makes little use of it. It is a lazy study, and people who ideologically believe the American federal government does not work should feel confident citing this as an example.
Cost comparisons
Brian himself already notes one of the reasons the report is so weak: Congress mandated a comparative study, but the report made no international comparisons at all. Instead, the report offered this excuse (PDF-p. 27):
The complexity of rail transit construction projects and data limitations, among other things, limits the ability to compare the costs of these projects, according to the stakeholders we interviewed. As highlighted above, each project has a unique collection of specific factors that drive its costs. According to FTA officials, each proposed transit project has its own unique characteristics, physical operating environment, and challenges. Some stakeholders said that the wide disparity in the relative effect of different cost factors renders cost comparisons between projects difficult. For example, representatives of an international transit organization said that because of the large number of elements that can affect a project’s costs and the differences in what costs are included in different projects’ data, projects should be compared only at a very granular level and that aggregate cost comparisons, such as between the costs per mile or costs per kilometer of different projects, are likely flawed. Some stakeholders also said that project costs should not be compared without considering the projects’ contexts, such as their complexity. For example, one academic expert contended that project costs cannot be compared without considering the context of each project, and that analysis of projects should focus on leading practices and lessons learned instead.
There is a big problem with the above statement: disaggregated costs for many aspects of urban rail construction do exist. The Manhattan Institute’s Connor Harris has done a lot of legwork comparing tunnel boring machine staffing levels and wages in New York and in Germany, and found that New York pays much higher wages but also has much higher staffing levels, 25-26 workers compared with 12. I have done some work looking at station costs specifically, and at the cost of installing elevators for wheelchair accessibility.
There is a lot of detailed comparative research about the costs of high-speed rail; the report even references one such meta-study undertaken within Europe, but omits the study’s analysis of causes of cost differences and instead asserts that it shows that comparing different projects is hard. In the interim, California contracted Deutsche Bahn to do a post-mortem of its elevated high-speed rail costs, which found that California needlessly built larger structures than necessary, explaining its cost premium over Germany.
Instead of probing these disaggregated estimates, the GAO preferred to say that they are too hard and move on.
Sanity checks
Even without disaggregation, there are some good sanity checks one can make about construction costs. The most important is that big projects – major subway expansions, regional rail tunnels, high-speed rail – cost an appreciable amount of the government’s budget. The budget for the 200-kilometer Grand Paris Express project is €35 billion, plus another €3 billion in contributions for related suburban rail extensions such as that of the RER E. There may be future cost overruns, but they will be reported in the media, just as the current overrun has been; it is extremely difficult to hide cost overruns measured in tens of billions in a Paris-size city, and even in a China-size country it may not be easy.
Is it plausible that GPX is inherently easier to build than New York’s $1+ billion/km subway tunnels? Yes. It’s equally plausible that it is inherently harder. Second Avenue Subway runs under a wide, straight throughfare, a situation that simplifies construction. In Israel, the ministry of transportation has long mentioned the ease of tunneling under wide, straight boulevards in connection with plans to extend the second line of the Tel Aviv subway to North Tel Aviv under Ibn Gabirol, and admitted this even when it opposed the extension on land use grounds.
The most important sanity check is that in a world with several dozens of cities with a wide variety of wealth levels, land use patterns, geologies, and topographies, no city has managed to match or even come close to New York’s construction costs. New York is not special enough to be an edge case in all or even most relevant geographic variables – it is dense but no denser than Seoul or Paris, it is wealthy but no wealthier than London or Paris or Munich and barely wealthier than Stockholm, it has hard rock but less hard than Stockholm (and in Stockholm the gneiss is cited as a cost saver – bored tunnels do not require concrete lining), etc.
Moreover, the cities that have the highest construction costs outside New York are almost without exception in the same set of countries: the US, Canada, Britain, Singapore, Australia. What’s likelier – that there is some special geographic feature common to the entire Anglosphere (including Quebec) but absent from all other developed countries, or that there is a shared set of legal and political traditions that developed in the last 50 years that impede cost-effective construction? Instead of probing this pattern, the GAO preferred to wash its hands and refuse to compare projects across countries.
Internal comparisons
In lieu of making international comparisons, the GAO has engaged in extensive internal comparison. It cites aspects that have raised the costs of Second Avenue Subway above other American subway projects, such as overdesign for stations. Apparently, it’s completely legit to compare two different cities’ construction if they’re in the same country.
Over and over again, it references its own domestic standards. The GAO has 12 design standards, e.g. on PDF-pp. 51-52 and 56-60; the report mentions that existing cost estimation methodologies by the Federal Transit Administration, or FTA, meet 7 of them; thus, it exhorts transit agencies to meet the other 5 standards.
The only problem is that there is no evidence supplied that those design standards are really useful. After all, the United States has very high costs, so why should anyone trust its standards? Even domestically, the report makes no effort to bring up successful examples of low overall costs coming from following prescribed standards. Seattle recently opened a light rail tunnel built for around $400 million per kilometer, a cost that would get most European project managers fired but that is still the lowest for an American urban rail tunnel built in this century. But the report never brings up Seattle at all, never mind that New York would salivate over the prospect of tunneling at Seattle’s cost.
The real internal comparisons then are not between different cities in the United States. Rather, they’re between different stages of cost estimation for the same project. There is published literature on cost overruns, most famously by Bent Flyvbjerg and his research group. The report cites Flyvbjerg. Moreover, one of the nine academic experts it consulted is Don Pickrell, who published a seminal paper on American cost overruns and ridership shortfalls in 1990. Pickrell was influential enough that a 2009 review found that not only had cost and ridership projections improved greatly in the intervening two decades, but also there was an improvement in ridership estimate quality attributable to Pickrell’s paper.
The GAO report is not the best source on cost overruns, but it is not completely useless there. Unfortunately, it remains useless when it comes to discussing absolute costs, a different topic from relative increases. Flyvbjerg’s original paper found that the US did not have higher cost overruns than Europe; but absolute costs in the US are several times as high. Flyvbjerg’s paper found that urban rail has higher cost overruns than road projects; but when a rail tunnel and a road tunnel are built in the same city, the road tunnel is more expensive by a factor of 1.5-2.5, at least in the four-city pilot I reported in 2017, owing to the need to build bigger bores with ventilation to carry heavy car traffic.
Lazy analysis, lazy synthesis
Americans who think of themselves as reformers like to point out real problems to solve, but then propose solutions that they made up without any connection with their analysis. The RPA study is one such example: even though one of its sources (namely, former Madrid Metro CEO Manuel Melis Maynar’s writeup about low Spanish costs) explicitly calls for separation of design and construction, its recommendations include a greater reliance on design-build. The same design-build recommendation appeared in a 2008 report in Toronto comparing the costs of the Sheppard subway, opened in 2002, with those of subways in Madrid; construction costs in Toronto have since tripled, while those of Madrid have barely risen.
To the GAO report’s credit, it does not recommend design-build. It even mentions the biggest drawback of design-build: it shifts cost risk to the private contractor, who compensates by demanding more public money up front. Nonetheless, it does not follow through and does not make the correct recommendation on this subject – namely, that cities and states should cease using this approach. It buries a recommendation for in-house expertise alongside a fad for peer review of projects.
Instead of lazily proposing design-build, the GAO lazily proposes two barely relevant tweaks (PDF-p. 43):
- The FTA administrator should ensure that FTA’s cost estimating information for project sponsors is consistent with all 12 steps found in GAO’s Cost Estimating and Assessment Guide and needed for developing reliable cost estimates.
- The FTA Administrator should provide a central, easily accessible source with all of FTA’s cost estimating information to help project sponsors improve the reliability of their cost estimates.
In other words, the report makes no recommendation about how to reduce costs, only about how to tell the public in advance that costs will be unaffordably high.
Why are these reports so bad?
This is not the first time a serious group releases an incurious study of American construction costs. What gives?
I suspect the answer has to be a combination of the following problems:
- Reform factions often have a lot of internal ideas about how to improve things based on what they already know. They will cite new information if they feel like they must do so to save face, but they will not let new evidence change their conclusions. A little knowledge can be dangerous.
- Finding information from outside the US, especially outside the English-speaking world, puts Americans (and Canadians) at a disadvantage. They know few to no foreigners, have little experience with cities abroad except as tourists, and do not speak foreign languages. Even when machine translation is decently accurate, which it is in the engineering literature in European languages, they are intimidated by the idea of dealing with non-English material. The process of learning is humbling, and some people prefer to remain proud and ignorant.
- Open-ended analysis does not always lend itself to easy explanations or easy solutions. Even when solutions do present themselves, they may not flatter the people in power. Ten years ago I did not think senior management at American transit organs should be fired; today I think mass layoffs of the top brass, especially the political appointees, are somewhere between very useful and essential.
All three problems interact. For example, senior management is even less likely to be multilingual than junior staffers, who may be second-generation immigrant heritage speakers of a foreign language; thus, anything relying on foreign material disempowers the high-ups in favor of up-and-comers. The quick-and-easy-and-wrong solutions reformists seize upon if they find a little bit of knowledge let outfits like the GAO feel more powerful without actually challenging any obstructive politician or interest group, and if those solutions fail, they can always keep churning reports about implementation.
Last year, I did not know whether the GAO was capable of providing a blueprint for improving American infrastructure at lower cost. I assumed good faith because I had no reason not to. With this report, it is clear to me as well as to other observers of American public transit that the GAO is not so capable. Instead of doing what was in the country’s best interest, the people who commissioned and wrote the report delivered the minimal product that would get them kudos from superiors who do not know any better. They could have learned, or made a serious effort to learn, but that might challenge their assumptions or those of the high political echelons, and thus they preferred to say nothing and propose to do nothing.
Little Things That Matter: Interchange Siting
I’ve written a lot about the importance of radial network design for urban metros, for examples here, here, here, here, and here. In short, an urban rail network should look something like the following diagram:
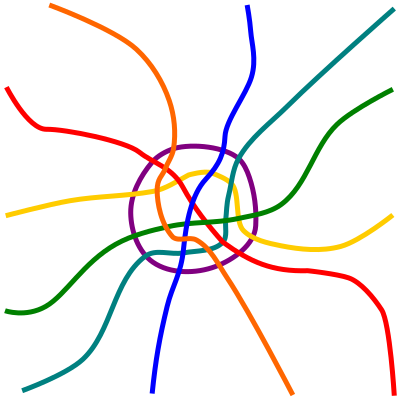
That is, every two radial routes should intersect exactly once, with a transfer. In this post I am going to zoom in on a specific feature of importance: the location of the intersection points. In most cities, the intersection points should be as close as possible to the center, first in order to serve the most intensely developed location by all lines, and second in order to avoid backtracking.
The situation in Berlin
Here is the map of the central parts of Berlin’s U- and S-Bahn network, with my apartment in green and three places I frequently go to in red:
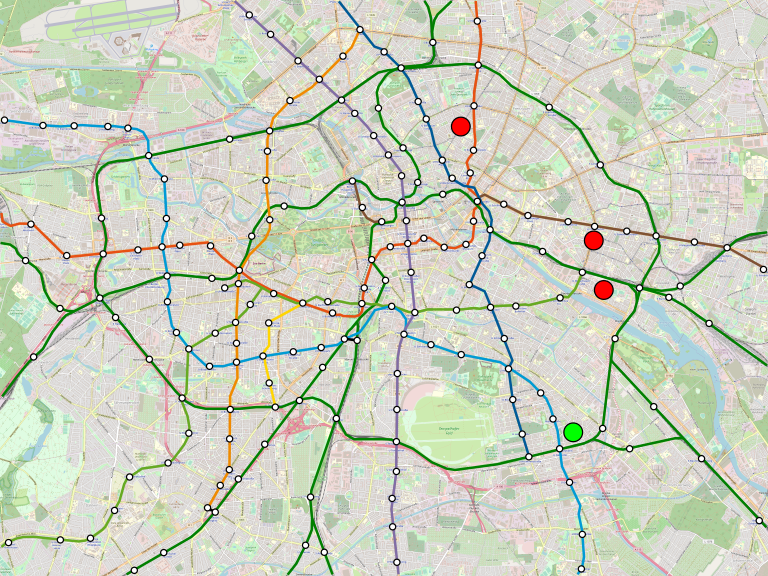
(Larger image can be found here.)
The Ring is severed this month due to construction: trains do not run between Ostkreuz, at its intersection with the Stadtbahn, and Frankfurter Allee, one stop to the north at the intersection with U5. As a result, going to the locations of the two northern red dots requires detours, namely walking longer from Warschauer Strasse to the central dot, and making a complex trip via U7, U8, and U2 to the northern dot.
But even when the Ring is operational, the Ring-to-U2 trip to the northern dot in Prenzlauer Berg is circuitous, and as a result I have not made it as often as I’d have liked; the restaurants in Prenzlauer Berg are much better than in Neukölln, but I can’t go there as often now. The real problem is not just that the Ring is interrupted due to construction, but that the U7-U2 connection is at the wrong place for the city’s current geography: it is too far west.
As with all of my criticism of Berlin’s U-Bahn network layout, there is a method to the madness: most of the route of U7 was built during the Cold War, and if you assumed that Berlin would be divided forever, the alignment would make sense. Today, it does not: U7 comes very close to U2 in Kreuzberg but then turns southwest to connect with the North-South Tunnel, which at the time was part of the Western S-Bahn network, running nonstop in the center underneath Mitte, then part of the East.
On hindsight, a better radial design for U7 would have made it a northwest-southeast line through the center. West of the U6 connection at Mehringdamm it would have connected to the North-South Tunnel at Anhalter Bahnhof and to U2 at Mendelssohn Park, and then continued west toward the Zoo. That area between U1/U2 and Tiergarten Park is densely developed, with its northern part containing the Cold War-era Kulturforum, and in the Cold War the commercial center of West Berlin was the Zoo, well to the east of the route of U7.
Avoiding three-seat rides
If the interchange points between lines are all within city center, then the optimal route between any two points is at worst a two-seat ride. This is important: transfers are pretty onerous, so transit planners should minimize them when it is reasonably practical. Two-seat rides are unavoidable, but three-seat rides aren’t.
The two-seat ride rule should be followed to the spirit, not the letter. If there are two existing lines with a somewhat awkward transfer, and a third line is built that makes a three-seat ride better than connecting between those two lines, then the third line is not by itself a problem, and it should be built if its projected ridership is sufficient. The problem is that the transfer was at the wrong location, or maybe at the right location but with too long a walk between the platforms.
Berlin’s awkward U-Bahn network is such that people say that the travel time between any two points within the Ring is about 30 minutes, no matter what. When I tried pushing back, citing a few 20-minute trips, my interlocutors noted that with walking time to the station, the inevitable wait times, and transfers, my 20-minute trips were exceptional, and most were about 30 or slightly longer.
The value of an untimed transfer rises with frequency. Berlin runs the U-Bahn every 5 minutes during the daytime on weekdays and the S-Bahn mostly every 5 minutes (or slightly better) as well; wait times are shorter in a city like Paris, where much of the Metro runs every 3 minutes off-peak, and only drops to 5 or 6 minutes late in the evening, when Berlin runs trains every 10 minutes. However, Parisian train frequencies are only supportable in huge cities like Paris, London, and Tokyo, all of which have very complex transfers, as the cities are so intensely built that the only good locations for train platforms require long walks between lines.
New York of course has the worst of all worlds: a highly non-radial subway network with dozens of missed connections, disappointing off-peak frequencies, and long transfer corridors in Midtown. In New York, three-seat rides are ubiquitous, which may contribute to weak off-peak ridership. Who wants to take three separate subway lines, each coming every 10 minutes, to go 10 kilometers between some residential Brooklyn neighborhood and a social event in Queens?
Free Public Transportation
Note: this may turn into a long series of posts about public transportation fare systems and payments.
From time to time, people propose free public transport. Supporters have a variety of motivations, including an attempt to mirror cars (“do state roads charge tolls?”), ideological socialism, positive externalities, and the efficiencies of getting rid of fare collection.
In reality, making service free at the point of use means spending money on subsidies from other sources – money that could be spent on other things than zeroing out the fares. There are opportunity costs, and robust public transportation networks do not gain much efficiency from being free. If there is money to make service free, there is money to spend on service improvements, including more metro lines, higher frequency, and wheelchair accessibility where it isn’t already present.
Literature review
A tweetstorm from two days ago includes references to a number of studies on this issue:
- After Tallinn made its public transportation network free for city residents, ridership rose 10% while car traffic fell 15%.
- Trenton and Denver’s 1970s experiments with free off-peak fares led to 15% overall increase in ridership, and 45% in the off-peak, but no change in car traffic – ridership was entirely induced.
- A report by Jennifer Perone citing American examples including Trenton and Denver as well as Austin’s 1989-1990 experiment concludes that “it is nearly certain that fare-free implementation would not be appropriate for larger transit systems,” citing joyriding and an increase in harassment in Austin rather than any diversion from driving.
Proof of payment
One argument for free transit is that it simplifies operations because no fare collection is needed. Front-door boarding and paying the drivers slow down bus boarding – each passenger takes 2.6-3 seconds to board (source, PDF-p. 20). Rapid transit systems also suffer from the complexity of fare collection infrastructure: batteries of faregates create chokepoints and require maintenance, and usually rapid transit agencies also have to hire station agents to watch the gates.
However, proof-of-payment fare enforcement, or POP, gets around most of these issues. If passengers do not need to pay at entry, everything becomes much simpler: they can board buses from any door, and get onto the train without crossing faregates. Berlin has all-door boarding and open, unstaffed U-Bahn stations. There are fare-vending machines, which are not free, but they are cheap. There are fare inspectors working on consignment – they get paid by catching non-paying riders.
Better uses for money
New York City Transit has $9.1 billion in operating and maintenance expenses as of 2016, and $4.3 billion in fare revenue (source). Ile-de-France Mobilités has a total of about €10 billion in annual operating and capital expenses, with about 10% of this being capital and the rest operating, and €2.8 billion in fare revenue. As of 2015, BVG had a total transport income of €1.344 billion (PDF-p. 7) and an additional subsidy of €620 million (PDF-p. 21).
In all of these cities, if there is money for fare elimination, there is money for further improvements in service. A disability rights advocacy group in Paris estimates the cost of making the Metro accessible at €4-6 billion, or 1.5-2 years’ worth of fares. Parisian construction costs for further Metro extensions are such that the budget for free fares could instead be spent on adding around 14 annual kilometers of new tunnels. In Berlin, a third S-Bahn trunk line running northwest-southeast would require about a year and a half’s worth of present-day fares to construct; adding service to guarantee 5-minute frequency on all trunk lines even on weekends and evenings would require a small increase in operating expenses.
New York’s construction costs are much higher than those of Paris and Berlin, and even its operating costs are elevated, but then it also charges higher fares. If there is $4.3 billion a year for free fares, there is much less $4.3 billion a year for boosting off-peak frequency on every named route (2, 4, A, etc.) to at worst 6 minutes, with 2- and 3-minute off-peak frequencies on interlined trunk lines. As with Paris, there is also a dire need for wheelchair accessibility; thanks to very high costs, full installation would not cost just 1.5-2 years’ worth of fare revenue, but more like 3 years’ worth.
Cities with and without public transport
The above discussion centers where the vast majority of public transportation takes place – that is, in cities with serious public transportation systems. The argument changes completely in smaller cities, which run the occasional bus but not at the required speed, coverage, or frequency for it to count as a real public transport network.
In Germany, there is no free transit, but the difference between big-city and small-city fare enforcement is telling: only relatively big cities have POP systems. Small-town Germany makes bus passengers pay the fare to the driver, and runs trains with conductors checking tickets. The reason is that roving inspectors only work on systems with enough frequency and coverage, or else they can’t efficiently ride the buses and trains and check tickets.
If POP is not possible, then the cost of collecting fares rises: buses are slowed down by every additional passenger, and trains require a second crew member. Such systems often have very low farebox recovery in the first place, and a very low-income rider profile, since everyone who can afford to drive drives rather than waits 25 minutes for the bus. In Los Angeles, total fare revenue on Metro (which includes most buses) is $350 million a year and total operating and maintenance expenses amount to $1.57 billion, and the average public transport commuter has about half the average income of the average solo driver. In that specific use case, making public transport free may be justified.
The one caveat is that if the plan is to convert a city from one without public transportation to speak of to one with a good system, for example in Los Angeles, then in the future, revenue will become more important. Even if free public transport is a good idea in the conditions of 2019, it may not be such a good idea in those of 2035, at least if grandiose transit city plans materialize (and I don’t think they will – the state of American local governance just isn’t good enough for cities to follow through).
Costs are Rising, US Highway Edition
There’s a preliminary paper circulating at Brookings, looking at American infrastructure construction costs. Authors Leah Brooks and Zachary Liscow have tabulated the real costs of the American Interstate program over time, from the 1950s to the 1990s, and find that they increased from $5.3 million per km ($8.5 million/mile) in 1958-63 to $21.3 million/km ($34.25 million/mile) in 1988-93.
Moreover, they have some controls for road difficulty, expressed in slope (though not, I believe, in tunnel quantity), urbanization, and river and wetland crossings, and those barely change the overall picture. They go over several different explanations for high American infrastructure costs, and find most of them either directly contradicted by their results or at best not affirmed by them.
I urge readers to read the entire paper. It is long, but very readable, and it is easy to skip the statistical model and go over the narrative, including favored and disfavored explanations, and then poke at the graphs and tables. I’m going to summarize some of their explanations, but add some important context from cross-national comparisons.
Why costs (probably) aren’t rising
The authors identify four hypotheses they rule out using their research, in pp. 19-23 (they say five but only list four):
Difficult segments postponed and built later – they have some controls for that, as mentioned above. The controls are imperfect, but the maps depicted on pp. 59-61 for the Interstate network’s buildout by decade don’t scream “the segments built after 1970 were harder than those built before.”
Time-invariant features – these include cross-national comparisons, since the United States has always been the United States. I will discuss this in a subsequent section, because two separate refinements of what I’ve seen from cross-national comparisons deal with this issue specifically.
Input prices – this is by far the longest explanation the authors deal with. Anecdotally, it’s the one I hear most often: “labor costs are rising.” What the authors show is that labor and materials costs did not rise much over the period in question. Construction worker wages actually peaked in real terms in 1973 and fell thereafter; materials costs jumped in the aftermath of the oil crisis, but came down later, and were back at pre-crisis levels by the 1990s (p. 48). Land costs did rise and have kept rising, but over the entire period, only 17.7% of total costs were preliminary engineering and land acquisition, and the rest were in construction.
Higher standards – the authors looked and did not find changes in standards leading to more extensive construction.
There are several more incorrect explanations that jump from the data. I was surprised to learn that throughout the 1970s and 80s, completion time remained mostly steady at 3-3.5 years of construction; thus, delays in construction cannot be the explanation, though delays in planning and engineering can be.
The authors themselves list additional explanations that have limited evidence but are not ruled out completely from their data, on pp. 32-35. Construction industry market concentration may be an explanation, but so far data is lacking. Government fragmentation, measured in total number of governments per capita, has no effect on the result (for example, California has high costs and not much municipal fragmentation); I’ll add that Europe’s most municipally fragmented country, France, has middle-of-the-road subway construction costs. State government quality, as measured by corruption convictions, has little explanatory power – and as with fragmentation, I’ll add that in Europe we do not see higher costs in states with well-known problems of clientelism and corruption, like Italy and Greece. Work rules requiring the addition of more workers may be relevant, but unionization and left-right politics are not explanatory variables (and this also holds for rail costs).
Economies of scale look irrelevant as well: there is negative correlation between costs and construction, but the causality could well go the other way. Finally, soft budget constraints are unlikely, as the federal government can punish states that mismanage projects and take more money; it’s possible that as the Interstate program ended states felt less constrained because there wouldn’t be money in the future either way (“end of repeated game”), but the fact that costs keep rising in subway construction suggests this is not relevant.
Favored explanations
Two explanations stand out to the authors. The first is that nearly the entire increase in construction costs over time can be attributed to a mix of higher real incomes and higher house prices. While the construction workers themselves did not see their wages rise in the late 1970s and 80s, a richer population may demand more highways, no matter the cost.
Higher real estate costs could have an impact disproportionate to the share of land acquisition in overall costs by forcing various mitigations that the paper does not control for, such as sound walls and tunnels, or by sending roads over higher-cost alignments.
The second explanation is what the authors call citizen voice. Regulatory changes in the 1960s and early 70s gave organized local groups greater ability to raise objections to planning and force changes, reducing community impact at the cost of higher monetary expenditures. The authors give an example from suburban Detroit, where a highway segment that disrupted a Jewish community center took 25 years to be built as a result of litigation.
The authors don’t say this explicitly, but the two explanations interact well together. The citizen voice is very locally NIMBY but is also pro-road outside a handful of rich urban neighborhoods. Higher incomes may have led to public acceptance of higher costs, but local empowerment through citizen voice is the mechanism through which people can express their preference for higher costs over construction inconvenience.
How time-invariant are national features, anyway?
The authors contrast two proposed explanations – higher incomes and property values, and stronger NIMBY empowerment – with what they call time-invariant features, which could not explain an increase in costs. But can’t they?
I spent years plugging the theory that common law correlates with high subway construction costs, and it does in the developed world, but upon looking at more data from developing countries as well as from before the last 25 years, I stopped believing in that theory. It started when I saw a datapoint for Indonesia, a civil-law country, but even then it took me a few more years to look systematically enough, not to mention to wait for more civil-law third-world countries to build subways, like Vietnam. By last year I was giving counterexamples, including Montreal, low rail electrification costs in some common law countries, and the lack of a London cost premium over Paris until the late 20th century.
In lieu of common law, what I use to explain high costs in the US relative to the rest of the world, and to some extent also in most first-world common law countries as well as third-world former colonies, is weak civil service. In the developed world, the theory behind this is called adversarial legalism, as analyzed by Robert Kagan. Adversarial legalism enforces the law through litigation, leading to a web of consent decrees. Some are naked power grabs: for example, in Los Angeles, a union sued a rolling stock vendor for environmental remediation and agreed to drop the lawsuit in exchange for a pledge that its factory be unionized, which may play a role in why the trains cost around 50% more than equivalent European products.
American litigiousness developed specifically in the 1970s – it’s exactly how what the authors of the paper call citizen voice is enforced. In contrast, on this side of the Channel, and to some extent even generally on this side of the Pond, laws are enforced by regulators, tripartite labor-business-government meetings, ombudsmen, or street protests. French riotousness is legendary, but its ability to systematically change infrastructure is limited, since rioting imposes a real cost on the activist, namely the risk of arrest and backlash; in contrast, it is impossible to retaliate against people who launch frivolous lawsuits.
I bring up the fact that I said most of this last year, and the rest at the beginning of this year, whereas I was not aware of the paper under discussion until it was released a few hours ago, to make it clear that I’m not overfitting. This is something that I’ve been talking about for around a year now, and a jump in American construction costs in the 1970s and 80s – something that also looks to be the case in subway construction – is fully compatible with this theory.
West Station is an Overbuilt Mess
Boston has been on a commuter rail infill binge lately; it has opened four stations on the Fairmount Line this decade, with general success, and is now eying the Worcester Line, where the MBTA has already opened a single in-city station called Boston Landing. The next station to be opened is called West Station, serving Allston, a middle-class urban neighborhood home to Boston University. Unfortunately, the West Station project has suffered from budget and schedule overruns: the current projection is $90 million, where past stations in the area have opened for about $15-25 million each, and construction will start next decade and only wrap up by 2040.
The cause of the extreme cost is poor design. The station as currently proposed is an overbuilt mess. It is development-oriented transit, sited next to an area that Harvard wishes to redevelop as a new campus, and the compromises made between good rail service, intermodal bus-rail connections, and encouraging development make the project fail at all of its objectives. The idea of an infill station in Allston is solid and the MBTA should keep working on the project, but it should do it right – that is, maximize passenger utility while also slashing the budget by a factor of about 4.
I encourage readers to look at a presentation about the status of the project from May, and at another presentation from June, which was sent to members of the media and neighborhood.
Intermodal integration done wrong
The West Station site is roughly in the center of the new development. Unfortunately, it is poorly-located relative to the street network. With its hierarchy of major and minor streets, Boston is not forgiving to wrong station siting: buses would have to meander to reach the site.
The busiest bus in the area, and among the busiest in the region, is the 66. See image below:

The Red and Green Lines of the subway are in their respective colors (and the Green Line’s branches are surface light rail), the Worcester Line is in purple with its existing stations marked alongside the proposed West Station site, and the 66 bus is in black. The dashed purple line is the disused Grand Junction Railroad – see below for more explanation.
North of the West Station site, the bus could still reach the platforms relatively easily, as the plan includes mapping new streets over the entire site. But to the south, the streets are narrow and practically unusable. All north-south through-traffic is funneled through Harvard Avenue – anything else would meander at speeds not much higher than that of walking.
What’s more, the zigzag in the image above comes from a detour to the center of Allston, called Union Square. The West Station site would move service farther away from Union Square, forcing it to either abandon its single busiest stop or have a more circuitous route. Serving both West Station and Union Square requires running two separate north-south bus routes sharing much of their southern legs, which is bad for frequency. Already the 66 runs every 10 minutes off-peak in one direction and every 14 in the other; this is worse than the minimum acceptable on such a key route, and any further reduction in frequency through route splitting is unacceptable.
Finally, the station design as shown in the presentations includes ample room for bus bays, so that buses can terminate at the station. Such a layout may be appropriate at the center of a small town with timed bus-rail transfers; in the middle of the city, it is pointless. The 66 crosses the rail tracks and has no use for terminal berths. Nor is there any need for terminating buses running parallel to the tracks – passengers could walk to another train station on the Worcester Line or on the Green Line.
The MBTA has never released any public plan for a bus redesign around West Station. It talks about intermodal transfers but refuses to give any details, and it’s likely these details don’t even exist yet. There are occasional excuses, such as intercity buses (why would they terminate there instead of continuing to South Station?), buses to Kendall Square (they don’t need bus bays either), and buses to Longwood (Longwood is south of the Worcester Line and would be better-served by a commuter rail-to-Green Line transfer near Fenway Park).
Track design for maximum conflict
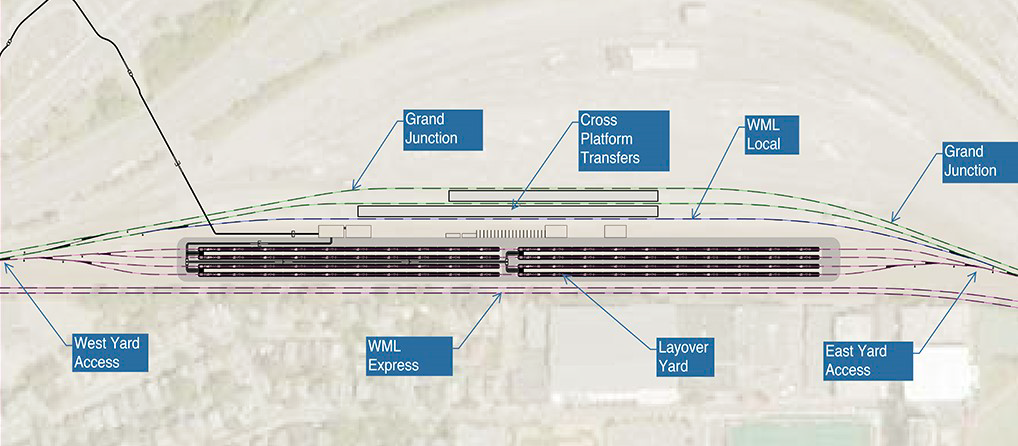
The latest option for West Station is called the flip option. The diagrams below are from the June presentation, pp. 8-10, going west to east:
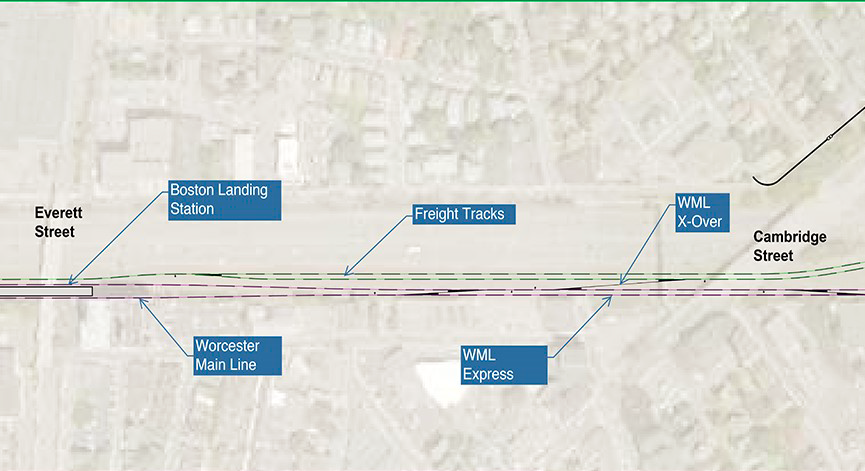
There are to be two bypass tracks (“WML Express”), located where the current mainline is. There are also to be three tracks with station access, both on the other side of the railyard. The tracks serving the platforms cross the bypass tracks in a flat junction, forcing dependency between the inbound and outbound schedule. The flat junction is not especially quick, either – it is a long ladder track, requiring inbound local trains to South Station to make two slow diverging moves in succession.
The MBTA is planning to spend tens of millions of dollars on station platforms in Newton turning the line into full double-track all the way from Boston to Worcester, freeing the schedule from such dependency, but at the same time it’s planning to add new conflicts.
While the diagrams label two tracks as freight tracks, there is little to no freight on that portion of the line. A freight rail spur in the area, serving Houghton Chemical, was just removed in preparation for the project. The line can and should be designed exclusively around the needs of regional passenger trains, for which the most important thing is continuous operation of double track, preferably with no flat junctions with oncoming traffic, and not any ancillary frills.
The Grand Junction tangential
The MBTA has grandiose plans to use the Grand Junction Railroad to allow trains from Allston and points west to avoid South Station entirely. The Grand Junction provides a bypass to the west of Downtown Boston, which currently sees no passenger service but is used for non-revenue moves between the South Station and North Station networks. There are periodic plans to reactive service so as to enable trains from the west to serve Cambridge and North Station instead. In the flip option, all local trains are required to go to the Grand Junction or switch back to the mainline using the ladder track.
Consult the following table, sourced to OnTheMap, for the number of jobs accessible within walking distance of the various station sites:
| Station | Walkshed boundaries | Jobs |
| South Station | Essex, Tremont, State, the harbor | 119,191 |
| Back Bay | Hereford, Belvidere, Columbus, Arlington, Storrow | 62,513 |
| Kendall | Binney, Third, Wadsworth, Memorial, Mass Ave, Windsor, Bristol | 29,248 |
| North Station | Blossom, Cambridge, State, Prince, the river | 33,232 |
Jobs accessible on the existing mainline outnumber ones accessible via the Grand Junction by a factor of about three. It is not technically sound to avoid city center on an urban rail line, much less a suburban one. Only if the line is a consistent circumferential line is there a good reason to go around the center.
A far-future subway duplicating the 66 route may succeed. The same may be true of a shuttle using the Grand Junction, but such shuttle may well need extensive new track – West Station is not necessarily the best south-of-Charles footprint (turning east toward BU to form a loop with a future North-South Rail Link is better). In contrast, the current plan for diversion of Newton trains toward a secondary job center and away from Downtown Boston has no chance of getting substantial ridership.
The railyard as an obstacle
For a project so focused on redevelopment, West Station does not do a good job encouraging construction in the area. It plans to keep the railyard in the middle, and even forces local and express trains to go on opposite sides of it. But the railyard is an obstacle not only to sound railway operations but also to redevelopment.
Building anything over rail tracks is complicated. New York supplies a few such examples: the link mentions the difficulties of Atlantic Yards, and to that I will add that the construction of the Hudson Yards towers cost around $12,000/m^2, compared with $3,000-6,000 for Manhattan supertall office towers on firma. Hudson Yards has managed to be financially successful, albeit with tax breaks, but it’s located right outside Midtown Manhattan. Allston’s location is not so favored. The cost penalty of building over railyards is likely to make air rights unviable.
There is still an extensive portion of the site that’s on firma. However, if the point is to maximize redevelopment potential, the city and the state must discard any plans for air rights. The railyard should go in order to increase the buildable area.
In lieu of parking at a railyard in a desirable near-center location, trains should circulate back and forth between Boston and Worcester. The MBTA keeps saddling itself with capital costs because it likes running trains one-way to Downtown Boston in the morning and then back to the suburbs in the afternoon, parking them near South Station midday. This is bad practice – trains are not just for suburban salarymen’s commutes. Urban infill stations in particular benefit from high all-day frequency and symmetric service. If the MBTA needs space for train parking, it should sell the railyard in Allston and charge Allston land prices, and instead buy space in Framingham and Worcester for Framingham and Worcester land prices.
West Station, done right
Thanks to delays and cost overruns, West Station is still in preliminary design. There is plenty of time to discard the flip option as well as the original plan in favor of a route that maximizes intermodal connections at minimum cost. A better West Station should have all of the following features:
- A simple four-track design, either with two stopping tracks and two bypass tracks or four stopping tracks and two island platforms, depending on long-term plans for train timetables
- High design speed, as high as the rest of the line for nonstop trains, as the tracks are straight and do not require any speed restriction
- Retention of double-track rail service throughout construction, even at the cost of more disruption to the Massachusetts Turnpike
- No at-grade conflicts in opposing directions: tracks should go slow-fast-fast-slow or fast-slow-slow-fast rather than slow-slow-fast-fast
- No bus bays: crosstown buses (that is, the 66) should stop on the street crossing the station right above the tracks, with vertical circulation directly from the bus stop to the platform in order to minimize transferring time
- Subject to site availability, platforms reaching Cambridge Street for a connection to the present-day 66 and a shorter walk to Union Square
- Elimination of the railyard to make more room for development, and if the line needs more yard space, then the state should find cheaper land for it in Framingham and Worcester
There is no reason for such a project to cost more than past infill stations built in Boston, which have cost around $15-25 million, about the same range as Berlin. By removing unnecessary scope, the MBTA can make West Station not only cheaper and easier to build but also more useful for passengers. The idea of an infill commuter rail station in Allston is good and I commend the MBTA for it, but the current plan is overbuilt and interferes with good rail and bus operations and needs to be changed immediately, in advance of engineering and construction.
Costs are Rising
This is a partial data dump from an in-progress database I’m compiling for subway construction costs around the world. The key point is that costs are rising: in cities with enough historical data points we can see a secular increase in construction costs. The difference between expensive cities like New York and London is that their costs have been high for a while, whereas cheap ones like Madrid and Seoul are seeing construction cost growth from a very low basis.
As a note of caution, while growth in costs seems universal, the rate of growth is not the same everywhere. Some cities, most notably Singapore and Toronto, have seen a cost explosion in the last 15-20 years; others, most notably Seoul, have seen only a moderate increase in costs.
I also urge readers to look at some 20th century historical costs here, as in this post I am going to focus on the very end of the 20th century and the 21st century.
Paris: the original Metro Line 14 cost €1.174 billion for 9.2 km (link), built between the 1990s and 2007; deflated to 2012 euros, the baseline year used for ongoing extensions, this is around €160 million per km. More recent projects in Paris cost around the same, including the Line 1 extension and Grand Paris Express – but those are mostly suburban extensions, whereas M14 had to go underneath central Paris.
Toronto: Jonathan English, who has been working with me on Canadian construction costs issues, notes that the Sheppard subway, opened in 2002, cost C$1 billion for 5.5 km, but ongoing projects are far more expensive. The one-stop 6.2 km Scarborough subway is projected to cost around C$3.5 billion not including extra items for interfacing with the existing rapid transit line along the same alignment, which is to be dismantled. Not only is the nominal cost 3 times higher – and the real cost is still around twice as high – but also the Scarborough subway has just one station to be constructed, which makes it a simpler project.
Montreal: Jonathan equally looks at the cost explosion in Montreal. The Laval extension was built in the 2000s and opened in 2007, costing C$742 million for 5.2 km and 3 stations, or C$143 million per km, crossing under the Rivière des Prairies. In contrast, an extension of the Blue Line planned for next decade is to cost C$3.9 billion for 5.8 km and 5 stations, or C$672 million per km – and even adjusting for inflation only reduces the cost differential to a factor of about 3.
(In case Canadian readers wonder why I’m not covering Vancouver, even though the escalations on the Broadway subway have pushed its per-km cost well beyond that of the Canada Line, the reason is that the Canada Line was built cut-and-cover whereas the Broadway subway will be bored.)
Singapore: Singapore’s cost overrun history in the 21st century has been unusually severe. Built mainly in the 2000s, the original Circle Line cost S$10 billion for 33.3 km, or S$300m/km, an overrun of 50% over the original budget. Subsequently, the Downtown MRT Line, built from 2008 to 2017, cost S$21 billion for 42 km, and the Thomson Line S$24 billion for 43 km. The Thomson Line has a complex interchange at Orchard, but also long segments in easy suburban areas – Upper Thomson Road, after which it is named, is very wide and borders modernist housing projects on one side and a forest on the other. Moreover, the last stage of the Circle Line, completing the circle, is to cost S$4.85 billion for 4 km and 3 stations – depending on PPP rates, it may be the first line outside New York to cross the US$1 billion/km line.
Seoul: South Korean costs are fairly stable. JRTR has data for the Seoul Metro going back to its start in the 1970s. After adjusting for inflation, costs were initially about $70 million per km, and rose gently to $80-90 million. The cost increases are continuing, albeit at a slow pace. As best as I can tell, the 2020s’ expansion program is budgeted at about $110 million per km in PPP terms.
Madrid: in the 1995-2003 period the city built tunnels for very low costs. The 1995-8 program cost $55 million per km, all underground, and the 1999-2003 program cost €3.147 billion for 74.7 km, 77% underground, around $52 million per km based on the era’s PPP conversion rate. In the conditions of 2010 this would be roughly $65-70 million per km – but the Line 2 extension, built 2008-11, cost €315 million for 4.6 km and 4 stations, and the Line 9 extension, built 2009-15, cost €191 million for 3 km and 2 stations, about $80-90 million per km.
Update: since people have asked for high-speed rail data, it confirms the same story. Ferropedia has costs in Spain, which have risen from €4.88 million per kilometer in 2001 terms for Madrid-Seville, which opened in 1992, to about €15-20 million per kilometer in 2006-7 terms for subsequent lines from the 2000s and 2010s. France displays the same history of escalation: built in the early 1980s, the LGV Sud-Est cost €5.5 million per km, much less than the late 1980s and early 1990s’ LGVs Nord and Atlantique (which cost €10 million), let alone this decade’s LGV Est (which cost €16 million for Phase 1 and €19 million for Phase 2); all of these lines are through comparable terrain, with very little to no tunneling.
Scooters
Three weeks ago, the consultancy 6t released a study about dockless e-scooters in France. The study is available only in French but there is an executive summary in English. It has convenient demographic profiles of e-scooter riders in Paris, Lyon, and Marseille, and generated some media controversy over the fact that scooters are barely displacing car trips – rather, they’re replacing trips by foot or public transit. This is on top of calls for greater regulations of the mode in multiple countries, not just by NIMBYs but also by serious urbanists like Streestblog’s Angie Schmitt; I was alerted to the study in the first place by Jonathan Rosin, who proposes regulations requiring geofencing to prevent riding on the sidewalk.
And yet, there’s something interesting about scooters and transit in the study, which suggests to me scooters have a positive role to play in a transit city. On p. 80, figure 48 shows combination of scooters with other modes. Out of about 4,000 respondents, 886 say they used scooters in combination with another mode – and of the latter, 66% used it in combination with public transportation.
How worried should we be about rider behavior?
Not really. There is an American discourse concerning dockless transportation that complains about clutter, scooter-pedestrian conflict, and nuisance scooters or bikes left on the sidewalk. The study itself discusses the regulations of e-scooters in various countries. In Britain and Italy e-scooters are legally classified as motor vehicles, which is effectively a ban, and in the US there are onerous regulations such as a requirement for a driver’s license and a minimum age of 18, such as in California. In France, Germany, Switzerland, Austria, Sweden, and Denmark, regulations are laxer, e.g. in Germany the minimum age is 14 and the e-scooter is treated as a bike.
The sort of clutter that Americans complain about was not evident to me in Paris, one of the largest markets in the world for e-scooters as well as bike share (it still has the largest bike share program in the world outside China). As far as I could tell, scooters were mostly used around Nation for recreational trips – at the very least, people did not preferentially leave them right at the Metro and RER station, and I did see a fair number of dockless vehicles (I forget if just bikes or also scooters) at the Bois de Boulogne. Central Paris had a higher density of scooters, but they too did not seem to clutter on the street, and I don’t remember ever having had to dodge a scooter even though people did ride on the sidewalk.
At least at eye level, the lax regulations France does have – the minimum age is 8, cities may choose to permit or prohibit riding on the sidewalk, riding on all streets with speed limit up to 50 km/h is required – appear sufficient. The American, British, and Italian approaches are too draconian and only serve to discourage this mode of transportation.
Gaps in the transit system
Pp. 111-4 have tables describing mode switching. Few of the scooter users would have traveled by car if the scooters hadn’t been available, only 8% including taxis and TNCs (“VTC” in French). In contrast, 46% would have walked and 32% would have taken public transportation.
But is this even a problem? The same tables have the average transit-to-scooter switcher gaining 5 minutes, taking 19 minutes instead of 24. On short trips, scooters are useful for filling little gaps in the regional public transport network. Maybe the origin and destination are not well-connected by Metro, as is for example the case for Nation and much of the Left Bank, so that a transit trip would require transfers. On a poll suggesting non-mutually-exclusive options for why people choose scooters over transit, 68% say it’s nicer, but 44% say it’s faster and 39% say it’s direct. From the perspective of the transit agencies, a mode that makes certain crosstown trips easier without changing trains at Chatelet is a net positive, as it decongests the station as well as other complex transfer points.
According to Owen Gutfreund’s book 20th Century Sprawl, in the 1900s and 1910s the American railroads were supportive of road expansion. To the railroads, cars were a natural complement to trains, extending their range beyond that of a horse or bicycle. Of course, soon the cars turned into competitors, once roads improved to the point of allowing longer-distance travel. But scooters, limited to 25 km/h, do not have that capability. The mode of transportation most comparable to the e-scooter, the bicycle, coexists with a solid regional and intercity rail network in the Netherlands.
Ban cars
The ultimate goal of the green movement in general and of public transit activism in particular should be to ban cars, or else get as close as possible to banning them. Modes of transportation that are not cars that provide alternative functionality to cars are almost always a good idea in this scheme.
Trains are an excellent alternative for long trips, that is out-of-neighborhood trips for such purposes as work, school, citywide social events, and intercity travel. Shorter trips are dominated by walking in transit cities. However, there are two important caveats for the idea of doing short trips on foot. First, there is a genuine in-between region in the 2-4 km range. And second, people with disabilities may not be able to walk long distances, which lowers the upper limit from the 1-2 km range to a much shorter point, perhaps 500 meters – and if their disabilities do not require the use of a wheelchair, then they may well find scooters an acceptable alternative.
In Paris itself, which dominates the survey, scooters are not replacing cars, for a simple reason: few trips in Paris are done by car in the first place. But a robust scooter network can expand out of the city into suburbs with higher present-day car usage, and those suburbs can then become ever more walkable thanks to the displacement of cars by greener modes of travel.
Assume Nordic Costs: London Edition
A month ago I made maps proposing some subway and regional rail extensions in New York and noting what they would cost if New York could build as cheaply as the Scandinavian capitals. Here is the same concept, but with London rather than New York. Here is everything in a single large map:
A full-size (74 MB) map can be viewed here.
Solid lines are existing or under construction, that is Crossrail and the Battersea extension; proposed lines are dashed. Commuter rail lines, that is Thameslink, the soon-to-open Crossrail, and four additional Crossrail tunnels labeled 2 through 5, are always depicted as having separate stations from the other modes, to avoid confusion where one Crossrail station has connections to two adjacent Tube stations (such as Farringdon-Barbican and Moorgate-Liverpool Street). It has many additional interchanges between lines and branches, including some that were left out on purpose, like a Crossrail 1 connection to Oxford Circus, omitted from the under-construction line to discourage riders from using the oversubscribed Victoria line; with four more cross-city lines, the capacity problems would be lessened substantially.
The overall picture is sparser than my New York map. The total projected cost of all of these projects, including some allocated for redoing stations on commuter branches to be given to Tube lines, is £6.8 billion, compared with $37 billion for the New York maps. The reason is that unlike New York, London already has excellent coverage thanks to extensive branching – what it needs is core capacity, which consists of city center tunnels that have high cost per kilometer but need not be long.
There is considerable overbuilding planned in London. Crossrail 2 as depicted on my map is a 6.5 km tunnel between the approach to Victoria Station and the approach to Kings Cross. But as planned, Crossrail 2 extends to a long tunnel parallel to the South West Main Line, a four-track line in a right-of-way that could if truly necessary accommodate six, as well as a long tunnel going north to take over the Lea Valley Lines, which on my map go into Crossrail 5. With gratuitous suburban tunnels and extremely high British construction costs, the budget for Crossrail 2 is around £30 billion, about 20 times what Scandinavia might spend on such a project. Even allowing for the possibility that crossing under three lines at once at Bank is more complex than crossing under two at T-Centralen, this is a difference of a full order of magnitude, counting both total required tunnel length and cost per km.
In addition, there is network simplification. On the Tube this consists of segregating the Northern line’s Bank and Charing Cross branches (already in planning pending the Battersea extension and reconstruction of Camden Town) and through breaking the Circle line into separate Metropolitan and District lines. The latter was estimated by a British blogger to cost £5 billion, based on a rubric in which the Met/District transfer at Aldgate (or Tower Hill) should by itself cost £1 billion; Crossrail and Second Avenue Subway stations cost around half that much, and the more complex T-Centralen and Odenplan stations on Citybanan cost less.
On mainline rail, the service plan is supposed to be deinterlined, as is Transport for London’s long-term goal. The slow tracks of the various mainlines feeding into Central London turn into Crossrail branches, or occasionally Underground extensions, such as Hayes and the Hounslow Loop. The fast tracks stay on the surface to avoid interfering with high-frequency regional metro service. For historic reasons Thameslink mostly stays as-is, with a combination of fast and stopping services, but the curve toward London Bridge should not be used – instead, passengers should have access to Crossrail 3 plus interchanges to the City at London Bridge and a new infill station at Southwark.
London owes it to itself to understand why its construction costs are so high that instead of solving its transport capacity problems with multiple cross-city tunnels in a decade, it’s taking multiple generations to build out such a system. There’s a lot of ongoing discussion about the last-minute delays and cost overruns on Crossrail, but the absolute costs even before the overrun were very high, the highest in the world outside New York City – and Crossrail 2 is set to break that record by a margin.
Trip Chaining, Redux
There’s been an ongoing conversation about how public transport can be used for non-work trips (and what it means for women) that makes me go back to something I wrote in 2012 about trip chaining. In that post I asserted a distinction between long and short trips, but I didn’t make it very clear. The importance of this distinction is that even though a large majority of trips are not work trips, the sort of urban layout that makes long trips (including work trips) usable by train tends to also make other trips doable on foot.
Trip length and purpose
Mobilität in Deutschland periodically reports on national travel patterns. The 2017 MiD report includes mode shares, trip lengths, and purposes, some broken down by state. Unlike in the Anglosphere or in France, the headline modal share is for all trips, not just work or school trips, and therefore the numbers for public transit look lower and those for walking and cycling look higher.
The important statistic for trip-chaining comes from a table on p. 19. There were 42 million work trips and 41 million shopping trips nationwide in 2017, but the work trips were on average more than three times as long, 16 vs. 5.3 kilometers. The only trip category longer than work was business trips, on average 19 km, including an extensive number of intercity trips, and the only category close to work trips was recreational trips, averaging 15.5 km, also including extensive intercity travel; the median work trip was by a fair margin the longest, 8 km, whereas the median shopping trip was 2 km. Likewise, errand trips were 10.2 km on average with a median of 3.6.
MiD doesn’t break down this data by region, unfortunately. So I can only speculate that if the median trip that people talk about when they talk about trip chaining is 2 km long, then the median trip in the parts of Germany with good public transit is short enough to be done on foot, probably shorter than a kilometer.
Short and long trips
I think it’s useful to collapse the distinction between trips into a binary one: short versus long. Trip length is of course a continuous variable, but a good classification scheme is “can it be done internally to a neighborhood or town?”. If the answer is yes then the trip is short, otherwise it is long.
The commute is an example of a long trip. Commuting to school is usually a long trip as well; even in an environment with school zoning and no selection or choice, a secondary school draws from too large an area to be a single neighborhood except in an extremely large and dense city. Social trips can be long as well – if I go to a gaming convention or a performance in Berlin, or if someone who cares about sports goes to see a football match, it’s a long trip.
Short trips include shopping, errands, eating out, and daycare. The common aspect to them is that they involve common activities with small draws. The supermarket draws from a community of a few thousand, as does the neighborhood restaurant. In contrast, the performance is unique – while many people go to concerts, different people are fans of different artists, so a single band may need to visit a city of millions to fill an auditorium.
Making transit useful for non-work long trips
I bring up the example of going to a sports game as a long trip because American transit agencies deal with that routinely even if they otherwise only care about work trips. Commute trips tend to happen at specific times of day, especially if you’re from the same middle class that transit managers are drawn from. Other long trips have different peaks. Leisure trips tend to happen in the evening and on weekends. Business trips within metropolitan areas tend to happen in the middle of the day during work hours. Trips to the airport depend on time zones – in New York the ones to JFK are concentrated in the afternoon peak, but it’s hard to make generalizations.
Like work trips, non-work long trips are not isotropic – people travel to specific places. A few are as a rule outside city center, such as sports stadiums and airports. Others are within city center to appeal to a wide cross-section of residents, such as event spaces for performances; conventions run the gamut, but richer and more important conventions are likelier to shell out money for city center real estate. Universities may be in or outside city center, depending on the city. Museums are usually city center or in neighborhoods just outside it, such as the Upper East and West Sides in New York or Balboa Park in San Diego.
The length means that the optimal transit network for all non-work trips is largely the same. If trains arrive at a reasonable frequency all day, every day, and form a coherent radial network, then passengers will able to use them for all long trips, even ones that are not for work. The major destinations that are outside city center should whenever possible be junctions between different branches, or get circumferential and not just radial service.
Moreover, there is little point in trying to vary modes for work and non-work trips. Surface transit that averages 15 km/h but saves you a 1-minute trip down to the subway is no more useful for going to a concert than for going to work. If poor urban planning has resulted in an airport that’s nowhere on the rail network or in regional convention centers that are impossible to serve, then buses can fill in the gap, but that’s not optimizing for non-work trips but rather fixing past design mistakes, no different from doing the same when suburban office parks are built far from the train.
The one serious change one needs to make is that the definition of city center needs to be broader than the few square blocks that comprise most American cities’ downtowns. The London Underground’s conception of Central London is not just the City, and likewise cities need to ensure that their West Ends (like, again, San Diego’s Balboa Park) are served as if they were central rather than peripheral areas.
Short trips
It is wrong for cities to try optimizing public transportation for short trips. Most short trips can be done by foot; if they can’t, something is wrong with the city’s urban design. The minimum density required for people to be able to walk to retail is not high – I have a choice of supermarkets within walking distance, and Berlin is not an especially dense city. In Paris, which unlike Berlin is especially dense, I walked to the hypermarket.
Occasionally, when a short trip needs to be done on mechanized transportation, if the city has good transit-oriented commercial development then it is doable by riding the trains a few stops. I recently bought a mattress at Hermannplatz, 3 stops away on U7, longer than most people inside the Ring have to go to such a store, and mattresses are a special case in that dragging them on the streets for a kilometer isn’t fun.
Suppression of auto use is especially valuable for short trips. The reason is that in auto-oriented areas, short as well as long trips are done by car, and if businesses locate based on automobile scale, then only transit can compete – walking and cycling take too long. A hefty proportion of the urban upper middle class prefers to own cars and drive them for short trips, which may induce short trip destinations to locate based on automobile scale even in a walkable city; when I lived in Providence, I walked to the supermarket, but it was located right next to a freeway exit and had ample parking.
Trip chaining
The concept of trip chaining – going directly between destinations in a row rather than just going back and forth between home and a destination – works best with the mode of transportation with the highest frequency and lowest access time: walking. Buying different items at different stores is so ubiquitous that shopping malls were invented specifically to make that experience more pleasant than that of chaining car trips.
Transit cities should not design themselves around trip chaining on transit, destinations for short trips are too difficult to serve. Many cluster on major corridors, but some don’t and stay on residential streets or at street corners. In walkable cities they tend to be fairly isotropic. With short average trips and no discernable centers, the optimal stop spacing on transit is extremely short, to the point of uselessness for all other purposes. If there’s trip chaining, the required frequency is so high that operating costs become unaffordable; a 5-minute wait for a bus may well be unconscionable.
Outside dense cities, suburbs should have a structure of density in which all the plausible destinations are within walking distance of the train station, permitting chaining walking trips with a transit trip. With such structure, the minimum viable density is lower, because buses can connect to the train with a timed transfer and have longer stop spacing as the destinations are all at the town center. In effect, such a structure gives the town center most of the convenience benefits of a shopping mall even without other features such as enclosure and single ownership of the real estate.
Infrastructure is scale-dependent. Public transportation makes this a lot clearer than cars – different modes are used at different scales, and the shape of the network can look visibly different as well. At the scale of short trips, the correct choice of public transportation mode is none – people can and should walk. If the city has generally viable public transit, its urban layout will equally well permit trip chaining on foot. If it doesn’t, then the priority should be to establish a transit city and not to try dragging buses every block.
