Category: Transportation
Port Authority’s LaGuardia Rail Link Study
Two days ago, Port Authority put out a study about a rail link to LaGuardia, which became Governor Cuomo’s top transit priority a few years ago. The PDF file is bundled with the RFP, but starting on PDF-p. 25 it’s an alternatives analysis and not an RFP. While transit activists including myself have attacked Cuomo’s proposed rail link for its poor alignment choice, the Port Authority study considers many alternatives, including some interesting ones. It also describes the current situation in more detail than I’ve seen elsewhere. I’d like to talk about the alternatives for a rail link, but also summarize some of the important facts buried in the study. Unfortunately, the study also eliminates all the useful options and prefers to advance only Cuomo’s uselessly circuitous alignment.
The current situation
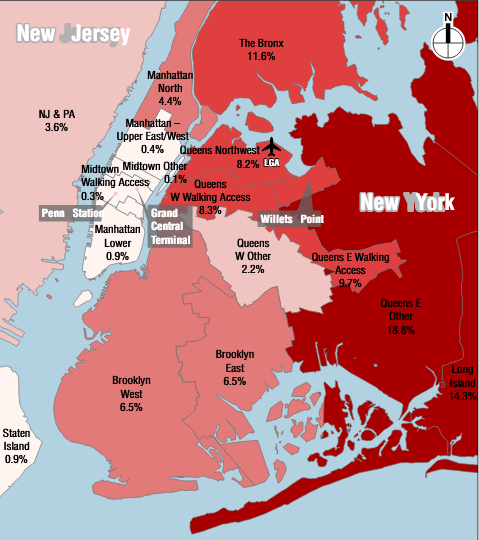
LaGuardia had about 25 million O&D passengers in 2017. They disproportionately go to or from Midtown, but it’s not as overwhelming as I thought based on this density map. Here is a precise breakdown, lumping together both locals (33%) and visitors (67%):

In Manhattan and western Queens “Walking access” means half a mile from a commuter rail stop or from the 7 train; there is no attempt to track walk access to the N or W trains. In Eastern Queens it means half a mile from any subway stop.
About half of the passengers get to or from the airport by taxi, and another 20% are dropped off or picked up in a car. Only 6.2% use public transportation, and another 5.6% use a shared ride such as a hotel shuttle.
Among employees, the situation is different. I expected employees to cluster in western and central Queens, but in fact, based on the same categories used for passengers, the largest group is Queens East beyond subway range:
There are 13,000 employees at LaGuardia per Port Authority (compared with about 10,000 per OnTheMap), of whom 40% take transit to work and 57% drive. It goes without saying that the transit options are exceedingly harsh. The connections from Brooklyn require taking a subway through Manhattan (and I don’t think LGA is necessarily important enough to justify a direct bus route from Brooklyn, presumably a merger of the B38 with a Q18/Q47 compromise route to the airport). From Queens beyond subway range they require taking a bus to the subway and then another bus. The implication is that people take transit to the airport out of necessity – that is, poverty – and not because the options are good.
Unfortunately, the implication is also that it’s hard to serve the current employee base by any rail link, even if it’s fare-integrated with the subway (unlike the JFK AirTrain). The origins are too dispersed. The best that can be done is serving one tranche of origins, and letting passengers sort themselves based on commute possibilities.
In some strategic places, a decent two-seat ride can be made available. The M60 bus is not good for passengers, but it is fine for employees since more of them come from Upper Manhattan and the Bronx, and moreover low incomes imply that it’s fine to have a transit : car trip time ratio well in excess of 1 provided it’s not too onerous. Some future rail extensions, not covered in the study, would help with passenger distribution: Triboro RX would help get passengers from the South Bronx, Brooklyn, and parts of Queens to major transfer points at Astoria and Jackson Heights, and Penn Station Access with an Astoria stop would help get eastern Bronx passengers into Astoria with a quick transfer.
The alternatives analyzed
The study mentions a horde of different options for connecting people to the airport, but most only get a few paragraphs followed by an indication that they don’t meet the objectives and therefore should not be considered further. These excluded alignments exist only for i-dotting and t-crossing, such as ferries or whatever Elon Musk is calling his tunnels this year; Port Authority is right to reject them.
The alternatives proposed for further consideration consist of no build, subway extensions, and various air train alignments. Unfortunately, on second pass, the subway extensions are all eliminated, on the same grounds of community impact. This includes the least impactful subway extension, going north on 31st Street and then east on 19th Avenue, avoiding Ditmars (which could host an el).
Instead of a subway extension, the study is recommending an air train. There are many alternatives analyzed: one from Astoria along the Grand Central Parkway, one from Woodside with a connecting to the local M/R trains on the Queens Boulevard Line at Northern Boulevard, one from Jackson Heights, one from Jamaica with a missed connection to the 7, and one from Willets Point as recommended by Cuomo. All but the last are excluded on the same grounds of impact. Any land acquisition appears to be prohibited, no matter how minor.
What went wrong?
The obvious answer to why the study recommends the Willets Point detour is political support. This can be seen in e.g. PDF-p. 150, a table analyzing each of the air train possibilities. One of the criteria is operational concerns. The Jamaica option fails that test because it is so circuitous it would not get passengers between the airport and either Penn Station or Grand Central in thirty minutes. The Willets Point option passes, despite being circuitous as well (albeit less so); it would still not get passengers to Midtown Manhattan in thirty minutes since the 7 is slow, but the study seems to be assuming passengers would take the LIRR, on the half-hourly Port Washington Branch.
This alone suggests political sandbagging. But by itself it doesn’t explain how the study’s assumptions sandbag the options the governor doesn’t favor; after all, there could be many little omissions and judgment calls.
Rather, I propose that the study specifically looked only at nonstop service to the airport. The subway extensions are all proposed as nonstop services from Astoria (either Astoria Boulevard or Ditmars) to the airport, without intermediate stops. Without intermediate stops, the political will to build els above neighborhood streets is diminished, because few people in Astoria have any need to travel to LaGuardia. In contrast, with intermediate stops, the subway extensions would improve coverage within Astoria, serving Steinway and Hazen Streets.
If intermediate stops are desired, then 19th Avenue may not be the best corridor. Ditmars itself is feasible (with some takings), as are 21st and 20th Avenues. Ditmars has the most impact but serves the highest-value location, and can descend to Grand Central Parkway to get to the airport without any tunneling, limiting costs.
Moreover, the impact of els can be reduced by building them on concrete columns rather than all-steel structures. Paris Metro Line 2 opened in 1903, before the First Subway in New York; it has a steel structure on top of concrete columns, and the noise level is low enough that people can have conversations underneath while a train is passing. New Yorkers should be familiar with the reduced noise of concrete structures since the 7 el on top of Queens Boulevard is quiet, but that is an all-concrete structure on a very wide street; Line 2 here follows wide boulevards as well but not so wide as Queens Boulevard, and is moreover a mixture of concrete and steel, and yet manages not to have the screeching noise New Yorkers are familiar with from Astoria, Woodside, and other neighborhoods with els.
Is this study valuable?
Yes and no. Its conclusions should be tossed for their limited scope (nonstop airport access only), questionable assumptions (overreliance on infrequent commuter rail), and political aims (justifying Cuomo’s decision). But some of the underlying analysis, especially of current travel patterns, is useful for the purposes of thinking about systemwide transit expansion. Despite the consideration of an N/W extension, the study does not try to figure out the percentage of travelers whose ultimate origin or destination is near an N/W stop, only near a 7 stop; however, we can make some educated guesses from the map and realize that an N/W extension is of considerable value to passengers.
For employees, the situation is more delicate. The study mentions them but doesn’t try to optimize for them – the aim is to give Cuomo political cover, not to design the best possible public transit for New York. But the dispersal of worker origins means that a single rail link to the airport is unlikely to have much of an effect. Better everywhere-to-everywhere transit is needed. With decent bus connections at Astoria and Jackson Heights, it’s more important to build circumferential transit there (that is, Triboro) than to connect directly to the airport.
A general program of transit expansion would serve both groups. An N/W extension through Astoria with intermediate stops would give the neighborhood better coverage while also connecting the airport with Manhattan destinations, with good transfers to origins on the Upper East and West Sides. Better circumferential transit would then let workers from different parts of the city use the same extension without having to detour through Midtown even if their origins are in the Bronx or Queens.
Can any of this happen? The answer is unambiguously yes. Even in New York, els and at-grade rail is not so expensive. The only real question is whether good transit can happen while the state is governed by a do-nothing administration, headed by a governor who is more interested in a signature project than in improving transportation for his hapless subjects.
Heterogeneity of Preferences
The public transit conversation is full of statements like “passengers don’t like to transfer,” or, in quantified terms, “passengers perceive a minute transferring to be equivalent to 1.75 minutes on a moving vehicle.” But what does this exactly mean? It’s not a statement that literally every passenger has a transfer penalty factor of 1.75. Different passengers behave differently. At best, it’s a statement that the average passenger on the current system has a transfer penalty factor of 1.75, or alternatively that the aggregate behavior of current passengers can be approximated by a model in which everyone has a transfer penalty factor of 1.75. Understanding that different people have different preferences is critical to both the technical and political aspects of transportation planning.
I talked about the heterogeneity of transfer penalties three years ago, and don’t want to rewrite that post. Instead, I want to talk more broadly about this issue, and how it affects various transit reforms. In many cases, bad American transit practices are the result not of agency incompetence (although that happens in droves) but of preferential treatment for specific groups that have markedly different preferences from the average.
Disabilities
The universal symbol of disability is the wheelchair. Based on this standard, every discussion of accessible to people with disabilities centers people in wheelchairs, or alternatively retirees in walkers (who tend to make sure of the same infrastructure for step-free access).
However, disabilities are far broader, and different conditions lead to dramatically different travel preferences. One paper by the CDC estimates that 20% of US adults have chronic pain, and 8% have high-impact chronic pain, limiting their life in some way. People with chronic pain are disproportionately poor, uneducated, and unemployed, which should not be a surprise as chronic pain makes it hard to work or go to school (in contrast, the one unambiguously inborn socioeconomic factor in the study, race, actually goes the other way – whites have somewhat higher chronic pain rates than blacks and Hispanics). Another paper published by BMJ is a meta-analysis, finding that depending on the study 35-51% of the UK population has chronic pain and 10-14% has moderately to severely disabling chronic pain.
I’ve only talked to a handful of people with chronic pain – all of working age – and the best generalization that I can make is that it is impossible to generalize. The conditions vary too much. Some find it more painful to drive than to take transit, some are the opposite. Some have conditions that make it hard for them to walk, some are fine with walking but can’t stand for very long. To the extent the people I’ve talked to have common features, they a) have a strong preference for rail over bus, and b) require a seat and can’t stand on a moving vehicle for very long.
Work status
The best use case for rapid transit is getting people to work in a congested city center at a busy time of day, ideally rush hour. Off-peak ridership is generally cheaper to serve than peak ridership, but this is true for all modes of transportation, and public transit tends to be relatively better at the peak than cars. Per table 2 of the Hub Bound report, as of 2016, 19% of public transit riders entering the Manhattan core do so between 8 and 9 am and 43% do so between 7 and 10 am, whereas the corresponding proportions for drivers are 6% and 18% respectively.
The upshot is that people are more likely to ride public transit if they work a salaried job. This is especially true in the middle class, which can afford to drive, and whose alternative is to work at some suburban office park where car ownership is mandatory. In the working class, the distribution of jobs is less CBD-centric, but the ability to afford a car is more constrained.
The social groups most likely to drive are then neither the working class (which doesn’t own cars anywhere with even semi-reasonable public transit) nor the professional working class, but other social classes. The petite bourgeoisie is the biggest one: small business owners tend to drive, since they earn enough for it, tend to have jobs that either virtually require driving (e.g. plumbers) or involve storefronts that are rarely located at optimal locations for transit, and need to go in and out at various times of day.
Another group that’s disproportionately likely to drive is retirees. They don’t work, so they don’t use transit for its most important role. They take trips to the hospital (which is bundled with issues of disability), which can be served by buses given that hospitals are major job centers and non-work travel destinations, but their other trips tend to be based on decades of socialization that have evolved haphazardly. The urban transit network isn’t likely to be set up for their particular social use cases.
Consensus for whomst?
I bring up small business owners and retirees because these two groups are especially empowered in local politics. When I lived in Sweden, I could vote in the local and regional elections, where I had no idea what the main issues were and who the candidates were; I voted Green based on the party’s national platform, but for all I know it’s not great on Stockholm-specific issues. Figuring out the national politics is not hard even for a newcomer who doesn’t speak the language – there are enough English-language news sources, there’s social media, there are friends and coworkers. But local politics is a mystery, full of insider information that’s never spelled out explicitly.
What this means is that the groups most empowered in local politics – that is, with the highest turnouts, the most ability to influence others in the same constituency, and the greatest ability to make consistent decisions – are ones that have local social networks and have lived in one place for a long time. This privileges older voters over younger voters, and if anything underprivileges people with disabilities, whose ability to form social and political connections is constrained by where they can go. This also privileges people with less mobile jobs – that is, shopkeepers rather than either the professional middle class or the working class.
With their greater local influence, the most empowered groups ensure the transportation that exists is what is good for them: cars. Public transit is an afterthought, so of course there is no systemwide reorganization – that would require politicians to care about it, which interferes with their ability to satisfy the politically strongest classes. But even individual decisions of how to run transit suffer from the same problem when there is no higher political force (such as a strong civil service or a national political force): bus stops are very close together, transfers are discouraged (“we oppose the principle of interchange” said one left-wing group opposed to Jarrett Walker’s bus redesign in Dublin), rail service is viewed more as a construction nuisance than a critical mobility service, etc.
Models for transportation usage take into account the behavior of the average user – at least the average current user, excluding ones discouraged by poor service. However, the political system takes into account the behavior of the average empowered voter. In the case of local politics, this average voter rarely rides public transit. When city political machines run themselves, the result is exactly what you’d think.
Transit Versus Other Transportation Alternatives
Where is private rapid transit? Private companies built the London Underground, the els in New York, the Chicago L, the first line of the Tokyo subway. Construction costs are up since then, but so are ridership (in the second half of 1905, London’s Central line carried 23 million people; today, its annual ridership is 289 million, a sixfold increase) and people’s ability to afford higher fares. In most cities transportation works as an interconnected complex system with little room for a private upstart, but this is not universal. In particular, in San Francisco, a subway under Geary wouldn’t need to interface much with BART or Muni. So how come none of the tech companies in California, which have invested in many different kinds of transportation and haven’t shied from reinventing the wheel, seems interested?
Only in the last week, talking to people at the ecomodernism conference I discussed last post, did I fully understand the answer. It’s sobering: investing in transit isn’t going to let a private company dominate the world. The companies that operate trains around the world by contract, like the MTR and Veolia, make money, but much of that is government subsidies for which they have to compete on level field, and even then their margins are low by the standards of Airbnb, let alone older tech firms like Facebook and Google. With good cost control it’s possible to get a positive return on investment, but it’s on the order of 3%*, which is not what a venture capital fund is looking for. It’s looking for ten different ideas, of which eight will flop, one will tread water, and one will make a windfall. Committing billions upfront to something for low returns with extensive regulatory risk is not really on its radar.
Instead of transit, the business world, by which I mean the constellation of VC, tech, tech media, business media, and new investors, is looking at things that can start small. Uber paved the way, making dirty travel by taxi much easier; more recently, companies have imitated the model for green transportation, first dockless bikes and now e-scooters. A tech press that in 2014 was replete with “Uber, but for ___” turned to dockless by 2017 and scooters this year.
The reaction of most of my green transportation Twitter feed to the newer trends is positive. To the extent people express skepticism, it’s almost always rooted in a leftist disdain for private businesses. The only other criticism I’ve heard, from Eric Goldwyn, is that transportation revolutions require dedicated right-of-way, such as car-dominated roads, grade-separated rapid transit, BRT lanes, separate bike lanes, or the extensive corrals of docked bikes. But even this line recognizes the synergy between dockless bikes or scooters and public transit.
However, synergy does not imply similarity. That rail networks can use bikes to extend their station access radii outside urban cores does not imply that transit is like other green transportation, and certainly does not imply that bikes (let alone scooters) are a substitute for transit. They work at completely different scales.
Transit works at a large scale. I know of a small handful of transit cities below 2 million people, like Karlsruhe, Geneva, and Strasbourg, none of which has the per capita rail ridership of Paris. In the 2 million area, transit cities exist, but rely on total systemwide integration, sometimes (e.g. in Zurich) extending to the open national railway network. There exist some edge cases where a single line can be profitable, like Geary in San Francisco, but the single line is not massively profitable. A 3% return is great for a government that sets its own regulations and can borrow at sovereign rates; for a private business facing regulatory risk, this return is too low to bother with.
Everything else works at a small scale. Cars are self-evidently like that: they’re great at getting people to places where few people want to go or at times when few people travel. At midnight, taxis will handily beat the RER on travel time. At midday, they are slower than a delayed Washington Metro train or a local New York City Subway line. The startup costs are low, too: grading and paving a two-lane road supporting 70-80 km/h (less in rough terrain) is cheap. It will have grade crossings, but outside urban areas, stop signs and road hierarchies are good enough.
However, this is equally true of bikes and scooters. This isn’t as obvious as with cars, since bikes are too slow to work in rural areas less dense than Holland. But the same speed limitation ensures bikes are only useful in relatively small cities. The Netherlands is somewhat unique in having compact cities with sharp boundaries, and even there, people mostly use bikes when they can live close to work (the average urban bike speed is 12.4 km/h). At intercity scale, the train and car dominate.
Bikes clearly scale up to dense cities; Amsterdam’s urban typology is mid-rise, dense enough for the purposes of this question. Scooters most likely are the same – their speeds and total amount of space consumed are similar to those of bikes. Their scaling problem is about distance more than capacity. 12.4 km/h is too slow. Buses in New York are almost as fast, and the average bus trip in the city is 3.5 km, with riders typically using the bus to transfer to the subway.
The problem with the American and Chinese business world’s convergence on dockless bikes and scooters as the next big thing is then that, like New York buses, their main use case is to extend a faster mode of transportation, that is, the train. Without the train, they are not worth much. Ofo is realizing this as it pulls out of the US, Israel, and Australia, focusing on its core market of large Chinese cities and only maintaining an international foothold in a few transit cities like Paris and Singapore.
In contrast, the train without the dockless bike or scooter works quite well. Paris had a perfectly functional transit system in 2017, before dockless came in, and even in 2006, before Velib. This means that the train needs to come first in a city that wishes to reduce its car use and shift trips to eco-friendly modes of transportation. Private businesses won’t build it, unless it’s to extend a preexisting system that they already own (as is the case for the private railroads in Japan).
There is no alternative to a functioning state. To a functioning state, a few billion dollars or euros for a metro line is a serious expense, but one that it can take if the ridership projections are adequate. To a functioning state, VCs that talk about changing the world through scooters are a nuisance to be ignored. The scooters can play a role and the regulations on them shouldn’t be too onerous, but their role is secondary, and the predominant effort in planning should go to fixed routes.
*Assume $2 billion to tunnel under Geary from Union Square to the VA Hospital. This is a little more than $200 million per km, which is normal for a developed country that’s not the United States; figure that better cost control than the average cancels out with abnormally high market wages in San Francisco. Operating costs cluster in the $4-7/car-km; BART is at $5.36 as of 2016 with long cars, and a driverless operation could do somewhat better, so figure 150-meter trains at $30/train-km, or $300 for a one-way run. At 18 base tph, 30 peak tph, annual operating costs are in the $80-90 million/year range. Bus ridership on and parallel to Geary is 110,000/weekday today; without making any assumptions on development, 250,000/weekday, or 75 million/year, is reasonable. Muni is full of transfers, so getting clean revenue/trip data is hard, but the subway in New York charges around $2 per trip, and the Richmond District could probably function without free transfers to Muni without taking too much of a hit to revenue, making $150 million/year in revenue reasonable. (150,000,000-90,000,000)/2,000,000,000 = 3%.
Trust and Environmentalism
I’m at Ecomodernism 2018, a conference by the Breakthrough Institute in exurban Northern Virginia. It’s not much of an infrastructure or transportation conference (although Breakthrough tells me they are getting interested in these subjects), so I instead went to a breakout session about nuclear power. The session was better than other parts of the conference, but was still not great in the sense that what I saw of it made me less sympathetic to nuclear power than I was before. I want to describe my thought process here, not because nuclear power is a relevant subject to this blog (whatever opinion on it I hold is tepid) but because it showcases how trust works and how people in power need to listen to critics.
Before I go further, I want to make it clear that I did not go to the entire session. It was a two-hour discussion in a circle; an hour in I had to run to the bathroom, and while there I discovered that my flight back to Paris got canceled due to airline bankruptcy and had to run to my room to look for alternatives. So it’s entirely possible my concerns were addressed in the second hour, although judging by where the discussion was going when I left, I doubt it.
What I saw at the discussion concerned technical issues regarding costs and regulations. As far as I remember, everyone at the 19-person discussion other than me had some ties to nuclear advocacy or the industry, except possibly one law professor who was involved in the debate over nuclear regulations. People with background in the industry talked about how American regulations are excessively cautious about safety zones (and in response to my question told me the rest of the world mostly follows American regulations). The law professor asked if modernizing the regulations would always mean loosening controls or if there were places where tightening was required; two people gave convoluted replies that basically said they were only talking about loosening rules without explicitly saying so.
Missing from the entire discussion as far as I could see was the issue of trust. Nuclear power requires immense personal trust in the firms building the plants and in the state. Nuclear advocates keep explaining that first-world regulatory regimes are a lot stronger than whatever the Soviet Union had during Chernobyl. But it’s hard to understand to what extent this is true without very deep ties to the conversation. On a car or a train, it’s easy for a passenger to feel that something is wrong – that there is a lot of sway, that the train driver is overrunning platforms, that the road is visibly in poor condition, etc. There’s no need to trust that the system is safe because passengers can readily see that it is safe. A nuclear plant is different: one minute it’s working, the next minute it’s blowing up.
In cultural theory, trust is mostly an egalitarian issue. To the egalitarian, the exact details of the regulations don’t matter nearly as much as the population’s ability to trust that the regulators are honest. Producing this kind of honesty is hard.
Even hierarchical institutions are full of folklore about people in power being stupid or dishonest. World War Two, the epitome of hierarchy, still produced Catch-22 and copious enlisted folklore about obstructive officers. Even my grandfather at one point asked if the anonymous commander of his resistance group in the ghetto was helping dig shelters or whether he was just telling grunts to do so (later he learned that the person he was asking this question of, while they dug the shelters together, was the anonymous commander). Even at their best, hierarchical organizations are necessarily compartmentalized and secret, and never immune to the occasional social climber, narcissist, or asshole (in fact the word “asshole” came out of WW2 lexicon referring to obstructive officers).
To the extent there is a direct connection to transportation, the mode of transportation that elicits the biggest trust concerns is the self-driving car. The airplane elicits a similar fear, but the airline industry has spent the last few decades ruthlessly prioritizing safety over anything else – cost, comfort, flexibility, speed, fuel efficiency. In contrast, the tech industry’s “move fast and break things” ethos not only causes visible accidents (such as Tesla’s occasional crashes or Uber’s fatal AV crash) but also reminds the public that to the industry, safety is a secondary concern to world domination.
This problem gets worse when the industry or the state does not understand it has a trust deficit. In France, I’m pro-nuclear. In the US, I’m more skeptical, because of the morass of conflicting federal and state regulations, local NIMBYism, and industry efforts; at the discussion, when someone brought up financing, I explicitly asked about the state-built plants of South Korea, which the moderator had brought up in a report about nuclear plant costs, and was told that this is not on the agenda for the US.
French regulators have proven themselves more trustworthy to me than American ones, so when Macron calls for expanding nuclear energy I react more positively than when third way American thinktanks do. Similarly, France simultaneously implements or at least tries to implement parallel green policies, such as building more public transit, which helps convince me that Macron’s vision of the future treats decarbonization as a priority. In contrast, Ecomodernism 2018 saw fit to treat “is climate change a serious problem?” as a debate that reasonable people may disagree about, and treats oil and gas expansion as a respectable minority opinion within the movement, which helps convince me its support of nuclear is about pissing off the mainstream green movement and not about providing an extra tool for base load power to avoid the intermittency problem of renewable energy.
If the people who are responsible for implementing such technology misunderstand that they have a trust deficit, they will not do anything about it. At worst, they will talk about how to market the technology, as if the problem is about convincing the public that they’re trustworthy and not about actually putting safety first.
In rationalism, there is something called “steelmanning.” To steelman a position is to find the strongest possible argument for it, even if it is not what one’s interlocutor exactly said. This contrasts with strawmanning, i.e. finding the weakest possible argument and attacking it as unreasonable. Ecomodernism 2018’s first proper session, a discussion with people who changed their minds on environmental issues, brought this term up as a positive, contrasting it with partisan polarization.
As far as I saw at the discussion, the discussion of nuclear power did not steelman the anti-nuclear movement and its emphasis on trust and (in Germany and Japan) the issue of American military involvement.
That said, I don’t believe in steelmanning, because if a movement recurrently fails to make what I think the strongest arguments for its position is, I reserve the right to use it to judge what it considers important. This way I dismiss movement libertarians’ opposition to public transit, because they seem indifferent to cost comparisons; those are a free shot at many US transit projects, but make transit look like a reasonable proposition in some circumstances and suggest improvements that would make it cost-effective, conflicting with Wendell Cox’s maximalist attitude that cars are always superior.
But by the same token, I am compelled to dismiss the ecomodernist line about nuclear energy, which I was sympathetic to until the conference began. There are strong arguments in favor of nuclear power: its safety record in developed countries in the last few decades has been positive, it is less intermittent than solar power, and Germany’s decommissioning of nuclear plants without adequate renewable replacement has not been great for its carbon footprint. On the bus shuttle from Washington to the conference I sat next to someone who convincingly made some of these arguments, explaining that solar costs per watt are understated due to intermittency. But at least the first half of the discussion I attended today neither brought them up (except in the context of the desirability of loosening regulations) nor adequately wrestled with the opposition.
In public transit and urbanism, the same issue sometimes occurs. It’s not as stark as with nuclear plants because people can see changes more readily, but getting people to trust public transit authorities that have recurrently proven themselves incompetent or dishonest is not a trivial task. It is imperative that people who support good transit make it clear that everything has tradeoffs: cost-effective subway lines involve surface disruption (which can be reduced but not eliminated), regional rail modernization means people at some suburban stations will no longer be guaranteed a seat and will definitely not be guaranteed first-class status elevated over the urban working class, fare integration usually comes with an increase in base fares for people who don’t transfer, bus network redesigns make some people’s trips longer and are net negative for passengers with especially high transfer and walking penalties.
Transit is a world of heterogeneous preferences. An optimal network is necessarily a compromise between many different people’s personal weights on reliability, walking time, in-vehicle travel time, etc. As a compromise, it will piss some people off, and it’s necessary to make it very clear what is happening, as agencies reform themselves from the swamp of most American operators to proper transport associations. Trust is critical: just as passengers’ trust in the schedule is crucial to ensure they wait for the bus or train rather than driving or forgoing the trip, people’s trust in the authority to make good decisions is crucial to ensure they participate in and respect the process rather than checking out and treating transportation as an imposition to be avoided whenever possible.
Phased Implementation of Bus Redesign
Jarrett has a good post about the new Auckland bus redesign, which he had been involved in when he worked for international consultancy MRCagney, before he opened his own. He mentions one peculiar aspect of Auckland – namely, that it is so divided by water boundaries that different areas of it have independent surface transit networks – that facilitates gradual implementation. In contrast, in a city with a more connected street network, every route affects every other route, so redesign has to be implemented together, without any intermediate phases. He brings up Brooklyn (together with Queens) as one example of such a connected network, and I feel like I need to explain why a phased approach is appropriate there.
But this is not just about Brooklyn. The question of whether to implement changes abruptly or gradually generalizes to every scale, up to and including the type of regime (democratic, militaristic, communist, etc.). The scope of this post concerns bus networks anywhere. The arguments I bring up in favor of a phased approach in Brooklyn should also give correct answers in other cities, regardless of whether they end up recommending gradualism.
Sharp edges
Jarrett brings up one factor influencing whether phased implementation is appropriate: sharp edges between different parts of the city. In New York, the East River has few road crossings and many rail crossings; only one local bus crosses it in Brooklyn, the half-hourly B39, and only four cross it in Queens.
But even edges that look less sharp than the East River or the Hudson can be so stark so as to permit separate planning on their two sides. The Harlem River is one example: many Bronx buses cross it, but their routes in Manhattan are constrained based on which avenue or street the bridge connects to, so there’s not much scope for creative recombination.
Brooklyn itself has few internal sharp edges. The closest thing to a sharp edge is the combination of Greenwood Cemetery and Prospect Park, separating on one side Park Slope and South Brooklyn and on the other side Flatbush and Southern Brooklyn. A few marginal neighborhoods are sharply divided from the rest of the borough, especially Red Hook. But for those neighborhoods, the question of where in the rest of the borough they should connect to depends on the shape of the rest of the system.
That said, it’s plausible to talk about how the new network would look in various neighborhoods, if there are choke points or generally agreed upon spines. Red Hook is an especially good example, since it has a strong connection to Manhattan via the Brooklyn-Battery Tunnel (hence, our proposed tunnel bus to Lower Manhattan). But as the arguments in comments here over Williamsburg show (and as my constant refrain about the north-south Bed-Stuy routes shows), it’s possible to discuss individual neighborhoods even if they’re more strongly connected, as long as it’s clear that it’s in the context of a greater network.
However, in one aspect, Jarrett and the MTA make a mistake: they treat the edge between Brooklyn and Queens as less sharp than it really is. In the north, the Newtown Creek choke point forces buses to all go up to Long Island City along a single bridge. In the center, a few route mergers passing through Bushwick and Ridgewood (especially the B54/Q55 on Myrtle) are reasonable, but fully integrated planning would not create very many connections. It’s possible to design the network for Brooklyn alone and then notate where Queens connections would happen, just as it’s possible to design a Manhattan network and point out that the M60 goes into Queens.
The subtle issue regarding Brooklyn and Queens concerns what happens in the south. At TransitCenter we were asked about connections to Howard Beach, but when I looked, I ran across a subtle geographic divide. The southeastern margin of Brooklyn and Queens is a series of small peninsulas with weak connections between them: Gerritsen Beach, Mill Basin, Bergen Beach, Canarsie, Starrett City, Spring Creek, Howard Beach, Old Howard Beach. When I crayoned a metro network for Lagos, which has the same problem in the west and northwest, I had to assume new metro bridges connecting various neighborhoods. On a surface transit network in a developed country, such bridges are unlikely to happen, forcing buses to use the main through-routes today, like Flatlands and Linden.
Is it good enough today?
The entire reform versus revolution discourse depends on how bad things are today. It’s unavoidable in discussions of socialism and Marxism. Socialists and even some social democrats hold that mid-20th century social reforms (like the New Deal) saved capitalism from itself, by making the working class’s situation less desperate. As a result, there is a contingent of leftists who call themselves accelerationists, who prefer to make things as bad as they can be (for example, by refusing to back the center-left against the far right) hoping that this would accelerate the revolution.
The “is it good enough today?” principle scales down to any level. When it comes to bus networks, it really asks, how much would the optimal route network differ from today’s situation?
The highly radial buses of San Jose today, Houston before Jarrett’s redesign, and Barcelona before Nova Xarxa all differ greatly from the redesigned networks. This encourages abrupt implementation, in two ways. First, the old routes are generally weak, increasing the pressure to get rid of them. And second, the old routes don’t feed the new grid trunk lines well, whereas the grid trunks feed one another. Nova Xarxa (which is a six-year process, retaining many old lines) has seen its phase 1 lines grow in ridership as each subsequent phase was implemented, making the early stages much less useful than the entire system.
In contrast, Brooklyn is firmly in the good enough basket. This does not mean its current network design is objectively good; it isn’t. But it does mean that most of its key trunk lines should survive redesign with at most light modifications. Among the 15 busiest Brooklyn routes today measured by ridership per km, only three see big changes: the B1 (straightened into a Southern Brooklyn grid), the B82 (cut to Kings Highway, its tails on both sides given to the B6), and the B41 (cut north of the B/Q subway connection at Prospect Park). A few more are merged into longer routes, like the B42 and the B60, but maintain their current route, just with through-service elsewhere. Key grid routes like Lafayette, Church, Nostrand, Avenue M, and Myrtle survive almost unchanged.
The Brooklyn redesign is not predominantly about starting from scratch, since the network today already has the characteristics of an imperfect grid. It’s about consolidating weak and weak-ish routes, straightening some buses that are too circuitous, and switching around buses to serve destinations that have grown stronger since the 1970s redesign. The East New York network in particular has a lot of meanders that should be fixed regardless of what happens anywhere else; the rest of the bus and subway network is good enough that people from East New York can then transfer to it even if increasing trunk frequency happens later.
Future changes
Bus redesigns are not immutable, to be done once in a few decades with long periods of stasis in between. Cities change, and the optimal bus network for 2025 may be different from that for 2019 in some situations. In a city where there’s relative stasis in development intensity, traffic, and any rail trunk, an abrupt change makes more sense. Realistically, such a change would come not when the first phase of a gradual implementation would have been done but when the middle or last phases would have. Thus, if the redesign is a long-lasting product it’s easier to wait for the first phase (which in an abrupt implementation is also the last phase) and not change much afterward.
This relates to California Transit Twitter’s biggest criticism of Jarrett’s San Jose redesign: that it does not incorporate the recent BART extension to Warm Springs. Jarrett unveiled his redesign for VTA in the spring of 2017, expecting BART to be extended from Warm Springs to the San Jose Flea Market at Berryessa by the end of the year, as BART had projected. Based on this expectation, he designed the network around an abrupt implementation, to go into effect shortly after trains would start running to Berryessa. Since then, BART has announced delays to the extension, talking about opening it only at the end of 2019. Trusting BART’s early promises of 2017 opening is an understandable error; Jarrett did not cause the BART timetable slip. But the outcome is that the VTA bus redesign is delayed.
The upshot is that in a city with a rapidly-growing rapid transit network, bus redesigns should be done on a continuous basis, tweaked every time a new subway line opens. The Bay Area is not generally such a city, but BART is expanding into San Jose, so in that part of the region, phased implementation with updates every few years is warranted. By the same principle, a city with rapid changes in where people live and work should expect recurrent changes to its surface transit network; this is less relevant to San Jose, since the growth nodes are the CBD (e.g. the upcoming Google building) and the Apple headquarters in Cupertino, but it’s relevant to cities in which residential areas are commercializing, such as San Francisco with SoMa.
New York, of course, has a static subway system, courtesy of extreme construction costs. It also has a relatively static workplace geography. However, in one respect, it is undergoing rapid change: it is gradually making its subway network accessible. When I say that the optimal networks for 2018, 2022, and 2026 are all different, I say this in reference to upcoming subway accessibility upgrades, as well as potential changes (i.e. de-interlining) that would increase subway frequency at the cost of one-seat rides. In Brooklyn, our plan to get rid of the B25 depends on upcoming accessibility upgrades for Broadway Junction, without which the bus should probably stay as an accessible alternative to the A and C trains. Likewise, our plan to retain the B63 comes from plans to only make the outermost R stations accessible but not the ones in Sunset Park or South Slope.
What about Nova Xarxa?
On two out of three metrics, Barcelona’s layout recommends an abrupt approach: it lacks internal sharp edges, and its preexisting network was too radial to be useful. On the third, it does not: it is rapidly expanding its metro network; however, the implementation of Nova Xarxa as far as I can tell has not been timed for the opening of L9/L10. So why is it phased there?
The fact that the early-phase lines of the network have seen further increases in ridership as the rest of the network has come online suggests that, on purely technical criteria, gradual implementation was not the right choice in Barcelona. However, in political reality, Nova Xarxa could not replace the entire radial network. Most bus routes in Barcelona today are still not Nova Xarxa. The system’s characteristic as an overlay that took over old lines that became superfluous forced it to be done in phases.
Conflicting excuses
In comments, people here have warned that a phased implementation can be an excuse to do nothing: put the few things everyone agrees on in the first phase, do that, and then postpone future phases indefinitely. This is a real risk. However, abrupt change has its own risks as well: it can be used as an excuse not to do low-cost or negative-cost things that can be implemented fast, such as merging the two Myrtle routes, redoing the East New York bus network in advance of the L train shutdown, and opening the Red Hook-Lower Manhattan route.
The upshot is that the question of gradualism seems independent from the question of obstructive bureaucrats and apparatchiks. There may well arise a local situation in which one answer to the main question is less vulnerable to political sabotage than the other, but it depends on idiosyncratic factors and is unlikely to be the case in general.
With the political criteria uncertain, the answer to whether network redesign should be done in one go or in stages should depend only on technical criteria. These differ from city to city and from region to region depending on local physical and urban geography. In New York, they suggest a phased implementation would work; elsewhere, they may not.
Brooklyn Bus Redesign Version 1.2
About two weeks ago, Eric Goldwyn and I unveiled our Brooklyn bus redesign. It consolidates the borough from 550 route-km to about 350, and cuts the number of stops along the surviving lines from 1580 to 706; the increase in speed coming from stop consolidation and other treatments (i.e. bus lanes and prepayment) and the route consolidation together permit doubling the frequency with the same resources available today, guaranteeing that each bus route have at worst 6-minute frequency between 6 am and 10 pm. The first version we released was 1.0, and the version I blogged was 1.1. In this post I’d like to introduce changes as well as explain why we made certain decisions that have been criticized in comments here and elsewhere.
Version 1.2
V1.2 differs from v1.1 in just two ways. First, it was pointed out to me that we made a mistake in the map: the route we proposed for the B6 to take across the structure of the Brighton Line of the subway, at Avenue H, was not in fact a street crossing. At Avenue H the structure goes from trenched to the north to elevated in the south, and as a result the street does not go through. We fixed this error by restoring the present-day route, and also slightly changing the route of the B11 to follow what must be a high-quality bus lane.
And second, months ago, in arguments with former MTA planner Allan Rosen (who comments on blogs by the name BrooklynBus and has his own proposed redesign), there came the question of the route of the B9. Allan was supportive of the idea of running the B9 on Veterans Avenue, taking over what is now a B41 branch, rather than going to Kings Plaza as it does today, legacy of an era when Kings Plaza was a more important shopping destination. I also asked about straightening the route, which currently goes on a combination of Avenues L and M; Avenue M provides a straighter route connecting to the important destinations (the eastern end of the route, and the main drag in Midwood at Avenue M). Allan explained that no, a reroute to Avenue M is not feasible, as east of the heart of Midwood it’s a narrower residential street, forcing the bus to use the wider Avenue L. The only reason the straighter Avenue M route appeared on v1.0 and v1.1 is that I forgot to change it; after we went public with the map, he reminded us.
There are some associated changes to the stop spacing to accommodate the new routes (or, rather, the retention of old routes that we were wrong to try to change before), but overall there is practically no impact on overall trip times. The B9 is a few hundred meters longer than in v1.0 and v1.1, but the cost in on the order of 20 service-hours per weekday, which by itself is a lot lower than my uncertainty in the underlying numbers (which is about 100 hours).
Service-hours vs. fleet requirement
When putting together the redesign, we aimed at one cost metric: service-hours. This is the correct metric for variable bus operating costs, as they are dominated by the driver’s wage (which is hourly, not per km) and to a lesser extent maintenance costs (which are partly distance-based and partly time-based, as the frequent acceleration cycles common to slow bus traffic stress the engine). The MTA costs buses by distance and not time, which is not a bad approximation when all buses are about equally fast, but generates wrong results when the subject of the discussion is speeding up the buses, as we propose.
But there’s one more metric we did not consider: fleet requirement. Our redesign actually saves money there, which should not be a surprise, as it has more off-peak service, which implies less service at the peak. Our 10,000-hour schedule requires a fleet of 1,007 buses, which compares with 1,129 today excluding the MTA Bus-operated B100 and B103 (which look like they require about 40 vehicles between them). Our proposed v1.2 schedule has 7.5% fewer service-hours than today – not because we propose a cut but because we expect future additions and politicized slowdowns to add hours – but 14% fewer buses. The smaller fleet is to be used more intensively and somewhat more efficiently thanks to the removal of short, infrequent routes.
Since the goal is to keep the redesign roughly cost-neutral, it’s likely that overall service-hour figures will rise: higher operating costs will be balanced by slightly lower capital costs, as the MTA will need to procure slightly fewer buses and not need to expand depots for them as much. In 2008-11, the MTA spent $500,000 per bus on procurement; in 2014, this was the cost per standard bus (which is the vast majority of the MTA Bus and NYCT fleet), while articulated buses were $750,000. This is a premium of about 50% over London bus costs.
Overall the fleet requirement looks like a small proportion of the cost. A $500,000 bus, say $600,000 at today’s higher prices, operates for 12 years, and requires a team of about five drivers, each earning around $140,000 a year with benefits. This is just about market wage – San Francisco and Boston, which pay about the same, have trouble finding and retaining drivers; high bus driver wages should be viewed as similar to high wages for oil rig workers, compensating for poor work conditions. Excluding the costs of depot enlargement, the overall exchange rate seems to be about one bus = 40-45 daily service-minutes. At best, our redesign can squeeze maybe 100 extra daily hours out of better fleet utilization.
The Williamsburg issue
As Eric and I have always emphasized in our communications, our redesign is necessarily win-lose – it’s just that there’s overall much more winning than losing. This is true across neighborhoods as well as within neighborhoods. The diciest case is that of Williamsburg, where we are proposing to consolidate a number of routes into 1.5 north-south trunk lines: one is a continuation of the B44 running up Bedford, and the other goes up Graham and thence either Manhattan Avenue (connecting to the G) or McGuinness (a straighter route on a wider street). This guts service to South Williamsburg, especially west of the BQE, where the only remaining stops are the Marcy Avenue J/M/Z subway stop and another stop on Broadway at Bedford.
It’s not an optimal situation. However, it’s a necessary cut, for a number of reasons:
- The existing north-south lines in Williamsburg are for the most part quite weak. The average weekday ridership per route-km in Brooklyn is about 1,100. The Williamsburg routes are at 945 (B43), 613 (B62), 414 (B67), 358 (B48), 225 (B24), and 152 (B32). The strongest two run along the routes that we are retaining for north-south service, but the rest are so weak that consolidation is required; for the same reason, we are replacing the B48 and B69 (which is at 453) in Clinton Hill with a compromise route on Washington.
- The Williamsburg routes are not just weak but also wasteful, measured in ridership per service-hour. Borough average is 55, and the overall strong routes cluster in the 60s, with high ridership balanced by high service. The top three routes are the B74 (98), B1 (82), and B36 (70), serving short-hop trips in Southern Brooklyn. Among the Williamsburg, only the B43 (49) holds up; the B62 (42), B67 (39), B32 (35), B24 (35), and B48 (32) are weak, the last three all falling in the borough’s bottom six.
- The main north-south route in South Williamsburg west of the BQE is Bedford. Unfortunately, a continuous route up Bedford misses the all-important connection to the subway at Marcy. The B62 resolves this issue by detouring to serve Marcy, which slows down through-riders.
- Williamsburg streets are narrow. Even Bedford is only 18 meters wide, comparable to a Manhattan street. Bus speeds are unlikely to be high in such a situation, and bus lanes are guaranteed to be contentious due to the removal of on-street parking and loading access.
- The eastern margins of Williamsburg and Greenpoint are awkwardly just too far away for some people to walk to the subway (Meeker Avenue’s easternmost residential area, at Van Dam, is 960 meters from the nearest bus stop in our plan and 1,370 from the G train), but just close enough that most people will still walk rather than take a bus unless the bus is extremely frequent. Without the travel intensity found in Coney Island and at Kingsborough Community College, there is no hope for the travel volumes justifying very high frequency on the routes there, especially the B1. A frequency-ridership spiral is unavoidable, helping explain the poor performance of the B24 and B48.
The only possible compromise is to keep the B44’s current route on Lee, which in our plan we slightly straightened to reach the Marcy subway station faster. Keeping the northbound direction on Bedford, which serves South Williamsburg more centrally than Lee, is out of the question: south of Flushing Avenue, Nostrand is unambiguously more important, and the northern tail of the B44 is too weak to be allowed to drive the placement of the entire route. The cost of restoring the Lee/Taylor bus stop is small, around 12 daily service-hours, and this can be incorporated into the next version. However, it still only serves the area peripherally, and slows through-riders by around 1.5 minutes each way.
Brooklyn-Queens connections
People have told us that interborough connections are the new hot thing, to replace the borough-by-borough bus planning that currently exists. We are not depicting any on our map beyond what currently exists: one route to JFK, the aforementioned north-south Williamsburg route to Long Island City, and a bunch of east-west routes through Bed-Stuy terminating slightly east of the borough line. We are willing to be convinced otherwise, but so far it seems like adding more connections is difficult, for several unrelated reasons.
Hard boundaries
The Brooklyn-Queens border may not be as stark as the East River or the Harlem River, but it is nonetheless mostly hard. East of the Greenpoint/LIC border, the border follows a polluted industrial creek; the B24 crosses it twice and is very weak, and there’s no good route until the cluster of Grand, Metropolitan, and Flushing around Ridgewood. Metropolitan and Grand do go through, and we indicate them on our map. Flushing doesn’t; there’s no good route in Queens to connect it to except maybe a hybrid of the Q18 and Q47 to LaGuardia, and even that is uncertain.
Beyond Ridgewood, there is another hard boundary consisting of several cemeteries. The B13 goes through today, but is a weak route (473 riders/km, 38/hour) and should be cut to just a north-south subway feeder. To the immediate south of the cemeteries, several Queens buses go through to key connection points in Brooklyn. Only the southernmost zone, around Howard Beach, has weak connections.
Queens is not Brooklyn
Brooklyn is relatively uniformly dense, making a grid with uniformly high frequency tenable. Queens is not. East Elmhurst is several times denser than Queens Village. Central and Eastern Queens have a street hierarchy, in which the list of which streets get bus routes is preordained: Lefferts, Jamaica, Union Turnpike, Main, etc.; it’s not the relatively flat grid hierarchy that characterizes most of Brooklyn. There are multiple town centers to serve, with too sparse a rail network for buses to work purely as a rail feeder. The LIRR has so many stations that there are two distinct optimal maps, one assuming fare and schedule integration with commuter rail and one assuming today’s lack of integration.
What this means is that maybe a uniform 6-minute frequency is not right for Queens. Maybe the larger geographic size of Queens, with longer bus routes, permits slightly lower frequency, say every 8 minutes at the base (maybe even every 10). Combining routes is not always the right approach in this situation; there are going to be frequency-based seams.
Depot locations
There are some potential combinations of Brooklyn and Queens bus routes, most obviously on Avenue, which hosts the B54 and Q55. The B12 could even be combined with the Q56 and Q24 as branches. The Q58, an extremely strong circumferential, could be combined with the B38, the busiest Brooklyn route near its terminus. The problem is that the break points today tend to be very close to bus depots, and often they’re major destinations in their own right, such as the subway connection point at Broadway Junction or at Myrtle/Wyckhoff.
The B54/Q55 combination seems relatively easy, but the rest are more strained. At East New York Depot especially the loss of the easy pullout is unlikely to justify cutting the transfer to the few through-riders.
The City Line problem
At TransitCenter, we were asked specifically about the southernmost part of the Brooklyn/Queens border, covering City Line and Spring Creek on the Brooklyn side and Lindenwood and Howard Beach on the Queens side. The bus network there today is glaring in its gaps: there is no east-west connection south of the Q7 (the B15 looks like a connection on a map, but runs nonstop from Brooklyn to JFK). The street network itself is poorly connected, but even the existing connection at Linden doesn’t host local buses.
And yet, there’s not much room for serious improvements. The B15 could make a stop just over the border on the Queens side, but its route to the airport takes it through a highway with nowhere to stop; a BRT lane with some stops at north-south arteries like Woodhaven might be possible, but would not be a pleasant place to transfer at.
Worse, going on Linden and then southeast toward Howard Beach raises a difficult question: where does such a route go on the Brooklyn side? There are too many options: Gateway Center, New Lots on the 3, Euclid on the A/C. Reverse-branching is out of the question. Of those, probably the best is New Lots – Euclid serves a subway line that Howard Beach can get to more easily without the bus, and Gateway will always be too circuitous compared with driving on the Belt Parkway.
Tweaks vs. redesign
There are tweaks that improve Brooklyn-Queens connectivity, like merging the two Myrtle routes, giving the Brooklyn-JFK route dedicated lanes to facilitate a stop at Woodhaven, and changing the Metropolitan and Grand routes slightly to improve intra-Williamsburg east-west service (already depicted on our map). However, this is not the same as a redesign. In some parts of Brooklyn our proposal is a tweak, for example the east-west routes in Bed-Stuy, but in Southern Brooklyn and East New York we are rationalizing nearly everything into a grid, and in Bushwick and Canarsie we are proposing extensive changes.
Additional routes?
Based on the shape of our proposal, there are a few potential additions. One involves a 16th Avenue north-south route, possibly veering east to follow Cortelyou and Beverly. Another involves an Ocean Parkway bus to Church. A third involves extending the B17 up through Bed-Stuy to provide a second interpolating route between Nostrand and Malcolm X, which is available today (as the B15 and B43) but not on our map. A fourth involves going up Smith Street between Red Hook and Downtown Brooklyn until the subway stops in South Brooklyn are made wheelchair-accessible.
However, all of those add a hefty number of service-hours. Whether they’re tenable depends on how strictly NYC DOT implements our recommendations for dedicated lanes on every bus route. If no bus routes are added on top of the ones that exist today, v1.2 requires 11,050 revenue-hours and 1108 buses. This is still more or less achievable with current resources (it requires about a 1-1.5% increase in costs), but there is no room for any additional routes, or for restoring the B25. And that’s without taking into account compromises on bus stop spacing and bus route reliability.
In contrast, things are rosier if the reliability improvements we prescribe are implemented, and if every bus that needs a dedicated lane (i.e. nearly all of them) gets it even if motorists complain. There’s room in the budget for additional service. The above bus routes, excluding B25 restoration, total about 30 km including some possible tie-ins elsewhere in the system, creating nearly 800 new service-hours, bringing the system to the same place it is today, maybe just 1% short given additional efficiency and fleet savings.
And if higher ridership brings in more revenue for the same expense, there should be room for more service increases. The network in v1.2 could support maximum 5-minute peak headways on all routes for 210 more hours, which should not be hard to accommodate even with more routes. Going down to 4-minute peak headways requires another 370 hours, and going to 5-minute off-peak headways requires another 890.
To do all of this, another 1,300 hours or so are needed net of efficiency gains. To keep the subsidy per rider constant, this requires a 12% gain in overall linked trips, which isn’t outlandish (it would still leave Brooklyn with less bus ridership than at the 2002 peak). Making such expansion cost-neutral is harder: a linked trip nets about $2 in revenue, and this expansion would cost about $95 million annually, and then the required growth in ridership, 47.5 million, is 25% over Brooklyn’s unlinked bus ridership. It still looks achievable but very ambitious, relying on a positive frequency-ridership spiral.
Will this happen?
Some variant of a bus redesign will definitely happen. It’s in vogue in the US right now, and the MTA is taking this as an excuse to rationalize its bus service, which has accumulated a lot of oddities and historical artifacts that no longer make much sense.
The question is, will a good redesign happen? That I don’t know. I believe our redesign is good. The conversations I’ve had with bus planners at the MTA have been positive and suggest to me that, barring political interference, they are likely to come up with good redesigns as well, sharing the same overall characteristics as ours. We are working from the same set of best practices, for the most part.
But then the political question looms large. Physically separated bus lanes and signal priority require the city to give a damn about bus riders. Stop consolidation requires the MTA to stick to a long interstation even if minority of people who are hurt by it (e.g. by having high walk penalties and low wait penalties) complain. All of this requires political appointees at DOT and the MTA to consciously think how they can provide better public transit to the city they serve. Will they deliver?
Our Brooklyn Bus Redesign
Eric Goldwyn and I spent about six months working on a Brooklyn bus redesign. I mentioned some aspects of it before here, on social media, and in blog comments, but not the overall shape. Eric and I gave a pair of presentations about our plan, one two days ago at the MTA in front of senior MTA planners and NYC DOT people and one today at TransitCenter in front of activists and mid-level MTA planners. We have a still-unreleased writeup explaining everything we’re doing with references to both public reports from various cities and peer-reviewed literature. Here I’m going to condense the 8,000-word writeup into a blog post length, going over the main points, including of course the proposed map.
The map, in brief
The depicted version is 1.1. You can see a lower-resolution version 1.0 on Streetsblog, albeit with a different color code (the map we made for the presentation, reproduced on Streetsblog, uses red for the highest-frequency routes and blue for the lowest-frequency ones whereas the Google Earth version linked above is the opposite). It has 353 route-km, down from about 550 today, not including Grand and Metropolitan Avenues, which are Queens bus routes, shown on the map for completeness’s sake, without stopping pattern.
Some tails are cut due to low ridership or duplication of rail:
- The B25 on Fulton goes.
- The B37 on Third Avenue is consolidated into the B63 on Fifth.
- The B45 and B65 are merged into one compromise route.
- The B15 is cut east of the Long-Term Parking JFK AirTrain station (where service is free); ideally it would be cut east of City Line with passengers taking the subway to the AirTrain (as was the case in version 1.0), but I do not expect Port Authority to integrate AirTrain fares with the subway.
- The B41 is cut north of Parkside Avenue, at the transfer to the B/Q.
- Instead of two routes in Bed-Stuy between Nostrand (i.e. B44) and Malcolm X (i.e. B46), today’s B15 and B43, there’s just one route.
- The B57 segment on Court and Smith Streets in South Brooklyn goes, as the subway serves the area in several directions.
- The B39 over the Williamsburg Bridge goes.
- The B32 and B62, providing north-south service through Williamsburg up to Long Island City, are merged into one compromise route.
- The East New York bus network is circuitous (buses go to Gateway Center the long way around) and is straightened here.
- In version 1.0, the B26 on Halsey was cut west of Franklin with a forced transfer to the subway, but the short distance to Downtown Brooklyn argues in favor of continuing to at least Flatbush.
Overall, this is a cut from 54 routes (including the separately-managed MTA Bus routes B100 and B103) to 37. The smaller network is far more frequent. The minimum frequency is,
- Every 6 minutes between 6 am and 10 pm every day.
- Every 10 minutes between 5 and 6 am and between 10 pm and midnight.
- Every 30 minutes between midnight and 5 am; every 20 minutes with timed transfers to the subway is aspirational, but the subway doesn’t run reliably on a timetable overnight for such a system to be viable. The 30-minute night network could potentially involve mini-pulses in Downtown Brooklyn and smaller hubs (like East New York and Bay Ridge).
Routes depicted in red on the Google Maps link, or in blue on the map in the Streetsblog link, have exactly the minimum frequency. Routes depicted in green have higher frequency at the peak; routes depicted in blue on Google Maps or red on Streetsblog have higher frequency peak and off-peak. Higher frequency than the minimum is depicted as “Utica [2/4]” (buses on Utica run every 2 minutes peak, 4 off-peak) or “Avenue U [5/6]” (buses on Avenue U run every 5 minutes peak, 6 off-peak). Peak means 7-9 am and 5-7 pm on weekdays, in both directions; the morning peak is a little earlier and the afternoon peak a little later than the subway peak, but as buses are still mostly subway feeders, an earlier morning peak and a later afternoon peak are justifiable.
Speedup treatments
Pruning the network is not the only or even most important part of bus reform. Buses have to be sped up to be useful for people except as last-resort transit. In interviews about unrelated topics, people have volunteered to me that they do not take trips they used to take due to the degradation in bus speed and reliability. New York City Transit bus ridership peaked in 2002; the fare hike in 2003 led to a small dip in ridership that the mid-2000s oil crisis didn’t quite erase, and then in the recession and subsequent recovery bus ridership crashed. In Manhattan it’s 30% below the 2007 level; in Brooklyn it’s 20% below the 2007 level, with buses extending the subway or letting people connect to a better line (like the B41 and B35) particularly hit.
The current average speed in Brooklyn is about 11 km/h. Excluding limited-stop buses, it’s 10.8. We’re proposing to increase it to 15, even though the redesign is pruning buses in faster areas more than in slower ones. This is using four speedup treatments.
Prepayment
Today, New York prefers to treat off-board fare collection as a special product available only on select buses (i.e. SBS). This should be changed to citywide prepayment, with all-door boarding. German-speaking cities do it; so does San Francisco. Data from San Francisco and from the TRB (PDF-p. 20) suggests a gain of about 2.5-3 seconds per passenger boarding, counting both boarding and alighting time. At Brooklyn’s bus ridership level, this suggests a saving of around 400-450 revenue-hours, or about 4% of total service-hours. This is not a big change, but it helps stabilize the schedule by slowing down the mechanism by which buses bunch.
How to get passengers to pay if not on-board remains an open question; there are several approaches. The Zurich model involves placing a ticket-vending machine (TVM) at every bus stop. While New York severely pays for TVMs on SBS (the RPA says $75,000 per stop), an ATM costs $3,000, so installing the required infrastructure need not cost a lot. But more commonly, passengers can board freely if they have transfers or unlimited monthlies and pay the driver (potentially after the bus has begun moving) otherwise.
Of note, the bus drivers are particularly interested in prepayment. Eric and I explained the issue in a CityLab article a few months back: the drivers are worried about being assaulted by riders who don’t want to pay.
Stop consolidation
About 60% of the time saving in our plan relative to current practices comes from stop consolidation. I discussed the issue here, and our forthcoming report has references to many studies in the literature optimizing stop spacing for minimum door-to-door travel time. With each deleted stop saving 20-30 seconds (say 25 seconds on average), our proposed stop consolidation, from an average of 220 meters to 490 excluding long tails (i.e. the B15’s long nonstop segment toward JFK) saves around a minute per km, cutting travel time from 5.5 minutes per km to 4.5.
Conceptually, stop spacing should be longer when trips are longer, or when relative density is less uniform. New York City Transit bus trips are short, as many are subway extenders, but relative density is extremely spiky, as a large number of people get off at a few dominant stops at the subway connection points. If the on/off density on a route is uniform, then lengthening the stop spacing means passengers have to walk longer at both ends; but if passengers are guaranteed a connection at one end (because of transfer points with the subway or other buses) then they only have to walk longer at the other end. Based on this principle, Utica and Nostrand get particularly long stop spacing. Conversely, routes with extremely short trips, like the Mermaid route inherited from the B74, have shorter stop spacing.
To improve network legibility, we have tried as far as possible to have buses stop on consistent streets. For example, south of Fulton Street (where it’s awkwardly between Nostrand and Franklin), Bedford Avenue gets a stop on every intersecting bus, including east-west routes but also the diagonal B41.
Every bus stop should have shelter. In Central Florida, North Florida, and London, this costs $10,000 per stop, give or take. Our 707-stop plan (700 in version 1.0) would cost $14 million at this cost. Even at Santa Ana’s higher cost of $35,000, it’s $50 million. NIMBYs who oppose stop consolidation argue that having many stops is necessary for people with disabilities, but people with disabilities would benefit from benches and shelter, without needing to stand for 15 minutes waiting for bunched buses.
Bus lanes
Every bus in an area with congestion should get dedicated lanes. SBS implementations so far, imperfect as they are, have saved around 30 seconds per km in traffic. Physically-separated median lanes should do better; the MTA and NYCDOT have so far avoided them on the theory that local and limited bus routes should coexist on the same route and limiteds should pass locals, but in reality, a single stopping pattern is better, and then there are no drawbacks to physical separation.
On wide streets, this is not a problem. On narrow ones, it is. The real headache is Nostrand, about 25 meters wide building to building, enough for just four lanes. The correct thing to do is a moving lane and a bus lane in each direction, with merchants told to park on side streets. If parking is unavoidable, then a contraflow bus lane, with parking on one side, is also feasible, but less safe for pedestrians (Boulevard Saint-Michel has this configuration and has to remind pedestrians crossing the street to look left).
Two-way buses are essential whenever streets are widely separated, as on avenues, in Brooklyn as well as Manhattan. Nostrand is just more important than Rogers and New York Avenue, where northbound B44s go today; today’s configuration forces east-west buses to make too many stops (the B35 limited makes 4 stops in a kilometer).
Signal priority
Buses should get priority at intersections and not just on the street. The studies we’ve seen find a 4-7% gain, bus only on individual bus routes, not gridded networks. In our proposed trip times we are not assuming any speedup from signal priority, just better timekeeping as more delayed buses get priority to stabilize the schedule. This is a counter-bunching mechanism more than a straight speedup.
A process, not an immutable product
Jarrett Walker’s bus network redesigns tend to come as complete products, changed rapidly from radial low-frequency networks. What we’re proposing is a longer process. Nova Xarxa began implementation in 2012 and is wrapping up now, installing a few routes at a time by cannibalizing parallel routes. The map we’re showing is what we estimate would be a good fit for 2022-3. Beyond that, more subway stops are going to be wheelchair-accessible, making it easier to prune more subway-parallel buses (like the B63).
Gradual implementation means starting from the easier parts of the network. East New York’s current network is so circuitous that straightening it should not be too controversial. Our proposed redesign there is also better at connecting to the 2, 3, 4, and 5 trains and not just the L, which should prove valuable during the L shutdown. In Southern Brooklyn, we are proposing more service, but this could be paired with stop consolidation. Central Brooklyn and Bed-Stuy require the most street redesigns and the most robust frequency network-wide (as they are already transfer-based grids, and nobody transfers at 12-15 minute off-peak frequency) and could be done later; the B25 itself should probably not be eliminated until Broadway Junction is made accessible on the A and C lines.
We are not even wedded to the map as a proposal for 2022. Some variations are always possible, as already seen in the differences between versions 1.0 and 1.1. The biggest addition we can think of is adding a second north-south route through Bed-Stuy: the existing one would be moved from Marcus Garvey to Throop (hitting the subway better), while the B17 could be extended up Troy and Lewis.
Overall, Brooklyn has 10,800 service-hours today. Our redesign uses just 10,000, with a 1% gain in efficiency from location relative to bus depots on top of that. There is room for service increases, or restoration of marginal routes required for political reasons, or slowdowns imposed by political unwillingness to install bus lanes.
Win-lose
In a modern developed country, it’s rare to find win-win situations. The US is blessed with these in transit (i.e. it’s so inefficient at construction it might as well be third-world), but not in urban bus networks. Stop consolidation is a net benefit to the average user of the route, but a few people would still see longer trips, e.g. those living at the exact midpoint between two widely-spaced stops. Route consolidation (as in Ocean Hill) is the same thing.
There are sociopolitical groups that would win out: labor would see higher ridership, reducing the pressure to cut jobs; regular commuters (who generally have low transfer penalties) would see faster trips; people with disabilities that make it difficult for them to stand (as is true of some people with chronic pain) would be able to sit at bus stops and wouldn’t need to sit for long. In contrast, small business owners would sometimes lose the ability to park in front of their stores, and occasional users who usually drive would see longer perceived trips because of stiff transfer penalties.
This is equally true on the level of neighborhoods. Southern Brooklyn generally gains, and Borough Park in general gains an extra north-south route (though this is canceled out by high transfer and access penalty among Haredis: in Israel they just won’t walk longer to better service). East New York sees much more direct routes. Flatbush and East Flatbush don’t see much change in network structure but do gain off-peak frequency. Red Hook gains a direct connection to Manhattan. But then Bed-Stuy loses north-south routes, South Brooklyn’s buses are completely gutted, and Williamsburg loses north-south routes.
A political system based on citywide (or nationwide) ideological groups could find the will to build the network we’re proposing or something like it. Could a system based on local representation, treating retirees and small business owners as a vanguard class, deliver the same? We will see in the next year or two.
High-Speed Rail in India
India’s economic development lags China’s by about 15 years, so it shouldn’t be surprising that it’s beginning to construct a high-speed rail network. The first line, connecting Mumbai and Ahmedabad via Surat, began construction at the end of last year, with completion targeted within four years; the two states served, Maharashtra and Gujarat, are more or less India’s two richest large states, and are also both deeply right-wing, with nearly every constituency backing Modi. There are some severe problems with the system, stemming from its use of turnkey Japanese technology. But more broadly, India’s geography is just difficult for high-speed rail, especially by comparison with other high-population density countries at similar level of development, like Pakistan and Indonesia.
Japanese technology
The Mumbai-Ahmedabad corridor is to use imported Shinkansen technology, with Japanese financing. India has a vast railway network using broad gauge, with extensive regional rail (the Mumbai Suburban Railway has 2.6 billion riders per year) as well as legacy intercity rail.
However, to maintain Shinkansen compatibility, India has chosen to use standard gauge. This is based on a misunderstanding of why HSR uses standard gauge. Spain uses near-Indian gauge on its legacy network but standard gauge on HSR to maintain compatibility with the French TGV network, and Japan has narrow gauge on the legacy network and standard gauge on Shinkansen because narrow-gauge trains can’t run as fast. Neither of these justifications applies to India, and evidently, in another country where they don’t apply, Russia, HSR is to use broad gauge. With standard gauge, India will not be able to run HSR through to the legacy network, connecting to cities beyond the initial line, such as Delhi, nor will it be able to stage future construction to build lines in phases, the way France did, with through-service to lower-speed territory.
Even worse, alone in the world, India is using the Shinkansen’s loading gauge on HSR: trains are 3.35 meters wide, enough for 5-abreast seating. Indian Railways has a loading gauge allowing 3.66 meter trains, enough for 6-abreast seating with the same compromises on comfort familiar to every airline economy passenger. I don’t know what the standards for track centers are to be on India’s HSR: Indian Railways’ manual says 5.3 meters, which is wide enough for everything, but Shinkansen standards specify 4.3 meters, which is tight enough that a future widening of the track and loading gauges may pose difficulties for passing at high speed (at low speed it’s easy, India’s legacy track centers are 4.265 meters, and standard-gauge America’s are 3.7 meters on the slower parts of the Northeast Corridor).
During construction, the decision to use the wrong-size trains is fixable. Even after service opens, if the track centers are not too narrow, it’s possible to add a third rail to permit a transition to broad gauge. If the track centers are as narrow as the Shinkansen then might still be possible, if the third rails are on the outside (it would widen the track centers by the difference between the gauges, or 23.3 cm), but then the platforms would need to be shaved for wider trains. In the medium and long runs, such gauge widening is critical as India builds out its network.
But today, so complete is India’s reliance on Japanese technology that the training for drivers will be conducted in Japan, in Japanese; train drivers will be required to speak Japanese, as the Shinkansen trainers will not all speak English. It goes without saying that without a large body of Japanese speakers, India will be forced to pay first-world or near-first-world wages, forgoing its advantage in having low labor costs.
Construction costs
The projected construction cost of the 508-kilometer line is 1.1 trillion (“lakh crore”) rupees, which is $15 billion in exchange rate terms and about $55 billion in PPP terms. Per Wikipedia, the route includes only one tunnel, a 21-km approach to Mumbai with suburban and underwater tunneling (even if the gauges were compatible, using existing tracks like TGVs is impossible due to the use of every approach track by overcrowded Suburban Railway trains). The rest of the route is predominantly elevated, but the decision to runs the trains elevated rather than at-grade is only responsible for about 10% of its cost.
Despite the complexity of such a tunnel, there is no excuse for the high construction cost. In exchange rate terms it’s reasonable. Japan’s domestic Shin-Aomori extension of the Shinkansen cost about $55 million per kilometer, including a 26 km tunnel consisting of a third of the route and additional tunnels totaling a majority of the route. More recently, Japan’s new bout of Shinkansen construction costs about $30 billion for 389 km, but tunneling is extensive, with the Hokkaido route planned to be 76% in tunnel.
With India’s complete reliance on Japanese technology, paying the same as Japan in exchange rate terms is not surprising. It’s a disaster for India, which has to pay in depreciated rupees instead of leveraging its low-cost labor, but as far as Japan is concerned, it’s a perfect copy of the domestic Shinkansen system. Similar high costs can be observed for some Asian metro projects using Japanese financing, namely Dhaka (the world’s highest-cost elevated metro, even worse than in the US) and Jakarta.
In contrast, where India improves its rail network by tapping into Indian Railways’ own expertise, costs are low. Nearly half of India’s rail network is electrified, and to save money on expensive fuel, the country is rapidly electrifying the system, targeting 100% electrification. A plan to electrify 13,675 route-km in the next four years is to cost 12,134 crore rupees, about $123,000/km in exchange rate terms or $450,000/km in PPP terms. In the developed world, $1-1.5 million/km for electrification is reasonable, and the unreasonably expensive UK, US, and Canada go up to $5-10 million/km. Left to its own devices, Indian Railways can build things cheaply.
Network structure
India’s geography for high-speed rail is not easy. Mumbai, Surat, and Ahmedabad are the only three cities in the top 20 that lie on a straight line at easy HSR range. Delhi-Mumbai, Delhi-Kolkata, and Mumbai-Chennai are all just outside the best range for HSR (and Kolkata-Chennai is well outside it), having to rely on intermediate cities like Ahmedabad, Hyderabad, and Kanpur for ridership. Within Uttar Pradesh, Kanpur and Lucknow are both large cities, but the line connecting them is almost perpendicular to that connecting Delhi and Kolkata, so that only one can be served on the main line. In the South, there is a similar situation with Mumbai-Chennai, via either Bangalore or Hyderabad (and there, both routes should be built as Bangalore and Hyderabad are both near-megacities). Mumbai itself requires extensive tunneling in all directions: north toward Gujarat and Delhi, south toward Pune, and possibly also northeast toward the interior cities of Maharashtra.
I drew a possible map for a nationwide network. The total length is 17,700 double-track-km. It’s about the same length as most American proposals, and less than half as much as what China aims to build by 2025, but India has four times the population of the US and far higher population density, and its density is also several times that of China. For a better comparison, consider Pakistan: it is slightly less dense than India and has about 15% India’s population, and yet two spines totaling about 1,800 km, Karachi-Lahore and Lahore-Islamabad-Peshawar, would connect nearly every major city. Lying on the Indus, much of Pakistan has a linear population distribution, facilitating rail connections.
With a difficult urban geography for HSR, India has to take especial care to reduce construction costs. This means, in turn, that it needs to rely on indigenous expertise and standards whenever possible. When imported technology is unavoidable, it needs to provide its own financing (with an annual budget of 29 trillion rupees, it can afford to do so) and force Japanese, Korean, and European vendors to compete. A Chinese-style tech transfer (read: theft) is not possible – the vendors got burned once and won’t agree to the same again – but domestic driver training, with the foreign role restricted to the rolling stock (built to Indian standards) and engineering, is essential and unlikely to bother the global industry.
Sioux City: Straightening Buses and Getting Route-Length Right
A few days ago, Sandy Johnston linked to a diagram of the single bus route in South Sioux City, Nebraska, a suburb of Sioux City, Iowa. While South Sioux City has a traditional main street in Dakota Avenue, the bus does not follow it; it meanders, hitting destinations on and off Dakota. Many destinations are on US Route 77, an arterial bypass around the built-up area, with recent auto-oriented retail and office uses, including a Wal-Mart (in small-town America often the biggest bus trip generator). The discussion around what to do with this region’s bus network made me realize a crucial concept in planning infrequent transit: getting route-length right. To start with, here is a map of the bus, numbered Route 9 within the Sioux City area:
Here is a PDF map of the entire network. It has 10 routes, using 12 buses running hourly, with a timed meet at the center of Sioux City (just off the above map) at :30 every hour. Most routes run as loops, with highly separated inbound and outbound legs. Route 9 above runs one-way southbound on Dakota Avenue in the northern and southern legs but then meanders to run southbound on Route 77; the Dakota Avenue leg in between the two major east-west runs is one-way northbound.
I asked, why need it be so complicated? The major destinations are all on Dakota or Route 77. It should be easy to run two distinct routes, one on each, right? Without the east-west meanders, there would be the same total service-hours, right?
But no. The route runs hourly. The scale of the map is small: from the bridge over the Missouri in the north to I-129 in the south it’s 4.1 km. There is so little traffic that in the evening rush Google Maps said it would be just 10 minutes by car from Downtown Sioux City to the southern edge of Dakota Avenue near I-129. The roundtrip time would be 25-30 minutes, so the bus would sit idle half the time due to the hourly pulse.
Getting route-length right
When designing regional rail schedules, as well as my take on night buses in Boston (since reduced to a single meandering route), I’ve taken great care to deal with roundtrip route length not always being an integer multiple of the headway. A train that comes every half hour had better have a roundtrip length that’s just less than an integer or half-integer number of hours, counting turnaround times, to minimize the time the train sits at the terminal rather than driving in revenue service. The same is true of buses, except that scheduling is less precise.
In Boston, the plan at the time was for hourly buses, and has since changed to half-hourly, but the principle remains. The roundtrip length of each leg of the night bus network, should it expand beyond one (double-ended) route, should be an integer or half-integer number of hours. In practice this means a one-way trip time of about 25-26 minutes, allowing for a little recovery time and for delays for passengers getting on or off; overnight there is no traffic and little ridership, so 25 minutes of driving time correspond to just less than 30 minutes of actual time.
Thus, on each corridor, the bus should extend about 25 minutes of one-way nighttime driving time from the connection point, and the choice of which routes to serve and where to end each route should be based on this schedule. Of course on some shorter routes 12 minutes (for a half-hour roundtrip) and on some long routes 38 minutes (for a 90-minute roundtrip) are feasible with half-hourly frequencies, but in Boston’s case the strong night bus routes in practice would all be 25.
Length and frequency
In the case of Sioux City, hourly buses meeting at the center should have a one-way trip time of 25 minutes. However, the city is so lightly populated that there is little traffic, and the average traffic speed is so high that 25 minutes puts one well outside the built-up area. The driving time from city center to the edge of the built-up area, around I-129, Lakefront Shopping Center, and the various Wal-Marts ringing the city, is around 10 minutes.
Moreover, a car travel time of 10 minutes corresponds to not much longer on a bus. Frequent commenter Zmapper notes that in small American cities, taking the driving time in traffic and multiplying by 1.2, or 1.3 with recovery time, is enough. A one-way driving time of 11-12 minutes involves a roundtrip bus time of half an hour.
With such a small urban extent, then, the bus frequency should be bumped to a bus every half hour, leveraging the fact that few important destinations lie more than 11-12 minutes outside city center. The question is then how to restructure the network to allow for doubling frequency without doubling operating expenses.
The importance of straight routes
Some of Sioux City’s bus routes go beyond the 12-minute limits, such as route 6 to the airport. But most stay within that limit, they’re just incredibly circuitous. Look at the map of route 9 again. It jumps between two main corridors, has multiple loops, and enters the parking lots of the Wal-Mart and other destinations on US 77.
The reason for the meanders is understandable. US 77 is a divided highway without sidewalks or crosswalks, and none of the destinations thereon fronts the road itself. From the wrong side of the road to Wal-Mart it’s 330 meters, and a few other retail locations are more than 100 meters off. Many agencies wince at making passengers walk this long.
However, understandable does not mean justifiable. Traversing even 330 meters takes only about 4 minutes, and even with a hefty walking penalty it’s much less than the inconvenience caused by hourly headways. The other routes in the Sioux City area have the same problem: not a single one runs straight between city center and its outer destination.
With straighter routes, the savings in service-hours would permit running every half hour. A single bus could run every half hour if the one-way car travel time were at most 11-12 minutes; up to 23 minutes, two buses would provide half-hourly service. With 12 buses, there is room to replace route 9 with two routes, one on Dakota and one on US 77 (possibly entering the Wal-Mart, since the route is so short it may be able to get closer to Wal-Mart while still staying under 12 minutes). The Lakeport Commons and Southern Hills Mall area could get buses at the entrance, as it is the logical end of the line (route 1, to Southern Hills).
Some pruning would still be required. Some low-density areas far from the main corridors would have to be stranded. Some circumferential lines would be pruned as well, such as route 10 (to the Commons) on US 75 and route 2 (on Pierce Jackson) to Wal-Mart. Circumferential lines at such a low frequency are not useful unless the transfers to the spokes are timed, which is impossible without breaking the city center interchange since the lines take different amounts of time to get between city center with the plausible connection point. Ultimately, replacing the hourly routes with half-hourly routes would guarantee better service to everyone who’d still get any service, which is nearly everyone.
It’s not just Sioux City
I focus on Sioux City because it’s a good toy model, at such scale that I could redesign the buses in maybe two weeks of part-time work. But it’s not the only place where I’ve seen needlessly circuitous routes wreck what should be a decent bus network for the city’s size and density. In 2014 Sandy wrote about the bus network in New Haven, which has okay trunks (I only needed to hitchhike because of a bus delay once – the other four or five times I took the bus it was fine) but splits into indescribably complex branches near its outer ends.
More recently, I looked at the network in Ann Arbor, partly out of prurient interest, partly out of having gone to two math conferences there and had to commute from the hotel to the university on the city’s most frequent bus, route 4. Zoomed out, the Ann Arbor map looks almost reasonable (though not quite – look at routes 5 and 6), but the downtown inset shows how route 4 reverse-branches. Ann Arbor is a car-oriented city; at my last math conference, in Basel, a professor complained that despite the city’s leftist politics, people at the math department were puzzled when the professor biked to campus. The buses are designed to hit every destination someone who’s too poor to own a car might go to, with speed, frequency, and reliability not the main concerns.
The underlying structure of bus networks in small American cities – radial buses converging on city center, often with a timed transfer – is solid. The problem is that the buses run every hour when cities should make an effort to run them every half hour, and the routes themselves are circuitous. In very small cities like Sioux City, increasing the base frequency is especially urgent, since their built-up extent is so compact a direct bus would reach the limit of the serviceable area in 10-12 minutes, perfect for a half-hourly schedule, and not the 25 minutes more typical of hourly schedules. Sometimes, scaling down requires maintaining higher frequency than the bare minimum, to avoid wasting drivers’ time with low-value meanders.
Cities and Cultural Cringe
Following up on my last post’s promise to tackle both cultural theory of risk and cultural cringe, here is my take on the latter issue.
It is normal for people to have some degree of national pride and fervor. Cultural cringe refers to the opposite trend: when, in some circumstances, people in certain countries feel national shame and develop an inferiority complex. The term cultural cringe itself was coined by A. A. Phillips in 1950, describing Australia’s inferiority complex toward Britain in literary fields: Australians thought their literature was too provincial and perhaps too incomprehensible to the British readers, and as a result many authors were uncomfortable making the local references celebrated in the literary canon of Britain, France, Russia, the US, etc. This notion has been generalized elsewhere. Amos Oz says he felt uncomfortable writing books in such a peripheral country as Israel until he read Sherwood Anderson’s Winesburg, Ohio, showing how literature of and by the provinces can thrive.
From its origin in Australian literature, the idea of the cultural cringe has expanded to other fields, including the law, social relations, technology, and business. It seems endemic in former colonies, especially ones that are not rich. One writer in Nigeria argues how best practices thinking is cultural cringe by giving an example of a recent legal importation that turns out to already exist in traditional Yoruba law. In Australia itself, political scientist L. J. Hume pushed back against the notion that there is cultural cringe, arguing it is true of literature but not economics of other fields. But in mass culture, the vast majority of countries, both developed and developing, consider American film and television superior to their own and have domestic industries that focus on arthouse films or low-budget flicks.
Cultural cringe in legal, political, or technological fields remains endemic in many other developed countries. In one recent example, Emmanuel Macron said France is inherently resistant to change and (by implication) ungovernable, comparing it negatively with Denmark. In business, 1980s-era America was replete with books telling managers how to think like a Japanese or German, which trend ended when the Japanese lost decade and the economic crisis of German unification made these countries less fashionable.
Lying in the intersection of business, politics, and technology, urbanism and transportation are amenable to analysis using this concept. As in the Nigerian example, the third world tends to have too much cultural cringe and too much faith in the merits of importing first-world methods. Conversely, the United States (and to a large extent Canada) today is resistant to outside ideas and does not know how to be a periphery.
Urban layout: there’s a world outside Europe
During the SB 827 debate in California, supporters reassured restive city residents that the density the bill promoted – up to 7 floors right next to transit lines and up to 5 a little farther away – was gentle. “Paris density,” they said. Everyone likes Paris as a tourist. Everyone recognizes Paris as good urbanism.
There is very little cultural cringe in the United States – on the contrary, Americans are solipsistic in every field. However, one of very few exceptions is that the American middle class vacations in Europe and is familiar with how walkable European cities are. (It’s even referenced on Mad Men when a minor character goes on walks in their car-oriented New York suburb.) Paris is the largest and richest city Americans of a certain wealth and education level can be expected to be familiar with and like, but by the same token the YIMBYs could mention Barcelona, Amsterdam, and Rome.
But it’s useful to think of what was not mentioned. Certainly not Hong Kong or Dubai, which seem to be mentioned almost exclusively negatively in Western discourse. Not Tokyo, which Westerners are much less likely to visit to the point that the Western blogs talking about Japanese urbanism (like Urban Kchoze) are notable for it. Nothing in the middle-income world, including some old cities (like Mexico City and Istanbul) that have building height, street width, and stylistic variation that first-world urbanists would approve of (and do if they’ve been there).
In this situation, the invocation of famous European cities feels less like a dialogue and more like an attempt to induce cringe defensively, to make people feel less attached to their cities’ American auto-oriented character. In effect, it’s an attack on “it will change the character of our neighborhood,” a line that’s much less common in countries that are used to thinking of themselves as inferior to whatever they consider the metropolitan core (such as the first world writ large in Israel, or the former colonial master in ex-colonies).
Transportation: a little cringe is good, but not too much
In the developing world, there is extensive cringe. Without using that term, I suggested it as a reason behind high construction costs in the third world, which are similar to the costs of the first world today and several times as high as those of the first world from back when its income levels were comparable to those of subway-building third-world countries, in the early 1900s. In Latin America and China, development is more inward-looking, and China in particular learned to build subways from the USSR in the 1950s, not a rich country. In former colonies, there seems to be a greater willingness to import methods from either the former colonizer or from countries that aggressively invest in third-world infrastructure, like Japan and China; the result is very high construction costs for projects for which I have data in India and other countries of that development level.
In some cases, like India’s high-speed rail program, the country imports technology wholesale, and Japan (or China) may insist on an exact copy of its methods. As it is, Japan refuses to call Taiwan High-Speed Rail a Shinkansen system even though it runs Shinkansen rolling stock: construction methods were European, so Japan only calls THSR a high-speed rail system using Shinkansen-based technology.
However, decisions like India’s standard-gauge metro lines happen even in indigenous systems. Delhi Metro uses standard gauge not for some turnkey technological import, but purely because it feels more modern whereas Indian mainline trains feel dinghy and dangerous. Evidently, Delhi Metro electrification is 25 kV, which is standard on mainline trains but unheard of on first-world metros; modifying subways for high-voltage electrification requires expensive concrete pouring, since high-voltage catenary requires more generous clearances to avoid arcing, whereas modifying rail gauge is routine since the European vendors are used to selling to broad-gauge Finland and Spain and the Japanese ones are used to their country’s multitude of gauges.
And if India errs on the side of too much shiny adoption of foreign technology, the US errs on the side of adopting too little. Americans do not think their country is inferior. American authors do not think they need to experience another country or speak another language before they write. There was a time when the American business community felt outcompeted, but today it feels like it’s at the top of the world, Silicon Valley having long left Japanese corporations in the dust; I stopped seeing complaints that American cars were inferior to German and Japanese ones not long after Obama’s auto industry bailout.
The American policy sphere seems especially constrained. There is some cultural cringe toward London, leading thinktanks like the Regional Plan Association and TransitCenter to overlearn from London’s peculiarities (like the Oyster fare cap and contactless credit card payment), but not much toward Continental Europe and practically none toward Japan. Instead, the attitude toward non-English-speaking countries is one of dismissal. When Richard Mlynarik pointed out to a Caltrain official consultant that Japanese trains turned much faster at terminals than Caltrain thought possible, the consultant replied, “Asians don’t value life the way we do.” (Update 2020-09-05: since a bunch of people in the Bay Area reference this line, I am reminded that this was not a public employee of Caltrain but a consultant brought in for the Transbay Terminal project.)
If India fails to understand where its own methods could be superior despite being a peripheral country, the United States fails to understand that it’s a peripheral country in the first place. Transportation innovation rarely happens in North America. It happens in Western Europe and Japan, and to some extent in developing countries that have less cultural cringe than former colonies, such as Brazil and Colombia and their invention of BRT or Colombia, Bolivia, and Mexico’s use of aerial gondolas in mountainous suburban areas.
Urban development: you are not New York
I’ve been reading Aaron Renn’s blog, the Urbanophile, since maybe 2008. At the time he was still in Indianapolis, in (I believe) management consulting, writing about how his city was trying to become culturally and economically bigger than it was, and sometimes but not always succeeding. A recurrent theme in his writings has been that Midwestern American cities are desperate for development. They keep saying they need more creative people, more venture capital, or whatever else is in vogue. (In contrast, he says, Rhode Island, where he lived later, doesn’t even understand how peripheral it is.)
However, the way the Midwestern cities he focuses on try to attract this elusive development is through cheap copying. An old post of his I can no longer find contrasts world-class Indianapolis with world class in Indianapolis. The former involves investing in some city institution to make it world-class, or more realistically notable enough that boosters can call it world-class with a straight face. The latter involves inviting a starchitect or another person with international cachet (such as Richard Florida) to build something in Indianapolis that’s notable and is exactly as notable as what this person might build in any other city of that size, with no particular connection to the city itself.
In the transportation field, many American cities build mixed-traffic downtown streetcars and beam with pride if they get 4,000 riders per weekday. Often this mentality overrides any attempt to provide services to city residents: thus, the streetcar in Detroit is not integrated with the city’s bus network, and in fact a bus runs on the same street, on different lanes from the streetcar. This isn’t about some mythical preference for rail over bus: these cities build whatever they hear is in vogue and will get them noticed by New York media, whether it’s peak-only commuter rail, a downtown streetcar, a limited bus that calls itself BRT, or now a bus network redesign around untimed 15-minute frequencies.
Cringe vs. dialogue
It’s important to distinguish dialogue with a foreign culture and cultural cringe toward it. One difference is that cringe implies infatuation; however, infatuation can also develop among immigrants who are steeped in the metropole’s culture after having lived there even while maintaining ties to the old country. A bigger difference is the extent of two-way dialogue. Israelis use the expression “unbroken country” to refer to the mythical average first-world country in which you can get things done without having to tell government bureaucrats that you served in the military with their bosses; however, few have lived abroad long enough to know the details of what makes these countries tick better.
With limited knowledge of the core, the periphery can worship at the feet of the few people who do know, which leads to political bias. This is where moral panics of no-go zones come from: there is an Israeli television show purporting to portray how things are in Europe, but any connection between Belleville (or other racially diverse Paris neighborhoods) and what they depict is completely incidental. In that case, the bias is right-wing. In the opposite direction, left-wing bias can occur when American liberals and socialists are enamored by European health care and education systems and elide a thousand details that distinguish them from American renditions of single-payer health care or free college tuition.
But the biased reaction is only common in places that care little about how to govern. “Well, actually Tower Hamlets is a no-go zone” is not a blueprint for reducing nonwhite immigration to the United States or Israel. Instead, in the policy sphere a more common reaction is a shrug. Dialogue is threatening: the people capable of it are typically not the top pundits on this issue. Instead, it’s more common to aggressively dismiss knowledge that’s hard to access, even among people who at the same time invoke the cringe. In Israel it takes the form of self-denigrating lines like “this is Israel, not Finland.” Cultural cringe leads to lower expectations this way.
When Phillips criticized Australian authors who deracinated their writing to appeal to British taste, he was implicitly saying that Australians couldn’t root their literature in British experience. Oz, similarly, felt constrained about writing when he was young because living in Israel, he could not root his books in Paris, Milan, and other flashy cities whose books he devoured. The economic (or legal, or technological) analogue of this observation is that the reason there is cultural cringe is that people in peripheral areas (which in transportation include the United States) are too unfamiliar with the core and cannot dialogue with it the way people in different parts of the core can.
Urbanism is not literature. One doesn’t need extraordinary sensitivity and a lifetime (short as it may be) in a culture to produce very good insights about transportation, housing, or municipal governance. It’s possible to break out of the cringe by acquiring detailed knowledge of how the core operates. In the case of the third world and subway construction, it means learning enough about current and historical construction methods to be able to propose ways to build infrastructure at low costs commensurate with these cities’ low wages; in the case of the United States, it means learning enough about what makes European, Japanese, Latin American, etc. urbanism tick that it can be adopted domestically.
Urbanism is not literature in a far more important sense: there really are better and worse traditions there. It’s not enough to have pride in what you have when what you have is a third-world city where the poor don’t have running water, or for that matter an American city that would shut down instantly were gas prices to rise to levels necessary to stop global warming. Learning from the core is crucial. It’s just equally important to do so through dialogue and not through the ignorant self-denigration that is cultural cringe.
