Public Transit is Greener Than It Seems
The main way to judge how good public transportation is for the environment is to measure how many car trips it displaces. But in reality, it’s better, and I’d like to explain why. As a warning, this is a theoretical rather than empirical post. My main empirical evidence for it is that European car usage is lower relative to American levels than one might expect given public transit mode shares; in a way, it’s an explanation for why this is the case.
While the explanation relies on changes in land use, it is not purely a story of zoning. The population density in much of my example case of auto-oriented density – Southern California – is well below the maximum permitted by zoning, thanks to the lack of good transit alternatives. Thus, even keeping zoning regimes mostly as they are, public transportation has an impact on land use and therefore on car pollution.
Transit always displaces the longest car commutes
In an auto-oriented city, the limiting factor to the metro area’s density is car traffic. Adding density with cars alone leads to extra congestion. Devin Bunten’s paper entitled Is the Rent Too High? finds that, assuming no changes in travel behavior (including no change in the option of public transit), zoning abolition would actually reduce American welfare by 6%, even while increasing GDP by 6%, because of much worse congestion; optimal upzoning would increase GDP by 2.1% and welfare by 1.4%, which figures are lower than in the Hsieh-Moretti model.
The upshot is that if there is no public transportation, people live at low density just because the alternative is the traffic jams of dense car-oriented cities; Los Angeles is the most familiar American example, but middle-income examples like Bangkok are denser and worse for it. Low density means people travel longer to reach their jobs, by car, increasing total vehicle travel.
In the presence of mass transit, people don’t have to sprawl so far out. Los Angeles’s “drive until you qualify” mentality is such that, if there were room for a million transit users in the inner parts of the region, then no matter which exact group of million people from the five-county area started taking transit, ultimately the shuffle would be such that there would be a million fewer people driving in from Antelope Valley, Victor Valley, and the Inland Empire.
The model
Consider a city that comprises concentric rings, as in the following diagram:
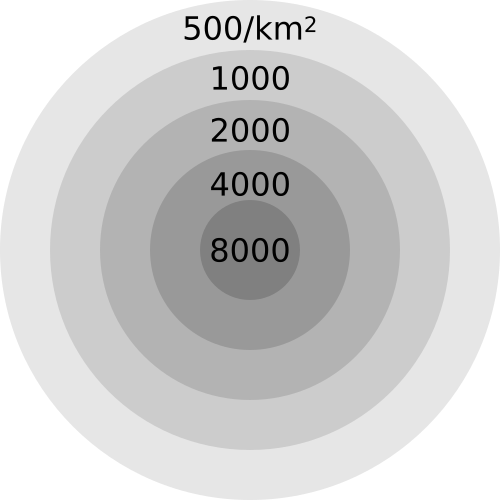
The average density of the city region is 1,660 people per square kilometer, and the weighted density is about 3,400; both figures are typical for the denser American Sunbelt cities, like Los Angeles, San Diego, Miami, and Las Vegas (see table as of 2000 here).
Let us assume that the amount of v-km per inhabitant within each concentric circle is proportional to the outer radius of the circle, so people in the outermost ring drive 5 times as long as those in the inner circle. For concrete numbers, let us assume these figures are 5,000, 10,000, 15,000, 20,000, and 25,000 v-km per year; they average about 13,550 v-km/capita, which is somewhat less than the US average, just below 16,000 per FRED. Note that the outermost ring has 10.8% of the city’s population and 20% of its v-km.
If the modeled density is close to optimal for congestion management given the current state of public transit, then adding transit means subtracting people from the outer ring, not from the inner rings. Say the city builds rapid transit reaching the inner two rings, allowing these areas to densify by exactly 22.5%, which is the ratio of the outer ring’s population to the inner two’s total’s. The total non-auto mode share will rise by 10.8 percentage points, divided between public transit and walking because people in dense, walkable neighborhoods have the option of non-motorized transport; but v-km and the attending greenhouse gas emissions will fall 20%.
If the city keeps growing, the situation is even more extreme. We can add a sixth ring, on the same model, with a density of 250 people per km^2, 30,000 annual v-km per capita, and population equal to 6.6% of the total of the five existing rings or 6.2% of the six-ring total. This 6.6% increase in population raises v-km by 14.7%; in contrast, a transit system capable of supporting this population increase would show an increase of 6.2 points in the non-auto mode share even while avoiding a 14.7% increase in car traffic.
European car usage
We can obtain total v-km per capita by country from a table of traffic accident fatalities: the OECD reports numbers per capita and per v-km, so if we go to PDF-p. 60 of its report, divide the per-capita figure by the per-v-km figure, and multiply by a scaling factor of 10,000, we get v-km per capita. In the US, this figure is just short of 16,000, just as in the FRED graph. The US’s transit mode share for work trips is 5%, so this is about as close as possible to a purely auto-oriented country.
In the Western European countries for which there’s data, including France and Germany, the figure is just short of 10,000. This is close to INSEE’s figure of 756 billion passenger-km in 2016, the difference accounted for by the fact that sometimes multiple people ride in the same car.
The reason people here travel 40% less by car than in the US is not that they instead travel the same distance by public transit. INSEE reports 132 billion passenger-km in buses, trams, and trains excluding TGVs in 2016, and this includes a fair amount of intercity bus and rail travel (9 billion p-km on intercity rail as of 2010 per p. 53 here). Overall, the French modal split is 70% car, 15% transit, 6.7% walk, 4.3% work from home, 4% bike and motorcycle. The American one is 85% car, 5% transit, 2.7% walk, 5.2% work from home. Even relative to the volume of car commuters, the Americans drive 40% further than the French.
Much of my understanding of how provincial France works comes from the Riviera. The Riviera is not the best representative: Alpes-Maritimes is among the richest departments outside Ile-de-France, is among the most conservative, and near-ties Toulouse’s Haute-Garonne and Strasbourg’s Bas-Rhin for third highest provincial transit mode share (13%, behind Rhone’s 23% and Bouches-du-Rhone’s 14%). But it’s a good representative nonetheless of a major provincial city region. There, the coastal towns as well as some interior ones are filled with sprawl, even going up the mountains. There is density in Monaco and Nice, and public transit ridership mostly consists primarily of people who live in Nice and secondarily of people who commute to Monaco. It’s the tramway, the buses, and the general walkability that permit Nice to be what it is, coexisting alongside the offices parks of Sophia-Antipolis and the low-density sprawl up the mountains.
What about zoning?
Devin’s paper is about the economic cost of zoning. Even with the assumption of no change in built form or in transportation modal choice, it does find welfare gains from upzoning, saying that high-demand areas would gain 10-15% in population. This implies that realizing the full environmental gains from public transit requires upzoning areas near stations, to permit the inner two rings in my model city to gain residents who would have otherwise populated a sixth ring.
And yet, the appropriate zoning to some extent already exists. California abolished single-family zoning in 2016 and 2017: accessory dwelling units, or ADUs, are permitted anywhere that residential development is permitted, and homeowners are free to build ADUs in their backyards or carve out ADUs out of their existing buildings. Moreover, in select zones, cities have encouraged transit-oriented development through upzoning or relaxing parking minimums: San Francisco’s TDM process abolished parking minimums anywhere that buildings with at least 10 apartments are permitted, and San Diego slashed parking minimums in an attempt to encourage TOD in North Park along the University Avenue corridor.
The results of TDM in San Francisco are still unclear – the program passed too recently. The same is true of ADUs – existing homeowners react slowly, and new developers may build more two-family houses and fewer single-family houses, but new tract housing would go in the exurbs, not in the coastal cities. But in San Diego the results are clear: developers build more parking than the required minimum at University and 30th, because the public transit option there is a north-south bus that comes every 15 minutes and an east-west bus that comes every 10, which is not actually enough to persuade people who can afford a car not to drive one.
Conclusion
It is difficult to build TOD without public transport. The urban middle class of the 21st century expects travel convenience, which can come in the form of a large rapid transit network or in that of cars and freeways. Thus, even when development sites are available, even in expensive cities, developers sometimes build less than they are allowed to, or insist on more parking than is required, if alternative transportation is inadequate.
The upshot is that adding the layer of transit is likely to stimulate development in the affected urban neighborhoods. The people who would live in this development would not otherwise drive to the outer margin of the city to save on rent, but they would still drive, displacing people would then drive further. The exact details of the churn matter less than the net impact, which is that absent urban transit, cities end up sprawling farther out, forcing people to drive ever-longer distances to work and to other destinations.
A city that succeeds in replacing half of its car trips by public transit, such as Paris, will end up replacing far more than just half of its vehicle-km by transit. Even if the trains are densest within the city core, as is the case even in Paris and other cities with expansive regional rail, the net impact of the transit network is reduction in car travel in the outer parts of the built-up area, where distances are the longest. Planetoscope’s figures for car travel and average distance in Ile-de-France point to a total of just 2,900 v-km/capita in this region – less than one third the national average, and barely one half the national average per car commuter.
The benefit of transit thus goes well beyond the people who use it. The car trips it displaces, even if indirectly, are the ones that cause the worst problems – congestion, pollution, car accidents, greenhouse gas emissions – because they are the longest. Building urban rapid transit can have twice the direct mitigating effect on the harms of car travel as might appear based purely on counting mode choice. With twice the apparent positive environmental impact, mass transit must become a higher priority: nearly every new rapid transit line that’s judged as good must be a top priority for public investment, and many projects that appear marginal must be reevaluated and constructed as planned.

