Category: Urban Transit
Little Things That Matter: Bus Shelter
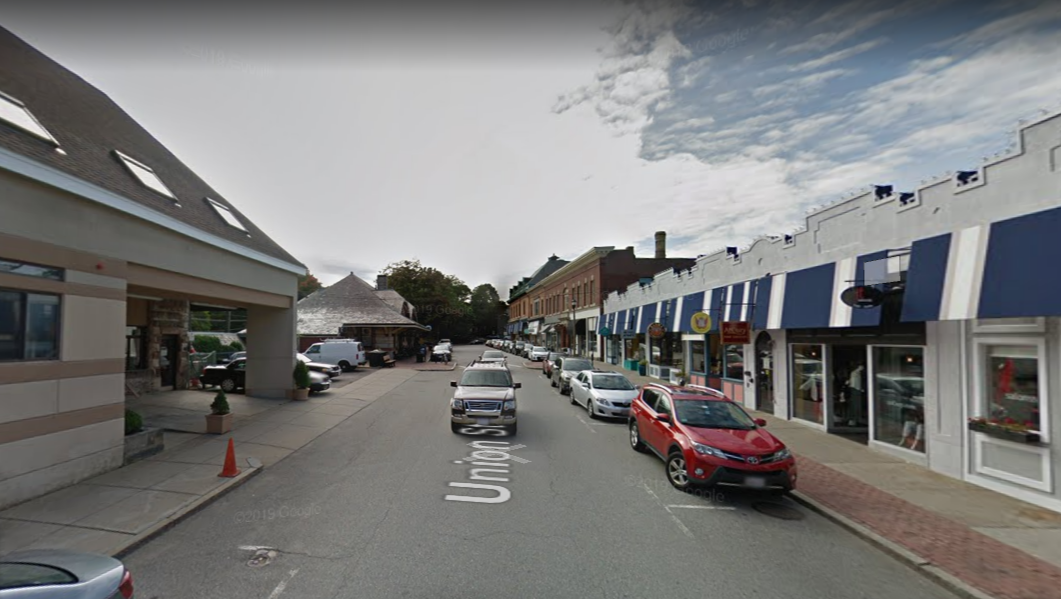
Many years ago, probably even before I started this blog, I visited family in Hamden, a suburb of New Haven. I took the bus from Union Station. When it was time to go back to New York, I timed myself to get to the bus that would make my train, but it rained really hard and there was no shelter. The time passed and as the bus didn’t come, I sought refuge from the rain under a ceiling overhang at a store just behind the bus stop, in full view of the road. A few minutes later, the bus went through the station at full speed, not even slowing down to see if anyone wanted to get on, and to get to my train I had to hitchhike, getting a ride from people who saw that I was a carless New Yorker.
Fast forward to 2018. My Brooklyn bus redesign plan with Eric Goldwyn calls for installing shelter everywhere, which I gather is a long-term plan for New York but one that the city outsourced to a private advertising firm, with little public oversight over how fast the process is to take. When I asked about the possibility of reducing costs by consolidating stops I was told there is no money for shelter, period. It was not a big priority for us in the plan so we didn’t have costs off-hand, but afterward I went to check and found just how cheap this is.
Streetsblog lists some costs in peripheral American cities, finding a range of $6,000-12,000 per stop for shelter. Here‘s an example from Florida for $10,000 including a bench. In Providence I asked and was told “$10,000-20,000.” In Southern California a recent installation cost $33,000 apiece. I can’t find European costs for new installation, but in London replacing an existing shelter with a new one is £5,700, or $8,000.
So let’s say the costs are even somewhat on the high American side, $15,000. What are the benefits?
I’ve found one paper on the subject, by Yingling Fan, Andrew Guthrie, and David Levinson, entitled Perception of Waiting Time at Transit Stops and Stations. The key graph is reproduced below:
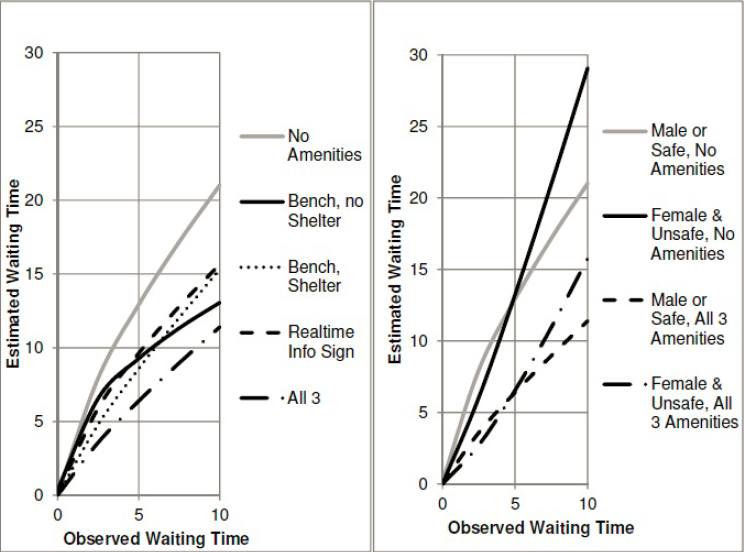
The gender breakdown comes from the fact that in unsafe neighborhoods, women perceive waits as even longer than the usual penalty, whereas in safe ones there is no difference between women and men.
The upshot is that if the wait time is 10 minutes, then passengers at a stop with a bench and shelter perceive the wait as 15 minutes, and if there’s also real-time information then this shrinks to 11 minutes. If there are no amenities, then passengers perceive a 15-minute wait when they’ve waited just 6.5 minutes and an 11-minute wait when they’ve waited just 4. In other words, to estimate the impact of shelter we can look at the impact of reducing waits from 10 minutes to 6.5, and if there’s also real-time info then it’s like reducing waits to 4 minutes.
If the wait is 5 minutes then the impact is similar. With bench and shelter the perceived wait is 8.5 minutes, equivalent to a 3-minute wait without any amenities; with real-time information, the perceived wait is 6.5 minutes, equivalent to a 2-minute wait without amenities. There is some scale-dependence, but not too much, so we can model the impact of shelter as equivalent to that of increasing frequency from every 10 minutes to every 6.5 minutes (without real-time displays) or every 4 minutes (with real-time displays).
I have some lit review of ridership-frequency elasticity here. On frequent buses it is about 0.4, but this is based on the assumption that frequency is 7.5-12 minutes, not 4-6 minutes. At the low end this is perhaps just 0.3, the lowest found in the literature I’ve seen. To avoid too much extrapolation, let’s take the elasticity to be 0.3. Fan-Guthrie-Levinson suggests shelter alone is equivalent to a 50-66% increase in frequency, say 60%; thus, it should raise ridership by 15%. With real-time info, make this increase 30%.
What I think of as the upper limit to acceptable cost of capital construction for rail is $40,000-50,000 per weekday rider; this is based on what makes activists in Paris groan and not on first principles. But we can try to derive an equivalent figure for buses. On the one hand, we should not accept such high costs for bus projects, since buses have higher operating expenses than rail. But this is not relevant to shelter, since it doesn’t increase bus expenses (which are mostly driver labor) and can fund its ongoing maintenance from ads. On the other hand, a $40,000/rider rail project costs somewhat more per new rider – there’s usually some cannibalization from buses and other trains.
But taking $40,000/rider as a given, it follows that a bus stop should be provided with shelter if it has at least ($15,000/$40,000)/0.15 = 2.5 weekday boardings. If the shelter installation includes real-time info then the denominator grows to 0.3 and the result falls to 1.25 weekday boardings.
In New York, there are 13,000 bus stops, so on average there are around 180 boardings per stop. Even in Rhode Island, where apparently the standard is that a bus stop gets shelter at 50 boardings (and thus there is very little shelter because apparently it’s more important to brand a downtown trunk as a frequent bus), there are 45,000 weekday riders and 3,000 stops, so at 15 riders per stop it should be fine too put up shelter everywhere.
The only type of stop where I can see an exception to this rule is alighting-only stops. If a route is only used in a peak direction, for example toward city center or away from city center, then the outbound stops may be consistently less used to the point of not justifying shelter. But even that notion is suspicious, as American cities with low transit usage tend to have weak centers and a lot of job and retail sprawl. It’s likely that a large majority of bus stops in Rhode Island and all stops within Providence proper pass the 2.5 boardings rule, and it’s almost guaranteed that all pass the 1.25 boardings rule. And that’s even before consolidating stops, which should be done to improve bus speed either way.
At least based on the estimates I’ve found, installing bus shelter everywhere is a low-hanging fruit in cities where this is not already done. In the situation of New York, this is equivalent to spending around $550 per new weekday rider on transit – maybe somewhat more if the busier stops already have shelter, but not too much more (and actually less if there’s stop consolidation, which there should be). Even in that of Providence, the spending is equivalent to about $6,600 per rider without stop consolidation, or maybe $3,000 with, which is much better than anything the state will be able to come up with through the usual channels of capital expansion.
If it’s not done, the only reason for it is that transit agencies just don’t care. They think of buses as a mode of transportation of last resort, with a punishing user experience. Cities, states, and transit agencies can to a large extent decide what they have money for, and letting people sit and not get drenched is just not a high priority, hence the “we don’t have money” excuse. The bosses don’t use the buses they’re managing and think of shelter as a luxury they can’t afford, never mind what published transportation research on this question says.
Prudence Theater
The phrase security theater refers to the elaborate selling of airport security to the public through humiliating spectacle, like making people take off their shoes, with no safety value whatsoever. By the same token, prudence theater is the same kind of ritual of humiliating people, often workers, in the name of not wasting money. Managers who engage in prudence theater will refuse pay hikes and lose the best employees in the process, institute hiring freezes at understaffed departments and wonder why things aren’t working, and refuse long-term investments that look big even if they have limited risk and high returns. This approach is endemic to authoritarian managers who do not understand the business they are running – such as a number of do-nothing political leaders who make decisions regarding public transit.
I’ve talked a bunch about this issue in the context of capital investment, for example Massachusetts’ Charlie Baker, California’s Gavin Newsom, New Jersey’s Chris Christie, and New York‘s Andrew Cuomo, using phrases such as “Chainsaw Al” and “do-nothing.” But here I want to talk specifically about operations, because there is an insidious kind of prudence theater there: the hiring freeze. The MBTA and MTA both have hiring freezes, though thankfully New York is a little more flexible about it.
Both New York and Boston have very high operating costs, for both subways and buses. They have extensive overstaffing in general, but that does not extend to overstaffing at every department. On the contrary, some departments are understaffed. Adam Rahbee told me a year and a half ago that subway operations planning in New York was short on workers, in contrast to the overstaffed department he saw in London. Of course London on average has much lower costs than New York, but individual departments can still be short on manpower even in otherwise-overstaffed cities. If anything, leaving one department understaffed can cause inefficiencies at adjacent departments, making them in effect overstaffed relative to the amount of service they can offer.
Bus dispatching
Buses require active supervision by a centralized control center that helps drivers stay on schedule. New York currently has 20 dispatchers but is planning an increase to 59, in tandem with using new technology. Boston has 5 at any given time, and needs to staff up to 15, which involves increasing hiring to about 40 full-time workers and doing minor rearrangement of office space to give them a place to work. With too few dispatchers, drivers end up going off-schedule, leading to familiar bunching, wasting hundreds of bus drivers’ work in order to save money on a few tens of supervisors.
I went over the issue of bus bunching in a post from last summer, but for the benefit of non-technical readers, here is a diagram that explains in essence what the problem of chaos is:

The marble on top of the curve is unlikely to stay where it is for a long time, because any small disturbance will send it sliding down one side or the other. Moreover, it’s impossible to predict in advance which direction the marble will land in, because a disturbance too small to see will compound to a big one over time.
Chaotic systems like this are ubiquitous: weather is a chaotic system, which is why it’s not possible to predict it for more than about two weeks in advance – small changes compound in unexpected directions. Unfortunately, bus service is a chaotic system too. For the bus to be on schedule is an unstable equilibrium. If the bus runs just a little behind, then it will have to pick up more passengers on its way, as passengers who would have just missed the bus will instead just make it. Those extra passengers will take some extra time to board, putting the bus even further behind, until the bus behind it finally catches it and the two buses leapfrog each other in a platoon.
There are ways to mitigate this problem, including dedicated bus lanes and off-board fare collection. But they do not eliminate it – they merely slow it down, increasing the time it takes for a bus to bunch.
The connection between dispatching and chaotic bus schedules may not be apparent, but it is real. The transportation engineering academic community has had to deal with the question of how to keep buses on schedule; here, here, and here are three recent examples. The only real way to keep buses on schedule is through active control – that is, dispatching. A dispatcher can tell a driver that the bus is too far ahead and needs to slow down, or that it is behind and the driver should attempt to speed up. If the traffic light system is designed for it, the dispatcher can also make sure a delayed bus will get more green lights to get back on track, a technology called conditional signal priority, or CSP. This contrasts with unconditional transit signal priority, or TSP, which speeds up buses but does not preferentially keep them evenly spaced to prevent bunching.
Moreover, some of the people who have done academic work on this topic have gone on to work in the transit industry, whether for the MBTA (such as David Maltzan and Joshua Fabian) or for thinktanks or private companies (such as Chris Pangilinan). Specific strategies to keep the buses on track include CSP giving delayed buses more green lights, holding buses at the terminal so that they leave evenly spaced, and in some cases even holding at mid-route control points. Left to their own devices, buses will bunch, requiring constant correction by a competent dispatching department with all the tools of better data for detection of where bunching may occur as well as control over the city’s streetlights.
Managers’ point view vs. passengers’ point of view
When I talk to transit riders about their experiences, I universally hear complaints. The question is just a matter of what they complain about. In suburban Paris people complain plenty about the RER, talking about crowding and about how the system isn’t as frequent or reliable as the Metro. These are real issues and indicate what Ile-de-France Mobilités should be focusing its attention on.
Americans in cities with public transit talk about bunching. In New York I’ve routinely sighted platoons of two buses even on very short routes, where such problems should never occur, like the 3 kilometer long M86. A regular rail user who talked to me a few months ago mentioned three-bus platoons in Brooklyn on a route that has a nominal frequency of about 10 minutes.
From the perspective of the transit operator or the taxpayer, if buses are scheduled to arrive every ten minutes, that’s an expenditure of six buses per hour. From that of the rider, if the buses in fact come in platoons of two due to bunching, then the effective frequency is 20 minutes, and most likely the bus they ride on will be the more crowded one as well. What looks like a service improvement to managers who never take the system they’re running may offer no relief to the customers on the ground.
I wish my mockery of transit managers who don’t use their own system were facetious, but it’s not. In New York, some of the more senior managers look at NYCT chief Andy Byford askance for not owning a car and instead using the subway to get to places. Planner job postings at North American transit agencies routinely require a driver’s license and say that driving around the city is part of the job. Ignorant of both the science of chaos and the situation on the ground, the managers and politicians miss low-hanging fruits while waxing poetic about the need to save money.
Is anything being done?
In New York there are some positive signs, such as the increase in the number of dispatchers. The warm reception Eric Goldwyn and I got from some specific people at the MTA is a good sign as well. The problem remains political obstruction by a governor and mayor who don’t know or care to know about good practices. Cuomo’s constant sidelining of Byford has turned into a spectacle among New York transit journalists.
In Boston, the answer is entirely negative. Last week’s draft of the Focus40 plan, released by the MBTA’s Fiscal Management and Control Board (FMCB), unfortunately entirely omits dispatching and operational supervision from its scope. It includes a variety of investments for the future, some of which are welcome, such as the Red-Blue Connector. But it reduces the issue of bus timetable keeping to a brief note in the customer experience section that mentions “Computer Aided Dispatch / Automatic Vehicle Location technology.” Good data is not a bad thing, but it is not everything. Warm bodies are required to act on this data.
Thus prudence theater continues. Massachusetts will talk about reform before revenue and about spending money wisely, but it is run by people with little knowledge of public transportation and no interest in acquiring said knowledge. Its approach to very real issues of high costs is to cut, even when there are parts of the system that are underfunded and undermanned. Staffing up to 15 dispatchers at a time, raising the headcount to about 40 full-time workers, would have the same effect on ridership as literally hundreds of bus drivers through better control. Will the administration listen? As usual, I hope for the best but have learned to expect the worst.
Battery-Electric Buses: New Flyer
Two months ago, after my article about battery-electric buses appeared in CityLab, New Flyer reached out to me for an interview. Already in one of the interviews I’d done for the article, I heard second-hand that New Flyer was more reasonable than Proterra and BYD and was aware of the problem of battery drain in cold weather. I spoke to the company’s director of sustainable transportation, the mechanical engineer David Warren, and this confirmed what I’d been told.
Most incredibly, I learned at the interview that the headline figures used in the US for electric bus performance explicitly exclude heating needs. The tests are done at the Altoona site and only look at electricity consumption for propulsion, not heating. New Flyer says that it is aware of this issue and has tried not to overpromise, but evidently Proterra and BYD both overpromise, and regardless of what any vendor says, American cities have bought into the hype. In Duluth this was only resolved with fuel-fired heaters; the buses only use electricity for propulsion, which is not the majority of their energy consumption in winter.
Warren and I discussed New York specifically, as it has a trial there on the M42. The heater there puts out 22 kW of energy at the peak, but on the day we discussed, January 29th, when the air temperature was about -7*, actual consumption was on average about 10 kW. Electricity consumption split as 40% heating, 20% propulsion, and 40% other things, such as the kneeling system for easier boarding.
The battery can last many roundtrips on the M42, specifically a very slow route. Electric vehicles tend to do much better then fuel-powered ones at low speed in city traffic, because of regenerative braking and higher efficiency. When I discussed the Proterra trial with MVTA, I was told specifically that the buses did really well on days when the temperature was above freezing, since the battery barely drained while the bus was sitting in rush hour Downtown Minneapolis traffic. This pattern is really a more extreme version of one that may be familiar to people who have compared fuel economy ratings for hybrid and conventional cars: hybrids are more fuel-efficient in city driving than on the highway, the opposite of a non-hybrid, because their electric acceleration and deceleration cycles allow them some of that regeneration.
The current system is called OppCharge (“opportunity charging”), and currently requires the bus to spend 6 minutes out of every hour idling for recharge; the Xcelsior presentation shows a bus with a raised pantograph at a charging station, and I wonder whether it can be extended to an appropriate length of wire to enable in-motion charging.
The New Flyer examples I have seen are in large cities – New York and Vancouver. New York’s system for opportunity charging does not require an attendant; Vancouver’s may or may not, but either way the charging is at a bus depot, where the logistics are simpler. In contrast, in Albuquerque the need for midday charging was a deal breaker. When I talked to someone who knew the situation of Albuquerque’s BRT line, ART, I was told that the BYD midday charge system would require an attendant as well as room for a charging depot. Perhaps an alternative system could get rid of the attendant, but the land for a bus that at the end of the day isn’t that busy has nontrivial cost even in Albuquerque.
Even with opportunity charging, batteries remain hefty. Warren said that they weigh nearly 4 tons per standard-length bus; the XE40 weighs 14 metric tons, compared with 11.3 for the older diesel XD40 platform. Specifically on a short, high-ridership density like the M42 and many other New York buses, there is likely to be a case for installing trolleywire and using in-motion charging. In-motion charging doesn’t work well with grids, since it is ideally suited to when several branches interline to a long trunk route that can be electrified, but ultimately it’s a bus network with ridership density comparable to that of some big American light rail networks like Portland’s.
*In case it’s unclear to irregular readers, I exclusively use metric units unless I mention otherwise, so this is -7 Celsius and not -7 Fahrenheit; the latter temperature would presumably drain the battery a lot faster.
Quick Note: the Importance of Long-Term Planning
Last week, Strong Towns ran a piece complaining about what it calls “go big or go home” transit. Per Strong Towns’ Daniel Herriges, rail expansion takes 20 years and reflects an obsession with megaprojects, so it’s better to look at small things. Strong Towns’ take is as follows:
“After 20 years of planning, the North Carolina Research Triangle’s signature transit project is fighting for its life.”
Boy. If this sentence doesn’t perfectly capture the folly of our megaproject-obsessed transit paradigm, we don’t know what does.
Here’s a better idea: Ask transit riders in Durham and Chapel Hill what’s the next, small step you could take that would improve their commutes *this* year. Then do it. Then next year, ask the same question. There are so many pressing needs going unmet while our cities focus on shaky silver-bullet efforts like this one; what do we have to lose?
It’s a perfect encapsulation of what is wrong with more traditionalist attitudes toward urbanism and green transport, and I want to explain why.
Short-term thinking – “what could improve this year” – does not scale. The Strong Towns article talks about scalability as a reason to improve bus service and add sidewalks rather than adding urban rail, but the reality is the exact opposite. Incrementalism works in cities that have 35% transit mode share and want to go up to 50% – and since, in the first world, all of these cities have rapid transit systems, getting to 50% means building more lines, as is happening in Paris and Berlin and London and Stockholm and Vienna and Copenhagen, and the last three don’t even have that many more people than the Research Triangle, where the rail link in question is to be built.
The Research Triangle does not have 35% transit mode share. For work trips the share in the Durham-Raleigh combined statistical area is 1.4%. All the things that year-by-year incremental progress does do not work, because improving the bus network increases ridership in relative numbers to current traffic.
Strong Towns understands this, in a way. It uses the “what do we have to lose?” language. And yet, it recommends not doing anything of importance, because building big things means megaprojects. Megaprojects involve doing something that visibly involves the government, requires central planning, and is new to the region. They empower planners whose expertise comes from elsewhere, because the local knowledge in a 1.4% transit share region is 100% useless for offering transportation alternatives.
It’s a mentality that seems endemic to groups that romanticize midcentury small towns. Strong Towns literally names itself after the idea of the old small-town main street, in which cars exist but do not dominate, back before hypermarkets and motorway bypasses and office parks changed it all. It’s an idea that evokes nostalgia among people who grew up in cities like that or in suburbs that imitated them and dread among people who didn’t. And it’s completely dead, because it’s too small-scale for transit to work and too spread out for a developer to have any interest in reproducing it today.
Transit revival doesn’t look like the 1950s, and planning for it doesn’t involve the same social groups that dominated then. That era between World War Two and the counterculture was dominated by an elite consensus that built megaprojects, but the middle-class elements of said consensus were precisely the one that bolted to the anti-state New Right, with its ethos of mocking the idea of “I’m from the government and I’m here to help.”
In a metro area that wants to get from 1.4% transit share to a transit share that’s not a rounding error, a few things need to happen, and none of them will make nostalgists happy. First, planning has to be for the long term. “What can be done this year?” means nothing. Second, extensive redevelopment is required, and it can’t be incremental. If you want transit-oriented development, look at what Calgary did in city center and what Vancouver did around suburban stations like Metrotown and Edmonds and do it in your Sunbelt American city. Third, wider sidewalks are cool and so is more bus service, but in a spread-out region, interurban rail is a must, and this means big projects with an obtrusive government and a public planning process. And fourth, people will complain because not everything is a win-win, and the government will need to either ignore those people (if they’re committee meeting whiners) or break them (if they’re Duke, which is opposing the light rail line on NIMBY grounds).
American transit reformers tend not to know much about good practices, but many are interested in learning. But then there are the ones who cling to traditional railroading, mixed-traffic heritage streetcars, village main streets, or really anything that lets them portray the car as an outside enemy of Real America rather than its apex with which it annihilated groups it deemed too deviant. It’s an attractive mythology, playing to a lot of powerful notions of community. It’s also how American cities got to be the car-choked horrors that they are today, rather than how they will turn into something better.
The Boundary Between the Transit City and Auto-Oriented Suburbia
Public transportation use is higher in cities than in suburbs. Cities with stronger transit networks have larger transit-rich, auto-hostile cores, and some have good transit in lower-density suburbs, but ultimately the transit city has a limited radius, beyond which automobiles dominate. Successful examples of suburban transit, like Zurich, just keep the city-suburb gradient shallower than in other transit cities.
The most fascinating aspect of this is the boundary between the transit-oriented city and the auto-oriented suburbs. Uniquely in the metro area, the boundary region has good access by car as well as by transit, making it ideal for uses that want to interface with both modes of transportation. This specifically includes bus stations, stadiums, and big box retail, as well as more sporadic meeting points between urban and suburban residents.
Where the boundary is
Because the boundary zone is defined by good transit as well as highway access, it may not be the literal boundary as defined by modal split, car ownership, or any other metric of transportation usage. It can be the outer end of some rail line extending into the suburbs, and in that case it may be a salient into auto-oriented territory. There are a number of examples in the United States, where the postwar rapid transit projects have not been accompanied by much transit-oriented development, and thus their outer stations are in low-density suburbs where transit service functions as expensive S-Bahns. BART and most of the Washington Metro are like this, as are the suburban lines of the Boston subway.
For example, here is Newton Centre, on the Green Line D branch:
The light rail station is just to the left (south) of the street. This is a walkable suburban street with a train that comes pretty frequently all day, and yet the dominant mode of transportation here is clearly cars, as one can see in the parking lot to the left. Transit usage here is similar to the metro area’s average – Newton averages 11.9%, the Boston metro area 13.4% – but this says more about the rest of metro Boston than about Newton Centre. Nonetheless, such a location is convenient to access from the city if one lives near the Green Line, and is also reasonable convenient by car, as it is just 4 km from the freeway, and the majority of the distance is along the fast arterial that is Route 9.
The importance of highway access also works in reverse. In cities with strong transit networks and weak motorway network, there may be a freeway salient into the city, creating a zone that is car-friendlier than the rest. If it also has ample parking, which it usually does, then it will end up creating a boundary within an area that is on most metrics transit-oriented.
In London, the urban renewal zones around Stratford and Canary Wharf are examples – the city is unusually poor in freeway infrastructure, but two of the few radial motorways hit these two business districts. Here is Stratford:

The built-up density is high, and Stratford is one of the busiest Underground stations. But the roads are big for the city they’re in and there are large surface parking lots all over.
I’m deliberately including two examples with very different urban layouts and actual transit usage levels to hammer home the point that the boundary is defined merely by the existence of supportive infrastructure for both cars and public transit.
Can the entire city be friendly to both cars and public transit?
No.
There are several reasons for this. The first and most fundamental is that public transit is only successful if it can leverage scale. The adage frequency is freedom comes from this fact, but the same can be said about related issues of span, reach, and network effects. This is why frequency-ridership spirals are so dangerous – a small cut in service can lead to a much greater reduction in ridership.
The second reason is that drivers prefer a different urban layout from transit users, cyclists, and pedestrians. Cars are space-intensive on the road as well as on the parking lot, but can achieve high average speed if there’s no traffic, so they end up preferring spread-out development. Public and active transport are space-efficient but involve a lot of slow walking, so they prefer dense development at distinguished nodes with train stations, featuring strong commercial city centers with high job concentration. The boundary zone I speak of must be underlain by a strong enough transit network in the city core that people will fill the trains at all hours of day.
Concretely, neither the example of Newton nor that of Stratford can work citywide. Newton cannot work citywide because if every residential metro station is a parking lot, then nobody will ride the trains off-peak, and the city will de facto be exclusively auto-oriented as a result. Two years ago I compared the proportion of boardings at suburban stations that occur in the morning peak in New York (67% LIRR, 69% Metro-North) and Paris (46% on the SNCF network). Well, I would later find data for the Washington Metro, which has high off-peak frequency like the RER but low-density parking lot stations like the LIRR and Metro-North, and the proportion of riders in the morning peak is much closer to that of the LIRR than to that of the RER.
Likewise, Stratford can’t work citywide, because most of the city is not a reclaimed railyard with enormous space for all manners of new development. Building the expansive motorway network that would allow cars to rapidly reach every part of the city would normally require extensive neighborhood demolitions; American cities only managed to do so because to the road builders, destroying working-class (and often black) neighborhoods was a feature rather than a bug. Building a new city with ample road infrastructure is possible without this history, but then one gets Houston, hardly an example of good transit accessibility.
Land use at the boundary
The boundary zone’s unique accessibility by both cars and transit makes it ideally suited for land use that really wants both. Such land use has to have the following features:
- It needs to have a large regional draw, or else distinct neighborhood centers, some transit-oriented and some car-oriented, can do better.
- It needs to specifically benefit from good highway access, for example for deliveries, but also from good transit access.
- It is not so high-value that city center’s better transit access in multiple directions trumps access by transit in one direction and by cars in another.
Sporadic meetings satisfy all three criteria. For one personal example, in 2013 I visited New York and participated in a LARP taking place in a camp somewhere in Massachusetts, accessible only by car; I traveled with friends in the suburbs and we arranged that they would pick me up at Southeast, the northern end of the Metro-North Harlem Line’s electrification, so chosen because of its excellent multidirectional freeway access.
I bring up LARPing because it’s such a small community that it has to draw regionwide – in the case of the one I went to, participants came from all over Eastern New England and even beyond – and thus, anywhere with lower transit usage than New York, must appeal primarily to the driver, not the transit user. Nerdy conventions in general tend to either be enormous, like Comic-Con, or take place in cheap suburban edge city hotels, with meetings for carpools arranged at choice suburban train stations.
More common uses that like the boundary zones include major stadiums and big box retail. Stadiums appeal to a broad section of the population with little differentiation between city residents and suburbanites. They have to have good transit access even in auto-oriented American cities for reasons of capacity, but they also have to have good auto access for the use of drivers; stadiums are land-intensive enough that they can’t locate in city center at all, with its omnidirectional transit access, so instead they must be at the boundary zone. Thus Stratford hosts the London Stadium, the Stade de France is in Saint-Denis with good motorway as well as RER access, and Yankee Stadium is tucked at a corner of the Bronx with two subway lines and good expressway infrastructure.
Big box retail is more complicated – for one, its draw is so local that even a small city can support several Walmarts, Carrefours, and Aldis (Walmart is weak in big cities, but the big European retailers aren’t). Nonetheless, boundary zone stores exist: the big supermarket I’m most familiar with in Boston, Star Market at Porter, is on top of a subway station but also has a large parking lot, while the supermarket I shop at here in Berlin, Kaufland, is a two-story big box next to the Gesundbrunnen U- and S-Bahn station, with the ground floor devoted to parking.
I suspect the reason big box retail likes the boundary zone is that while it is local, there are extensive mixed areas rich in both drivers and non-drivers, where a big store must appeal to both in order to succeed. The Gesundbrunnen area is one of the city’s densest, but car ownership in Berlin is still higher than in Paris or New York. The same is true of the area around Porter Square in Cambridge and Somerville, albeit at lower density and with lower transit usage, so Star Market puts its parking on the surface rather than in a structure.
Bus station siting
The most interesting land use that prefers the boundary zone, and the origin of this post, is the intercity bus station. Here is Herbert in comments:
Can you do a post on the contradictory demands for the site of the main intercity bus station?
On the one hand, it is desirable that it is within easy reach from the highway. On the other hand it should be as close to downtown as possible and also easily reachable by public transit. And last but not least there should of possible be one interchange station for every city for connecting passengers.
It’s almost impossible to find a site that goes all requirements. Berlin ZOB certainly doesn’t…
Whereas train stations have obvious preferred sites – the central business district – bus stations have to balance centrality with highway access. In Paris, this is Gallieni. This station is just outside the city at the end of Metro Line 3, where the Boulevard Peripherique meets the A3 autoroute, which connects to further motorways with good access to the north, south, and east. Like Stade de France, Gallieni is a salient of the auto-oriented suburbs almost into city limits, in inner suburbs with high public transit usage.
In New York, there are a few sites that would work fine, but each points in a different direction, making interchange difficult. Port Authority is excellent for buses going to New Jersey and points west and south, and curbside buses tend to pick up in that general area as well, often near Hudson Yards; this is facilitated by a unique situation in which the Lincoln Tunnel has a dedicated inbound bus lane in the morning peak, which many area transit activists wish existed in both directions all day. Buses to Boston could depart from Yankee Stadium, which also benefits from being just beyond the outer end of subway express service, so that travel speeds to Manhattan are faster. However, in practice they depart from the same curbside location on the Far West Side as the buses to Philadelphia and Washington, frustrating riders who see their bus spend an hour in city traffic.
The situation of New York is unusual in that it is located next to two wide rivers with few crossings, and thus does not have a proper orbital motorway with a location like Gallieni. But New York is not unique in having difficult bus station siting choices. London has the same problem: for one, the M25 orbital is so far out of the city; and perhaps more importantly, British buses are priced cheaper than trains in order to control crowding levels on trains to London, and thus dumping bus passengers on a regional train to Central London would be strictly worse than just letting them ride the train the entire way for a reasonable fare.
Stroads and Strails
In 2011, Chuck Marohn of Strong Towns coined the word stroad for a street that functions as a road. Chuck argues that there should be a separation between streets, which are destinations in and of themselves and are to be lined with walkable retail, and roads, which exist to move people between destinations. In contrast, auto-oriented arterials function as both: they are designed for high speed for through-traffic but also have extensive streetside destinations built at automobile scale, hence the portmanteau stroad.
In the last seven years this mentality has become quite popular within online urbanist circles. Unfortunately, it misses why major streets arise in the first place. Moreover, this is not just an issue for cars and car traffic – other modes of transportation want to funnel local and interregional traffic through the same corridors, creating a number of arteries that are in essence strails, like the Berlin S-Bahn. Good planning has to recognize that where people to go through and where people want to go to are often the same, and provide road and rail infrastructure of sufficient size to accommodate.
What is a street, anyway?
The main purpose of a city street is to connect destinations within the city. Major streets routinely form out of trails, post roads, and turnpikes connecting the city with villages that it swallows as it industrializes and grows. Broadway in New York started out as an Indian trail, the Strand grew as a road connecting London with Westminster and had previously been part of an intercity Roman road, Champs Elysees was built as a promenade into the periphery of Paris and gradually filled in with palaces, the Sveavägen/Götgatan axis goes back to the Early Modern era with connections from Stockholm to Roslag to the north and Götland in the south.
Not every street has this intercity or suburban history, but the important ones frequently do. The Manhattan grid was mapped as an entirely urban street network, but the wide north-south avenues were designed for easy access to the Lower Manhattan core from future residential areas. In ungridded cities, usually you can tell which streets are the oldest because they are longer, more continuous, and more commercially developed, and the exceptions come from heavyhanded state planning, like the shift from Rue Saint-Jacques to Boulevard Saint-Michel in Haussmannian Paris.
The importance of through-streets within cities continues even today, and even when cars are not too relevant. People who walk or take transit are likelier to do so on the main streets, and as a result, businesses prefer locating there. In Manhattan there’s even an expression for this: avenue rents versus street rents. In Vancouver, I could walk on any street, but crossing wasn’t any harder on the main streets than on the side streets, and there was more interesting stuff to look at on the main streets; even ignoring zoning, retail would prefer to locate on the main streets because that’s where all the other retail is. There’s a wealth of good restaurants I discovered just by walking next to them, to say nothing of the gaming store on 4th Avenue near MacDonald, which I saw from the bus to UBC.
All of this is magnified in cities that do not have consistent grids, like Paris, Berlin, and even Stockholm. In those cities, zoning does not micromanage use as much as in North America, and yet businesses locate on major streets where possible. Here is a map of the area I live in: the green dot is where I live, and the red dot is a government office I went to last week to register.
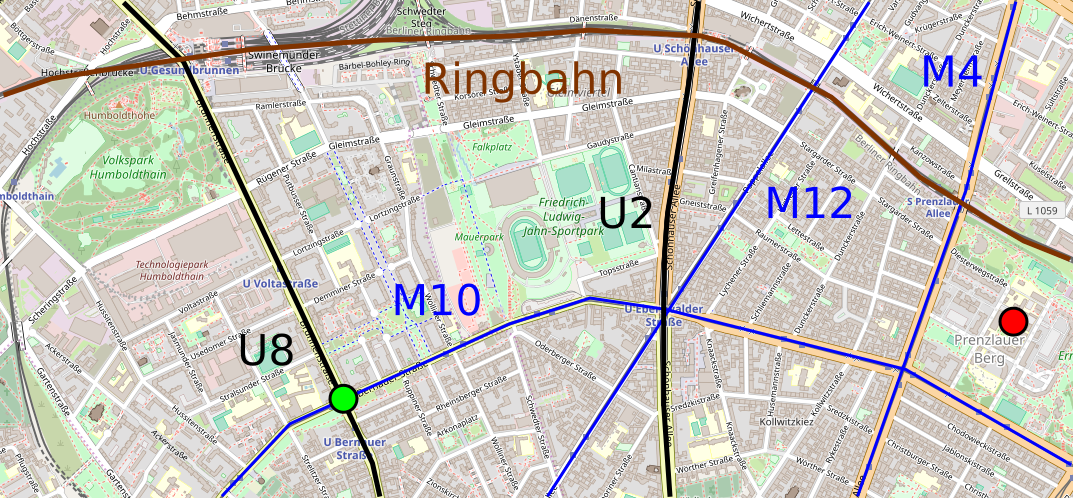
Walking east or west, I exclusively use Bernauer Strasse, the street the M10 tramway runs on; walking north or south, I use Brunnen Strasse, which hosts U8. Other streets can function as shortcuts, but with parks and small changes interrupting the grid, they’re less reliable for through-walking. And indeed, they are much quieter and largely residential, with retail mostly at street corners.
The invention of the stroad
The early American roads connected distinct cities, or linked cities with rural hinterlands. Within the cities, they fed preexisting arterial streets. For the most part these arterial streets were fairly wide – they were mapped in the 19th century based on 19th-century design standards, often 30 meters of width, rather than the narrow medieval streets London is famous for – but they still filled with cars fast. Two parking lanes and four moving lanes in a dense city with busy crossings aren’t much. American cities had traffic jams in the 1920s already.
My two go-to references about the history of American roadbuilding – Owen Gutfreund’s 20th-Century Sprawl, and Earl Swift’s The Big Roads – both explain what happened beginning in the 1920s: cities built bypasses. The idea was that the bypasses would segregate through-traffic from urban traffic, separating roads from streets properly.
This never happened. For the same reason preindustrial roads turned into busy streets, bypasses turned into busy auto-oriented streets. Retailers found that the best place to locate was where all the cars were. These bypasses became congested roads themselves, partly due to the induced auto-oriented development and partly due to general growth in car traffic volumes. This trend intensified after WW2, with the freeways leading another cycle of bypasses around congested urban roads becoming congested with urban traffic themselves. Wal-Mart and Carrefour invented the hypermarket in 1962-3, and in the 1960s office space began suburbanizing as well, since traffic conditions were better than in congested city centers.
This is not an obscure history, and Chuck is fully aware of it: among his complaints about stroads is that they reduce the tax base of the city by encouraging retail to decamp for the suburbs. He just fails to follow this through to the logical conclusion: the most intense demand for real estate is near the busiest through-routes. There is no real separation between the street and the road; the best you can do for walkability is run better public transit to the urban core and make sure the roads have street-facing retail rather than front parking lots.
Strails
The principle that the best place for local traffic is where long-distance traffic is is equally true of trains. An intermediate station on an intercity railway sited a convenient commute away from the city will soon fill with suburban travelers. The term commuter itself derives from the discounted commutation tickets American intercity railroads offered regular riders, starting in New York and Boston in the middle of the 19th century.
19th-century railways were not a complex system of branched lines dedicated to regional traffic. Such lines existed, for example the Ligne de Saint-Germain-en-Laye, now part of the RER A, but most of the lines continued onward to long-distance destinations, or had been built with the intention of continuing so. Look at this map of extant London-area railways by year of construction: there aren’t that many branches predating the Late Victorian era, and the branches that do exist tend to be reverse-branches in South London offering service to either a City station like Cannon Street or Blackfriars or a West End station like Victoria. The remainder are loop lines, built to offer four tracks’ worth of capacity on lines that had originally been built with only two, but then both routes filled with local traffic, making it harder to schedule express trains; for an example easily visible on the map, see the Lea Valley lines connecting to Cheshunt.
In contrast with the London loop lines, Prussian State Railways made sure to rebuild the Ringbahn and Stadtbahn to have adequate capacity, that is four tracks, two for local service and two for longer-distance service; the Ringbahn had initially been built with two tracks, but would be expanded to four in the 1880s and 90s. But even here, there are seams. German Wikipedia explains that the Stadtbahn had to take a less desirable route to avoid expensive takings on Leipziger Strasse, and has a winding route with S-curves between Alexanderplatz and Jannowitz Brücke. Moreover, some individual branches only have two tracks even if they are the best intercity routes: the S2 route is the most direct route to Dresden, but with two tracks, heavy local traffic, and only DC electrification, it cannot host intercity trains, and thus intercity trains to Dresden spend 20 minutes out of a 2-hour trip getting around this line.
Berlin at least has the good fortune that four tracks here are enough. Tokyo is so big and strongly-centered that it has ten tracks going south of Tokyo on the Tokaido Line and eight going north on the Tohoku Line, including four for local service, two for Shinkansen service, and two or four for medium-distance express regional trains. Widening railways to serve city centers is expensive, and only done when absolutely necessary, and yet JR East spent considerable money on widening the innermost Tohoku trunk from six to eight tracks.
Even high-speed rail can induce the same development effect as a freeway. It doesn’t have closely-spaced stations, but people might demand stations as a mitigation of construction impact and train noise. The Tohoku Shinkansen diverges from the Tohoku Main Line a few kilometers north of Tokyo, but the local communities demanded local service as well as a mitigation, and as a result Japan National Railways built a four-track line, with two Shinkansen tracks and two local tracks for the Saikyo Line.
Main streets want to be everything
Major streets are the best location for every destination and every mode of transportation. This extends beyond walking. Buses prefer wide streets optimized for higher traffic speed – and the few main streets that are not so optimized, such as the Manhattan crosstown streets (since traffic is optimized for north-south avenue throughput), have buses that win awards for how slow they are. Bicyclists prefer riding on major streets as well, which is why Copenhagen prioritizes bike infrastructure on major streets rather than on side streets – on side streets car traffic is so light and slow that mixed traffic is not so bad, but the desirable through-routes remain the major streets.
The problem is that every mode of transportation requires some piece of the street, whereas street width is finite. Brunnen Strasse is 40 meters wide, and hosts very wide sidewalks including a dedicated path for on-sidewalk cycling, a combination of parallel and angled parking, two moving lanes in each direction, and a generous road median. Even that width does not include dedicated public transit infrastructure: U8 runs underneath the street, leaving the street’s width for sidewalks and roadways.
The same situation occurs on railroads: all uses want the same piece of infrastructure, leading to the usual problems of mixing trains of different speed classes on the same tracks. Freight bypasses are possible, but passenger bypasses are rare – train passengers tend to want to go to the city rather than to some suburb, and unlike cars, trains have prescribed stop patterns. By rail as by road, bigger infrastructure is needed: four tracks for a mixed local and interregional railway, or about 36-40 meters or even more on a main street.
Wide enough streets don’t exist everywhere. New England streets are narrow. Midwestern streets are wider, but at least the one I’m most familiar with, Ann Arbor’s Washtenaw Avenue, is only around 25 meters wide – it only gets up to 40 if one includes setbacks. Road widening would be needed, which is exactly the opposite of what the Strong Towns approach prescribes. Cities this small could mix decent local and intercity rail service on two tracks with timed overtakes, but that would require them to run any passenger rail service to begin with, and to make sure to have enough development near the stations, both residential and commercial, that people would ride the trains.
But on a 30-meter wide street, something has to give. There simply is not enough room for everything. Give pedestrians their 4 or 5 meters of sidewalk in each direction, cyclists their 2 meters of bike lane, and cars their parking lane and two moving lanes, and you’re already at 30-32 meters. You can go with complete streets and reduce the extent of car infrastructure, for example by turning a moving lane per direction into a bus or tram lane, or by getting rid of street parking, but unless you’re in a city with high transit mode share, you’re driving away eyeballs from retailers. Paris can definitely do it, New York and Berlin can do it, even Boston can do it. Can a small American city where planners aspire to run a handful of buses every 15 minutes do it? Probably not.
Corey Johnson’s Report on City Control of the Subway
Yesterday, New York City Council speaker and frontrunner in the 2021 mayoral race Corey Johnson released a document outlining his plan to seek city control of the subway and buses. In addition to the governance questions involved in splitting the state-run MTA between a city-owned urban transit agency and state- or suburb-owned commuter rail, it talks about what Johnson intends to do to improve public transit, befitting a mayor in full control of subway and bus operations. There are a lot of excellent ideas there, but also some not so good ones and some that require further work or further analysis to be made good.
Governance
Johnson proposes to spin the urban parts of the MTA into a new agency, called BAT, or Big Apple Transit. The rump-MTA will remain in control of suburban operations and keep MTA Capital Construction (p. 35), and there will be a shared headquarters. Some cooperation will remain, such as contributions toward cheaper in-city commuter rail fares, but there is no call for fully integrated fares and schedules: the recommendation “all trains and buses in the city will cost the same and transfers will be free” does not appear anywhere in the document.
Johnson also proposes that the BAT board will be required to live in the city and use transit regularly. There is a serious problem today with senior managers and board members driving everywhere, and the requirement is intended to end this practice. Cynically, I might suggest that this requirement sounds reasonable in 2019 but would have been unthinkable until the 2000s and remains so in other American cities, even though it would be far more useful there and then; the off-peak frequency-ridership spiral is nowhere nearly as bad in New York as it is in Washington or Boston.
One strong suggestion in this section involves appointing a mobility czar (p. 36), in charge of the NYC Department of Transportation as well as BAT. Given the importance of the subway, this czar would be in effect the new minister of transportation for the city, appointed by the mayor.
Ultimately, this section tends toward the weaker side, because of a problem visible elsewhere in the report: all of the recommendations are based on internal analysis, with little to no knowledge of global best practices. Berlin has city-controlled transit in full fare union with Deutsche Bahn-run mainline rail, but there has been no attempt to learn how this could be implemented in New York. The only person in New York who I’ve seen display any interest in this example is Streetsblog’s David Meyer, who asked me how DB and Berlin’s BVG share revenue under the common umbrella of the Berlin Transport Association (or VBB); I did not know and although I’ve reached out to a local source with questions, I could not get the answer by his filing deadline.
Finance and costs
This is by far the weakest section in the proposal. The MTA funds itself in large part by debt; Johnson highlights the problem of mounting debt service, but his recommendations are weak. He does not tell New Yorkers the hard truth that if they can’t afford service today then they can’t afford it at debt maturity either. He talks about the need to “address debt” but refrains from offering anything that might inconvenience a taxpayer, a rider, or an employee (pp. 42-43), and offers a melange of narrow funding sources that are designed for maximum economic distortion and minimum visible inconvenience.
In fact, he calls transit fares regressive (pp. 59, 61) and complains about century-long fare increases: real fares have risen by a factor of 2.1 since 1913 – but American GDP per capita has risen by a factor of 7.7, and operating costs have mostly risen in line with incomes.
He brings up ways to reduce costs. In operations these involve negotiations with the unions; even though the report mentions that drivers get paid half-time for hours they’re not working between the morning and afternoon peaks (“swing shift,” p. 48), it does not recommend increasing off-peak service in order to provide more mobility at low marginal cost. There is no mention of two-person crews on the subway or of the low train operator efficiency compared with peer cities – New York City Transit train operators average 556 revenue hours per year, Berlin U-Bahn operators average 829.
In capital construction the recommendations are a mixed bag of good and bad, taken from a not-great RPA report from a year ago. Like the RPA, Johnson recommends using more design-build, in flagrant violation of one of the rules set by global cost reduction leader Madrid. However, to his credit, Johnson zooms in on real problems with procurement and conflict resolution, including change orders (pp. 50-51), and mentions the problem of red tape as discussed in Brian Rosenthal’s article from the end of 2017. He suggests requiring that contractors qualify to bid, which is a pretty way of saying that contractors with a history of shoddy work should be blacklisted; I have heard the qualify-to-bid suggestion from some sporadic inside sources for years, alongside complaints that New York’s current bid-to-qualify system encourages either poor work or red tape discouraging good contractors. Unfortunately, there is no talk of awarding bids based on a combination of technical score and cost, rather than just cost.
Overall the talk of cost is better than what I’ve seen from other politicians, who either say nothing or use high costs as an excuse to do nothing. But it has a long way to go before it can become a blueprint for reducing subway construction costs, especially given the other things Johnson proposes elsewhere in the document.
Accessibility
Another mixed part of the document is the chapter about accessibility for people with disabilities. Johnson recounts the lack of elevators at most subway stations and the poor state of the bus network, featuring drivers who are often hostile to people in wheelchairs. However, while his analysis is solid, his recommendations aren’t.
First of all, he says nothing of the cost of installing elevators on the subway. An MTA press release from last year states the cost of making five stations accessible as $200 million, of $40 million per station. This figure contrasts with that of Madrid, where a non-transfer station costs about €5 million to equip with elevators, and a transfer station costs about €5 million per line served (source, PDF-pp. 11-12). In Berlin, which is not a cheap city for subway construction, the figure is even lower: about €2 million per line served, with a single elevator costing just €800,000.
And second, his proposal for finding money for station accessibility involves using the zoning code, forcing developers to pay for such upgrades. While this works in neighborhoods with ample redevelopment, not all city neighborhoods are desirable for developers right now, and there, money will have to come from elsewhere. For a document that stresses the importance of equality in planning, its proposals for how to scrounge funds can be remarkably inequitable.
That said, in a later section, Johnson does call for installing bus shelters (p. 74). A paper referenced in a TransitCenter report he references, by Yingling Fan, Andrew Guthrie, and David Levinson, finds that the presence of shelter, a bench, and real-time arrival information has a large effect on passengers’ perceived wait times: in the absence of all three amenities, passengers perceive wait time as 2-2.5 times as long as it actually is, rising to a factor of almost 3 for 10-minute waits among women in unsafe areas, but in the presence of all three, the factor drops to around 1.3, and only 1.6 for long waits for women in unsafe areas. Unfortunately, as this aspect is discussed in the bus improvement section, there is no discussion of the positive effect shelter has on people with disabilities that do not require the use of a wheelchair, such as chronic pain conditions.
I do appreciate that the speaker highlights the importance of accessibility and driver training – drivers often don’t even know how to operate a wheelchair lift (p. 63). But the solutions need to involve more than trying to find developers with enough of a profit margin to extract for elevators. Bus stops need shelter, benches, and ideally raised curbs, like the median Berlin tramway stations. And subway stations need elevators, and they need them at acceptable cost.
Bus improvements
By far this is the strongest part of the report. Johnson notes that bus ridership is falling, and recommends SBS as a low-cost solution. He does not stop at just making a skeletal light rail-like map of bus routes to be upgraded, unlike the Bloomberg and de Blasio administrations: he proposes sweeping citywide improvements. The call for bus shelter appears in this section as well.
But the speaker goes beyond calling for bus shelters. He wants to accelerate the installation of bus lanes to at least 48 km (i.e. 30 miles) every year, with camera enforcement and physically-separated median lanes. The effect of such a program would be substantial. As far as I can tell, with large error bars caused by large ranges of elasticity estimates in the literature, the benefits in Eric Goldwyn’s and my bus redesign break down as 30% stop consolidation (less than its 60% share of bus speedup since it does involve making people walk longer), 30% bus lanes, 30% network redesign, 10% off-board fare collection.
There is no mention of stop consolidation in the paper, but there is mention of route redesign, which Johnson wishes to implement in full by 2025. The MTA is in support of the redesign process, and allowing for integrated planning between NYCDOT and the MTA would improve the mutual support between bus schedules and the physical shape of the city’s major streets.
Moreover, the report calls for transit signal priority, installed at the rate of at least 1,000 intersections per year. This is very aggressive: even at the average block spacing along avenues, about 80 meters, this is 80 kilometers per year, and at that of streets, it rises to 200+ km. Within a few years, every intersection in the city would get TSP. The effects would be substantial, and the only reason Eric’s and my proposal does not list them is that they are hard to quantify. In fact, this may be the first time an entire grid would be equipped with TSP; some research may be required to decide how to prioritize bus/bus conflicts at major junctions, based on transportation research as well as control theory, since conditional TSP is the only way to truly eliminate bus bunching.
Reinforcing the point about dedicated lanes, the study calls for clawing back the space given to private parking and delivery. It explicitly calls for setting up truck routes and delivery zones in a later section (pp. 86-87); right now, the biggest complaint about bus lanes comes from loss of parking and the establishment of delivery zones in lieu of letting trucks stop anywhere on a block, and it is reassuring to see Johnson commit to prioritizing public transit users.
Livable streets
This is another strong section, proposing pedestrian plazas all over the city, an expansion of bike lanes to the tune of 80 km (50 miles) a year with an eye toward creating a connected citywide bike lane network, and more bike share.
If I have any criticism here, it’s that it isn’t really about city control of the MTA. The bus improvements section has the obvious tie-in to the fact that the buses are run by the MTA, and getting the MTA and NYCDOT on the same page would be useful. With bikes, I don’t quite understand the connection, beyond the fact that both are transportation.
That said, the actual targets seem solid. Disconnected bike lane networks are not really useful. I would never bike on the current network in New York; I do not have a death wish. I wasn’t even willing to bike in Paris. Berlin is looking more enticing, and if I moved to Amsterdam I might well get a bike.
Conclusion
The sections regarding costs require a lot of work. Overall, I get the impression that Johnson based his recommendations on what he’s seen in the local press, so the suggestions are internal to the city or occasionally domestic; the only international comparisons come from the RPA report or from Eric’s and my invocation of Barcelona’s bus redesign. This works for such questions as how to apportion the MTA’s debt service or how to redesign the bus network, but not so much for questions involving subway capital construction.
New York has a large number of fluent Spanish speakers. It should have no problem learning what Spanish engineers know about construction costs, and the same is true for other communities that are well-represented in the cities, such as Korean-, Russian-, Chinese-, Brazilian-, and Polish-New Yorkers. Moreover, in most big cities that don’t send large communities to New York, such as those of Northern Europe, planners speak English. Johnson should not shy from using the expertise of people outside New York, ideally outside the United States, to get subway construction costs under control.
The speaker’s plan is still a very good first step. The proposed surface improvements to buses, bikes, and street allocation are all solid, and should be the city’s consensus for how to move forward. What’s needed is something to tie all of this together with a plan to move forward for what remains the city’s most important transportation network: the subway.
Frequency-Ridership Spirals
I was reticent to post about this topic; I polled it on Patreon in December and it got just under 50% while the two topics I did blog, difficult urban geography and cross-platform transfers, got 64% and 50% respectively. However, between how close the vote was and the conversation about the current state of the subway in New York, I felt obligated to explain what’s been going on. The short version is that practically the entire change in subway ridership in New York over the last generation or two has come from the off-peak, and the way American cities set their frequency guidelines off-peak amplify small changes in demand, so that a minor setback can lead to collapse and a minor boost can lead to boom.
The good news is that by setting frequency to be high even if it does not look like ridership justifies it, cities can generate a virtuous cycle on the upswing and avoid a vicious one on the downswing. However, it requires the discipline to run good service even in bad times, when bean counters and budget cutters insist on retrenchment. The Chainsaw Al school of management looks appealing in recessions or when ridership is falling, and this is precisely when people who run transit agencies must resist the urge to cut frequency to levels that lead to a positive feedback loop wrecking the system.
Ridership-frequency elasticity
The key to the frequency-ridership spiral is that cutting frequency on transit makes it less useful to passengers, since door-to-door trip times are longer and less reliable. The size of this effect can be measured as the elasticity of ridership with respect to service: if increasing service provision by 1% is demonstrated to raise ridership by e%, we say that the elasticity is e.
Fortunately, this question is fundamental enough to transit that there is extensive published literature on the subject:
- In a classical TRB paper, Armando Lago, Patrick Mayworm, and Matthew McEnroe look at data from several American cities as well as one British one, disaggregating elasticity by frequency, mode (bus or commuter rail), and period (peak or off-peak). The aggregate average value is e = 0.44 for buses and e = 0.5 for commuter rail, but when frequency is better than every 10 minutes, e = 0.22 on average.
- Todd Litman of the advocacy organization VTPI has a summary mostly about fare elasticity but also service elasticity, suggesting e is in the 0.5-0.7 range in the short term and in the 0.7-1.1 range in the long term.
- A paper by Joe Totten and David Levinson includes its own lit review of several studies, including the two above, finding a range of 0.3 to 1.1 across a number of papers, with the lower figures associated with urban service and the higher ones with low-frequency suburban service. The paper’s own research, focusing on transit in Minneapolis, finds that on weekdays, e = 0.39.
One factor that I have unfortunately not seen in the papers I have read is trip length. Frequency is more important for short trips than long ones. This is significant, since when the headway is shorter relative to in-vehicle trip time we should expect lower elasticity with respect to the headway. Waiting 10 minutes rather than 5 minutes for an hour-long trip is not much of an imposition; waiting 30 minutes rather than 15 for the same trip is a greater imposition, as is waiting 10 minutes rather than 5 for a 20-minute trip.
In New York, the average unlinked subway trip is 13.5 minutes long, so the difference between 10 and 5 minutes is very large. Lago-Mayworm-McEnroe cite research saying passengers’ disutility for out-of-vehicle time is 2-3 times as large as for in-vehicle time; the MTA’s own ridership screen states that this penalty is 1.75, the MBTA’s states that it is 2.25, and a study by Coen Teulings, Ioulina Ossokina, and Henri de Groot says that it is 2 in the Netherlands. Figuring that this penalty is 2, the worst-case scenario for off-peak weekday wait time in New York, 10 minutes, has passengers spending more perceived time waiting for the train than riding it, and even in the average case, 10/2 = 5 minutes, it is close. In that case, higher values of e are defensible. Lago-Mayworm-McEnroe have less data about in-vehicle time elasticity and do not attempt to aggregate in- and out-of-vehicle time. But adding everything together is consistent with e = 0.8 relative to speed averaged over the total wait and in-vehicle time, and then e is maybe 0.4 relative to frequency.
The impact of service cuts
If the elasticity of ridership relative to frequency is 0.4, then cutting service by 1% means cutting ridership by 0.4%. If half the operating costs are covered by fares, then revenue drops by 0.2% of total operating expenses, so the 1% cut only saves 0.8% of the total subsidy. Achieving a 1% cut in operating costs net of fare revenue thus requires a 1.25% cut in service, which reduces ridership by 0.5%.
This may not sound too bad, but that’s because the above analysis does not incorporate fixed costs. Rail comes equipped with fixed costs for maintenance, station staffing, rolling stock, and administration, regardless of how much service the agency runs. Lisa Schweitzer uses this fact to defend Los Angeles’s MTA from my charge of high operating costs: she notes that Los Angeles runs much less service than my comparison cases in the US and Europe and thus average cost per train-km is higher even without undue inefficiency. In contrast, bus costs are dominated by driver wages, which are not fixed.
New York does not keep a headcount of transit employees in a searchable format – the Manhattan Institute’s See Through New York applet helps somewhat but is designed around shaming workers who make a lot of money through overtime rather than around figuring out how many people work (say) maintenance. But Chicago does, and we can use its numbers to estimate the fixed and variable costs of running the L.
The CTA has somewhat more than 10,000 workers, split fairly evenly between bus and rail. The rail workers include about 800 working for the director of maintenance, working on the rolling stock, which needs regular servicing and inspections regardless of how often it’s run; 550 working for facilities maintenance; (say) 400 out of 800 workers in administrative capacity like communications, general counsel, purchasing, and the chief engineer’s office; 600 workers in power and way maintenance; nearly 1,000 customer service agents; and 450 workers in flagging, switching, and the control towers. Only 500 workers drive trains, called rapid transit operators or extra board, and there may charitably be another 200 clerks, managers, and work train operators whose jobs can be cut if there is a service cut. A service cut would only affect 15% of the workers, maybe 20% if some rolling stock maintenance work can be cut.
In New York the corresponding percentage is somewhat higher than 15% since trains have conductors. Train operators and conductors together are about 13% of the NYCT headcount, so maybe 20% of subway employees, or 25% with some extra avoidable maintenance work.
What this means is that achieving a 2% cut in subsidy through reducing service requires a service cut of much more than 2%. If only 25% of workers are affected then, even without any frequency-ridership elasticity, the agency needs to cut service by 8% to cut operating costs by 2%.
The Uber effect
The combination of elasticity and fixed costs means that rail ridership responds wildly to small shocks to ridership. For a start, if the agency cuts service by 1%, then operating costs fall by 0.25%. Ridership falls by 0.4%, and thus revenue also falls by 0.4%, which is 0.2% of total operating costs. Thus operating costs net of revenue only fall by 0.05%. The only saving grace is that this is 0.05% of total operating costs; since by assumption fare revenue covers half of operating costs, this saves a full 0.1% of the public subsidy.
Read the above paragraph again: taking fixed costs and elasticity into account, cutting service by 1% only reduces the public subsidy to rail service by 0.1%. A 2% cut in subsidy in a recession requires a brutal 20% cut in service, cutting ridership by 8%. And this only works because New York overstaffs its trains by a factor of 2, so that it’s plausible that 25% of employees can be furloughed in a service cut; using Chicago numbers this proportion is at most 20%, in which case revenue falls one-to-one with operating costs and there is no way to reduce the public subsidy to rail operations through service cuts.
Of course, this has a positive side: a large increase in service only requires a modest increase in the public subsidy. Moreover, if trains have the operating costs of Chicago, which are near the low end in the developed world, then the combined impact of fixed costs and elasticity is such that the public subsidy to rapid transit does not depend on frequency, and thus the agency could costlessly increase service.
This is relevant to the Uber effect – namely, the research arguing that the introduction of ride-hailing apps, i.e. Uber and Lyft, reduces transit ridership. I was skeptical of Bruce Schaller’s study to that effect since it came out two years ago, since the observed reduction in transit ridership in New York in 2016 was a large multiple of the increase in total taxi and ride-hailing traffic once one concentrated on the off-peak and weekends, when the latter rose the most.
But if small shocks to ridership are magnified by the frequency-ridership spiral, then the discrepancy is accounted for. If a shock cuts ridership by 1%, which could be slower trains, service disruptions due to maintenance, or the Uber effect, then revenue falls 1% and the subsidy has to rise 1% to compensate. To cover the subsidy through service cuts requires a 10% cut in service, further cutting ridership by 4%.
Off-peak service guidelines
The above analysis is sobering enough. However, it assumes that service cuts and increases are uniformly distributed throughout the day. This is not the actual case for American transit agency practice, which is to concentrate both cuts and increases in the off-peak.
Unfortunately, cuts in off-peak service rather than at rush hour do not touch semi-fixed labor costs. The number of employees required to run service is governed by the peak, so running a lot of peak service without off-peak service leads to awkward shift scheduling and poor crew utilization. Higher ratios of peak to base frequency correlate with lower total service-hours per train driver: in addition to the examples I cite in a post from 2016, I have data for Berlin, where the U-Bahn’s peak-to-base ratio is close to 1, and there are 829 annual service-hours per driver.
I discussed the fact that the marginal cost of adding peak service is several times that of adding off-peak service in a post from last year. However, even if we take rolling stock acquisition as a given, perhaps funded by a separate capital plan, marginal crew costs are noticeably higher at the peak than off-peak.
In New York, the rule is that off-peak subway frequency is set so that at the most crowded point of each route, the average train will be filled to 125% seated capacity; before the round of service cuts in 2010 this was set at 100%, so the service cut amounted to reducing frequency by 20%. The only backstop to a vicious cycle is that the minimum frequency on weekdays is set at 10 minutes; on weekends I have heard both 10 and 12 minutes as the minimum, and late at night there is a uniform 20-minute frequency regardless of crowding.
Peak frequency is governed by peak crowding levels as well, but much higher crowding than 125% is permitted. However, the busiest lines are more crowded than the guidelines and run as frequently as there is capacity for more trains, so there is no feedback loop there between ridership and service.
The saving grace is that revenue is less sensitive to off-peak ridership, since passengers who get monthly passes for their rush hour trips ride for free off-peak. However, this factor requires there to be substantial enough season pass discounts so that even rush hour-only riders would use them. Berlin, where U-Bahn tickets cost €2.25 apiece in bundles of 4 and monthly passes cost €81, is such a city: 18 roundtrips per month are enough to justify a monthly. New York is not: with a pay-per-ride bonus a single ride costs $2.62 whereas a 30-day pass costs $121, so 23.1 roundtrips per month are required, so the breakeven point requires a roundtrip every weekday and every other weekend.
New York subway ridership evolution
The subway’s crisis in the 1970s reduced ridership to less than 1 billion, a level not seen since 1918. This was on the heels of a steady reduction in ridership over the 1950s and 60s, caused by suburbanization. In 1991, ridership was down to 930 million, but the subsequent increase in reliability and fall in crime led to a 24-year rally to a peak of 1,760 million in 2015.
Throughout this period, there was no increase in peak crowding. On the contrary. Look at the 1989 Hub Bound Report: total subway ridership entering Manhattan south of 60th Street between 7 and 10 am averaged about 1 million, down from 1.1 million in 1971 – and per the 2016 report, the 2015 peak was only 922,000. Between 1989 and 2015, NYCT actually opened a new route into Manhattan, connecting the 63rd Street Tunnel to the Queens Boulevard Line; moreover, a preexisting route, the Manhattan Bridge, had been reduced from four tracks to two in 1986 and went back to four tracks in 2004.
Nor was there much of an increase in mode share. The metropolitan statistical area’s transit mode share for work trips rose from 27% in 2000 to 30% in 2010. In the city proper it rose from 52% in 1990 to 57% in 2016. No: more than 100% of the increase in New York subway ridership between 1991 and 2015 was outside the peak commute hours, and nearly 100% of it involved non-work trips. These trips are especially affected by the frequency-ridership spiral, since frequency is lower then, and thus a mild positive shock coming from better maintenance, a lower crime rate, and perhaps other factors translated to a doubling in total ridership, and a tripling of off-peak ridership. Conversely, today, a very small negative shock is magnified to a minor crisis, even if ridership remains well above the levels of the 1990s.
The way out
Managers like peak trains. Peak trains are full, so there’s no perception of wasting service on people who don’t use it. Managers also like peak trains because they themselves are likelier to ride them: they work normal business hours, and are rich enough to afford cars. That current NYCT head Andy Byford does not own a car and uses the city’s transit network to get around scandalizes some of the longstanding senior managers, who don’t use their own system. Thus, the instinct of the typical manager is to save money by pinching pennies on off-peak service.
In contrast, the best practice is to run more service where possible. In Berlin, nearly all U-Bahn trains run every 5 minutes flat; a few lines get 4-minute peak service, and a few outer ends and branches only get half-service, a train every 10 minutes. At such high frequency, the frequency-ridership spiral is less relevant: an increase to a train every 4 minutes would require increasing service by 25%, raising costs by around 5% (Berlin’s one-person crews are comparable to Chicago’s, not New York’s), but not result in a significant increase in ridership as the shorter headway is such a minute proportion of total travel time. However, New York’s 10-minute off-peak frequency is so low that there is room to significantly increase ridership purely by running more service.
In 2015 I criticized the frequency guidelines in New York on the grounds of branching: a complexly branched system must run interlined services at the same frequency, even if one branch of a trunk line is somewhat busier than the other. However, the frequency-ridership spiral adds another reason to discard the current frequency guidelines. All branches in New York should run at worst every 6 minutes during the daytime, yielding 3-minute frequency on most trunks, and the schedules should be designed to avoid conflicts at junctions; non-branching trunk lines, that is the 1, 6, 7, and L trains, should run more frequently, ideally no more than every 4 minutes, the lower figure than in Berlin following from the fact that the 1 and 6 trains are both local and mostly serve short trips.
Moreover, the frequency should be fixed by a repeating schedule, which should be clockface at least on the A train, where the outer branches would only get 12-minute frequency. If ridership increases by a little, trains should be a little more crowded, and if it decreases by a little, they should be a little less crowded. Some revision of schedules based on demand may be warranted but only in the long run, never in the short run. Ideally the system should aim at 5-minute frequency on every route, but as the N, R, and W share tracks, this would require some deinterlining in order to move more service to Second Avenue.
This increase in frequency is not possible if politicians and senior managers respond to every problem by cutting service while dragging their feet about increasing service when ridership increases. It requires proactive leadership, interested in increasing public transit usage rather than in avoiding scandal. But the actual monetary expense required for such frequency is not large, since large increases in frequency, especially in the off-peak, mostly pay for themselves through extra ridership. The initial outlay required to turn the vicious cycle into a virtuous one is not large; all that is required is interest from the people in charge of American transit systems.
The British Way of Building Rapid Transit
By a more than 2-1 vote among my Patreon backers, the third installment in my series about national traditions of building urban rail is the British one, following the American and Soviet ones. While rapid transit in Britain outside London is even smaller than in the US outside New York, the British tradition is influential globally for two reasons: first, Britain invented the railway as well as urban rapid transit, and second, Britain had a vast empire much of which still looks up to it as a cultural and scientific metropole.
Nonetheless, despite the fact that all rapid transit traditions technically descend from London’s, it is worthwhile talking about the British way. What London built inspired and continues to inspire other cities, but many, mainly in the United States, Japan, and Continental Europe, diverged early, forming distinct tradition. As I noted in the post about the Soviet bloc, Moscow was heavily influenced by British engineering, and its own tradition has evolved separately but began as a more orderly way of reproducing the London Underground’s structure in the 1930s.
In taxonomy, this is called a paraphyletic group. Monophyly means a taxon descending from a single ancestor, for example mammals; paraphyly means a taxon descending from a single ancestor excluding certain monophyletic subgroups, for example reptiles, which exclude mammals and birds, both of which descend from the same common ancestor.
The invention of rapid transit
Like most other things Britain became known for, like constitutional government and colonialism, rapid transit evolved gradually in London. Technically, the first railway in London, 1836’s London and Greenwich, meets the definition of urban rapid transit, as trains made some local stops, ran every 20 minutes, and were grade-separated, running on brick arches. However, it is at best an ancestor of what we think of as rapid transit, since it lacked the really frequent stops of the Underground or the New York els.
The first proper rapid transit line in London, the Metropolitan line, opened in 1863. It, too, lacked some features that are standard on nearly all rapid transit systems today: most importantly, it was not self-contained, but rather had some through-service with intercity rail, and was even built dual-gauge to allow through-service with the Great Western Railway, which at the time had broad gauge. Trains ran every 10 minutes, using steam locomotives; to limit the extent of smoke in the tunnels, the line was not fully underground but had a long trench between King’s Cross and Farringdon.
The Met line and the second Underground line, 1868’s District line, were both built cut-and-cover. However, whereas Met line construction went smoothly, the District line had to carve a right-of-way, as the city did not have adequate wide streets for serving the proposed route. The areas served, Kensington and Chelsea, were even then a tony neighborhood with expensive real estate, and the construction costs exploded due to land acquisition. In today’s terms the Met line cost about $32 million per kilometer and the District $90 million, a record that among the historical lines I know of remained unbroken until New York built the Independent Subway System in the 1930s.
The Met and District met to form a circle, and in general, London loved building circular lines. In addition to what would be called the Circle line until a revision last decade, there were two circles farther out, called the Middle Circle and Outer Circle. These were run by mainline railroads; there was still no legal distinction between the two urban railroads and the mainlines, and through-service and even some freight service continued on the Met well into the 20th century, which the company used as an excuse to delay its merger with the other Underground companies.
Even electric rapid transit took time to take shape. After the bad experience with the District line, there was no more cut-and-cover in Central London. The next line to open, 1890’s Northern line, required the invention of deep boring and electric traction; it was not the first rail line to use electricity, but was the first excluding streetcars. However, while the line looked like a normal self-contained rapid transit line, it was pulled by electric locomotives; electric multiple units only came a few years later, starting haphazardly in Liverpool in 1893 (each car required separate controls) and in the more conventional way on the Chicago L in 1897.
Spontaneous order and radial network design
Among the inventions that came out of London was the radial network design. Unlike the physical inventions like underground rail and electric traction, this was not a deliberate choice. It evolved through spontaneous order, owing to the privately-funded nature of British railways. A British railway had to obtain the approval of Parliament to begin construction, which approval would also permit compulsory purchase of land along the way, but funding was entirely private. An early proposal for an underground railway, an 1860s route running what would later become the Charing Cross branch of the Northern line, was approved but could not secure funding and thus was not built.
The upshot is that with private planning, only the strongest lines were built. The strongest travel demand was to the center of London, and thus the lines were all radial, serving either the City of London or the West End. There was no circumferential service. While there were many circles and loops, these were conceived as reverse-branches allowing some railroads to access multiple Central London terminals, or as ways to join two radials like the Met and District without having to go through the difficult process of turning a train underground in a world in which all trains had to be pulled by locomotives.
The same preponderance of radial lines can be seen in other privately-planned contexts. Today, the best-known example is the matatu network of Nairobi. It is informal transit, but has been painstakingly mapped by urbanists, and the network is entirely radial, with all lines serving city center, where the jobs requiring commuting are.
Despite the private planning, London has only a handful of missed connections between lines: it has eight, but only one, between the Met line and the Charing Cross branch of the Northern line, is a true miss between two lines – the other seven are between parallel outer branches or between two lines that intersect a few times in close succession but only have one transfer (namely, the Bakerloo and Met). This is not because private planners build connections spontaneously – Parliament occasionally demanded some minor route changes, including interchange stations at intersections.
The role of regional rail
Like rapid transit, regional rail evolved in London in a haphazard fashion. The London and Greenwich was a mainline railway and the Met line had some mainline through-service, and even the deep-level tube lines are compatible enough with mainline rail that there is some track-sharing, namely between the Bakerloo line and the Watford DC line. The trench between King’s Cross and Farringon was widened to four tracks and turned into a north-south through-route in the 1870s but then abandoned in the 1920s and only reactivated in the 1980s as Thameslink.
The upshot is that London ended with the bones of a regional rail network but no actual service. The ideal was self-contained Underground lines, so even when connections suggested themselves they were not pursued. For example, the original proposal for an underground line between Euston and Charing Cross involved some through-service to the railways at both ends, but when the line was finally built as the Charing Cross branch of the Northern line it was not connected to the mainline and only took over minor branches in suburban North London.
While British planners did eventually plan for through-service – plans for Crossrail date to World War Two or just afterward – by then London was not innovating but rather imitating. By the war, Berlin had already had two S-Bahn through-lines, Munich was planning one, and Tokyo had three. The modern design for Crossrail is best compared with the RER A, in a city London has treated as its primary competitor for a long time now.
Exporting London’s network design
Moscow was heavily influenced by London early on. Later on, Singapore and Hong Kong both drew on British engineering expertise. London’s status as the first city to build rapid transit may have influenced Moscow, but by the 1920s New York had surpassed it in city size as well as urban rail ridership. Moscow’s drawing on London was as I understand it accidental – the chief engineer happened to have London connections – but in Singapore, Hong Kong, Australia, and so on the relationship is colonial, with extensive cultural cringe.
In all of these non-British cities, the British design as exported was cleaner. What I mean is, the systems have a radial structure like London, but the radii are cleaner in that two lines will generally cross just once, especially in Moscow; it’s not like London, where the Central line is always north of the District line, meeting once in a tangent at Bank and Monument, or where the Victoria line and Northern line cross twice.
Another cleaner aspect is the transfer experience. Singapore and Hong Kong both make extensive use of cross-platform transfers between otherwise perpendicular lines; London only does sporadically, on the Victoria line.
A third aspect is uniformly wide interstations. London’s average interstation is about 1.25 km, which is what I think of as the standard because it is very close to the average in Tokyo and Mexico City as well, and at the time I started tracking this statistic in the late 2000s, the Chinese systems were still small. Moscow’s average is 1.7 km, and Singapore’s is similar. Hong Kong is actually divergent there: the MTR mixes core urban lines averaging about the same as in London with the more widely-spaced historically mainline East and West Rail lines and the airport express.
The relative paucity of circumferential rail is hard to judge in the export cases. Moscow came up with the idea for the Circle Line natively; there is an urban legend that it was accidentally invented by Stalin when he left a coffee cup on the map and it stained it in the shape of a circle. Hong Kong doesn’t have much circumferential rail, but its geography is uniquely bad for such service, even more so than New York’s. Singapore does have a Circle Line, but it’s one of the two worst-designed parts of the MRT, with a reverse-branch (the other one is the self-intersecting, connection-missing Downtown Line).
At the same time, it’s worth viewing which aspects British-influenced systems are getting rid of when designing cleaner version of the Underground. The most important is regional rail. Singapore has none: it has a legacy narrow-gauge rail line to Malaysia, but has never made an effort to take control of it and develop it as an urban regional rail line.
Another negative aspect exported by London is the preponderance of deep boring. I made the same complaint when discussing the Soviet bloc: while London is poor in wide arterials that a cut-and-cover subway could go underneath, Moscow is rich in them, and the same is true of Singapore.
Does this work?
London invented rapid transit as we know it, but it did so gradually and with many seams. In some sense, asking if this works is like asking if rapid transit as a technology works, for which the answer is that it is a resounding success. But when it comes to the details, it’s often the case that London has accidental successes as well as accidental mistakes.
In particular, the fact that London almost invented regional rail is a source of endless frustration and extensive retro-crayon. The Met line is almost a 19th-century Crossrail, the Widened Lines are almost a 19th-century Thameslink, and so on. Instead, as time went on the trend has been toward more self-contained lines, which is good for reliability but not when there are self-contained slow tracks of mainlines to hook into, as is planned for Crossrail and as has sporadically been the case for the Watford DC line.
The British focus on radial systems has generally been good. To the extent London has underused metro lines, it’s not because they are poorly-routed as some of the lines in Paris are, but because they serve areas that have many urban rail lines and not a lot of population density; London is not a dense city, going back to the Victorian era, when it standardized on the rowhouse as the respectable urban housing form rather than the mid-rise apartment of Continental Europe or New York.
To the credit of British-influenced planning, Singapore has managed to fit a circumferential line into its system with good connections, just with an awkward reverse-branch. London’s own circumferential transit, that is the Overground, misses a large number of Underground connections due to its separate origin in freight bypasses and mainline rail reverse-branches, where Parliament saw no point in requiring interchange stations the way it did on the Tube. However, the cleaner version seen in Singapore only misses connections involving the Downtown Line, not the Circle Line.
What is perhaps the worst problem with the British style of design is the construction cost. The Northern line was not expensive – in today’s terms it cost around $35 million per km, give or take. However, after WW2 a gap opened between the cost of cut-and-cover and bored metros. The Milan method for cut-and-cover built a subway for around $45 million per km a few years before London bored the Victoria Line for $110 million. Britain exported its more expensive method, which must be treated as one factor behind high construction costs in Singapore, Hong Kong, Australia, and New Zealand; in New Zealand the regional rail tunnel is expensive even as electrifying the system was not.
In the future, cities that wish to build urban rail would be wise to learn from the network design pioneered by London. Urban rail should serve city centers, with transfers – and as in the subsequent refinements of cities that adapted London’s methods to their own needs, there should be some circumferential transit as well. But if mainlines are available, it would be wise to use them and run trains through on the local tracks where available. Moreover, it would be unwise to conduct deep boring under wide streets; elevated or cut-and-cover construction is well-suited for such avenues, causing some street disruption but producing considerable less expensive lines.
Where Line 2 Should Go Depends on Where Line 1 Goes
A city that is building a rapid transit network piecemeal has to decide on priorities. There are tools for deciding where to build the first line, such as looking at the surface transit network and seeing what the busiest corridor is. These are relatively well-understood. In this post I’d like to focus on where to build the second line, because that question depends not only on the usual factors for where to build transit, but also on how the first line is expected to change the network. This is relevant not only to cities that are building a new rapid transit system, but also to cities that have such a network and are adding new lines one at a time: the usual tools can straightforwardly suggest where to build one line, but figuring out where to build a second line requires some additional work.
A toy model
Consider the following city, with its five busiest buses, labeled A-E from busiest to fifth busiest:

Let’s stipulate that there’s a wealth of arterial roads radiating in the right directions, and no motorways entering city center, so the exceptions to the rule that trains should go where the busiest buses are don’t apply. Let’s also stipulate that the other buses in the city don’t affect the internal ranking of the first five much – so if there are a bunch of north-south buses close to route C not depicted on the map, they’re not busy enough to make it busier than route A.
Clearly, based on the A > B > C > D > E ranking, the top priority for a first rapid transit line is A. Not only is it the busiest bus but also it is parallel to the second busiest.
But the second priority is not B, but C. The reason is that a rapid transit line on A captures east-west traffic, and then from the eastern and western neighborhoods people on route B are likely to walk south or ride a circumferential bus to get to the train. In the presence of a subway underneath the arterial carrying route A, the strongest bus corridor will almost certainly become C, and thus planners should aim to build a subway there as their second line, and begin design even before the first subway opens.
Fourth Avenue in Vancouver
Vancouver already has a rapid transit system, with three SkyTrain lines. However, the issue of the second line crops up when looking at remaining bus corridors and future subway plans. The strongest bus route is by far Broadway, which had higher ridership than the buses that became the Millennium and Canada Lines even when those lines were planned. The Millennium Line was only built first because it was easier, as it is elevated through the suburbs, and the Canada Line because Richmond demanded a SkyTrain connection.
Fortunately, Broadway is finally getting a subway, running from the Millennium Line’s current terminus at VCC-Clark to Arbutus, halfway toward the corridor’s natural end at UBC. The question is, what next? The second busiest bus corridor in Vancouver is Fourth Avenue, where the combined ridership of the 4, 44, and 84 buses and the part of the 7 that is on Fourth exceeds that of any corridor except Broadway; only Hastings, hosting the 95 and 160, comes close.
And yet, it is obviously wrong to plan any subway on Fourth Avenue. Fourth is half a kilometer away from Broadway; the 44 and 84 are relief for the 99 on Broadway. TransLink understands it and therefore there are no plans to do anything on Fourth – the next priority is extending the Expo Line farther out into Surrey or Langley, with the exact route to be determined based on political considerations.
Regional rail and subways in New York
In New York, two commonly-proposed subway extensions, down Nostrand and Utica, are closely parallel. The fact that they are so close to each other means that if one is built, the case for the other weakens. But these two corridors are so strong it is likely that if one is built, the second remains a very high priority. The only subway priority that is plausibly lower than the first of the two and higher than the second, regardless of which of Utica and Nostrand is built first, is a 125th Street crosstown extension of Second Avenue Subway.
But a more serious example of one future line weakening another occurs for regional rail. The top priority for regional rail in New York is four-tracking the tunnels to Penn Station under the Hudson; based on this priority, organizations that look beyond the next gubernatorial or congressional election have come up with farther-reaching proposals. Here, for example, is the map from the RPA’s Fourth Regional Plan:
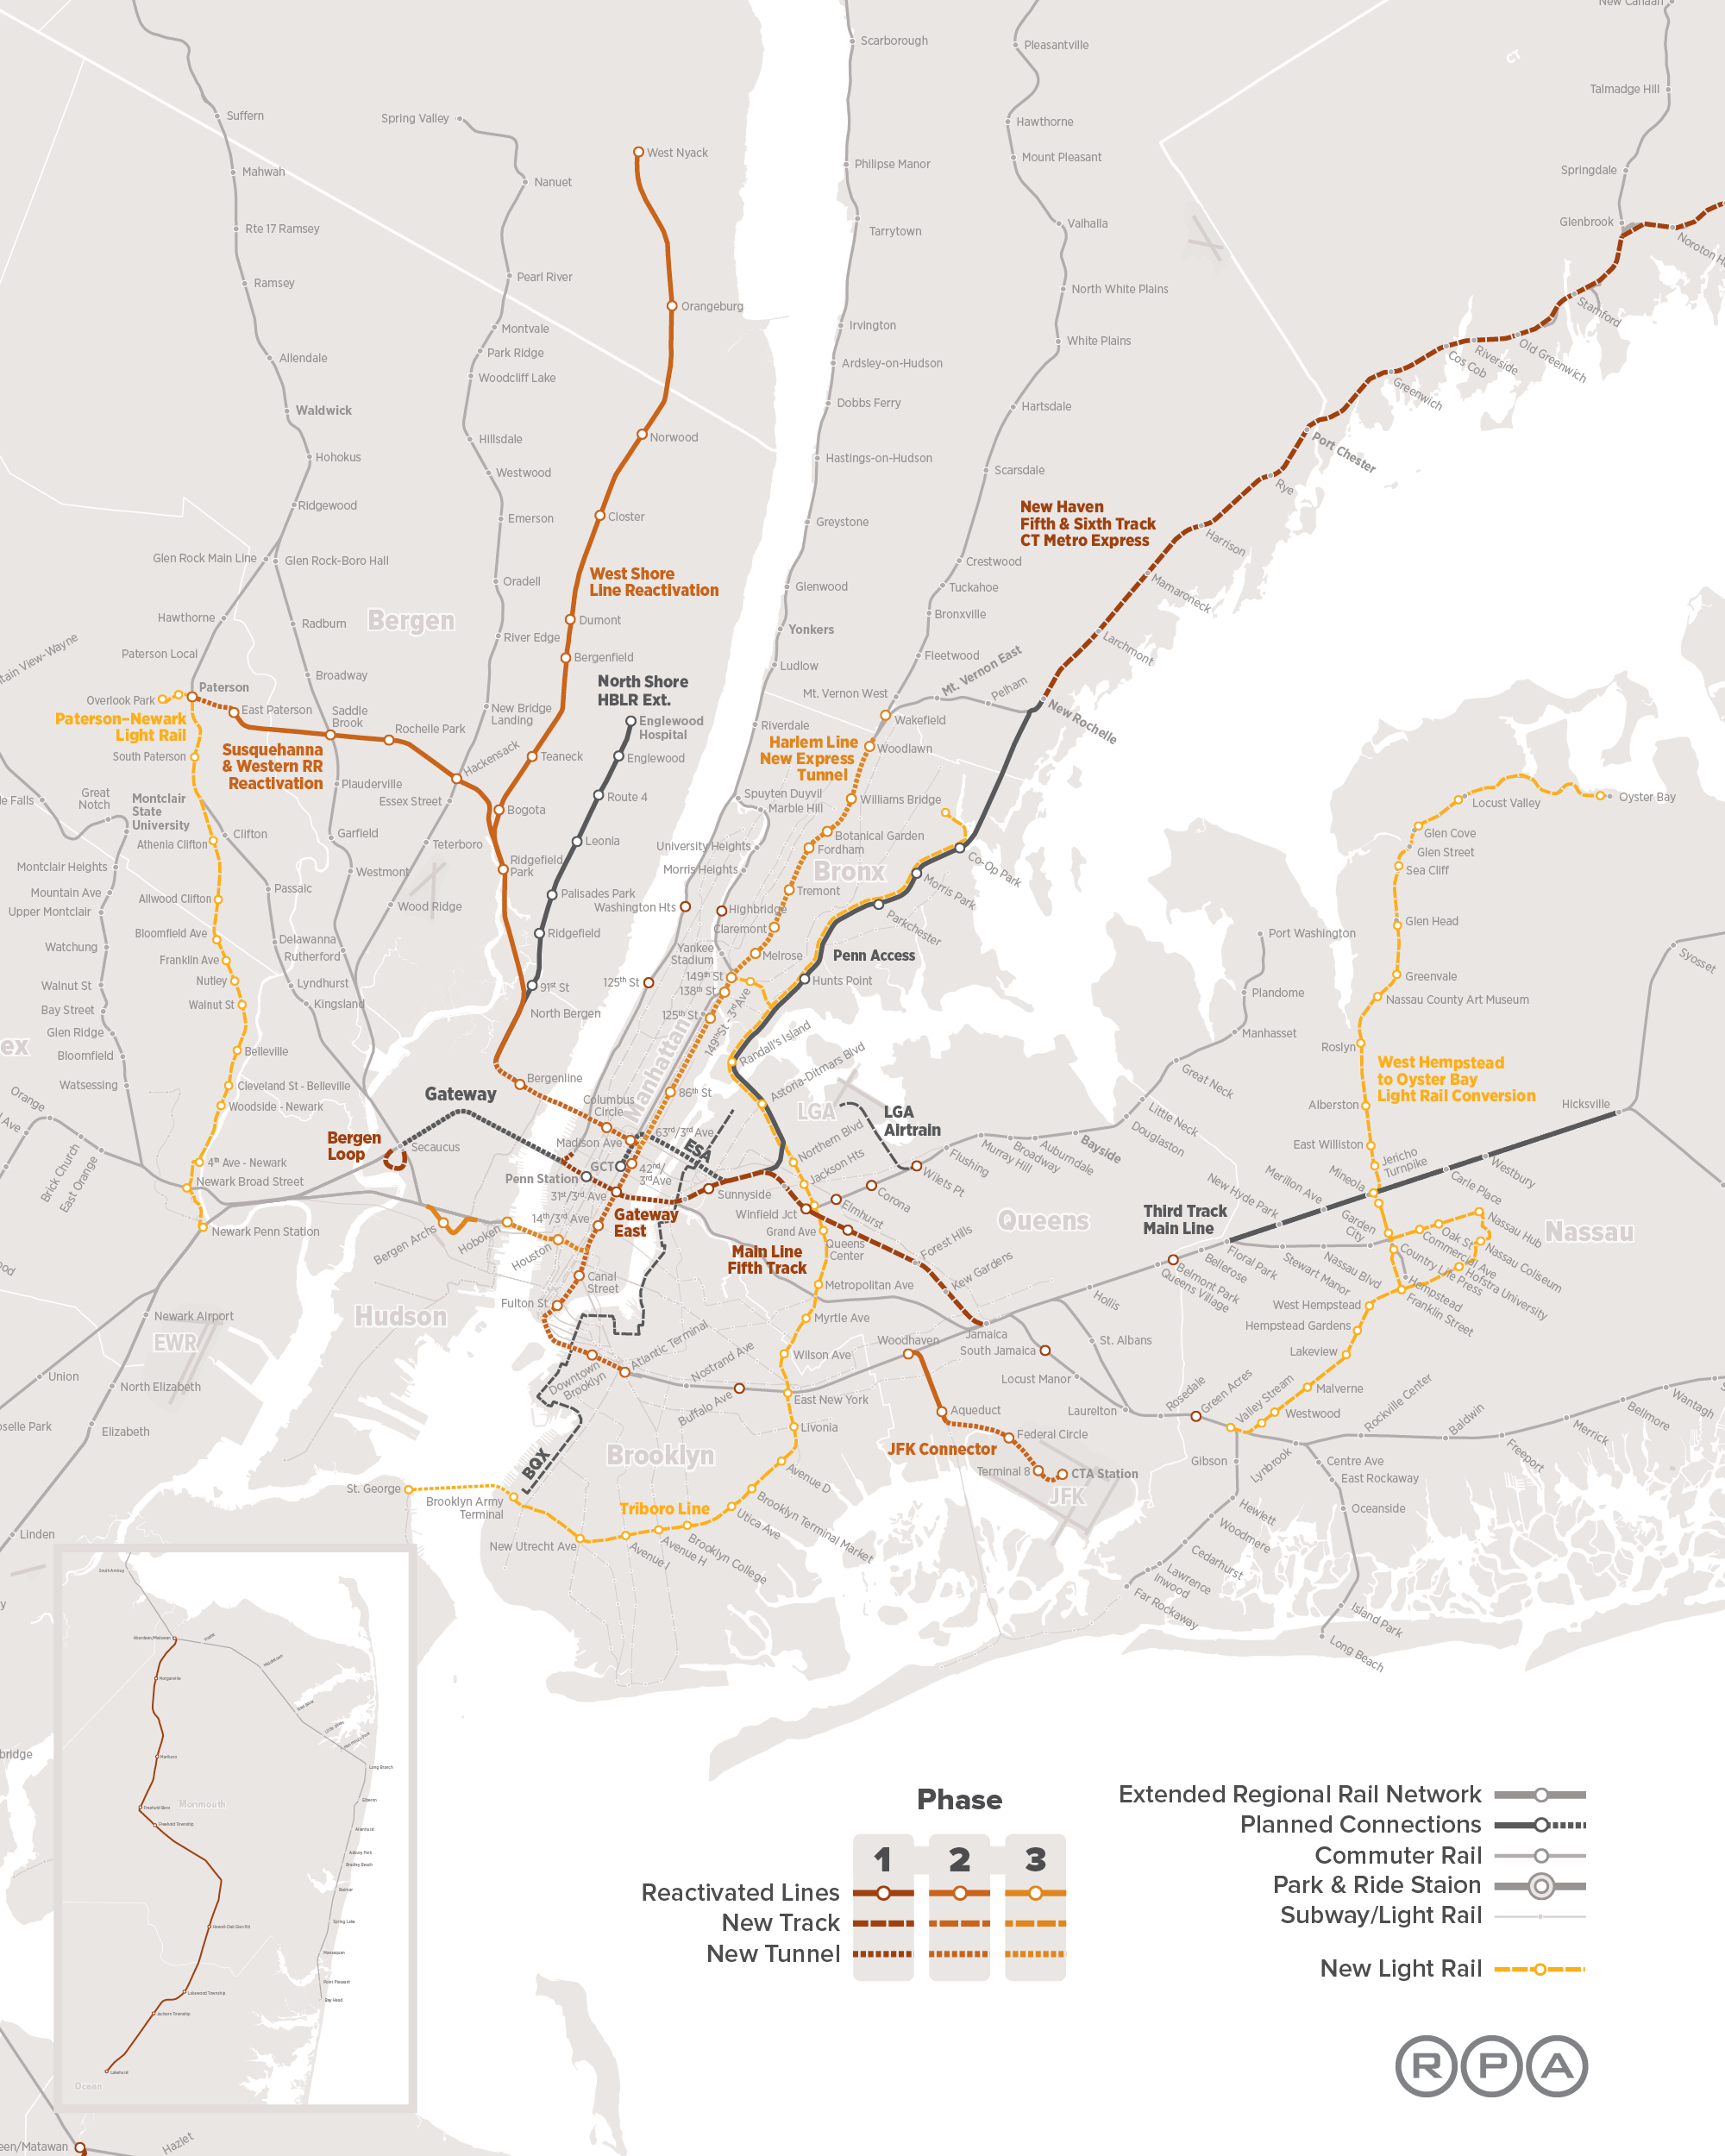
In addition to four-tracking the North River Tunnels under the aegis of the Gateway project, the RPA calls for two additional two-track tunnels under the Hudson, in phases 2 and 3 of its proposal. Both are to feed Midtown: the phase 2 tunnel is to connect regional rail lines to be reactivated with Columbus Circle, Grand Central, and other destinations in the city, and the phase 3 tunnel is to then carry the same line out of the city and back into New Jersey via Hoboken and the existing commuter lines serving southern and southwestern suburbs.
The logic, as I understand it, is that Midtown is the core of the New York region, and so it is the most important to connect there. I don’t know if this is what the RPA was thinking, but I asked at an IRUM meeting in 2010 why all plans involve connections to Midtown rather than Lower Manhattan and was told Lower Manhattan was not as important a business district.
The toy model has one fixed city center and varying outlying areas, the opposite of the situation here. Here, my criticism is of plans that serve the dominant city center while ignoring the second most important center. The total number of jobs in Midtown is 800,000 whereas Lower Manhattan has 250,000 – but Lower Manhattan is more compact, so a single station at Fulton with several exits can plausibly serve the entire area, whereas Midtown has areas that are too far from both Penn Station and Grand Central. The next pair of tracks should serve Midtown, but the pair after them should serve Lower Manhattan, to ensure good coverage to both business districts.
